a simple and low cost anti-lock braking system control
TRANSCRIPT
A Simple and Low Cost Anti-Lock Braking System Control Method Using In-Wheel Force Sensor and Wheel Angular Speed Sensor Li, C. Submitted version deposited in Coventry University’s Institutional Repository Original citation: Li, C. (2017) A Simple and Low Cost Anti-Lock Braking System Control Method Using In-Wheel Force Sensor and Wheel Angular Speed Sensor. Unpublished PhD Thesis. Coventry: Coventry University Copyright © and Moral Rights are retained by the author. A copy can be downloaded for personal non-commercial research or study, without prior permission or charge. This item cannot be reproduced or quoted extensively from without first obtaining permission in writing from the copyright holder(s). The content must not be changed in any way or sold commercially in any format or medium without the formal permission of the copyright holders. Some materials have been removed from this thesis due to third party. Pages where material has been removed are clearly marked in the electronic version. The unabridged version of the thesis can be viewed at the Lanchester Library, Coventry University.

A Simple and Low Cost Anti-Lock Braking System
Control Method Using In-Wheel Force Sensor and
Wheel Angular Speed Sensor
By
Chen Li
Doctoral Thesis
2017

A Simple and Low Cost Anti-Lock Braking System
Control Method Using In-Wheel Force Sensor and
Wheel Angular Speed Sensor
By
Chen Li
A thesis submitted in partial fulfilment of the University’s
requirements for the award of Doctor of Philosophy
12th January 2017
© by Chen Li
i
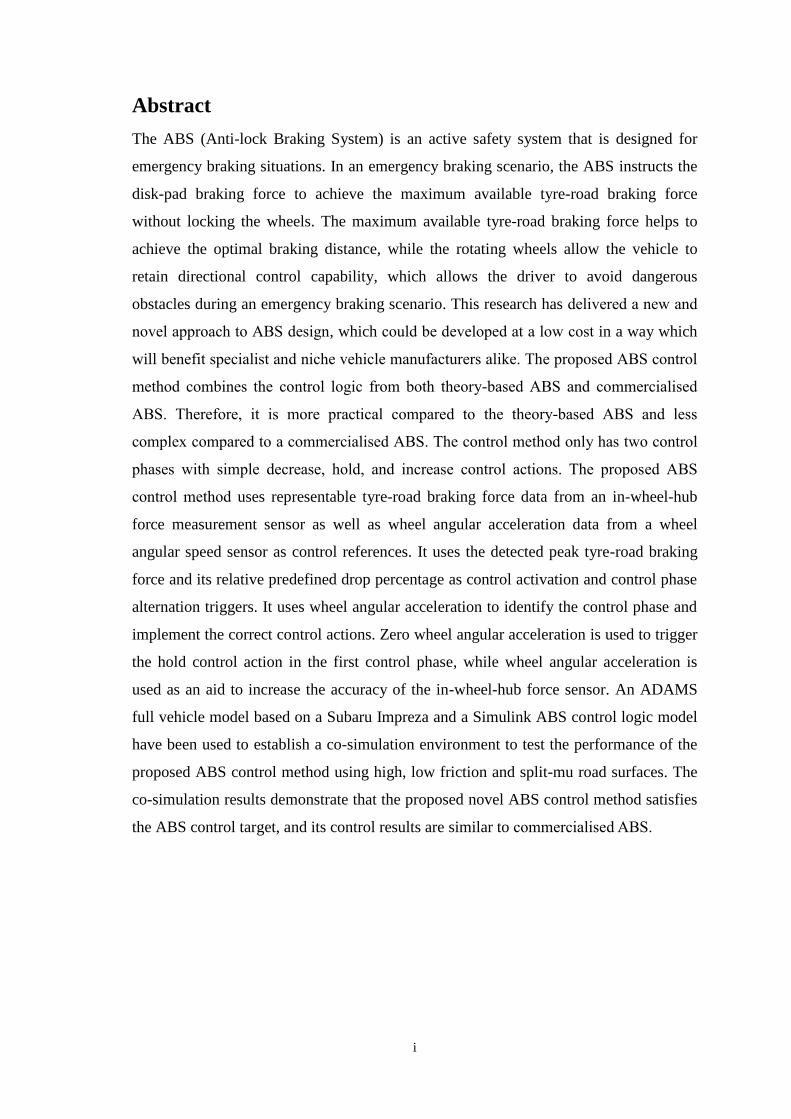
Abstract
The ABS (Anti-lock Braking System) is an active safety system that is designed for
emergency braking situations. In an emergency braking scenario, the ABS instructs the
disk-pad braking force to achieve the maximum available tyre-road braking force
without locking the wheels. The maximum available tyre-road braking force helps to
achieve the optimal braking distance, while the rotating wheels allow the vehicle to
retain directional control capability, which allows the driver to avoid dangerous
obstacles during an emergency braking scenario. This research has delivered a new and
novel approach to ABS design, which could be developed at a low cost in a way which
will benefit specialist and niche vehicle manufacturers alike. The proposed ABS control
method combines the control logic from both theory-based ABS and commercialised
ABS. Therefore, it is more practical compared to the theory-based ABS and less
complex compared to a commercialised ABS. The control method only has two control
phases with simple decrease, hold, and increase control actions. The proposed ABS
control method uses representable tyre-road braking force data from an in-wheel-hub
force measurement sensor as well as wheel angular acceleration data from a wheel
angular speed sensor as control references. It uses the detected peak tyre-road braking
force and its relative predefined drop percentage as control activation and control phase
alternation triggers. It uses wheel angular acceleration to identify the control phase and
implement the correct control actions. Zero wheel angular acceleration is used to trigger
the hold control action in the first control phase, while wheel angular acceleration is
used as an aid to increase the accuracy of the in-wheel-hub force sensor. An ADAMS
full vehicle model based on a Subaru Impreza and a Simulink ABS control logic model
have been used to establish a co-simulation environment to test the performance of the
proposed ABS control method using high, low friction and split-mu road surfaces. The
co-simulation results demonstrate that the proposed novel ABS control method satisfies
the ABS control target, and its control results are similar to commercialised ABS.

ii
Acknowledgements
First of all, I would like to express my very great appreciation to Professor Mike
Blundell for his valuable and constructive guidance during this research work. I would
like to thank Dr. Gary Wood and Dr. Yuri Vershinin for their great support. I would like
to thank Professor Keith Burnham, Professor Peter White, and Mr Bill Dunn for their
valuable advices on this research work.
I would also like to thank my parents. They are always supporting and encouraging me
with their best wishes.
Finally, I would like to thank my wife Zhu Lin. She is always there cheering me up and
stand by me through the good times and bad.

iii
Contents Abstract ........................................................................................................................... i
Acknowledgements ........................................................................................................ ii
Contents ........................................................................................................................ iii
List of Figures ............................................................................................................. viii
List of Tables ................................................................................................................. x
Notation ........................................................................................................................ xii
1. Introduction ............................................................................................................ 1
1.1. Background ......................................................................................................... 1
1.2. Structure of thesis ................................................................................................... 1
1.3. Aims & Objectives ................................................................................................. 2
2. Literature Review ....................................................................................................... 3
2.1. ABS (Anti-lock Braking System) Overview.......................................................... 3
2.2. ABS theory ............................................................................................................. 6
2.2.1. Longitudinal slip ratio ..................................................................................... 6
2.2.2. Longitudinal tyre braking force ....................................................................... 7
2.2.3. Road surface friction coefficient ..................................................................... 8
2.3. ABS control methods ............................................................................................. 9
2.3.1. Slip ratio control method ................................................................................. 9
2.3.1.1. Slip ratio control related longitudinal wheel velocity and tyre-road friction
coefficient estimation and measurement method................................................................11
2.3.1.2. Slip ratio control related effective rolling radius measurement or
estimation……………………………………………………………………………………….....13
2.3.2. Wheel angular acceleration based control ..................................................... 14
2.3.3. Control algorithms other than pure slip ratio or pure angular acceleration
based ........................................................................................................................ 15
2.3.3.1. Bosch ABS…………………………………………………………………………………..……..…......................15
2.3.3.2. Van der Jaght et al. proposed rules based control method………………..…..….16
2.3.3.3. Combined wheel angular acceleration and wheel longitudinal slip ratio..16
2.3.3.4. Two phase, tyre longitudinal braking force phase switch…….......................16
2.3.4. Rear wheel brake control ............................................................................... 17
2.3.5. Controller technique ...................................................................................... 18
2.4. Sensing technology .............................................................................................. 19
2.4.1. In-wheel acceleration sensor ......................................................................... 19
2.4.2. Smart wheel ................................................................................................... 20
2.4.3. Niche Force sensor ........................................................................................ 21
2.4.4. Environmental Sensors .................................................................................. 23

iv
2.4.5. Sensor fusion ................................................................................................. 25
2.4.6. Sensor data process........................................................................................ 26
2.5. ABS modelling and simulation ............................................................................ 27
2.5.1. Computer modelling and simulation ............................................................. 27
2.5.2. Vehicle model and tyre model ....................................................................... 28
2.6. Hardware in the loop (HiL) simulation ................................................................ 38
2.7. Conclusion from literature review ....................................................................... 39
3. Vehicle Modelling & Simulation Set Up ................................................................. 42
3.1. ADAMS Model Simulation ................................................................................. 42
3.1.1. The Vehicle Model ........................................................................................ 42
3.1.2. Model Validation ........................................................................................... 43
3.2. Simulation Set Up ................................................................................................ 46
3.2.1. Braking Physics ............................................................................................. 46
3.2.1.1. Disk-pad braking force physics…………………………………………………..…46
3.2.1.2. Tyre-road braking force physics…………………………………………………….47
3.2.2. Analysis Based on Basic Physics .................................................................. 49
3.2.3. Brake Manoeuvring Simulation .................................................................... 51
3.2.3.1. Braking Time………………………………………………………………………….51
3.2.3.2. Braking force………………………………………………………………………......52
3.2.3.3. Braking torque………………………………………………………………………...56
3.2.4. The Simulation Test Establishments ............................................................. 56
3.2.5. Data Analysis................................................................................................. 59
3.2.6. Simulation Data with Regards to Various Vehicle Speeds…………………61
3.3. Conclusion............................................................................................................ 62
4. Control Method Development ................................................................................. 63
4.1. Analysis of Bosch ABS control method .............................................................. 63
4.2. Analysis of WABCO ABS control method ......................................................... 72
4.3. Wheel revolute joint force measurement representable local tyre-road braking
force ............................................................................................................................. 74
4.4. Discussion and inspiration ................................................................................... 75
4.4.1. Basic control pattern ...................................................................................... 76
4.4.2. Definition of control cycle range ................................................................... 77
4.4.3. Wheel angular acceleration control reference ............................................... 78
4.4.4. A detailed explanation of the interaction between the two braking torques . 81
4.4.5. Detailed discussion of disk-pad braking torque decrease control ................. 82
4.4.6. Discussion and conclusion of overall control method ................................... 83
4.4.7. Detailed description of proposed ABS control method ................................. 84
v
4.5. Low friction surface control method .................................................................... 86
4.5.1. Estimation of road surface friction conditions .............................................. 86
4.5.2. A discussion of low friction surface ABS control method ............................ 86
4.6. A discussion of split-mu surface control .............................................................. 88
4.7. Overview of the implementation of different ABS control methods in different
braking situations ........................................................................................................ 89
4.8. Conclusion............................................................................................................ 90
5. ABS Control Logic Development & Performance Analysis ................................... 91
5.1. Control Logic model development....................................................................... 91
5.1.1. Description and discussion of overall control logic model ........................... 91
5.1.2. Peak tyre-road braking force detection.......................................................... 93
5.1.3. Control Phase alternation trigger ................................................................... 95
5.1.4. Disk-pad braking torque control .................................................................... 96
5.1.4.1. Disk-pad braking torque hold action in control phase 1………………………96
5.1.4.2. Comparison between proposed ABS and Bosch ABS, with further
discussion on Bosch ABS…………………………………………………………………….97
5.1.4.3. Disk-pad braking torque control actions model…...………………………......98
5.1.4.4. Control phase 2 triggering and disk-pad braking torque control action....101
5.1.5. Low friction coefficient surface detection ................................................... 102
5.1.6. Low friction coefficient surface control ...................................................... 104
5.1.7. Split-mu control logic .................................................................................. 106
5.1.8. Conclusion ................................................................................................... 107
6. Results Analysis ..................................................................................................... 108
6.1. High friction ABS control method results ......................................................... 108
6.1.1. Analysis of the simulation results data ........................................................ 110
6.1.1.1. Simulation 1 with control input parameter set 1……………………………..110
6.1.1.2. Simulation 2 with control input parameter set 2……………………………..112
6.1.1.3. Simulation 3 with control input parameter set 3……………………………..113
6.1.1.4. Simulation 4 with control input parameter set 4……………………………..115
6.1.1.5. Simulation 5 with control input parameter set 5……………………………..116
6.1.2. Discussion of simulation results .................................................................. 118
6.2. Low friction coefficient surface ABS control method results ........................... 119
6.3. Split-mu ABS control method results ................................................................ 126
6.4. Overall discussion .............................................................................................. 131
6.4.1. Big data and reverse engineering..............................................................................131
6.4.2. Further improvement……………………………………………………………….....131
7. Conclusions and Future Work ............................................................................... 133

vi
7.1. Conclusions ........................................................................................................ 133
7.2. Future Work ....................................................................................................... 138
References .................................................................................................................. 141
Appendix 1 – ABS Full Control Logic Model Diagram

vii
List of Figures
Figure 2.1 Generic brake system layout and Bosch ABS component ....................... 3
Figure 2.2 Solenoid valves ......................................................................................... 4
Figure 2.3 Basic ABS layout ...................................................................................... 5
Figure 2.4 Longitudinal tyre braking force to slip ratio A ......................................... 7
Figure 2.5 Longitudinal tyre braking force to slip ratio B ......................................... 8
Figure 2.6 Longitudinal and lateral coefficient of friction versus slip ratio curve .... 9
Figure 2.7 Slip ratio control interval ........................................................................ 10
Figure 2.8 Slip ratio based ABS control process block diagram ............................. 11
Figure 2.9 Bosch ABS control algorithm explanations ........................................... 15
Figure 2.10 Integrated wheel speed sensor and accelerometer ................................ 19
Figure 2.11 APOLLO/FRICTI@N project tyre forces sensor ................................. 21
Figure 2.12 Resistance and conductance to force .................................................... 22
Figure 2.13 Force sensor brake down ...................................................................... 23
Figure 2.14 In wheel sensor ..................................................................................... 23
Figure 2.15 Force to sensor output characteristic .................................................... 23
Figure 2.16 Wheel free body diagram during braking ............................................. 29
Figure 2.17 Front suspension model Figure 2.18 Rear suspension model.... 31
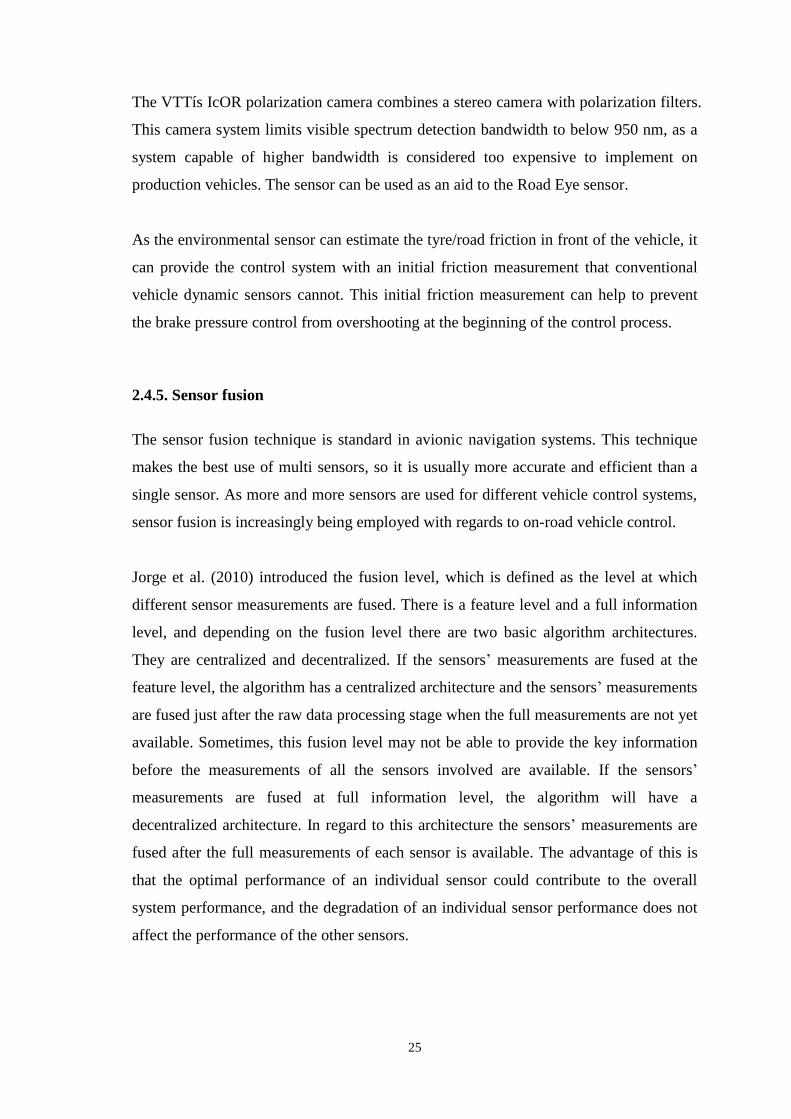
Figure 2.19 Full vehicle model ................................................................................ 32
Figure 2.20 Tyre test rig ........................................................................................... 33
Figure 2.21 Coefficients used in the Magic Formula tyre model ............................ 33
Figure 2.22 Simplified in-plane FTire model .......................................................... 36
Figure 2.23 In-plane mechanism Figure 2.24 Out-plane mechanism .................... 37
Figure 2.25 Validation of FTire model .................................................................... 37
Figure 2.26 HIL ABS test rig ................................................................................... 39
Figure 3.1 Full ADAMS vehicle model ................................................................... 43
Figure 3.2 Coventry University track test vehicle ................................................... 43
Figure 3.3 40MPH Track test data ........................................................................... 44
Figure 3.4 40MPH Simulation test data ................................................................... 44
Figure 3.5 60MPH Track test data ........................................................................... 45
Figure 3.6 60MPH Simulation test data ................................................................... 45
Figure 3.7 Brake force physics ................................................................................. 46
Figure 3.8 Wheel free body diagram during braking ............................................... 47
Figure 3.9 The two braking forces resulted torque characteristic ............................ 49

viii
Figure 3.10 Tyre-road braking force characteristics on different road surfaces ...... 49
Figure 3.11 Driver brake time .................................................................................. 51
Figure 3.12 Typical slip ratio to time curve under various speeds .......................... 52
Figure 3.13 Dry road braking distance ..................................................................... 53
Figure 3.14 Wet road braking distance .................................................................... 54
Figure 4.1 BOSCH ABS control characteristics ...................................................... 63
Figure 4.2 Disk-pad and tyre-road braking torque interaction ................................. 65
Figure 4.3 Vehicle and wheel speed characteristics under ideal ABS control ......... 67
Figure 4.4 Disk-pad braking torque control show case A ........................................ 70
Figure 4.5 Disk-pad braking torque control show case B ........................................ 70
Figure 4.6 Wabco ABS control characteristic .......................................................... 72
Figure 4.7 Tyre and revolute joint force characteristic during emergency braking . 74
Figure 4.8 Bearing deformation simulation ............................................................. 75
Figure 4.9 Control phase switch trigger ................................................................... 76
Figure 4.10 Tyre-road braking force characteristic analysis beyond optimal slip ... 78
Figure 4.11 Wheel braking force free body diagram ............................................... 81
Figure 4.12 Disk-pad braking torque control show case C ...................................... 83
Figure 4.13 Longitudinal coefficient of friction µ and lateral force versus slip ratio
curve. ................................................................................................................ 86
Figure 5.1 Main ABS control logic model ............................................................... 91
Figure 5.2 Peak tyre-road braking force detection logic model ............................... 93
Figure 5.3 Control phase switch trigger logic model ............................................... 95
Figure 5.4 Hold control action trigger for control phase 1 ...................................... 97
Figure 5.5 Angular acceleration reference determined control action……………..99
Figure 5.6 Disk-pad braking torque control action model………………………..100
Figure 5.7 Hold and decrease control in control phase 1 ....................................... 101
Figure 5.8 State flow within hold and decrease trigger in control phase 1 ............ 101
Figure 5.9 Low friction surface detection logic model .......................................... 103
Figure 5.10 Peak split point detection and related control action logic model ...... 104
Figure 5.11 Split-mu detection logic model ........................................................... 106
Figure 5.12 PID controller for high friction surface control of split Mu control logic
........................................................................................................................ 106
Figure 6.1 ABS control simulation results set 1 .................................................... 111
Figure 6.2 ABS control simulation results set 2 .................................................... 112
Figure 6.3 ABS control simulation results set 3 .................................................... 114

ix
Figure 6.4 ABS control simulation results set 4 .................................................... 115
Figure 6.5 ABS control simulation results set 5 .................................................... 117
Figure 6.6 Low friction set 1 tyre longitudinal braking force…………………….119
Figure 6.7 Low friction set 1 wheel angular deceleration …………………….….120
Figure 6.8 Low friction set 1 vehicle longitudinal speed…………………………120
Figure 6.9 Low friction set 2 tyre longitudinal braking force………………….…121
Figure 6.10 Low friction set 2 wheel angular deceleration.…...……………….…122
Figure 6.11 Low friction set 2 vehicle longitudinal speed………………………..122
Figure 6.12 Low friction set 3 tyre longitudinal braking force…………………...123
Figure 6.13 Low friction set 3 wheel angular deceleration……………….………124
Figure 6.14 Low friction set 3 vehicle longitudinal speed. .................................... 125
Figure 6.15 Split-mu tyre longitudinal braking force on low friction surface……126
Figure 6.16 Split-mu tyre longitudinal braking force on high friction surface…...126
Figure 6.17 Split-mu wheel angular deceleration on low friction surface ……….127
Figure 6.18 Split-mu wheel angular deceleration on high friction surface……….127
Figure 6.19 Split-mu vehicle longitudinal speed on low friction surface ………..128
Figure 6.20 Split-mu vehicle longitudinal speed on high friction surface………..128

x
List of Tables
Table 2.1 Quarter vehicle model parameters definitions ............................................ 30
Table 3.1 Disk-pad braking force physics related parameters .................................... 47
Table 3.2 Tyre-road braking force physics related parameters ................................... 48
Table 3.3 Tyre-road braking force characteristic under different disk-pad braking
force A ......................................................................................................................... 58
Table 3.4 Tyre-road braking force characteristic under different disk-pad braking
force B ......................................................................................................................... 59
Table 3.5 Tyre-road braking force characteristic under initial vehicle speed ............. 61
Table 6.1 Simulation parameter sets ......................................................................... 110
Table 7.1 Comparison between commercialised ABS and the proposed ABS………138

xi
Notation
Chapter 2
Vw Longitudinal wheel velocity in the tyre plane
Wω Wheel angular velocity
R Effective rolling radius of tyre
Fx Tyre longitudinal force
λ σ Tyre longitudinal slip ratio
μ Road friction coefficient
A Drop percentage after optimal slip ratio
B Drop percentage before optimal slip ratio
V The longitudinal velocity of the vehicle
It The total moment of inertia of the wheel
mt The total mass of quarter vehicle
mvs The total sprung mass of the vehicle
mw Wheel mass
Tb The braking torque
Fz The vertical force
hcg The height of vehicle gravity centre
l Wheel base
x The vehicle longitudinal travel distance
D Peak value factor of magic formula
C Shape factor of magic formula used for stretching
B Stiffness factor of magic formula
E Curvature facto of magic formula
Sv Vertical shift factor of magic formula
Sh Horizontal shift factor of magic formula
Y Tyre forces and moment representation of magic
formula
Fy Lateral force
α Slip angle
Ci Tyre longitudinal stiffness of Dugoff tyre model
Cα Tyre cornering stiffness of Dugoff tyre model
Chapter 3
Fp The force transmitted by brake piston
Fb The force between brake disk and brake pad
A The area of brake piston
n The number of brake pad
Tb The braking torque
P The brake pressure
µ The friction coefficient between brake pad and disk

xii
Fd-p Disk-pad braking force
Ft-r Tyre-road braking force
Ft Weight transfer force
Rd Disk pad to wheel center distance
Vi Vehicle initial speed
Vf Vehicle final speed
S Vehicle total travel distance
g Earth gravity
Ft-r Max Peak tyre-road braking force
T Time
Chapter 4
ω̇ref+ Desired reference wheel angular acceleration in
control phases 1
ω̇ref− Desired reference wheel angular acceleration in
control phases 2
1
1. Introduction
1.1. Background
The ABS (Anti-lock Braking System) is an active safety system that is designed for
emergency vehicle stop situations. During an emergency stop, the ABS allows the
driver to apply the optimal disk-pad braking force without locking the wheels. The
optimal disk-pad brake force helps to achieve the maximum available tyre-road braking
force, so that the optimal brake distance can be achieved. At the same time, rotating
wheels allow the vehicle to retain directional control capability so the driver can steer
away from dangerous objects during an emergency stop.
Due to consumer safety concerns and the introduction of new vehicle safety legislation,
ABS will soon be more widely adopted on vehicles, including those in the niche vehicle
sectors. At present, the most used ABS on production vehicles is supplied by Bosch.
The company charges automotive manufacturers millions of pounds for licencing and
the installation of Bosch patented ABS. For the automotive giants who manufacture
huge numbers of vehicles annually, the spread cost is affordable. But for some niche
vehicle companies which only manufacture small number of vehicles, the price is not
feasible. Accordingly, a newly patented ABS with low implementation cost would be
welcomed by not only niche vehicle companies, but also the automotive giants. The
development of a new ABS with low implementation cost which is based on new sensor
technology is the main objective of this PhD. The multibody dynamics software
ADAMS (Automotive Dynamic Analysis of Mechanical Systems) is used to develop a
dynamic full vehicle model, while MATLAB Simulink is used to develop the ABS
control logic model. ADAMS-Simulink co-simulation is used to integrate vehicle and
control logic models for the simulation of test scenarios.
1.2. Structure of thesis
This PhD thesis consists of seven chapters. Chapter 1 gives a brief introduction to anti-
lock braking systems and provides an overview of the structure of this thesis. Chapter 2

2
reviews essential ABS knowledge, as well as current developments in ABS from both
academic and industry aspects. Conclusions are drawn on the basis of these reviews in
relation to the direction of the proposed ABS research. Chapter 3 introduces the full
Subaru vehicle model used in this study and developed in ADAMS. Vehicle validation
results are then presented. Proposed ABS related experimental test results are also
presented and incorporated into the guidelines to establish the new ABS control logic.
Chapter 4 combines the analysis of commercialised ABS algorithms with the latest
academically developed ABS, along with the basic disk-pad braking force and tyre-road
braking force interaction properties to form the details of the new ABS control logic.
Chapter 5 presents the Simulink based control logic model which was developed based
on the guidelines and details established previously. Chapter 6 presents the ADAMS-
Simulink co-simulation test procedures and results, along with an analysis of the results,
are also presented. Chapter 7 provides a conclusion to the thesis in its entirety, provides
recommendations and clarifies future work.
1.3. Aims & Objectives
The aim of this research is to develop a novel low cost ABS control method and to
investigate the potential usage, intended primarily for use by the niche vehicle sector.
In order to meet this aim the following will be undertaken:
Carry out a literature review into existing ABS algorithms and implementation
strategies.
Research brake design, tyre behaviours and tyre-road friction characteristics.
Develop and validate a demonstration simulation model in ADAMS based on a
Subaru Impreza research vehicle at Coventry University.
Develop a new low-cost ABS design and control algorithm based on advanced
sensor technologies.
Carry out vehicle/ABS co-simulation to demonstrate the effectiveness of the
ABS control method, simulating a range of braking test scenarios.
Interpret the results and provide a conclusion on the potential for exploitation
and implementation.

3
2. Literature Review
2.1. ABS (Anti-lock Braking System) Overview
The commonly used ABS system consists of four individual units. The Electronic
Control Unit (ECU), the Sensor Unit (SU), the Hydraulic Unit (HU), and the
conventional brake system unit.
Figure 2.1 Generic brake system layout and Bosch ABS component (Bosch website)
As seen in Figure 2.1, the conventional brake system unit includes parts such as the
brake pedal (1), which is used as the driver input mechanism; the vacuum booster (2),
which is used to amplify the driver input by using the vacuum produced pressure
difference (the vacuum is produced by engine); and the master cylinder (3), which is
used to pressurise and route brake fluid. The pressurised brake fluid is usually split
between the front wheel brake channel and the rear wheels’ brake channel. The split
ratio is determined by the brake proportioning valve configuration. The brake fluid
reservoir (4) is used to store brake fluid, while the brake unit (5), which is either in disk-
pad configuration or in drum-shoe configuration, applies the braking force to the wheel.
The Electronic Control Unit (ECU) is a microprocessor system that implements the
ABS control algorithm and the related data process. The black part which is attached to
the Bosch ABS hardware shown in Figure 2.1 contains the ECU.
The SU may consist of different types of sensors, but the most common is the wheel
angular speed sensor which is usually an electromagnetic sensor. Other than the wheel
This item has been removed due to 3rd Party Copyright.This item has been removed due to 3rd Party Copyright. The unabridged version of the thesis
can be found in the Lanchester Library, Coventry University
This item has been removed due to 3rd Party Copyright.This item has been removed due to 3rd Party
Copyright. The unabridged version of the thesis can be found in the Lanchester Library, Coventry
University

4
angular speed sensor, the SU could also consist of vehicle accelerometer and the tyre
force sensor.
As seen in Figure 2.2, the HU mainly consists of electronically activated solenoid
valves which are used to modulate brake pressure. A low-pressure accumulator is used
to temporarily store brake fluid from the release solenoid. The electric brake fluid pump
is used to transfer brake fluid from the low-pressure accumulator to the master cylinder
as well as supply the solenoid to guarantee sufficient brake fluid supply to the pressure
modulator. The high-pressure damper is used to dampen the high-pressure brake fluid
supplied by the electric pump for the purposes of smoothing the brake fluid supply to
the master cylinder.
Figure 2.2 Solenoid valves (Hyundai Motor company ABS training document)
The operational process of the ABS is as follow: First, the ABS ECU receives signals
from the directly connected sensors and through the CAN (Controller Area Network)
bus; secondly, the ABS ECU processes and analyses the received signals; then the ABS
ECU generates adequate power signals (voltage or current) to activate the HU according
to the sensors, other related signals analysis results and the relevant control algorithm;
finally, the modulated brake pressure is applied via the conventional brake unit.
The Solenoid layout configuration usually includes a dual positional solenoid 2/2 which
only has two operation states; one is active and the other is deactivated. There are two
related positions, one is open and the other is closed. In the active state, power is
supplied to the solenoid, which could be in either the open position or the closed
position depending on the ABS hydraulic route design. In the deactivated state, the
power supply is cut from the solenoid, which could also be in either the open position or
the closed position, depending again on the ABS hydraulic route design. These dual
This item has been removed due to 3rd Party Copyright.This item has been removed due to 3rd
Party Copyright. The unabridged version of the thesis can be found
in the Lanchester Library, Coventry University
This item has been removed due to 3rd Party Copyright.This item has been
removed due to 3rd Party Copyright. The unabridged version of the thesis can be
found in the Lanchester Library, Coventry University

5
positional configurations of the solenoids (in either active or deactivated positions) can
be employed to achieve a different control topology. As seen in Figure 2.3, the brake
fluid inlet in solenoid A is open in the deactivated state and closed in the active state.
The outlet in solenoid C is closed in the deactivated state and open in the active state. If
brake pressure increase is desired, the inlet solenoid is put in a deactivated state in the
open position, and the outlet solenoid is put in a deactivated state in the closed position.
If brake pressure hold is desired the inlet solenoid is put in an active state in the closed
position, and the outlet solenoid is put in a deactivated state in the closed position. If
brake pressure decrease is desired, the inlet solenoid is put in an active state in the
closed position, and the outlet solenoid is put in an active state in the open position.
Application delay could present in electro-mechanical hydraulic execution units, which
could cause ABS control delays. Delay can be on both apply and release phases. They
represent the periods that the output pressure increases or decreases to a desired level
(Terry et al., 2002). These delays must be considered in the ABS controller design and
the ABS performance simulation.
Figure 2.3 Basic ABS layout (The Clemson University Vehicular Electronics
Laboratory website)
This item has been removed due to 3rd Party Copyright.This item has been removed due to
3rd Party Copyright. The unabridged version of the thesis can be found in the Lanchester
Library, Coventry University
6
2.2. ABS theory
The maximum available negative vehicle longitudinal acceleration and adequate
steering ability are ABS control objectives. The maximum available negative vehicle
longitudinal acceleration is governed by the maximum longitudinal tyre-road braking
force which is generated by the tyre at the tyre-road contact patch. The steering ability
is governed by the lateral force generated by the tyre at the tyre-road contact patch.
Both the longitudinal tyre force and the lateral tyre force are related to the tyre
longitudinal slip ratio.
2.2.1. Longitudinal slip ratio
The longitudinal tyre slip ratio is defined as the difference between the longitudinal
wheel velocity in the tyre plane and the wheel peripheral velocity. The equation for the
longitudinal slip ratio is:
𝑠𝑙𝑖𝑝 =𝑉𝑤−𝜔∙𝑅
𝑉𝑤 (2.1)
where
Vw= Longitudinal wheel velocity in the tyre plane
W = Wheel rotational velocity
R = Effective rolling radius of tyre
The equation is ostensibly somewhat simple, but it in practice achieving the desired
effect is very complex. That is because the longitudinal wheel velocity in the tyre plane
and the effective rolling radius of the tyre are difficult to be measured directly and
accurately. This is due to sensor limitations, the non-linearity involved in vehicle
dynamics, tyre dynamics and the unpredictability of the environment during a braking
manoeuvre. When braking, the wheel peripheral velocity cannot be used to represent the
longitudinal wheel velocity due to the slip between the tyre and the road. The situation
is exacerbated when the vehicle is turning or travelling on a low friction road surface
and/or when an uneven road causes unexpected tyre deformation. Therefore, a lot of
research has focused on estimation methods regarding longitudinal wheel velocity and
effective tyre rolling radius. Estimations can achieve a high level of accuracy in
predictable situations, especially regarding effective tyre rolling radius (Shannon et al.,

7
2001). But the limitations of these estimations could still cause some instability in ABS
control in unpredictable scenarios (during emergency braking), so accurate and
consistent measurement methods are desired and remain the focus of intensive research.
2.2.2. Longitudinal tyre braking force
The typical relationship between the longitudinal tyre slip ratio and longitudinal tyre
braking force is shown in Figure 2.4. As can be seen, initially, the longitudinal tyre
braking force increases when the slip ratio increases; then, when the slip ratio reached
certain level, the longitudinal tyre braking force approaches its maximum value. This
slip ratio level is relatively low (between 15% and 30%) and is called the optimal slip
ratio. It is a very important ABS control parameter. Once the optimal slip ratio is
reached, the longitudinal tyre braking force starts to decrease. This relationship is very
important as it is widely used in different ABS control methods which will be discussed
later. In addition to the longitudinal tyre slip ratio, the tyre vertical force and the tyre-
road friction coefficient also have strong effects on the longitudinal tyre braking force.
Figure 2.4 Longitudinal tyre braking force to slip ratio A (Damiano et al. 2009)
As seen in Figure 2.5, the region on the left of the optimal slip ratio is called the stable
brake region and the region on the right of the optimal slip ratio is called the unstable
region. Within the stable region, the maximum longitudinal tyre braking force can be
achieved, and the wheel rotates allowing steering ability to be retained. Within the
This item has been removed due to 3rd Party Copyright.This item has been removed due to 3rd
Party Copyright. The unabridged version of the thesis can be found in the Lanchester Library,
Coventry University

8
unstable region, the wheel locks up very quickly, the tyre braking capability is reduced
and steering ability is compromised. Consequently, the ABS control algorithm is needed
to limit the slip ratio within the stable region, maintain maximum tyre braking
capability and retain directional control.
Figure 2.5 Longitudinal tyre braking force to slip ratio B (Damiano et al. 2009)
The tyre longitudinal braking force has an approximately linear relationship with the
longitudinal slip ratio within the stable region of the tyre. Beyond the stable region, the
linear relationship does not exist and the dynamics of nonlinear tyre behaviour takes
effect (Hossein et al., 2010). As it is assumed that ABS control could maintain tyre
longitudinal braking force within the linear region, the linear tyre longitudinal braking
force and slip ratio relationship could be used as ABS control reference (Shannon et al.,
2001).
2.2.3. Road surface friction coefficient
There is another important factor that must be considered in the slip ratio study; the road
surface friction coefficient. The relationship between wheel slip ratio and the friction
coefficient is shown in Figure 2.6. As is seen, the optimal slip ratio is different on high
and low friction coefficient surfaces; the maximum available longitudinal friction
coefficient is achieved at the optimal slip ratio; the lateral force generation capacity
decreases with the increase in the slip ratio because the lateral friction coefficient
decreases. This estimation method is commonly used to ascertain the friction coefficient.
This item has been removed due to 3rd Party Copyright.This item has been removed due
to 3rd Party Copyright. The unabridged version of the thesis can be found in the Lanchester Library, Coventry University

9
Direct measurement methods are becoming more popular, and some of these methods
will be introduced later in this chapter.
Figure 2.6 Longitudinal and lateral coefficient of friction versus slip ratio curve
(Kazemi et al. 2005)
2.3. ABS control methods
In the literature review, two designs of the ABS control method are mostly employed.
One is based on logic switching, which is in turn based on wheel angular acceleration
information; the other is tyre longitudinal slip ratio regulation based. Nonlinearity and
model uncertainties are considered difficulties in regard to ABS control method
development.
2.3.1. Slip ratio control method
In regard to the slip ratio control method, the ABS modulates the brake pressure to
maintain the slip ratio (located between B and A as shown in Figure 2.7) in order to
keep the longitudinal tyre braking force within the maximum range without locking the
wheel. The slip ratio based method can adopt a simple increase-hold-decrease brake
pressure control approach. The method works even when no maximum tyre forces occur,
and there are no periodic oscillations in the brake pressure control. However, this
method is based on linearization arguments, so the stability analysis is only available
This item has been removed due to 3rd Party Copyright.This item has been removed due to
3rd Party Copyright. The unabridged version of the thesis can be found in the Lanchester
Library, Coventry University

10
locally and the method might fail with respect to the unstable region of the tyre braking
force (Mathieu et al., 2010).
Figure 2.7 Slip ratio control interval (Damiano et al. 2009)
The slip ratio control interval, which is the period between A and B as seen in Figure
2.7, was discussed by Damiano et al. (2009) and influences the ABS performance. The
interval should not be too large, so as to permit intensive control (in order to shorten the
braking distance); however, it is difficult for ABS to maintain a small interval,
especially on a low friction surface, mainly due to delays in the hydraulic unit. A
compromise should be reached to achieve the best average performance.
As mentioned previously, the slip ratio cannot be measured directly as it is calculated
using the slip ratio equation (equation 2.1). As seen in the slip ratio equation, to
calculate the optimal slip ratio the related longitudinal wheel velocity and effective tyre
rolling radius must be estimated, or accurately measured, as must the tyre-road friction
coefficient. Between the longitudinal wheel velocity and the tyre-road friction
coefficient the latter influences the optimal slip ratio the most. They are usually
estimated or measured at the same time in the slip ratio control. A typical slip ratio
based control process block diagram is shown in Figure 2.8. It represents the most
common theoretical ABS control logic flow.
This item has been removed due to 3rd Party Copyright.This item has been removed due to 3rd
Party Copyright. The unabridged version of the thesis can be found
in the Lanchester Library, Coventry University
11
Figure 2.8 Slip ratio based ABS control process block diagram
(Damiano et al. 2009)
2.3.1.1. Slip ratio control related longitudinal wheel velocity and tyre-road friction
coefficient estimation and measurement method
Damiano et al. (2009) proposed an effect based tyre-road friction estimator which uses
the wheel angular deceleration to identify the tyre/road friction coefficient, but it can
only estimate high and low levels of friction (it cannot provide more detailed friction
estimates).
They also proposed a longitudinal vehicle speed estimation method based on the four-
wheel angular speed measurements. A speed variation method is proposed in which the
speed variation is defined as the difference between the measured wheel speed and the
estimated vehicle speed. The speed variation is proportional to the friction coefficient.
The friction coefficient can be obtained from the friction estimator to calculate the
speed variation; then the speed variation is added to the measured wheel speed to
determine the vehicle speed. The vehicle longitudinal acceleration signal is also used as
a security parameter to aid in determining the longitudinal vehicle speed. This accounts
for instability caused by sudden grip change, which is considered a limitation to the
pure slip control method.
Sahin et al. (2010) proposed a friction coefficient estimator that only uses vehicle
longitudinal acceleration as an input. The linear tyre longitudinal braking force and the
slip ratio relationship are employed in this estimator, while the longitudinal acceleration
(a function of braking force) and the change in vehicle vertical load while braking are
ignored. The friction coefficient could be found by interpreting the relationship between
the vertical load, braking force and friction coefficient. This method will encounter
some difficulties if the vehicle does not travel in a straight line and/or is characterised
This item has been removed due to 3rd Party Copyright.This item has been removed due to 3rd Party Copyright. The unabridged version of the thesis can be
found in the Lanchester Library, Coventry University

12
by non-linear vehicle and tyre properties, as the longitudinal acceleration measurement
is inaccurate without calibration.
The same paper also proposed a longitudinal vehicle speed estimation method based on
the wheel angular speed and vehicle longitudinal acceleration measurements. This
method uses the polluted vehicle longitudinal acceleration and wheel angular speed to
estimate the vehicle longitudinal speed. Sahin et al. (2010) state that vehicle
longitudinal acceleration can aid the pure longitudinal slip vehicle reference speed
estimation. In this regard a signal processing tool, the Kalman filter, was introduced
and it will be discussed later.
Sahin et al. (2010) also proposed the direct calculation method which uses vehicle
longitudinal and lateral acceleration, yaw rate and steering angle measurements from
the on-board sensors as inputs to calculate the longitudinal wheel velocity. The sensors
used to measure the required data are not ordinarily used with ABS, but if the ABS is
integrated with other active safety systems, like ESP, this method could become a
reality on production vehicles.
M.Tanelli et al. (2006) proposed the same longitudinal speed estimation method as
Sahin et al. (2010). The method is based on the measurement of the four wheels’
angular speed and longitudinal acceleration. This method uses the average longitudinal
speed of the four wheels and the two non-driving wheels (derived from their respective
angular speeds), as well as the filtered signal from the longitudinal acceleration sensor
as inputs. The test results were positive and the performance of the proposed
longitudinal speed estimation method was close to the performance of the
commercialised ABS control method.
Shannon et al. (2001) proposed the use of a Global Positioning System (GPS) to
measure a vehicle’s absolute speed. Shannon et al. (2001) discussed the GPS
measurement latency but not the measurement accuracy (although it was referred to).
They suggested that a longitudinal accelerometer can be a significant aid to the GPS in
terms of measuring latency and accuracy.
13
Sami (2010) introduced the use of both conventional vehicle dynamic sensors and
conceptually new environment sensors to measure the tyre-road friction coefficient.
Conventional vehicle dynamic sensors include wheel angular speed measurement
sensors, an Inertial Measurement Unit (IMU) - for accelerations and rotations, brake
pressure sensors, and steering angle sensors. The conceptually new environment sensors
include a road eye sensor, a LUX laser scanner, a Correvit ground speed camera, an
IcOR polarization camera, and an APOLLO/FRICTI@N project tyre sensor. The LUX
laser scanner can provide true ground speed and vehicle heading direction if a static
object is identifiable, but the measurement cannot be performed if no visible static
object can be identified. This research offers a positive appraisal of the sensors currently
under development, although the costly sensors are only available for circuit test
vehicles at this time.
Sami (2010) also introduced the friction estimation method based on dynamical friction
models, such as the LuGre model, that includes hysteresis effects, velocity dependence
and so on. Within the model, road conditions are based on a single parameter, so
friction can even be estimated using only wheel angular velocity (although this is only
the case with regards to slip). Deng et al. (2006) proposed the use of the LuGre dynamic
friction model in the friction coefficient estimation process for their proposed ABS
control method as well.
Eichhorn et al. (1992) proposed to mount a microphone in the wheel box to measure the
noise emitted by the tyre in order to estimate the friction coefficient, but tyre noise is
affected by many factors, such as road surface texture, so it only has limited uses.
2.3.1.2. Slip ratio control related effective rolling radius measurement or estimation
Shannon et al. (2001) proposed an effective rolling radius estimation method that uses
both the GPS measurements, the wheel speed sensor measurements and a simple least-
squares regression technique.
Sami (2010) introduced an optical tyre deformation sensor with APOLO/FRI@TION.
This sensor could also be modified to measure the effective tyre radius.

14
Bulent (1999) examined the effectiveness of a geometry based tyre rolling radius
calculation method and a tyre rolling radius calculation formula introduced by Dunlop
Tyres. Both calculation methods present similar results with less than 2% difference.
2.3.2. Wheel angular acceleration based control
Mathieu et al. (2010) proposed a two-phase ABS control method which is wheel
angular acceleration based. It measures and controls the wheel angular acceleration in a
closed loop.
A wheel angular acceleration based control algorithm is simple and robust. It can keep
the wheel slip in the neighbourhood of its optimal point without explicitly using the
value of the optimal set point. Since the algorithm eliminates the optimal slip ratio
estimation, estimations or measurements of vehicle velocity, tyre/road friction
coefficient and effective tyre rolling radius are no longer necessary. These enhance the
performance of the control method regarding handling changes in vehicle velocity, the
tyre-road friction coefficient and the effective tyre rolling radius. This also allows the
algorithm to cope with measurement noise. Some of the recent research even uses the
wheel angular deceleration thresholds to track the optimal slip ratio by analysing the
stability of its limit cycles.
Nonetheless, the algorithm is always based on heuristic arguments. The tuning of the
thresholds could be difficult (Kiencke et al., 2000) in the absence of accurate
mathematical representation or an absolute linear relationship. The conventional wheel
angular acceleration based control method uses wheel angular acceleration for both
maximum tyre-road braking force detection and control, and this may cause conflict.

15
2.3.3. Control algorithms other than pure slip ratio or pure angular acceleration
based
2.3.3.1. Bosch ABS
The Bosch ABS is based on wheel angular acceleration thresholds and a slip ratio
threshold. A complex rule is used to determine the brake pressure modulation (Terry et
al., 2002). The Bosch algorithm has eight control phases, as seen in Figure 2.9, and the
wheel angular acceleration thresholds represent the boundaries for most control phases.
In the second control phase, the slip ratio threshold is set, then, from the start of phase 3
to phase 8, the current estimated slip ratio is compared with the previously determined
optimal slip ratio. If the current slip ratio exceeds the optimal slip ratio, all other control
phases are bypassed and the brake pressure decrease phase is active. This is called an
adaptive learning function, which makes the algorithm robust in the event of a change in
road friction. Figure 2.9 shows the Bosch ABS brake pressure control cycle.
Figure 2.9 Bosch ABS control algorithm explanations (Bosch, 2004)
Bosch added a complicated slip ratio threshold in its control method for assurance.
When the wheel experiences high inertia, the tyre-road friction coefficient is low and
change in brake pressure is delayed, as in the case of cautious initial braking on black
ice, for example. In such cases the wheel could lock without any response from the pure
This item has been removed due to 3rd Party Copyright.This item has been removed due to 3rd Party Copyright. The unabridged version of the thesis can be
found in the Lanchester Library, Coventry University

16
wheel angular acceleration switching threshold based control method. The slip ratio
threshold is designed to aid the ABS control in such exceptional situations in order to
guarantee an overall satisfactory ABS performance (Bosch, 2004).
The Bosch ABS is very robust in handling the uncertainties and nonlinearities involved
in emergency braking situations. But its performance is limited because its oscillatory
nature can cause undesired and noticeable vibrations. This complexity limits system
integration flexibility and performance (Petersen, 2003).
2.3.3.2. Van der Jaght et al. proposed rules based control method
Bulent (1999) introduced an ABS control method based on a theory proposed by Van
der Jaght et al (1989). This control method shares the same philosophy as the Bosch
ABS; it uses a very complex rule to modulate the brake pressure. The set thresholds are
wheel angular acceleration and the difference between wheel peripheral speed and
wheel linear speed. The control method has seven states and five events. The set
thresholds are used to switch between the control phases. The disadvantage of this
control method is its complexity.
2.3.3.3. Combined wheel angular acceleration and wheel longitudinal slip ratio
Mathieu et al. (2010a) proposed an ABS control method based on both wheel angular
acceleration and longitudinal slip ratio control. The cascaded control approach is
unlisted in the control method, so it is not as complex as the Bosch ABS. This control
method can handle the non-linear nature of ABS and provides good performance.
2.3.3.4. Two phase, tyre longitudinal braking force phase switch
Mathieu et al. (2010b) proposed a hybrid, two-phase ABS control algorithm based on
wheel angular acceleration thresholds. This control method measures and controls the
wheel angular acceleration in a closed loop. The tyre longitudinal braking force
measurement from the SFK (a bearing manufacturer) Load Sensing Hub Bearing Units
(LSHBU) is used to switch control phases and calculate related reference thresholds.
This is based on the relationship between tyre longitudinal braking force and slip ratio.

17
The maximum longitudinal tyre braking force occurs at the optimal slip ratio. Before
reaching the optimal slip ratio, the longitudinal tyre braking force increases with the
increase of the slip ratio. After reaching the optimal slip ratio, the longitudinal tyre
braking force starts to decrease. Therefore, when the measured longitudinal tyre braking
force starts to decrease in an emergency brake situation, it could be assumed that its
maximum braking force has been passed. On the basis of this relationship between the
longitudinal tyre braking force and the slip ratio, it can be concluded that the optimal
slip ratio is passed, which triggers the switch of the control phase to decrease brake
pressure.
The proposed hybrid control method is robust enough to deal with the uncertainties of
the ABS control, which are caused by the absence of a slip ratio estimation. It uses a
longitudinal tyre braking force measurement as a control phase switch, so it is more
accurate than a control method based on conventional wheel angular acceleration
thresholds. Accordingly, the conflict between detection and control is resolved. This
control method is simple, so it is easy to tune the control parameters to improve its
performance.
Nonetheless, this control method has two limitations. Firstly, the longitudinal tyre
braking force cannot be held at its maximum level as drop in the brake force is
necessary to switch the control phase; secondly, there is no clear maximum tyre-road
friction in a limited slip event (e.g. on snow or ice where the control phase cannot be
switched).
2.3.4. Rear wheel brake control
In order to achieve better vehicle handling stability when braking, the rear wheel control
strategy should be configured slightly differently from that of the front wheels. While
braking and cornering, a high lateral force generation with regards to the rear wheels -
especially for the wheel on the outside of the bend is desired to enhance cornering
performance. Accordingly, the brake control strategy should keep the rear wheel slip
ratio at a somewhat low level (Bosch, 2004). In regard to the control strategy design for
18
the rear wheel, the brake pressure distribution bias between the front and rear wheel
should also be considered.
2.3.5. Controller technique
In addition to the thresholds based logic controller used on the Bosch ABS, fuzzy logic
and PID controllers are used for ABS. Sahin et al. (2010) compares the error
elimination performance of a fuzzy logic controller and a PID controller on an ABS.
The fuzzy logic controller was fed with an error with regards to the estimated and the
reference slip ratio and the wheel angular acceleration. The controller controls the brake
pressure to eliminate the error. The wheel angular acceleration information is used as an
insurance mechanism in regard to the controller. When the wheel angular deceleration
reaches a predefined threshold, the controller fully reduces the braking pressure
irrespective of the slip ratio. An extensive trial and error process is expected in the
development of a fuzzy controller.
The PID controller was fed with an error in regard to the estimated and reference slip
ratio only. The control parameters’ determinations are not based on an analytical
approach. They are determined based on intensive simulations and experiments, along
with previous experience.
It was concluded that both types of controllers were able to track the slip ratio values.
The fuzzy logic controller presents better performance regarding control accuracy. The
PID controller presents good performance regarding brake pressure overshoot
elimination at the initial braking stage.

19
2.4. Sensing technology
2.4.1. In-wheel acceleration sensor
Hee et al. (2010) introduced a tri-axial acceleration sensor that fits in the wheel hub to
measure the wheel lateral acceleration. This acceleration is then converted into tyre
lateral force through simple algebraic equations. The tyre lateral force is used to
calculate the vehicle body slip angle which is a control parameter used in ESC
(Electronic Stability Control).
The three-axial acceleration sensor is designed by MEMS technology. It is integrated
with the wheel angular speed sensor, and it is small and robust. Figure 2.10 shows a
picture of the sensor.
Figure 2.10 Integrated wheel speed sensor and accelerometer (Hee et al. 2010)
Hee et al. (2010) also devised a signal conditioner. It uses a second-order low pass filter
and a first-order high pass filter to condition the noisy signal. This research did not
specifically refer to the possible delay caused by the signal conditioner. The
effectiveness of this method is ascertained in a road test. The in-wheel six-component
wheel force transducer measured lateral force is compared to the wheel lateral
acceleration converted lateral force. The two share the same tendency, but a small
difference between the peak values is noticed. A numerical simulation is carried out
based on the converted lateral force in the test. The results show that the use of a wheel
lateral acceleration converted lateral force can enhance the performance of the original
ESC. Hee et al. (2010) also conclude that the wheel hub acceleration occurs about 0.2s
earlier than the vehicle body acceleration.
This item has been removed due to 3rd Party Copyright.This item has been removed due to 3rd Party Copyright. The unabridged version of the thesis can be
found in the Lanchester Library, Coventry University

20
2.4.2. Smart wheel
The information regarding the forces and moments acting at the tyre/road contact patch
is very important for vehicle dynamic related control systems. But the information is too
complex to be accurately measured, so the estimation-based control systems gain
popularity. The direct forces and moment measurement methods are under intensive
research, as the accurately measured forces and moments will significantly improve the
performance and reduce the complexity of the vehicle handling related control systems.
Smart wheel is the name of a wheel that can measure tyre forces and moments with
integrated sensors. The smart wheel could be used to validate mathematical tyre models.
Most of the smart wheels incorporate wireless data transmission and non-battery
powered supply technologies that could experience difficulties in real driving conditions.
Gobbi et al. (2010) present a lightweight smart wheel which can be used to measure the
three forces and three moments acting at the tyre-road contact patch. The wheel has
three supporting spokes. Strain gauges are fitted on top of the spokes to detect any
deformation in them, which is then converted into data on forces and moments. The
gauge sensor uses a non-battery powered power source and the measured signal is
transmitted wirelessly. This wheel is used in a laboratory environment and is currently
too expensive to use on production vehicles.
Ryosuke et al. (2006) proposed a smart wheel to measure the forces acting on the tyre-
road contact patch directly. This concept involves planting metal wires on a small area
in the tyre belt which act as electrodes to connect with the steel wires within the tyre
carcass. The capacitance change between two adjacent steel wires and the resistance
change within the wires while the tyre is deforming are used to determine the force
information.
Compared to the inner tyre surface and wheel rim embedded strain sensor, the proposed
sensor naturally lay within the tyre belt. This approach could improve the precision of
the measurements, as it could overcome the hysteresis between the tyre belt and the
inner tyre surface and sidewall (this hysteresis can reduce the precision of the inner tyre
surface and wheel rim measurement). Compared to some inner tyre surface embedded
strain sensors, another advantage of the proposed sensor is its lower levels of stiffness.

21
If the strain sensor has higher levels of stiffness than the tyre rubber, it could influence
the original tyre deformation and the forces acting on the tyre.
Sami (2010) introduced the APOLLO/FRICTI@N project tyre forces sensor. The
sensor is an optical position sensor that uses a position sensitive detector to detect the
movement of the LED (as seen in Figure 2.11). The movement of the LED represents
the motion and the deformation of the inner tyre surface, and the inner tyre surface
deformation is brought about by the forces acting on the tyre. The tyre sensor is
theoretically capable of carrying out continuous measurements on the tyre-road contact
patch. However, according to Ryosuke et al. (2006), the accuracy and the durability of
the sensor could be compromised due to the harsh working environment it would be
exposed to.
Figure 2.11 APOLLO/FRICTI@N project tyre forces sensor (Sami, 2010)
2.4.3. Niche Force sensor
Tyre-road braking torque representable in wheel force measurement sensor
The FlexiForce sensor developed by Tekscan pushes force measurement to a new
practical level. It offers a great opportunity to develop a low cost in-wheel force sensor.
The FlexiForce force sensor operates in a very similar way to a strain gauge. The main
difference is that the strain gauge deforms with attached element while the
The FlexiForce force sensor does not. The sensor acts as a force sensing resistor. As
seen in Figure 2.12, the sensor has a very high resistance when it is unloaded. The
resistance decreases once a force is applied. The resistance can be measured by an
This item has been removed due to 3rd Party Copyright.This item has been removed due to 3rd Party
Copyright. The unabridged version of the thesis can be found in the Lanchester Library, Coventry
University

22
electronic circuit. Both the force versus resistance and force versus conductance
characteristics of the sensor are supplied, and they can be used for accuracy calibration.
Figure 2.12 Resistance and conductance to force (Tekscan website)
A seen in Figure 2.13, the sensor is constructed of two layers of substrate (polyester)
film. A conductive material (silver) is applied to each layer followed by a layer of
pressure-sensitive ink. The two layers of substrate are laminated together with adhesive.
The silver circle on top of the pressure-sensitive ink is the active sensing area. Silver
extends from the sensing area to the connectors at the other end of the sensor forming
the conductive leads. The sensor is terminated with male square pins allowing it to be
easily incorporated into a circuit. The two outer pins of the connector are active and the
centre pin is inactive. The sensor is ultra-thin and very flexible. Its high-temp model
(HT201) can withstand up to 200 degrees centigrade and operate in a 4448N force
range. Accordingly, it could easily be integrated into a wheel hub in the way seen in
Figure 2.14. The current price is $65 which is tantamount to £41 for a pack of 4.
This item has been removed due to 3rd Party Copyright.This item has been removed due to 3rd Party Copyright. The unabridged version of the thesis can
be found in the Lanchester Library, Coventry University

23
One way to integrate the FlexiForce sensor into an application is to incorporate it into a
force-to-voltage circuit. A means of calibration must then be established to convert the
output into the appropriate engineering units. Depending on the setup, an adjustment
could then be performed to increase or decrease the sensitivity of the force sensor.
Figure 2.15 shows a typical calibrated sensor response to applied force.
Figure 2.15 Force to sensor output characteristic (Tekscan website)
2.4.4. Environmental Sensors
The environmental sensors are usually based on optics, acoustics and radio frequency.
They use the changes in the signal reflectance, polarization and absorption properties
caused by the environment. They are usually used to measure the road friction, object
Figure 2.13 Force sensor brake
down
Figure 2.14 In wheel sensor
(Tekscan website)
This item has been removed due to 3rd Party Copyright.This item has been removed due to 3rd
Party Copyright. The unabridged version of the thesis can be found
in the Lanchester Library, Coventry University
This item has been removed due to 3rd Party Copyright.This item has been removed due to 3rd Party Copyright. The unabridged version of the thesis
can be found in the Lanchester Library, Coventry University
This item has been removed due to 3rd Party Copyright.This item has been removed due to 3rd Party Copyright. The unabridged version of the thesis can be
found in the Lanchester Library, Coventry University

24
distance, rainfall and so on. One popular environmental sensor used on production
vehicles is a rain sensor. It is used to detect rain drops and activates the wiper
automatically.
A Swedish company called Sensice developed a novel and cheap ice detector based on
an infrared spectroscopy. The detector is able to detect dry and wet conditions, ice,
black ice and ice/sleet covered with a layer of water.
Audi developed the Audi Road Vision system which uses a laser and an infrared
spectroscopy to identify road surface conditions. It can even detect gravel.
Sami (2010) gave the environmental sensors currently under development an extensive
review. The main objective of Sami’s (2010) was to use the environmental sensors and
conventional vehicle dynamic sensors to measure the tyre/road friction. The
environmental sensors, including the Road Eye sensor, the LUX laser scanner, the
Correvit ground speed camera and the ICOR polarization camera were presented.
A Road Eye sensor is used to detect different road surface conditions and classify them
as dry, wet, snow and ice. It is based on absorption spectroscopy which measures the
absorption of infrared light at wavelengths between 1320 and 1570 nm. Every road
surface condition occupies a specific position on the absorption spectrum, and the Road
Eye can classify each one based on an analysis of the reflected wavelengths. The
wavelengths are produced by two laser diodes, and active lighting ensures the sensor
works in darkness. Nonetheless, this sensor encounters difficulties in distinguishing
between water and ice, as their chemical properties are similar.
The LUX laser scanner operates by sending short laser pulses and measuring the time
taken for the reflected light to return to the sensor. Then the travel time is used to
identify the distance to an object. The sensor could provide true ground speed and
vehicle heading when a static object is identified. It uses multi-echo technology, and by
splitting each laser pulse into four layers it can filter out reflections coming from rain,
dirt and fog.
25
The VTTís IcOR polarization camera combines a stereo camera with polarization filters.
This camera system limits visible spectrum detection bandwidth to below 950 nm, as a
system capable of higher bandwidth is considered too expensive to implement on
production vehicles. The sensor can be used as an aid to the Road Eye sensor.
As the environmental sensor can estimate the tyre/road friction in front of the vehicle, it
can provide the control system with an initial friction measurement that conventional
vehicle dynamic sensors cannot. This initial friction measurement can help to prevent
the brake pressure control from overshooting at the beginning of the control process.
2.4.5. Sensor fusion
The sensor fusion technique is standard in avionic navigation systems. This technique
makes the best use of multi sensors, so it is usually more accurate and efficient than a
single sensor. As more and more sensors are used for different vehicle control systems,
sensor fusion is increasingly being employed with regards to on-road vehicle control.
Jorge et al. (2010) introduced the fusion level, which is defined as the level at which
different sensor measurements are fused. There is a feature level and a full information
level, and depending on the fusion level there are two basic algorithm architectures.
They are centralized and decentralized. If the sensors’ measurements are fused at the
feature level, the algorithm has a centralized architecture and the sensors’ measurements
are fused just after the raw data processing stage when the full measurements are not yet
available. Sometimes, this fusion level may not be able to provide the key information
before the measurements of all the sensors involved are available. If the sensors’
measurements are fused at full information level, the algorithm will have a
decentralized architecture. In regard to this architecture the sensors’ measurements are
fused after the full measurements of each sensor is available. The advantage of this is
that the optimal performance of an individual sensor could contribute to the overall
system performance, and the degradation of an individual sensor performance does not
affect the performance of the other sensors.

26
Sami (2010) used the sensor data fusion approach for friction measurement. The
information comes from environmental sensors, vehicle dynamic sensors, and tyre
sensors. The data fusion architecture is decentralized, each sensor catalogue has its own
data fusion unit, and the fusion unit which makes the final decision fuses this
information to initialise road friction estimations.
Fredrik et al. (2001) used sensor fusion to estimate vehicle velocity by combining the
measurements of the wheel speed sensor and the vehicle longitudinal accelerometer.
Vehicle acceleration is considered a good complement to the wheel speed signals when
non-driven wheel speed signals are not available. This approach gives relatively
accurate longitudinal wheel velocity compared to an estimation provided exclusively by
the angular speed sensor.
Fredrik et al. (2001) also posited that a vertical accelerometer be used to compensate for
a non-horizontal vehicle position (this causes bias regarding the longitudinal
accelerometer measurement). Due to regular accelerometers having bias and the
unsuitability of scale factors for continuous integration, some other related information
could be involved to help overcome those limitations.
Sensor data fusion underpins active safety system interaction. More and more active
safety systems are being developed and implemented on modern vehicles. Different
active safety systems may use different types of sensors. Efficient integration of these
sensors could help to improve the overall system performance, simplify the overall
system structure and reduce the overall system cost.
2.4.6. Sensor data process
Due to the presence of nonlinear vehicle dynamics while driving, the raw data from the
vehicle dynamic sensors, like the wheel speed sensors for example, usually contain
measurement noise. The polluted data cannot be used directly by the ABS. A Kalman
filter is a useful tool that can be used to attenuate measurement noise (Fredrik et al.,
2001).

27
Deng et al. (2006) explain that the Kalman filter attenuates measurement noise by
giving an accurate estimation of the measurement offset. Recently, the Extended
Kalman Filter has been widely used as a nonlinear system state estimation tool.
Nonetheless, it requires large computational effort, and it is of limited use when the
Jacobians or Hessians matrixes are insufficient to calculate the non-linear system. Still,
the Unscented Kalman Filter can overcome the limitations of the Extended Kalman
Filter without an increase in computational effort. A comparison of the simulation
results suggests that the Unscented Kalman Filter could offer a more accurate
estimation than the Extended Kalman Filter.
2.5. ABS modelling and simulation
2.5.1. Computer modelling and simulation
The stability of the ABS performance is very critical. It is influenced by many factors,
especially by the suspension system and tyre characteristics. In order to develop an ABS
for commercial vehicular use (using a conventional development method) a prototype
vehicle must be produced first. Time consuming and costly experimental track testing
must then be carried out to establish the control thresholds and validate the performance
of the system. Accordingly, the whole development process is long and expensive.
Modern computer modelling and simulation software are the solutions to the stated
problems. Simulation software allow an individual system or the whole vehicle to be
modelled accurately, even before the production of a prototype vehicle. The ABS can
also be modelled and integrated in the vehicle model. The performance can be tested
during the track test simulation process. These software are now being used in the
development of new vehicles by most automobile companies. After many years of
development these software deliver much more accuracy in terms of measuring vehicle
performance.

28
2.5.2. Vehicle model and tyre model
In order to simulate the ABS performance, a proper vehicle model and tyre model must
be established and integrated. The performance of the vehicle and the tyre model
directly affect the accuracy of the simulation results.
Due to the non-linearity involved in the ABS control process a non-linear dynamic
vehicle model and tyre model more accurately simulate ABS performance. The non-
linear dynamic vehicle model usually includes the effect of weight transfer during
braking, the effects of aerodynamic forces, and other vehicle dynamic effects such as
yaw and roll. A non-linear dynamic tyre model should be able to represent the
relationship between nonlinear longitudinal tyre braking and the slip ratio, the effect of
the vertical load, the rolling resistance, as well as the friction coefficient on the tyre
longitudinal braking force. The interaction between the tyre longitudinal braking force
and the lateral force while the wheel is turning should also be included in the tyre model.
In most of the literature, straight line braking simulations that neglect any cornering
effects were carried out to reduce complexity. In order to simulate the braking and
cornering manoeuvres a comprehensive vehicle and tyre model must be used. However,
the balance between simplicity and performance should always be considered during
modelling.
2.5.2.1. Matlab Vehicle models
The Matlab based vehicle model uses formulas that represent motions and interactions
as the inputs. The representation of real vehicle motion in different situations could
require very complex equations. The model introduced below is a simple example. The
model could be used as a base model if Matlab is used in regard to the simulation
software.
Hossein et al. (2010) introduced a simplified continuous non-linear vehicle dynamics
model as seen in Figure 2.16. The model has proven capable of representing the
essential features of the vehicle when braking while driving in a straight line. If
combined braking and cornering simulation needs to be carried out in future research,
the motion equations for yaw and roll effects should be included.

29
The equations used to describe the model are listed below and the parameter definitions
are shown in table 2.1. As seen in equation 2.8, the longitudinal force Fx is described as
a function of the longitudinal slip.
�̇� = −𝐹𝑥
𝑚𝑡 (2.2)
�̇� = 1
𝐼𝑡 (𝑅𝐹𝑥 − 𝑇𝑏) (2.3)
𝑚𝑡 = 1
4𝑚𝑣𝑠 + 𝑚𝑤 (2.4)
𝐹𝑧 = 𝑚𝑡𝑔 −𝑚𝑣𝑠ℎ𝑐𝑔
2𝑙�̈� = 𝑚𝑡𝑔 − 𝐹𝐿 (2.5)
λ =𝑉−𝑅𝜔
𝑉 (2.6)
�̇� =�̇�(1−𝜆)−𝑅�̇�
𝑉 (2.7)
�̇� = −1
𝑉[
𝐹𝑥
𝑚𝑡(1 − 𝜆) +
𝑅2𝐹𝑥
𝐼𝑡] + (
𝑅
𝑉𝐼𝑡)𝑇𝑏 (2.8)
Figure 2.16 Wheel free body diagram during braking

30
V The longitudinal velocity of
the vehicle. Tb The braking torque.
ω The angular velocity of the
wheel. Fz
The vertical force includes
both static force and load
transfer force due to brake.
It The total moment of inertia of
the wheel. hcg The height of vehicle gravity
centre
mt The total mass of quarter
vehicle. l Wheel base.
mvs The total sprung mass of the
vehicle. x The vehicle longitudinal travel
distance.
mw Wheel mass. λ Slip ratio
Fx Longitudinal tyre force R wheel radius
Table 2.1 Quarter vehicle model parameters definitions
Due to the non-linear property of individual vehicle components like suspension, tyres
have a great influence on ABS performance, and it is very complex to model such
properties in Matlab. Accordingly, the ADAMS (Automatic Dynamic Analysis of
Mechanical Systems) model, which is discussed below, is used in this research.
2.5.2.2. ADAMS Vehicle models
ADAMS modelling is used to understand the behaviour of systems containing rigid or
flexible parts connected by joints and undergoing large displacement motion (Blundell,
1991). It provides a good performance in vehicle applications, especially in a
suspension dynamic simulation.
Bulent (1999) proposed using ADAMS to model a whole vehicle with a detailed
suspension system, along with a FIALA tyre model, to simulate the performance of the
ABS control method. A FORTRAN subroutine was used to write the ABS control
method code. The FORTRAN code is then integrated with the ADAMS vehicle model.
In order to establish an ADAMS vehicle model, static rig measurements are required to
measure the vehicle and suspension parameters such as geometry, mass, and the spring-
damper properties. This data was then used to calculate other immeasurable or variable

31
vehicle and suspension properties, such as inertia and mass centre. A flat bed tyre test
machine can be used to collect data from the tyre model (such as the correspondence
between slip and the generation of peak tyre braking force on different road conditions)
and it forms an important part of the ABS control method.
The FORTRAN ABS control method code and the method used to implement the
control code in the ADAMS vehicle model provide good references for the research in
this thesis. Establishing the static rig measurements is a very time consuming process.
As this thesis focuses more on the development of a new ABS control algorithm,
existing vehicle data for ADAMS modelling is used. A comprehensive tyre model, such
as the Magic Formula based tyre model, is used in this research.
The ADAMS vehicle model used in this research is based on a Subaru Impreza. The full
vehicle suspension data is available and access to other relevant data is open.
The first stage of the modelling process involves modelling the front suspension and
rear suspension individually. The models presented in the ADAMS/View are shown in
Figure 2.17 and 2.18. These two suspension models can be aligned to form half the
vehicle.
Figure 2.17 Front suspension model Figure 2.18 Rear suspension model
In the second stage the mirror method is used to model the other half of the vehicle, and
the four suspesion models are connected by a vehicle body to form a full vehicle model.
In the third stage the steering wheel assembly is added to the front wheel hubs, so the
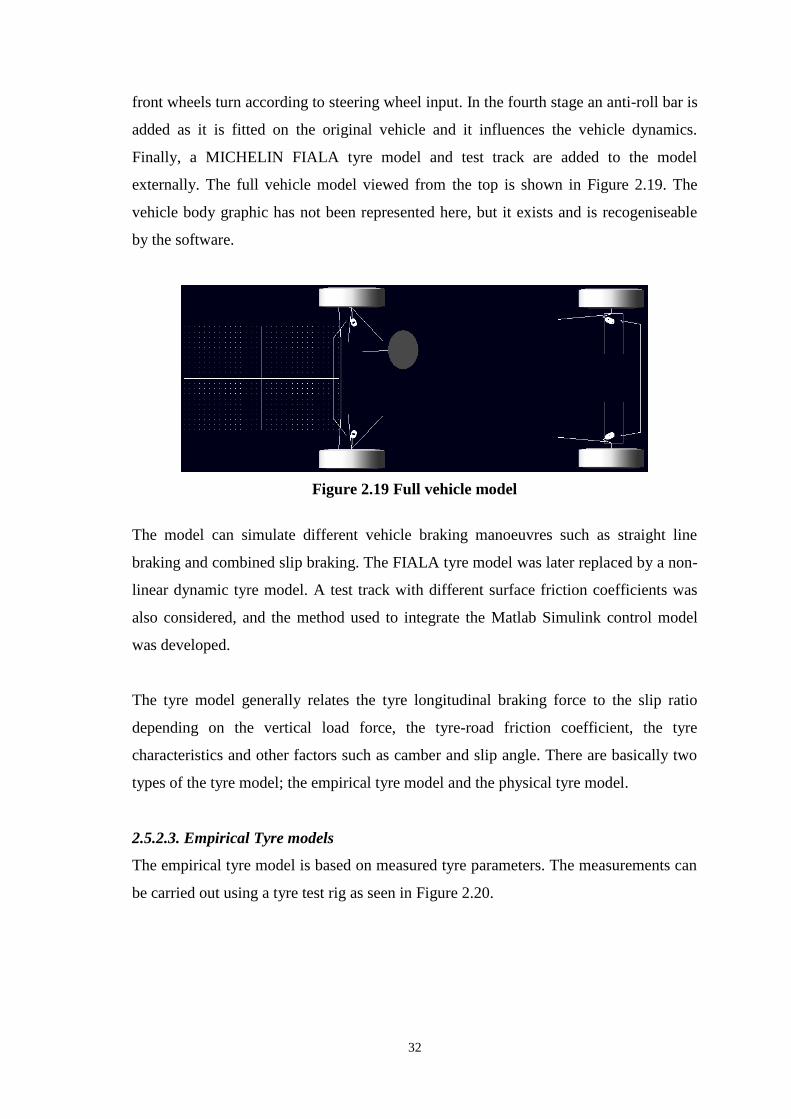
32
front wheels turn according to steering wheel input. In the fourth stage an anti-roll bar is
added as it is fitted on the original vehicle and it influences the vehicle dynamics.
Finally, a MICHELIN FIALA tyre model and test track are added to the model
externally. The full vehicle model viewed from the top is shown in Figure 2.19. The
vehicle body graphic has not been represented here, but it exists and is recogeniseable
by the software.
Figure 2.19 Full vehicle model
The model can simulate different vehicle braking manoeuvres such as straight line
braking and combined slip braking. The FIALA tyre model was later replaced by a non-
linear dynamic tyre model. A test track with different surface friction coefficients was
also considered, and the method used to integrate the Matlab Simulink control model
was developed.
The tyre model generally relates the tyre longitudinal braking force to the slip ratio
depending on the vertical load force, the tyre-road friction coefficient, the tyre
characteristics and other factors such as camber and slip angle. There are basically two
types of the tyre model; the empirical tyre model and the physical tyre model.
2.5.2.3. Empirical Tyre models
The empirical tyre model is based on measured tyre parameters. The measurements can
be carried out using a tyre test rig as seen in Figure 2.20.
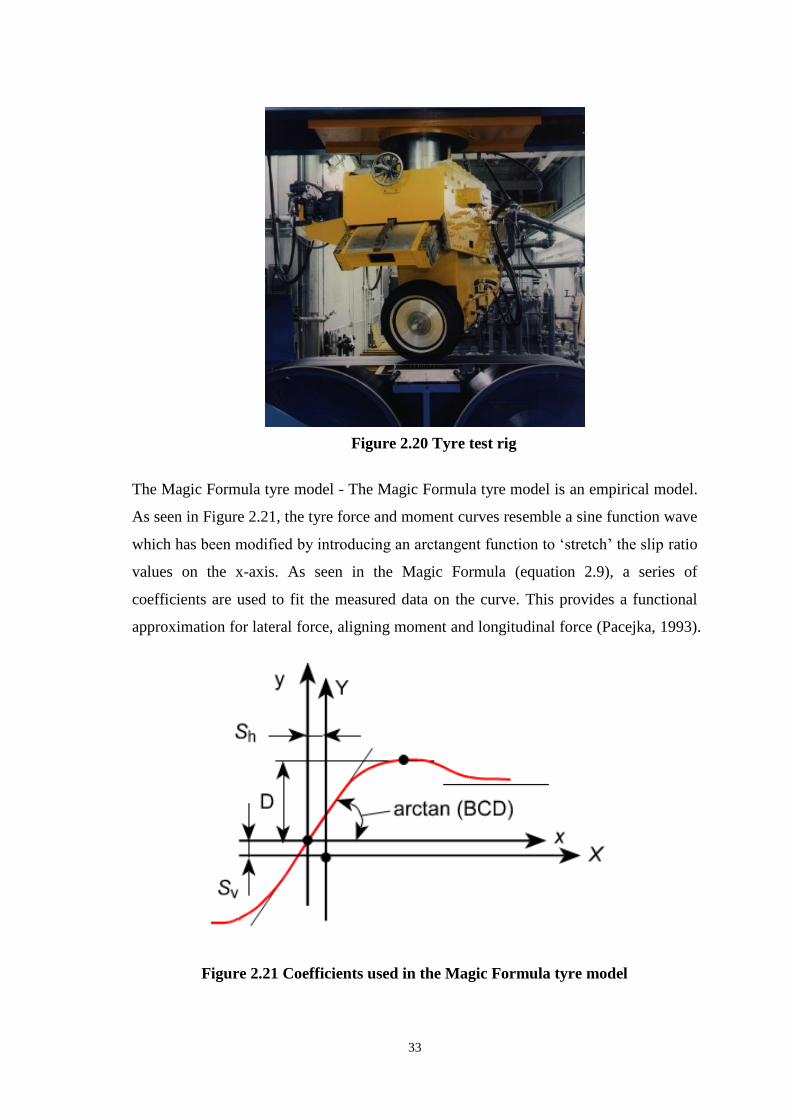
33
The Magic Formula tyre model - The Magic Formula tyre model is an empirical model.
As seen in Figure 2.21, the tyre force and moment curves resemble a sine function wave
which has been modified by introducing an arctangent function to ‘stretch’ the slip ratio
values on the x-axis. As seen in the Magic Formula (equation 2.9), a series of
coefficients are used to fit the measured data on the curve. This provides a functional
approximation for lateral force, aligning moment and longitudinal force (Pacejka, 1993).
Figure 2.21 Coefficients used in the Magic Formula tyre model
Figure 2.20 Tyre test rig

34
Y(x) = D sin[ C arctan { Bx - E ( Bx - arctan(Bx))}] (2.9)
Where Y(X) = y(x) + Sv, and x = X + Sh.
In equation 2.9, x is the slip angle or longitudinal wheel slip ratio. D is the peak value
factor, C is the shape factor used for stretching, B is a stiffness factor, B, C and D are
the slope at zero slip, and E is a curvature factor. B, C, D and E are coefficients which
depend on vertical force and camber angle. Here, Y could represent the longitudinal
force, lateral force or aligning moment. Sv is the vertical shift factor. Sh is the horizontal
shift factor.
The tyre longitudinal braking force is a function of the slip ratio. It requires 11
coefficients. The lateral force is a function of the slip angle. It requires 14 coefficients.
The aligning moment is as a function of the slip angle and requires 18 coefficients.
These coefficients are obtained from steady state testing. The lateral force and aligning
moment are measured without any effect due to longitudinal braking force. The
longitudinal braking force is measured without any effect of cornering (Blundell, 2004).
Further effort to extend the model to combine cornering and braking have been made,
and a detailed description of this process is given in a research paper published by
Pacejka and Bakker (1993).
Although large numbers of coefficients are required in the Magic Formula, once these
coefficients are found, the formula is very representative. The Magic Formula tyre
model requires low computational effort, but it is hard to include temperature effect and
tyre wear effect within the model. Research is being carried out to overcome these
shortcomings.
FIALA tyre model- The FIALA tyre model only requires 10 parameters which relate
directly to the physical properties of the tyre. In terms of striking a balance between
simplicity and accuracy, the FIALA tyre model could be a good choice for a simulation
with lower levels of accuracy. It is also an ADAMS default tyre model.
There are several disadvantages to the FIALA tyre model. The camber angle effects on
the lateral force and the aligning moment are not included. A combined cornering and

35
braking or fraction situation cannot be represented. The aligning moment turns to zero
at large slip angles, and the tyre asymmetry (conicity and ply-steer) means that small
values of lateral force and an aligning moment at a zero slip angle cannot be represented.
In addition, cornering stiffness variations are not considered (Bulent, 1999).
The Harty tyre model - The Harty tyre model only requires a low number of tyre
property parameters to establish a reasonable representable tyre model. In this tyre
model, the camber angle effect is considered and the combined slip effect can also be
represented.
The Dugoff tyre model - The Dugoff tyre model is based on a friction ellipse. The
model can represent the non-linear tyre characteristics and the interaction between tyre
longitudinal and lateral forces (Hossein et al. 2010).
The Dugoff tyre model represents the longitudinal force as Fx the lateral force as Fy with
the slip ratio λ, slip angle α, and vertical force Fz. Ci is the longitudinal stiffness and Cα
is the cornering stiffness. The parameter f(S) is defined as shown in the following
equations:
𝐹𝑥 =𝐶𝑖𝜆
1−𝜆𝑓(𝑆) (2.10)
𝐹𝑦 =𝐶𝛼𝑡𝑎𝑛𝛼
1−𝜆𝑓(𝑆) (2.11)
f(S) = S(2 − S), if S < 1 (2.12)
f(S) = 1, if S > 1 (2.13)
S =𝜇𝐹𝑧[1−𝜀𝑟√𝜆2+𝑡𝑎𝑛2𝛼](1−𝜆)
2√𝐶𝑖2𝜆2+𝐶𝛼
2𝑡𝑎𝑛2𝛼
(2.14)
2.5.2.4. Physical tyre model
A physical tyre model represents the physical tyre forces involved in the tyre-road
interaction using a mathematical model. A simple example is to consider the tyre as an
idealised radial array of elements (such as brush elements). These elements represent
given physical properties, such as elasticity in different directions and the constraints
resulting from interactivity with adjacent elements.

36
FTire model - The FTire (Flexible ring tyre) tyre model is a nonlinear in and out of
plane tyre simulation model and it can be used for vehicle ride comfort, vehicle
durability, and other vehicle dynamic related simulations on even or non-even roads.
In the FTire model, as seen in Figure 2.22, a flexible and extensible tyre ring-belt is
used to represent the physical processes involved in the tyre-road contact patch. The
ring/belt carries bending stiffness formed by distributed dynamical stiffness in the radial,
tangential, and lateral direction on the rim. The ring-belt is approximated by a finite
number of ring/belt elements, and the elements are connected to each other by stiff
springs and bending stiffness, both in and out plane. On each of the ring/belt elements,
there are numbers of mass-less ‘tread blocks’ which carry nonlinear stiffness and
damping properties in the radial, tangential, and lateral directions. The tyre forces and
moments are calculated by integrating the forces in the elastic foundation of the belt
(Michael Gipser, 2000).
Figure 2.22 Simplified in-plane FTire model
The in-plane bending stiffness is represented by a torsional spring in the lateral axis as
seen in Figure 2.23. And the out-plane bending stiffness is represented by a torsional
spring in the radial axis as seen in Figure 2.24.

37
Figure 2.23 In-plane mechanism Figure 2.24 Out-plane mechanism
The FTire tyre model uses the static and modal tyre properties to establish the model, so
the data collection is relatively easy. Nonetheless, the model requires a large amount of
tyre parameters which makes the data collection process complex and time-consuming.
The parameters required in the FTire tyre model can be found in the “Using the FTire
Tyre Model” guidance book (Ftire website). An example of FTire model based
simulation is seen in Figure 2.25, which shows the results of a tyre running over very
short longitudinal wave-length and sharp-edged obstacles. Compared to the real test
data, the simulation results demonstrate sufficient accuracy.
Figure 2.25 Validation of FTire model

38
Sharp tyre model - The Sharp tyre model is also called a Multi-radial-spoke tyre model.
In the model, the tyre is assumed to consist of many radial spokes. The spokes can
deform in the radial, lateral and circumferential directions, so stiffness is assigned to
each direction. These deformations are not influenced by the position of neighbouring
spokes.
The vertical load, slip angle and camber angle, along with the deformation stiffness are
used to calculate the directional force on each spoke. If the measured force on one
spoke does not exceed the sliding limit force, the calculation will proceed to next spoke.
If the sliding limit force is exceeded, the model allows the single spoke to slide until the
force equilibrium is reached, then the calculation goes on. The measured directional
forces are added together to ascertain the total number of directional forces acting on
the tyre (Sharp, 1999).
Only seven physically meaningful tyre parameters are required to establish this tyre
model, but it could only be used for low accuracy modelling. Once again, the
compromise between simplicity and accuracy should be considered when using this tyre
model.
2.6. Hardware in the loop (HiL) simulation
HiL is at a higher stage of development than pure computer simulation. Hardware in the
loop simulation (HiLS) is an effective tool to evaluate the design and performance of a
newly developed vehicle subsystem like ABS (Kimbrough et al., 1996). The HiLS
couples the computer model with physical hardware in real-time. With regards to the
HiL system, real ABS hardware can interact with the software vehicle model, which
permits complex phenomena to be investigated for the implementation of ABS in a
vehicle without testing on a real vehicle. This saves ABS development time and reduces
costs while at the same time facilitating greater flexibility.

39
Figure 2.26 HIL ABS test rig
Damiano et al. (2009) proposed a hardware in the loop ABS test bench, as seen in
Figure 2.26. A dSPACE simulator is used to generate a control signal and transmit it to
the actual brake system. The feedback to the simulator is provided via signals from the
on-board sensors. To use the dSPACE system, Matlab/Simulink is usually used for
vehicle modelling.
2.7. Conclusion from literature review
Due to the non-linear nature of vehicle and tyre dynamics, most vehicle longitudinal
speed estimation methods may not be sufficiently accurate in different circumstances. A
vehicle longitudinal acceleration sensor can provide a good aid to the vehicle
longitudinal speed estimation. Due to the limitations of sensor technology, the direct
measurement of vehicle longitudinal speed remains difficult. Niche sensors used to
measure vehicle longitudinal speed, like radar and GPS, are too expensive to implement
on production vehicles.
Control parameters and a control phase switch mechanism other than vehicle
longitudinal speed or slip ratio should be established. In a straight-line braking situation,
the wheel longitudinal deceleration and wheel angular acceleration against time plots
can be studied to determine their relationship at optimal slip ratio. The wheel angular
acceleration curve may be affected by the effective tyre rolling radius, so the wheel
longitudinal deceleration and wheel angular acceleration relationship may not be robust

40
enough to function successfully as a control phase switch mechanism. The wheel
longitudinal deceleration rate and the wheel angular acceleration rate relationship could
form the basis of a solution as they would allow the effective tyre rolling radius to be
eliminated from the process. The linear relationship between tyre longitudinal braking
force and the slip ratio within the stable brake region could be used in the analysis of the
relationship between the wheel longitudinal deceleration rate and the wheel angular
deceleration rate.
The rule based control approaches, such as the Bosch ABS, are too complex. But the so-
called hybrid control method that based on the combination of the slip ratio and the
wheel angular acceleration control rule has great advantages. As the hybrid control
phases switch control method is simple and robust it will be the focus of future research.
The hybrid, two-phase ABS control method proposed by Mathieu et al. (2010) is
promising. It uses wheel angular acceleration as a control parameter. It also uses
measured tyre longitudinal force as the control phases switch mechanism, but this
approach might be impractical as the smart wheel used to measure the force is
expensive and hard to implement on a production vehicle. It is not desirable to fit two or
four heavy wheels that are equipped with various types of electronic components on a
standard road car. The smart wheel also experiences difficulties with wireless data
transmission, sensor power supply and sensor durability, as large amounts of force are
experienced by the sensor. Finally, if this control switch method is implemented, a low
friction surface ABS control method would have to be developed to overcome the
aforementioned limitations.
More and more advanced sensors are now available to measure the vehicle dynamics
and the environment. Sensor fusion is a good method which effectively integrates the
measurements from different sensors, along with Kalman based filters that clean the
polluted measurement signals. But sensor implementation on a production vehicle must
follow the optimal cost to performance ratio rule. An advanced but expensive sensor
should not be used, unless it offers significant performance improvement.
Nonlinear dynamic vehicle and tyre models could arguably be good substitutes for a
real vehicle experiment test, especially in complex vehicle manoeuvre simulations. But

41
the balance between simplicity and accuracy should be considered in the model
selection. In the developed ADAMS vehicle model, due to the need for real test
representative tyre road interaction during complex vehicle manoeuvres, the non-linear
dynamic Magic Formula tyre model is implemented.
As summary, a hybrid ABS control method that uses wheel angular acceleration and
any possible in-wheel sensor measurement information is going to be proposed in this
research. The proposed ABS should be less complex than the commercialised ABS, and
it should be more practical than the pure theoretical ABS. A representable ADAMS
vehicle model with a Matlab Simulink control model that represents the hybrid control
method is going to be used to test the proposed ABS control method.

42
3. Vehicle Modelling & Simulation Set Up
The proposed method to develop and test an ABS control method in this research is
simulation based. In order to establish an appropriate simulation environment, a
representative vehicle model that can simulate the complex tyre and road interaction in
parallel with vehicle body, suspension system and tyre interaction must be established.
The vehicle model must include a detailed brake disk and pad implantation model. The
emergency braking environment must also be established.
Analyses of the physical and mathematical aspects of basic braking and an emergency
braking scenario are used to establish these models. Initial simulations based on the
established models are also carried out to achieve a thorough simulation environment
for the purposes of this research.
3.1. ADAMS Model Simulation
3.1.1. The Vehicle Model
The vehicle model used in this research is based on a Subaru Impreza. The model was
first built in the code-based dataset file (adm) format and the Fiala tyre model was
implemented. But due to the limitations described in the previous literature review, the
more complex Magic Formula tyre model is required to simulate the tyre slip effect and
the generation of related forces. The implementation of the Magic Formula tyre model
in the dataset file (adm) format model is very difficult due to the large amount of data it
involves. Accordingly, the vehicle model was rebuilt in command file (cmd) format to
implement the Magic Formula tyre model. Figure 3.1 provides a detailed view of the
model.
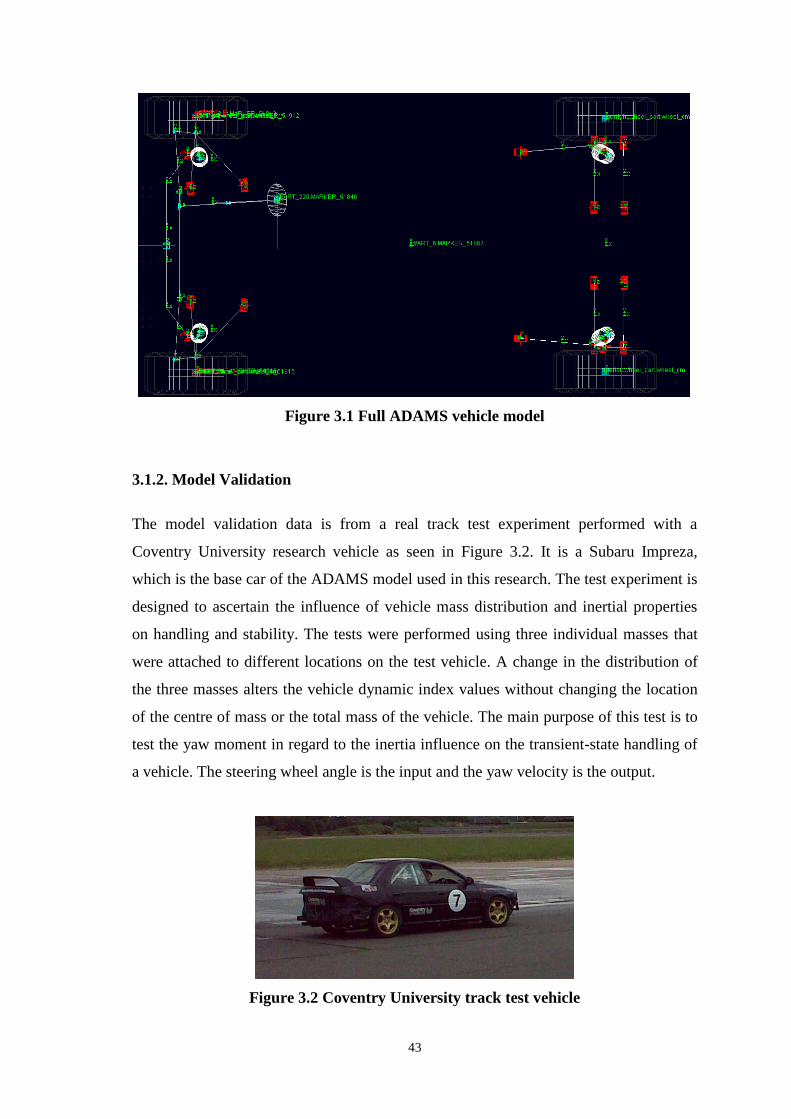
43
Figure 3.1 Full ADAMS vehicle model
3.1.2. Model Validation
The model validation data is from a real track test experiment performed with a
Coventry University research vehicle as seen in Figure 3.2. It is a Subaru Impreza,
which is the base car of the ADAMS model used in this research. The test experiment is
designed to ascertain the influence of vehicle mass distribution and inertial properties
on handling and stability. The tests were performed using three individual masses that
were attached to different locations on the test vehicle. A change in the distribution of
the three masses alters the vehicle dynamic index values without changing the location
of the centre of mass or the total mass of the vehicle. The main purpose of this test is to
test the yaw moment in regard to the inertia influence on the transient-state handling of
a vehicle. The steering wheel angle is the input and the yaw velocity is the output.
Figure 3.2 Coventry University track test vehicle
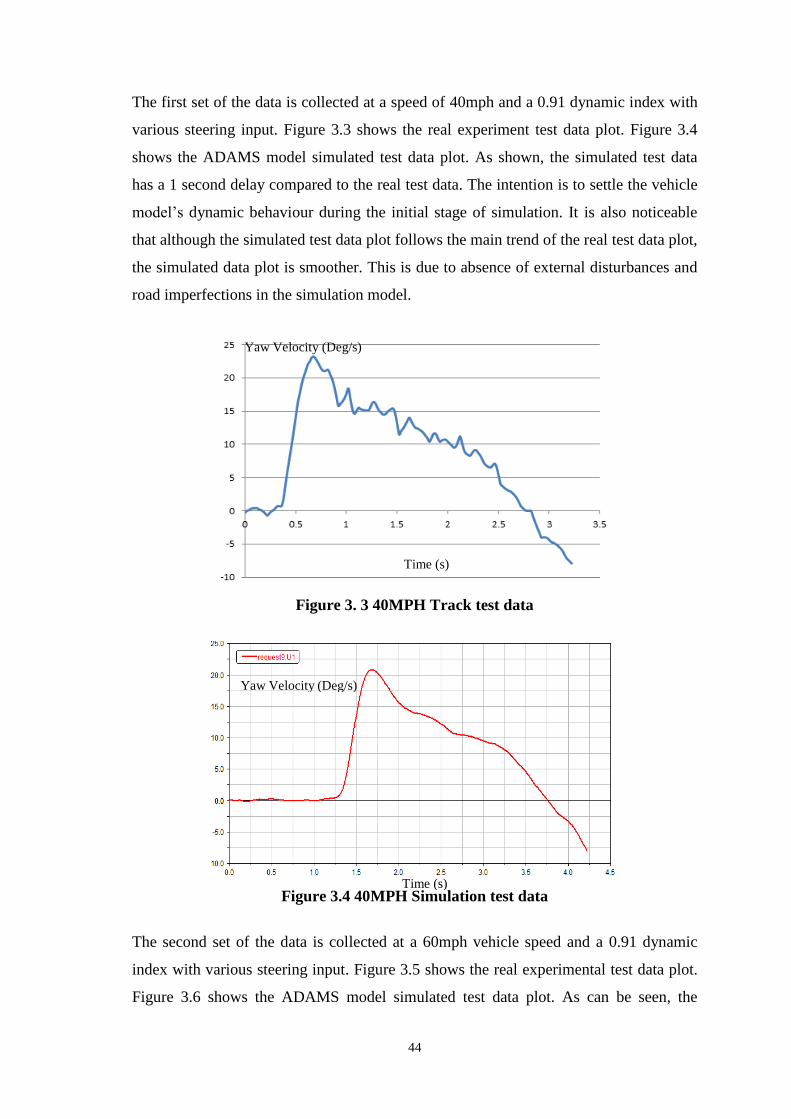
44
The first set of the data is collected at a speed of 40mph and a 0.91 dynamic index with
various steering input. Figure 3.3 shows the real experiment test data plot. Figure 3.4
shows the ADAMS model simulated test data plot. As shown, the simulated test data
has a 1 second delay compared to the real test data. The intention is to settle the vehicle
model’s dynamic behaviour during the initial stage of simulation. It is also noticeable
that although the simulated test data plot follows the main trend of the real test data plot,
the simulated data plot is smoother. This is due to absence of external disturbances and
road imperfections in the simulation model.
Figure 3. 3 40MPH Track test data
Figure 3.4 40MPH Simulation test data
The second set of the data is collected at a 60mph vehicle speed and a 0.91 dynamic
index with various steering input. Figure 3.5 shows the real experimental test data plot.
Figure 3.6 shows the ADAMS model simulated test data plot. As can be seen, the
Time (s)
Time (s)
Yaw Velocity (Deg/s)
Yaw Velocity (Deg/s)
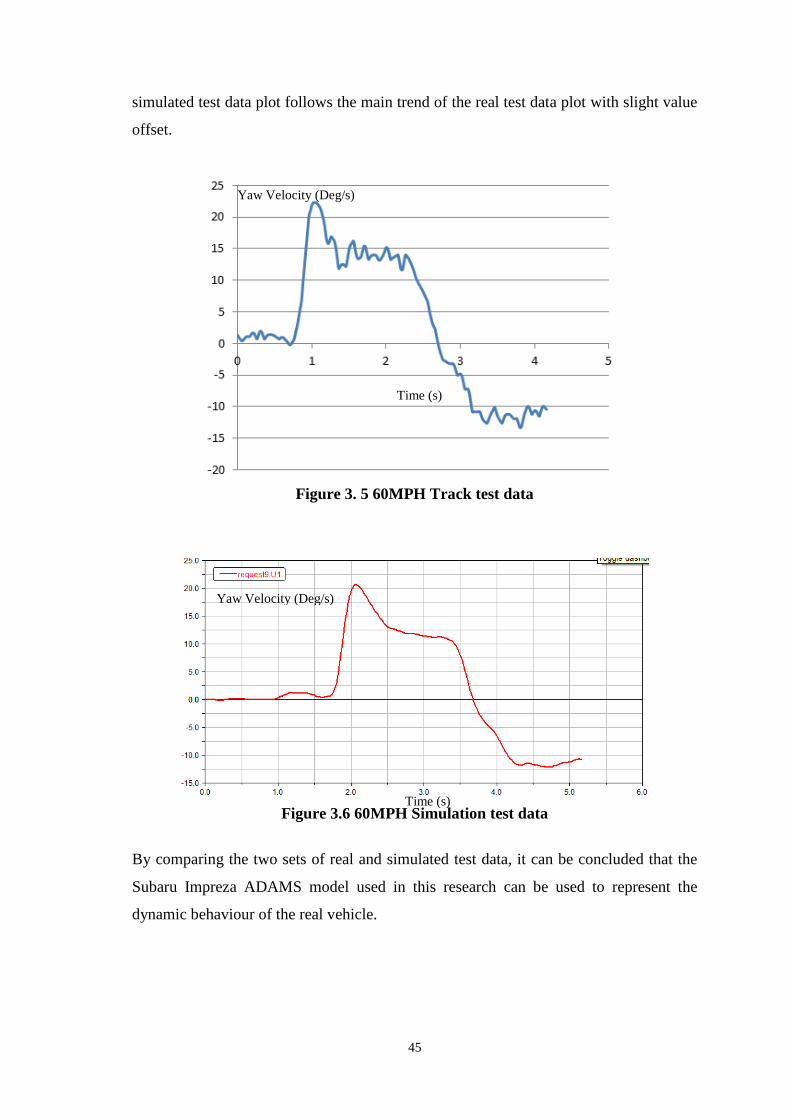
45
simulated test data plot follows the main trend of the real test data plot with slight value
offset.
Figure 3. 5 60MPH Track test data
Figure 3.6 60MPH Simulation test data
By comparing the two sets of real and simulated test data, it can be concluded that the
Subaru Impreza ADAMS model used in this research can be used to represent the
dynamic behaviour of the real vehicle.
Time (s)
Time (s)
Yaw Velocity (Deg/s)
Yaw Velocity (Deg/s)

46
3.2. Simulation Set Up
3.2.1. Braking Physics
During the braking process, there are two important braking forces. The first braking
force is generated by the brake system, which is in turn generated between the brake
disk and the brake pad and is called the disk-pad braking force. The second braking
force is a transmitted force whereby the disk-pad braking force is transmitted to the road
surface through the tyre. It is called tyre-road braking force.
3.2.1.1. Disk-pad braking force physics
Figure3.7 Brake force physics
As seen in Figure 3.7, the force transmitted to the brake pad by the brake piston is
represented by equation3.1. The frictional force between the brake disk and the brake
pad is represented by equation3.2. The brake torque is represented by equation3.3.
Table 3.1 explains the parameters presented in the equations.
Fp = P*A (3.1)
Fb=Fp*µ*n (3.2)
Tb = Fb *Rd (3.3)
Brake Disk
Brake Torque
Tb
Distance Rd
Brake Force Fb Break Pad

47
Fp The force transmitted by
brake piston. Tb The braking torque.
Fb The force between brake disk
and brake pad. P The brake pressure.
A The area of brake piston. µ The friction coefficient
between brake pad and disk
n The number of brake pad Rd Brake pad to wheel center
distance
Table 3.1 Disk-pad braking force physics related parameters
The brake system converts the kinetic energy of the vehicle to thermal energy (heat) via
the brake disk, brake pads and other related parts. Most of the generated heat dissipates
into the environment. Some of the excess heat that cannot be dissipated will build up,
and the resulting increase in heat will influence the disk-pad braking performance.
3.2.1.2. Tyre-road braking force physics
Figure 3.8 Wheel free body diagram during braking
As seen in Figure 3.8, Fx is the braking force between the tyre and the road surface, and
it is a frictional force. The equation 3.4 is the friction equation. The value of Fx mainly
depends on the tyre-road friction coefficient 𝜇 and the tyre vertical load force𝐹𝑧. There
are static and sliding frictional forces. For the same tyre on the same road surface the
static tyre-road friction force is generally higher than the sliding tyre-road friction force.
During the braking process, the tyre-road friction transitions into the total sliding
friction (wheel fully locked) from the static friction (when disk-pad braking force is just
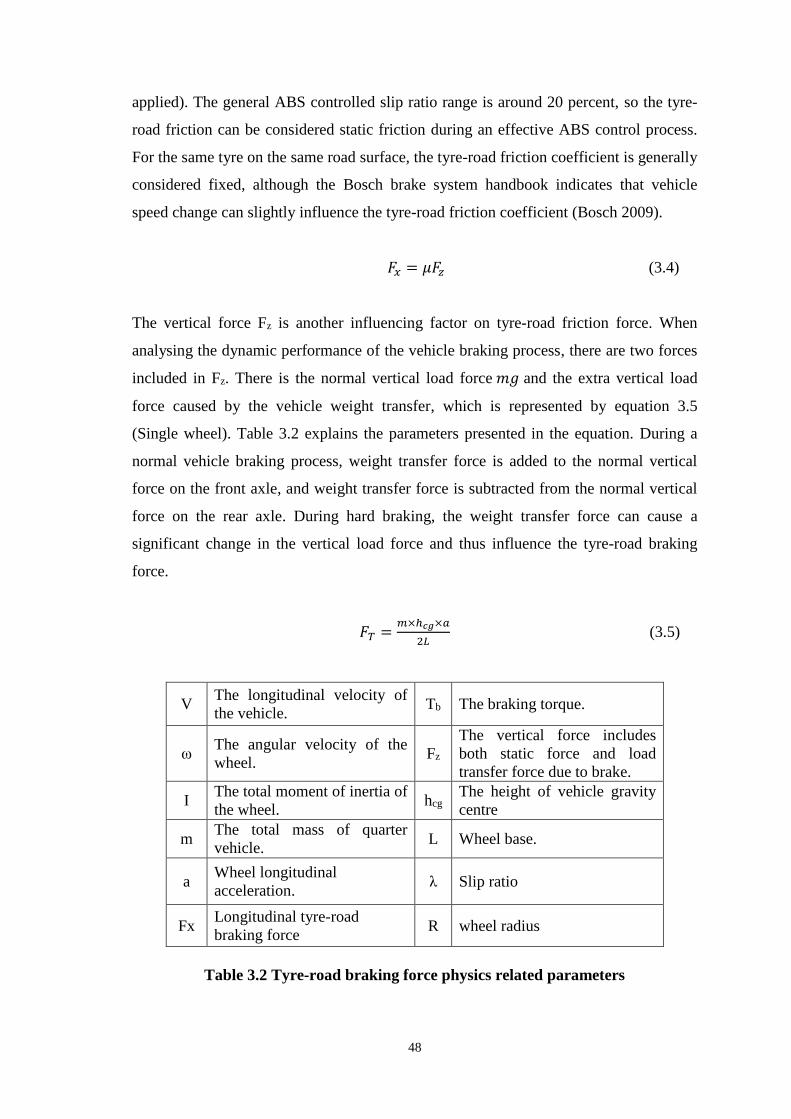
48
applied). The general ABS controlled slip ratio range is around 20 percent, so the tyre-
road friction can be considered static friction during an effective ABS control process.
For the same tyre on the same road surface, the tyre-road friction coefficient is generally
considered fixed, although the Bosch brake system handbook indicates that vehicle
speed change can slightly influence the tyre-road friction coefficient (Bosch 2009).
𝐹𝑥 = 𝜇𝐹𝑧 (3.4)
The vertical force Fz is another influencing factor on tyre-road friction force. When
analysing the dynamic performance of the vehicle braking process, there are two forces
included in Fz. There is the normal vertical load force 𝑚𝑔 and the extra vertical load
force caused by the vehicle weight transfer, which is represented by equation 3.5
(Single wheel). Table 3.2 explains the parameters presented in the equation. During a
normal vehicle braking process, weight transfer force is added to the normal vertical
force on the front axle, and weight transfer force is subtracted from the normal vertical
force on the rear axle. During hard braking, the weight transfer force can cause a
significant change in the vertical load force and thus influence the tyre-road braking
force.
𝐹𝑇 =𝑚×ℎ𝑐𝑔×𝑎
2𝐿 (3.5)
V The longitudinal velocity of
the vehicle. Tb The braking torque.
ω The angular velocity of the
wheel. Fz
The vertical force includes
both static force and load
transfer force due to brake.
I The total moment of inertia of
the wheel. hcg
The height of vehicle gravity
centre
m The total mass of quarter
vehicle. L Wheel base.
a Wheel longitudinal
acceleration. λ Slip ratio
Fx Longitudinal tyre-road
braking force R wheel radius
Table 3.2 Tyre-road braking force physics related parameters

49
3.2.2. Analysis Based on Basic Physics
As stated previously, the tyre-road braking force depends on its vertical force, the road
surface friction coefficient and the slip ratio. During initial hard braking, the tyre-road
braking force and the disk-pad braking force increase simultaneously, but there is a
point beyond which the tyre-road braking force cannot increase any further. Regardless,
the disk-pad braking force continues to increase, the two forces resulting torques are
shown in Figure 3.9. This tyre-road braking force behaviour is usually related to the tyre
slip ratio as seen in Figure 3.10. The maximum tyre-road braking force is generated at
the optimal slip ratio. After passing the optimal slip ratio, the tyre-road braking force
starts to decrease and the wheels lock up quickly. At the same time, the tyre lateral force
generation capability decreases continually, so the steering performances are
compromised. Disk-pad braking force is usually designed with a higher capability than
variable tyre-road braking forces in order to cope with various braking situations.
Figure 3.10 Tyre-road braking force characteristics on different road surfaces
Tt-r
Time
Td-p
Tt-r
Td-p
Td-p=Tt-r
Tt-r max
0
Torque
Figure 3.9 The two braking forces resulted torque characteristic
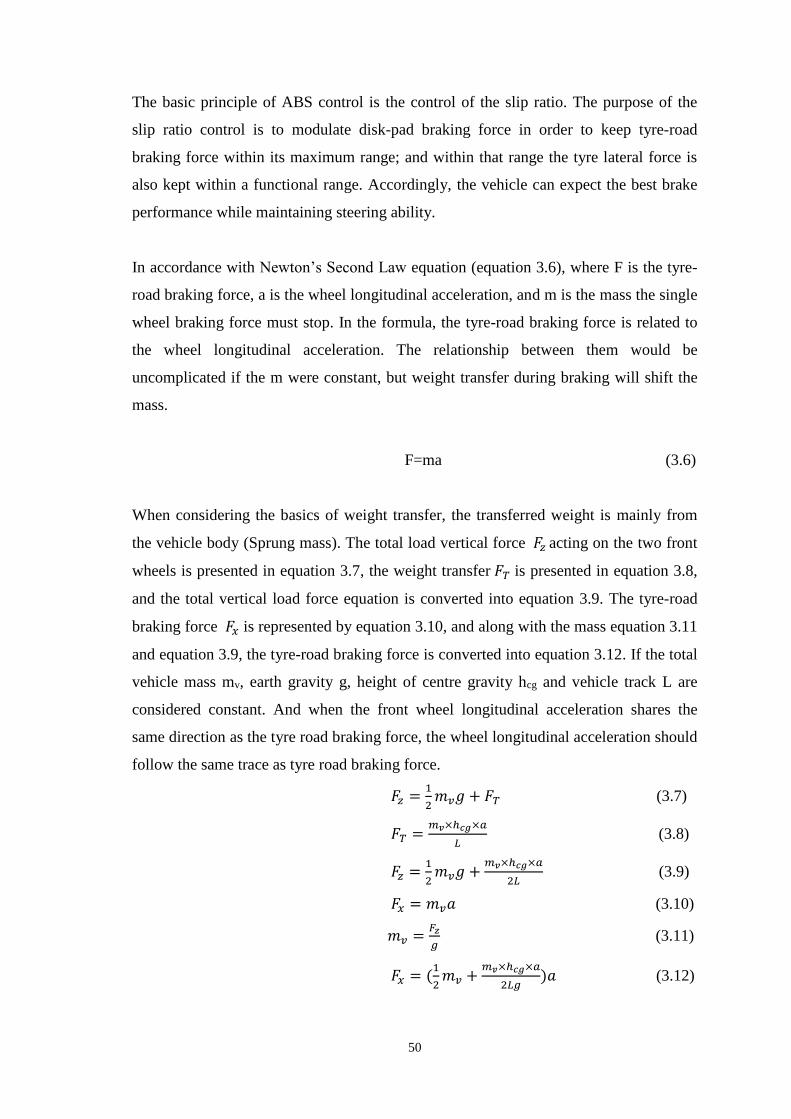
50
The basic principle of ABS control is the control of the slip ratio. The purpose of the
slip ratio control is to modulate disk-pad braking force in order to keep tyre-road
braking force within its maximum range; and within that range the tyre lateral force is
also kept within a functional range. Accordingly, the vehicle can expect the best brake
performance while maintaining steering ability.
In accordance with Newton’s Second Law equation (equation 3.6), where F is the tyre-
road braking force, a is the wheel longitudinal acceleration, and m is the mass the single
wheel braking force must stop. In the formula, the tyre-road braking force is related to
the wheel longitudinal acceleration. The relationship between them would be
uncomplicated if the m were constant, but weight transfer during braking will shift the
mass.
F=ma (3.6)
When considering the basics of weight transfer, the transferred weight is mainly from
the vehicle body (Sprung mass). The total load vertical force 𝐹𝑧 acting on the two front
wheels is presented in equation 3.7, the weight transfer 𝐹𝑇 is presented in equation 3.8,
and the total vertical load force equation is converted into equation 3.9. The tyre-road
braking force 𝐹𝑥 is represented by equation 3.10, and along with the mass equation 3.11
and equation 3.9, the tyre-road braking force is converted into equation 3.12. If the total
vehicle mass mv, earth gravity g, height of centre gravity hcg and vehicle track L are
considered constant. And when the front wheel longitudinal acceleration shares the
same direction as the tyre road braking force, the wheel longitudinal acceleration should
follow the same trace as tyre road braking force.
𝐹𝑧 =1
2𝑚𝑣𝑔 + 𝐹𝑇 (3.7)
𝐹𝑇 =𝑚𝑣×ℎ𝑐𝑔×𝑎
𝐿 (3.8)
𝐹𝑧 =1
2𝑚𝑣𝑔 +
𝑚𝑣×ℎ𝑐𝑔×𝑎
2𝐿 (3.9)
𝐹𝑥 = 𝑚𝑣𝑎 (3.10)
𝑚𝑣 =𝐹𝑧
𝑔 (3.11)
𝐹𝑥 = (1
2𝑚𝑣 +
𝑚𝑣×ℎ𝑐𝑔×𝑎
2𝐿𝑔)𝑎 (3.12)

51
3.2.3. Brake Manoeuvring Simulation
3.2.3.1. Braking Time
As described in the European Union vehicle safety regulations, the vehicle braking
system actuation time, which is the time it takes to reach 10% of the maximum designed
braking pressure should be less than 0.2 seconds, and 75% of the maximum designed
braking pressure should be reached within 0.4 seconds, and should not take more than
0.6 seconds.
The braking time in this research means the period from the first effective disk-pad
braking force application until the maximum designed braking force is reached. The
braking time varies in different situations and with regards to different physical brake
system designs. The typical braking time range found in the references will be used as a
guideline for the simulation.
Figure 3.11 Driver brake time
As seen in Figure 3.11, the brake time splits into three phases. Phase one is the reaction
time, which includes eye detecting time, brain reacting time, and foot force
implementation time. The second phase is the braking force build up. The third phase is
the maximum braking force holding time. This research focuses on braking force
interaction in phase two. This facilitated the discovery that the maximum designed
braking force can be reached in 0.3 seconds during emergency braking.

52
Figure 3.12 Typical slip ratio to time curve under various speeds
Figure 3.12 shows a typical slip ratio to time curve during the emergency braking
process at different vehicle longitudinal speeds. As shown, in a typical emergency
braking process when initial vehicle speed is 80km/h, the typical optimal slip ratio
(10%-25%) could be reached in 0.56 to 0.63 seconds.
Based on all the above information the simulation disk-pad braking force build up time
range is set between 0.3-0.6 seconds, but this will be adjusted to meet the purpose of the
test during the simulation.
3.2.3.2. Braking force
According to the braking force versus slip ratio theory when the optimal slip ratio is
passed the tyre-road braking force should start to reduce. This means that a further
increase in the disk-pad braking force after the optimal slip ratio is reached will cause a
drop in the tyre-road braking force. As mentioned in the literature review, this drop
action could be used to switch the control phase in ABS control.
During braking, the natural interaction between the tyre and the road is very complex,
but simulating this complex interaction properly is a key goal of this research. Therefore,
a real scenario representative disk-pad braking force simulation is required. The origin
of the disk-pad braking force acts between the wheel knuckle and the wheel, and its
final output format is a torque. Accordingly, in order to achieve a natural interaction
between the tyre and the ground, a rotational torque, which acts between the wheel
knuckle and the wheel centre is used to simulate disk-pad braking torque.

53
Based on Newton’s Second Law equation as seen in equation 3.6, F is the braking force
required in order to stop the test vehicle travelling at a certain speed within a predefined
distance; m is the total kerb weight of the test vehicle, and a is the vehicle acceleration,
which is negative when braking. The kerb weight of the vehicle, m is 1071.2kg, which
was calculated using the ADAMS model.
Figures 3.13 and 3.14 indicate typical braking distances during emergency braking
when a vehicle is travelling at a specified speed in both dry and wet road conditions. If
the vehicle initial speed Vi is derived from the two figures, the final speed Vf will be
zero as the vehicle stops, and the braking distance S is derived from the two figures.
The equation 3.12 which describes the relationship between vehicle speed, braking
distance and longitudinal acceleration, can be used to calculate the longitudinal
acceleration a. The converted equation is 3.13. If the chosen initial speed Vi is 60km/h,
which equals 16.67m/s, the braking distance on a dry road S is 21.4m (only the braking
distance is of interest as the simulation focuses on the braking process). The average
longitudinal deceleration a is 6.49m/s2.
𝑽𝒇𝟐 = 𝑽𝒊
𝟐 + 𝟐𝒂𝑺 (3.13)
𝒂 =𝑽𝒇
𝟐−𝑽𝒊𝟐
𝟐𝑺 (3.14)
Figure 3.13 Dry road braking distance

54
Figure 3.14 Wet road braking distance
When substituting a and m in equation 3.6, F equals 6952N. This is the total braking
force required between the tyre and road surface to bring the vehicle to a full halt when
travelling at 60km/h, within a distance of 21.4m on a dry road.
The tyre-road braking force then needs to be split between the front and rear axles in a
ratio that is due to the weight transfer resulting from the braking manoeuver. In the
simulation, a typical passenger vehicle dry road braking force distribution ratio of 60%
at the front, and 40% at the rear is used. In this case, the front axle braking force is
4171N and the rear axle braking force is 2781N. When distributed between the two
wheels on each axle, each front wheel is subjected to a braking force of 2085.5N, and
each rear wheel is subjected to a braking force of 1390.5N.
Due to the nature of factors like braking force distribution and vehicle weight transfer,
which impact during a manoeuver, the disk-pad braking force generated tyre-road
braking forces are different on the front and rear axle. In order to simplify the
simulation process and to study each of the wheel’s forces, speed, acceleration and slip
ratio during braking, a full braking force will be applied on one axle at a time. The
wheels on the same axle are assumed to share the same braking force properties.
Individual wheel forces and the acceleration interaction is of interest in this research.

56
As the data provided in the above references is representative of typical test data, the
simulation in this research may not exactly represent the same test environment and
vehicle properties. Therefore, the calculated braking force could only be used as
guidance. The trial and error method should be employed to ascertain the proper disk-
pad braking force, which can bring the tyre-road braking force up to its peak value
within the simulation.
3.2.3.3. Braking torque
The full tyre-road braking force required on the front axle is 6952N, which divided by
two wheels means that the braking force on each front wheel is 3476N. To convert the
tyre-road braking force to the braking torque, which is applied to the centre of the wheel,
the braking force is multiplied by the rolling radius of the wheel R. In the ADAMS tyre
model data, the unloaded tyre radius is 0.3169m, but the rolling radius is slightly
different. To establish the rolling radius, the vehicle model was taken for a 5 second test
run, and the average rolling radius was found to be 0.307m. Accordingly, the braking
torque applied to the centre of the wheel is 3476 × 0.307 = 1067Nm , and this torque
could be used as guidance for the minimum disk-pad braking torque applied to the
wheel centre by the brake system. As discussed previously, the disk-pad braking torque
must have a greater capability than the tyre-road braking torque generation capability of
a tyre. Based on the trial and error method and considering the calculated guidance disk-
pad braking torque, 1050Nm will be used as start disk-pad braking torque, then 50Nm
will be added to each new simulation set up to ascertain the influence of each different
maximum disk-pad braking torque on the tyre-road braking torque. This will facilitate
an over braking scenario for ABS activation.
3.2.4. The Simulation Test Establishments
As discussed previously, the simulation disk-pad braking torque build up time will be
set between 0.6s and 0.3s. Each new simulation set up adds a 0.1s increment to the test
braking time, and in every simulation set up several different disk-pad braking torques
are tested. The centre wheel disk-pad braking torque will be set around 1050Nm as a
minimum, then 50Nm will be added to each new simulation set up, while the braking

57
time will remain the same. The maximum test disk-pad braking torque will be decided
during the test.
During the first 1 second of the simulation no braking torque is applied in order to allow
the model’s initial dynamic motion to settle. Therefore, a clear difference can be seen in
the data trace once the braking torque is applied.
In the first simulation, where the disk-pad braking torque build up time is set to 0.6s the
trial and error method is used to discover if the calculated guidance disk-pad braking
torque is sufficient. The initial test disk-pad braking torque is lowered to 950Nm to get
a better overview of how different disk-pad braking torques influence the tyre-road
braking force. The test results show that at a 1050Nm disk-pad braking torque or below,
the tyre-road braking force trace does not show any significant drop action This
indicates there is no over braking, which can trigger ABS control. So in a further test,
1050Nm will be confirmed as the minimum applied disk-pad braking torque. There is
another force, which is in the same orientation as the tyre-road braking force, but on the
wheel hub’s revolute joint (which represents wheel bearing on a real vehicle) is of
interest in this research in terms of establishing how accurately it could represent tyre-
road braking force trace. Accordingly, the revolute joint force trace is taken during
simulation.
Table 3.3 and 3.4 summarise maximum tyre-road braking force, optimal slip ratio, and
the maximum wheel revolute joint force of the Subaru vehicle model during straight
line emergency braking on a dry road (with the maximum disk-pad braking torque and
its build up time as established above).

58
Simulation results data
Braking Time
Braking Torque
1.9-2.5s (0.6s)
2.0-2.5s (0.5s)
1050Nm
2.484s→ F=3315.9529N
Slip Ratio = 23.12%
2.484s Revolute joint force
reaches max: 3301.6631N
2.493s→ F=3319.5234N
Slip Ratio = 22.75%
2.494s Revolute joint force
reaches max: 3305.9522N
1100Nm
2.448s→ F=3323.1114N
Slip Ratio = 25.58%
2.448s Revolute joint force
reaches max: 3309.8805N
2.457s→ F=3327.1842N
Slip Ratio = 23.72%
2.458s Revolute joint force
reaches max: 3313.7639N
1150Nm
2.421s→ F=3326.9076N
Slip Ratio = 26.9%
2.421s Revolute joint force
reaches max: 3313.6061N
2.439s→ F=3332.7916N
Slip Ratio = 26.46%
2.439s Revolute joint force
reaches max: 3319.8015N
1200Nm
2.394s→ F=3330.6258N
Slip Ratio = 25.71%
2.394s Revolute joint force
reaches max: 3318.1225N
2.421s→ F=3337.0556N
Slip Ratio = 27.42%
2.421s Revolute joint force
reaches max: 3324.9239N
1250Nm
2.376s→ F=3333.1541N
Slip Ratio = 26.35%
2.376s Revolute joint force
reaches max: 3320.9901N
2.403s→ F=3340.9393N
Slip Ratio = 26.98%
2.403s Revolute joint force
reaches max: 3329.2016N
1300Nm
2.358s→ F=3335.0216N
Slip Ratio = 25.82%
2.358s Revolute joint force
reaches max: 3323.2501N
2.385s→ F=3342.9307N
Slip Ratio = 25.21%
2.385s Revolute joint force
reaches max: 3332.0293N
Table 3.3 Tyre-road braking force characteristic under different disk-pad braking
torque A
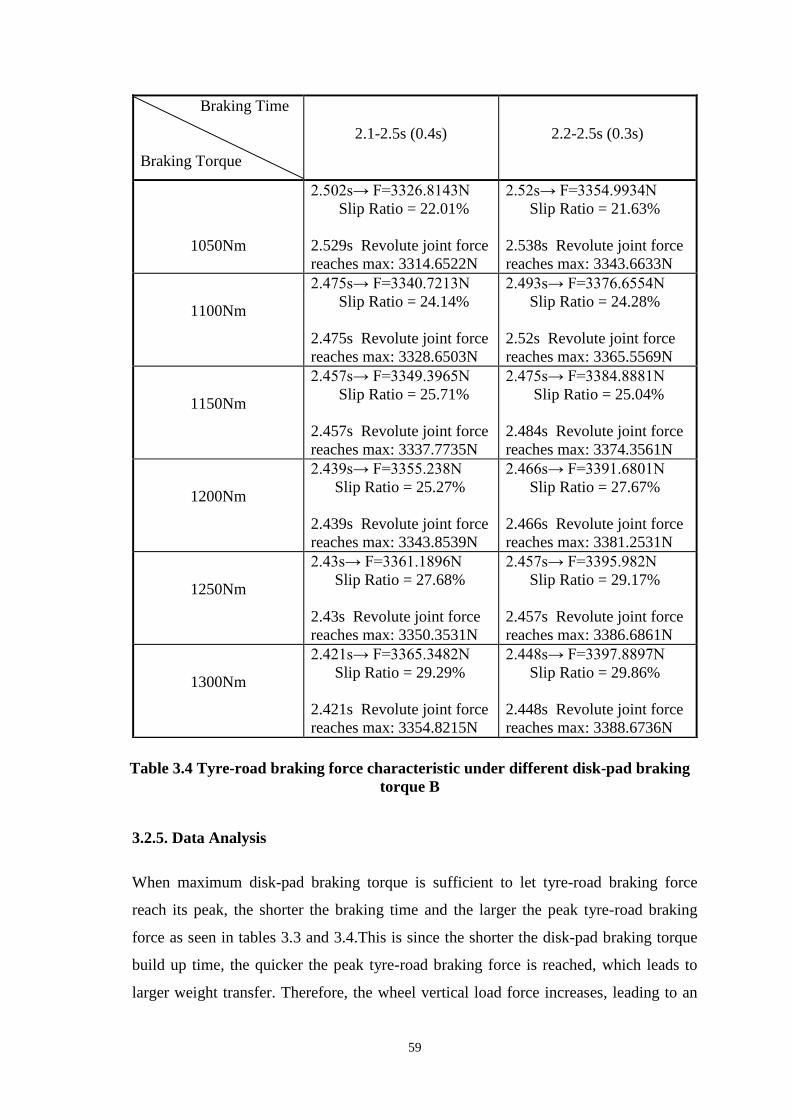
59
3.2.5. Data Analysis
When maximum disk-pad braking torque is sufficient to let tyre-road braking force
reach its peak, the shorter the braking time and the larger the peak tyre-road braking
force as seen in tables 3.3 and 3.4.This is since the shorter the disk-pad braking torque
build up time, the quicker the peak tyre-road braking force is reached, which leads to
larger weight transfer. Therefore, the wheel vertical load force increases, leading to an
Braking Time
Braking Torque
2.1-2.5s (0.4s)
2.2-2.5s (0.3s)
1050Nm
2.502s→ F=3326.8143N
Slip Ratio = 22.01%
2.529s Revolute joint force
reaches max: 3314.6522N
2.52s→ F=3354.9934N
Slip Ratio = 21.63%
2.538s Revolute joint force
reaches max: 3343.6633N
1100Nm
2.475s→ F=3340.7213N
Slip Ratio = 24.14%
2.475s Revolute joint force
reaches max: 3328.6503N
2.493s→ F=3376.6554N
Slip Ratio = 24.28%
2.52s Revolute joint force
reaches max: 3365.5569N
1150Nm
2.457s→ F=3349.3965N
Slip Ratio = 25.71%
2.457s Revolute joint force
reaches max: 3337.7735N
2.475s→ F=3384.8881N
Slip Ratio = 25.04%
2.484s Revolute joint force
reaches max: 3374.3561N
1200Nm
2.439s→ F=3355.238N
Slip Ratio = 25.27%
2.439s Revolute joint force
reaches max: 3343.8539N
2.466s→ F=3391.6801N
Slip Ratio = 27.67%
2.466s Revolute joint force
reaches max: 3381.2531N
1250Nm
2.43s→ F=3361.1896N
Slip Ratio = 27.68%
2.43s Revolute joint force
reaches max: 3350.3531N
2.457s→ F=3395.982N
Slip Ratio = 29.17%
2.457s Revolute joint force
reaches max: 3386.6861N
1300Nm
2.421s→ F=3365.3482N
Slip Ratio = 29.29%
2.421s Revolute joint force
reaches max: 3354.8215N
2.448s→ F=3397.8897N
Slip Ratio = 29.86%
2.448s Revolute joint force
reaches max: 3388.6736N
Table 3.4 Tyre-road braking force characteristic under different disk-pad braking
torque B

60
increase in peak tyre-road braking force. It is noticeable that when the disk-pad braking
torque build up time decreases by around 50% the peak tyre-road braking force only
increases by about 1.2%(1050Nm), 1.6%(1100Nm), 1.7%(1150Nm), 1.8%(1200Nm),
1.9%(1250Nm), and 1.9%(1300Nm). This demonstrates the influence of braking time
change on peak tyre-road braking force.
When the maximum disk-pad braking torque build up time remains the same, the larger
the disk-pad braking torque and the larger the peak tyre-road braking force. This is also
caused by the increase in the wheel vertical load force (in turn explained by the larger
weight transfer). It is noticeable that when disk-pad braking torque increases by about
23.8%, the peak tyre-road braking force only increases by about 0.6%(0.6s), 0.7%(0.5s),
1.2%(0.4s), and 1.3%(0.3s). This demonstrates the influence of disk-pad braking torque
change on peak tyre-road braking force.
Based on the above information, it could be concluded that the shorter the maximum
disk-pad braking torque build up time and the larger the maximum disk-pad braking
torque, the larger the peak tyre-road braking force. But the difference in the overall peak
tyre-road braking force is relatively small.
Although the peak revolute joint force and the peak longitudinal tyre-road braking force
are always reached at the same time, there is a noticeable difference between the two
forces. The shorter the disk-pad braking torque build up time or the larger the applied
disk-pad braking torque, the smaller the difference between the two forces. This could
be because the effects of the bushes connecting the wheel knuckle to the vehicle body
have been minimised. A low disk-pad braking torque coupled with a short braking time
may not change the motion of the wheels fast enough due to wheel inertia and hysteresis.
Either by increasing disk-pad braking torque or by decreasing braking time to a certain
level, or by changing both, the difference between peak revolute joint force and peak
longitudinal tyre-road braking force decrease can be achieved. In the real brake system
design, the disk-pad braking torque generation capability should always be sufficient.
In an overview of the simulation results seen in tables 3.3 and 3.4, all the data shows
that the revolute joint force reaches its peak value at the same time as the tyre-road

61
longitudinal braking force reaches its peak value. But there is a noticeable difference
between the two values of the respective forces. Accordingly, the force measurement
within the revolute joint could represent the trend of the real tyre-road longitudinal
braking force, but it may not fully represent the value of the tyre-road longitudinal
braking force.
3.2.6. Simulation Data with Regards to Various Vehicle Speeds
The influences of different test vehicle speeds on the ABS control characteristics has
been discussed in much of the literature. Therefore, simulations with different test
vehicle speeds are carried out to see how the various speeds influence the peak tyre-
road longitudinal braking force and the peak longitudinal revolute joint force
characteristic. A typical 0.4s disk-pad braking torque build up time and a 1200Nm disk-
pad braking torque are used as non-change parameters in the simulations. The 85km/h,
75km/h, 55km/h, and 45km/h test simulations are carried out and the results data is
shown in table 3.5.
1200Nm @ 0.4s A
85Km/h 2.448s→ Max force F=3362.6745N
2.448s Revolute joint force reaches max:
3352.2256N
75Km/h 2.448s→ Max force F=3358.6026N
2.448s Revolute joint force reaches max:
3347.6001N
65Km/h 2.439s→ Max force F=3355.238N
2.439s Revolute joint force reaches max:
3343.8539N
55Km/h 2.439s→ Max force F=3352.6287N
2.439s Revolute joint force reaches max:
3340.2353N
45Km/h 2.439s→ Max force F=3346.4081N
2.439s Revolute joint force reaches max:
3332.7332N
35Km/h 2.431s→ Max force F=3343.5567N
2.430s Revolute joint force reaches max:
3330.1576N
Table 3.5 Tyre-road braking force characteristic under initial vehicle speed
62
As shown, the peak tyre-road braking force change caused by the differences in vehicle
speed is not significant. In conclusion, the peak revolute joint force and the peak tyre
longitudinal braking force are reached at the same time at different vehicle test speeds.
A noticeable difference between the two forces presents in all simulations. The lower
the testing speed, the bigger the difference in force.
Consequently, the force measurement within the wheel hub at the revolute joint which
connects the wheel and wheel knuckle could be useful in the development of a new
ABS control method. Although there is an offset between the measured force and the
real tyre-road braking force, it has been shown to represent the trend of the tyre-road
braking force. If an adequate control method is implemented to adopt the property of the
measured revolute joint force, a less complex ABS control method with a high level of
performance could be achieved.
3.3. Conclusion
This chapter established a validated ADAMS vehicle model for ABS control method
development test simulation. A range of model parameters are established and tested to
stimulate various emergency braking scenarios which the tested ABS control method is
then exposed to. The wheel hub revolute joint longitudinal force measurement is proved
to be a good representation of tyre-road braking force in different simulations. The ABS
control method proposed in the next chapter can implement this force measurement to
improve the control efficiency.

63
4. Control Method Development
In order to develop a practical ABS control method, the commercialised ABS methods
(Bosch and Wabco) are analysed and their advantages are made use of. Neither very
detailed instructions on how these methods work nor analyse of them is found in any of
the literature. In this research an analysis of these instructions is provided based on
extensive understanding of brake physics and tyre road interactions.
4.1. Analysis of Bosch ABS control method
Figure 4.1 Bosch ABS control characteristics
As seen in Figure 4-1, during initial braking, a short sharp drop at the beginning of the
wheel angular acceleration curve diagram can be observed. The sharp drop then settles
to a relatively stable value, although it varies slightly from time to time within the stable
brake zone. This deceleration indicates a delay between the application of the disk-pad
braking torque and the effective generation of tyre-road braking torque. This delay is
due to the tyre hysteresis that the tyre needs time to generate forces physically, as shear

64
stress builds up between the tyre rubber in the contact patch and the road surface. At the
same time, the brake disk and pad work on a shorter time-scale and more efficiently
build up a higher force. While the brake process continues, the disk-pad braking torque
increases continuously within the stable braking zone before the optimal slip ratio is
reached, and the tyre-road braking torque increases at the same rate as the disk-pad
braking torque, maintaining balance between them. However, as mentioned previously,
there is a lag between the two braking torques during their build-up process. This
difference is caused by the lag, and it is presented as a negative wheel angular
acceleration. The absolute value of negative wheel acceleration is relatively constant,
although there is a slight increase over time. The increase is more obvious when the
tyre-road braking torque is approaching the optimal slip ratio. This is because the rate of
the increase in the tyre-road braking torque decreases when approaching the optimal
slip ratio. Meanwhile, the rate of the increase of the disk-pad braking torque is
maintained. After the optimal slip ratio is reached, the tyre-road braking torque can no
longer rise, irrespective of how much further the disk-pad braking torque increases as
seen in Figure 4.2. At this moment, the relatively stable balance between the two
braking torques is broken and a sharper increase in the absolute value of the negative
wheel acceleration is observed in phase 1 (Figure 4.1). As the difference between the
two braking torques increases further, the absolute value of the negative wheel
acceleration increases further. This further increase is due to the combined effect of the
changes in the two braking torques (i.e. while one is increasing the other is decreasing).
The rate at which the absolute value of the negative wheel angular acceleration
increases depends on the individual rate of the change in the two braking torques.
Theoretically, the moment that the balance between the two braking torques is broken,
the absolute value of the negative wheel angular acceleration will suddenly increase
sharply. At this point, it can be concluded that the optimal slip ratio has then been
reached.
In reality however, due to the measurement noise, nonlinear dynamics of the tyre and
brake system, and the lack of accurate tyre-road braking torque information, the optimal
slip ratio cannot be confirmed until other related parameter thresholds are reached. The
Bosch ABS withholds this confirmation until point ‘-a’, which is indicated in the middle
graph in Figure 4.1. This is based on previous tuning experience and an understanding

65
of the specified test vehicle’s tyre-road dynamics, which is obtained in experimental
tests. This is one of the most difficult tuning points to establish. In the Bosch text book,
it is stated that the optimal slip ratio represented by wheel angular acceleration point ‘-a’
might be reached within the stable brake zone. That could mean three things.
Firstly, it requires initial accuracy determination. So during its first control cycle, in the
second control phase, there is a brake pressure hold action to confirm that the tyre-road
braking torque is in the currently determined state (i.e. decreasing). Secondly, this could
mean that on a medium to low friction coefficient surface, even before the optimal slip
ratio is reached, the tyre-road braking torque has reached a similar value to its value at
the optimal slip ratio point. Thirdly, it could mean that the disk-pad brake efficiency
increases due to the increase in temperature during braking, which causes disk-pad
braking torque increases much faster than the tyre-road braking torque, especially when
the tyre-road braking torque is approaching its peak value. If the tyre-road braking
torque measurement is available, then the drop in the tyre-road braking torque can
confirm that the unstable braking zone has been reached. The optimal slip ratio
confirmation by holding disk-pad braking torque in Bosch ABS can be saved so that the
peak tyre-road brake torque can be maintained more efficiently.
Figure 4.2 Disk-pad and tyre-road braking torque interaction
The Bosch ABS control method has to determine the reference wheel peripheral speed
and reference wheel peripheral speed decrease slope (gradient) in the first control cycle
and then use them as further control references in the next ABS control cycle. Once the
full ABS control kicks in, the wheel angular speed sensor measured data may not be
used to determine the reference wheel peripheral speed, which represents the wheel

66
peripheral speed when optimal slip ratio is maintained while braking. In the Bosch text
book (Robert Bosch GmbH, 2009), it states the reference peripheral speed is measured
at the beginning of the ABS control phase, before the ABS control fully kicks in. It uses
the measurements of two diagonally opposed wheels, and the faster one is used as a
reference speed. The measurement time can be an uncertainty. It is stated that this is at
the beginning of ABS control before the ABS control fully kicks in, but it is not known
if this is at 1 second or 2 seconds.
However, there is a predefined parameter; the optimal slip ratio representative wheel
angular acceleration point. The correct understanding is that when the predefined
optimal slip ratio representative wheel angular acceleration point is reached, the ECU
takes the measurements of the wheel angular speed sensor from the two diagonally
opposed wheels and chooses the faster one as the reference speed. Accordingly, during
the initial ABS control cycle, at the negative wheel angular acceleration point ‘-a’,
which represents optimal slip ratio, the currently determined wheel peripheral speed is
defined as the current reference wheel peripheral speed. Due to the nature of braking,
the reference wheel peripheral speed will decrease. Therefore, the Bosch ABS has to
determine the rate of the decrease in the reference wheel peripheral speed in ideal brake
conditions, in which the exact optimal slip ratio is maintained, as seen in Figure 4.3.
As discussed previously, due to the difficulties involved in accurately determining the
optimal slip ratio, the Bosch ABS delays its confirmation of it, and at this point the
reference wheel peripheral speed is determined by the value of the wheel peripheral
speed. Since the optimal slip ratio representative ‘-a’ has been delayed, the decrease
slope in the corresponding wheel peripheral speed (negative wheel angular acceleration)
may steepen, so it may not be able to represent the decrease slope in the reference wheel
peripheral speed accurately. Other complex prediction methods have been used to
compensate for the offset. The Bosch ABS algorithm determines the decrease slope by
analysing the relative logical relationships extracted in experiment tests (Robert Bosch
GmbH, 2009), which make it extremely difficult to tune.

67
Figure 4.3 Vehicle and wheel speed characteristics under ideal ABS control
During control phase 2 of Bosch ABS, as seen in Figure 4.1, it uses the reference
peripheral speed and measured wheel angular speed to calculate the slip ratio threshold
λ1 while holding the disk-pad braking torque to validate the accuracy of the optimal slip
ratio representative negative wheel angular acceleration point, ‘-a’, it is also to confirm
the optimal slip ratio point has been passed. Due to the combination of the threshold λ1
validation procedure and the fact that the Bosch ABS already delays the optimal slip
ratio confirmation point, further effort must be taken to reduce the offset effect, so the
optimal slip ratio can be restored more efficiently. This could cause instability within
the control cycle in some fast peak tyre-road braking torque recovery demand
circumstances.
In the Bosch ABS, after λ1 is passed, the disk-pad braking torque is decreased in order
to restore the optimal slip ratio. Since the absolute value of the negative wheel angular
acceleration continues to increase, the brake state enters an unstable zone. The wheel
tends to lock very quickly, so the disk-pad braking torque is decreased very
significantly to bring the wheel angular acceleration into positive territory. This
facilitates an increase in the wheel peripheral speed to avoid the risk of the wheel
locking and brings the brake state back into a stable zone to restore the peak tyre-road
braking torque. From the slip ratio equation, it is known that the increase in the
difference between the wheel longitudinal speed and the wheel peripheral speed
calculated from the wheel angular speed causes the increase in the slip ratio. Therefore,
after the optimal slip ratio point is reached a further increase in the difference between
these two speeds pushes the slip ratio further from its optimal value. As long as the

68
difference between the two braking torques causes the absolute value of the negative
wheel angular acceleration to increase, the difference between the two speeds will
continually increase until the wheel locks, unless negative wheel angular acceleration is
reduced to a lower level than negative wheel longitudinal acceleration (and this state is
maintained for a certain time).
However, the most efficient and safest way of restoring the optimal slip ratio is to bring
the wheel angular acceleration to a positive value quickly, allowing the difference
between the two speeds to be reduced quickly and efficiently. As mentioned previously
during the disk-pad braking torque decrease action, the disk-pad braking torque
responds more efficiently towards the control action than the tyre-road braking torque.
This is supported by the data from the wheel angular acceleration curve of the Bosch
ABS during the disk-pad braking torque hold action in phase 4. This means that even
when the disk-pad braking torque is reduced below the peak tyre-road braking torque
point, the tyre-road braking torque itself still has to wait for a certain period to get back
to the level. If the ABS control wants to bring the tyre-road braking torque to its peak
point quickly, it has to reduce the disk-pad braking torque to a lower level than the peak
tyre-road braking torque point.
During the first decrease control phase of the Bosch ABS, the disk-pad braking torque is
decreased by ‘∆Pab’ calculated torque, and then it is held at the level. It is noticeable that
after the second control cycle, the level of the disk-pad braking torque decrease is less
than ‘∆Pab’ which is because the calculation phase for the optimal slip ratio
confirmation point λ1 is unnecessary. Since the disk-pad braking torque decrease is very
significant, as soon as the negative wheel angular acceleration value increases back to ‘-
a’, the disk-pad braking torque is held without a further decrease. As seen in Figure 4.4,
even in the hold state, the disk-pad braking torque has been decreased to a relatively
low level, which allows the tyre-road braking torque to switch to its increase state.
While the disk-pad braking torque is in its hold state and the tyre-road braking torque is
in its increase state, the difference between the two braking torques becomes smaller.
As such, the absolute value of the negative wheel angular acceleration continuously
decreases, then it changes to positive.

69
As discussed, the positive angular acceleration can decrease the difference between the
two speeds and lead back towards the optimal slip ratio. A positive angular acceleration
means that the disk-pad braking torque level is below the tyre-road braking torque level,
as seen in Figure 4.5. It is usually considered ideal to maintain the hold state of the disk-
pad braking torque to further increase the positive wheel acceleration until the optimal
slip ratio is achieved. But due to a possible initial delay in the disk-pad braking torque
hold action and a delay in the tyre dynamic reaction to the control input, even if the
disk-pad braking torque were in the hold state, it could have already experienced an
over-decrease. Therefore, the hold state continues until ‘A’ on the wheel angular
acceleration curve is reached. The ‘A’ point is the upper limit of the positive wheel
angular acceleration. It represents the pre-defined threshold of the difference between
the two braking torques when approaching the optimal slip ratio.
The rate in the decrease of the disk-pad braking torque is an important tuning parameter.
If it is set to decrease as quickly as the Bosch ABS, or even faster, the hold action start
point should not be any greater than the negative wheel angular acceleration ‘-a’ in
control phase 3. If, at the same rate of decrease, the hold state is set to be active until
zero-wheel angular acceleration or even a positive wheel angular acceleration, it could
compromise control performance due to an over-decrease in disk-pad braking torque. If
the disk-pad braking torque is set to decrease more slowly than the Bosch ABS, there is
a greater risk that the wheel will lock, unless the optimal slip ratio point is detected
earlier and the ABS control action kicks in sooner. After reaching ‘A’, the Bosch ABS
increases the disk-pad braking torque even before the next optimal slip ratio is reached,
which is due to the need to avoid a loss in tyre-road braking torque. This is because the
disk-pad braking torque has been decreased too much initially. If the tyre-road braking
torque information were available, better control performance could be achieved.

70
Figure 4.4 Disk-pad braking torque
control show case A
Figure 4.5 Disk-pad braking torque
control show case B
Bosch ABS holds the disk-pad braking torque again in phase 6 to confirm what is
happening to tyre-road braking torque. While the wheel positive angular acceleration is
continuously decreasing, it can be confirmed that the peak tyre-road braking torque has
been passed, so the Bosch ABS starts to increase the disk-pad braking torque in a
continuous increase-hold pattern. The purpose of this control action is to reduce
suspension vibration, and this is only after ABS initialisation.
There are some interesting properties shown in the Bosch ABS control curves. These
properties are shown in control phases 2, 5, and 8. The explanation of these properties
includes a consideration of the typical change in the status of the longitudinal tyre-road
braking force, and the properties of the interaction of the two braking torques during
ABS control. The properties shown in phases 2 and 8 are the same, even while the disk-
pad braking torque is being held or decreased. There is still a short increase in the
absolute value of negative wheel angular acceleration, which happens when the level of
the disk-pad braking torque is greater than the level of the tyre-road braking torque.
Theoretically in phases 2 and 8, as soon as the disk-pad braking torque starts to hold or
decrease, the tyre-road braking force should react to hold or increase. Since the disk-pad
braking torque is one of the main generators of tyre-road braking torque, a change in the
tyre-road braking torque should correspond with a change in the disk-pad braking
torque, as long as the vehicle longitudinal inertia force is considered steady.
However, due to this correspondence, combined with the physical braking system
actuation delay and the physical tyre dynamics limitation, the lag in the tyre-road
71
braking torque reaction to the disk-pad braking torque change is resulted. The content of
this lag depends on how fast the disk-pad brake torque is changing and its interaction
with the vehicle longitudinal inertia force and tyre properties. In the case of phases 2
and 8, the disk-pad braking torque starts to decrease when the tyre-road braking torque
is decreasing and the level of the disk-pad braking torque is much greater than the level
of tyre-road braking torque. At the beginning of the disk-pad braking torque decrease
action, due to the previously discussed reasons, tyre-road braking torque continues to
decrease. If the rate of the decrease in disk-pad braking torque is lower than the rate of
the decrease in tyre-road braking torque, then the decrease in both does not necessarily
result in decreased absolute wheel angular acceleration value. The tyre-road braking
torque change dynamics must be identified in order to define the disk-pad braking
torque application. This reaction time lag is obvious when the tyre-road braking torque
is in process of changing its state. After the reaction time lag, tyre-road braking torque
starts to increase and the absolute value of the negative wheel angular acceleration starts
to decrease.
As seen in control phase 5, in which the disk-pad braking torque is increasing, there is a
short increase in the wheel angular acceleration before it starts to decrease. This
happens when the level of the disk-pad braking torque is below that of the tyre-road
braking torque and the latter is in a state of increase. This could be explained by the
delay in the build-up of the disk-pad braking torque. Accordingly, tyre-road braking
torque increases at a higher rate than the disk-pad braking torque. This could also arise
from a delay in the response of the tyre-road braking torque or an over-decrease in the
disk-pad braking torque. Therefore, it appears that tyre-road braking torque cannot react
immediately to the disk-pad braking torque. Although, some research has criticised the
accuracy of this phenomenon, it arguably failed to consider the tyre-road braking torque
reaction state and the effect of the disk-pad braking torque change rate.
There are two reasons for describing the aforementioned properties above. One is that
many theoretical based ABS control methods ignore the reaction time lag of both
braking torques, especially when the change in the disk-pad braking torque is resulting
in state change of tyre-road braking torque. The second relates to how Bosch ABS
defines the rate of the change in the disk-pad braking torque. This definition, must be

72
established based on a good understanding of the physical tyre and ABS dynamics. This
is possible by carefully studying the interactions between the disk-pad braking torque,
the tyre-road braking torque, the vehicle longitudinal inertia force, and the tyre vertical
force.
4.2. Analysis of Wabco ABS control method
Figure 4.6 Wabco ABS control characteristic
In the Wabco ABS control cycle, shown in Figure 4.6, the braking pressure decreases
immediately after a sudden drop in wheel speed, which indicates a sudden increase in
the absolute value of the negative wheel angular acceleration. As discussed, typically, in
ABS control phase 1, the tyre-road braking torque increases with the disk-pad braking
force torque. Due to tyre hysteresis there is always a delay in the tyre-road braking
torque build-up process. As such, there is a difference between the tyre-road braking
torque and the disk-pad braking torque. The difference increases slightly within the
stable braking zone. Negative wheel angular acceleration results from the difference
between the two and indicates that the disk-pad braking torque has a higher value. Once
the peak tyre-road braking torque is passed the brake state enters the unstable zone. The
tyre-road braking torque decreases as the disk-pad braking torque increases. The

73
difference between them suddenly increases at a significant rate. Consequently, the
absolute value of the negative wheel angular acceleration increases sharply, and it can
be concluded that the Wabco ABS uses this sudden increase which could represent the
peak tyre-road braking torque, as the disk-pad braking torque decrease action trigger in
control phase 1. The sudden increase in the absolute value of the negative wheel angular
acceleration is predefined and was based on test data and tuning experience.
After the disk-pad braking torque decrease in control phase 1, the disk-pad braking
torque hold control is triggered shortly before or when the negative wheel angular
acceleration reaches zero. In this stage, the tyre-road braking torque is below its peak
value and it increases while the disk-pad braking torque is held. Initially, however, if
tyre hysteresis is considered there will be a delay in the response of the tyre-road
braking torque to the change in disk-pad braking torque. Considering the highly
efficient way in which disk-pad braking torque decreases, when it drops to the same
level as the tyre-road braking torque, the latter is just building up an increase. While the
disk-pad braking torque is held, the tyre-road braking torque continues to increase, and
therefore the positive wheel angular acceleration also increases (as long as positive
wheel angular acceleration is present the wheel peripheral speed increases). The rate of
the increase is represented by the value of the wheel angular acceleration. When the
tyre-road braking torque is approaching its peak, the rate of its increase slows. Once the
peak is reached, the value of the positive wheel angular acceleration stops increasing
and starts decreasing, and if the wheel angular acceleration is still positive, the wheel
peripheral speed will still increase.
However, due to the decrease in the positive wheel angular acceleration, the increase in
the wheel peripheral speed slows. When the tyre-road braking torque drops to the same
level as the holding disk-pad braking torque, the wheel angular acceleration hits zero.
At this point, the peak tyre-road braking torque has already been passed and this is
when the Wabco ABS starts to increase the disk-pad braking torque again. However, as
there is no simple tyre-road braking torque measurement method, the Wabco ABS
increases the disk-pad braking torque for a short while and then holds it to observe the
wheel peripheral speed and the wheel angular acceleration. This is done to observe the
tyre-road braking torque trace in control phase 1 indirectly. This increase and hold
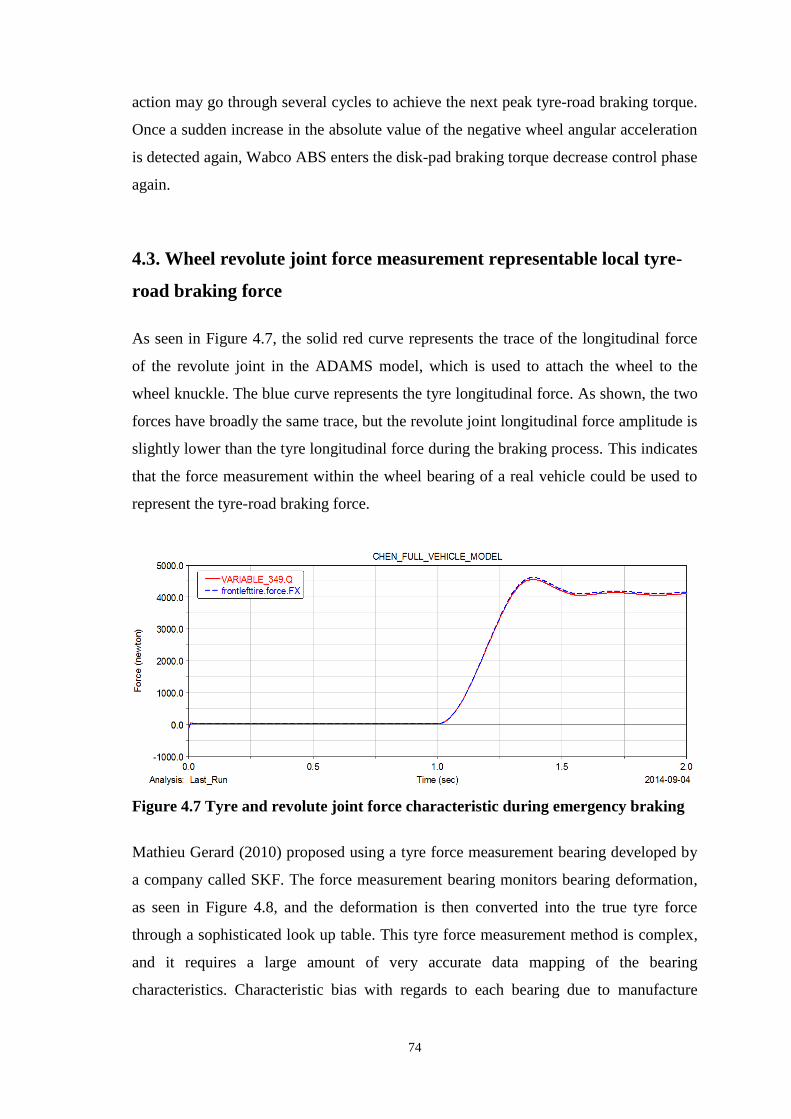
74
action may go through several cycles to achieve the next peak tyre-road braking torque.
Once a sudden increase in the absolute value of the negative wheel angular acceleration
is detected again, Wabco ABS enters the disk-pad braking torque decrease control phase
again.
4.3. Wheel revolute joint force measurement representable local tyre-
road braking force
As seen in Figure 4.7, the solid red curve represents the trace of the longitudinal force
of the revolute joint in the ADAMS model, which is used to attach the wheel to the
wheel knuckle. The blue curve represents the tyre longitudinal force. As shown, the two
forces have broadly the same trace, but the revolute joint longitudinal force amplitude is
slightly lower than the tyre longitudinal force during the braking process. This indicates
that the force measurement within the wheel bearing of a real vehicle could be used to
represent the tyre-road braking force.
Figure 4.7 Tyre and revolute joint force characteristic during emergency braking
Mathieu Gerard (2010) proposed using a tyre force measurement bearing developed by
a company called SKF. The force measurement bearing monitors bearing deformation,
as seen in Figure 4.8, and the deformation is then converted into the true tyre force
through a sophisticated look up table. This tyre force measurement method is complex,
and it requires a large amount of very accurate data mapping of the bearing
characteristics. Characteristic bias with regards to each bearing due to manufacture

75
machine accuracy, material bias, and so on could also cause difficulties in determining
the accurate value of the tyre forces. The SKF force measurement bearing is claimed to
be up to 90% accuracy. Mathieu Gerard proposed using the measured tyre force as a
critical parameter in the mathematical based ABS control method, but the nonlinearity
of each individual parameter in the proposed mathematical equations, such as the
vertical tyre force, the brake disk and pad friction coefficient, as well as the
measurement of the tyre longitudinal force (less than 100% accurate), could
compromise the calculated control disk-pad braking torque, which can result in
compromised performance of the ABS control method.
Figure 4.8 Bearing deformation simulation
However, based on all the above analysis, the force measured within the wheel hub
sensor (which might be a good representation of tyre-road braking force) could be used
as an important control reference parameter, not as an exact value but as a trace.
Practically, if the wheel bearing longitudinal force calibration can be carried out to
compensate its offset to tyre-road braking force, the exact wheel bearing longitudinal
force value could be used.
4.4. Discussion and inspiration
As guidance to develop the disk-pad braking torque control, the heuristic rule based and
the theory based ABS control methods are analysed. The heuristic rule based ABS
control methods that define many different non-related thresholds are defined and tuned
based on a large number of experiments which cost millions of pounds. The parameter
definition and tuning methods are based on complex rules and comprehensive
76
experiences. The theory based ABS control methods use full mathematical methods,
along with many assumptions, to compensate for their practical limitations (or practical
offsets). Learning from both these types of ABS control methods, and understanding
how disk-pad braking torque is controlled, is arguably a reasonable path to follow to
achieve the goal of this research.
4.4.1. Basic control pattern
The fundamental principle of ABS control is to modulate the disk-pad braking torque
(to achieve peak tyre-road braking torque). All the popular ABS control methods follow
similar basic control patterns, as seen in Figure 4.9. The control action ensures the slip
ratio cycles around the optimal slip ratio and within a limited range. Accordingly, the
tyre-road braking torque can be maintained around its peak range and the tyre-road
lateral force can be kept at an adequate level. The second phase of the control process is
when the slip ratio heads toward the optimal slip ratio while disk-pad braking torque is
increasing. The slip ratio then passes the optimal slip ratio and enters the unstable
braking zone. It continues further into the unstable braking zone until a predefined
threshold is reached. The first control phase is then activated. In the second control
phase, disk-pad braking torque decreases to bring the slip ratio back to the optimal slip
ratio. These two control phases are cyclical. Each individual ABS control method uses
its own thresholds and adds extra rules and control actions on the base pattern to
establish its own control pattern.
Figure 4.9 Control phase switch trigger
In the ABS control method proposed in this thesis, the same basic control pattern is
followed. The optimal slip ratio representative peak tyre-road braking torque is directly
77
detected by the in-wheel force sensor, so a process which determines the optimal slip
ratio point is unnecessary. This process of detection is continuous, therefore there is also
no need to determine the reference wheel peripheral speed or its decrease slope. The slip
ratio threshold λ1 validation procedure can also be removed from the list. Hence,
precious time can be saved in regard to the entire control process.
4.4.2. Definition of control cycle range
It is necessary to define the control cycle range and establish the predefined threshold
used to trigger each different control phase. In practice, ABS control cannot always
maintain the slip ratio at its exact optimal point. The control cycle is a range. Under
some circumstances, even after the optimal slip ratio is passed, the tyre-road braking
torque is still maintained at a similar value within a certain range of the slip ratio.
Therefore, even if the optimal slip ratio is confirmed, in order to make the maximum
use of the available tyre-road braking torque, a delay in the control action is desirable.
This is demonstrated in the typical longitudinal tyre-road braking force to slip ratio
diagram in Figure 4.10. On the curves, the slope is sharper on the left-hand side of the
optimal slip ratio than the right-hand side. If the same time interval is taken on these
curves, the tyre-road braking torque drops further on the left-hand side than the right-
hand side, so range B is preferable to range A. There are two other important reasons
for allowing the slip ratio to pass its optimal point; firstly, to reduce the sensor
measurement noise effect, and secondly to avoid control difficulties caused by the very
tight control cycle. With regards to the latter, the control actuator delay and controlled
plant (tyre) reaction delay could lead to instability. Further increases in the slip ratio
after the optimal point is reached are desired in practice, however, they must be retained
within a limited range.

78
Figure 4.10 Tyre-road braking force characteristic analysis beyond optimal slip
In the proposed ABS control method in this thesis, control range B is implemented.
Therefore, the drop in the percentage of the peak tyre-road braking torque on both sides
of the peak point is used to define the control cycle range. The position of range B on
the curve suggests that the drop in the two percentage values should be similar. These
two values are two tuning parameters, which shall be determined in a future simulation.
4.4.3. Wheel angular acceleration control reference
During the first control phase of the proposed ABS control method (when the peak tyre-
road braking torque is passed) while the slip ratio and disk-pad braking torque are
increasing, the tyre-road braking torque is decreasing. It is desirable to quickly and
effectively decrease the disk-pad braking torque in order to change the decrease state of
the tyre-road braking torque and allow it to increase back to its peak value. But a
reference parameter is required to determine when to stop the decrease in the disk-pad
braking torque. The wheel angular acceleration can be used as the reference parameter,
but the effects brought about by the greater build-up efficiency of the disk-pad braking
torque over the tyre-road braking torque must be considered. As discussed previously,
in the first control phase of Bosch ABS the disk-pad braking torque decreases so fast
that the tyre-road braking torque cannot react immediately ( due to the resulting changes
in tyre hysteresis). A predefined wheel angular acceleration reference point which
considers such delays can be used to limit the extent of the decrease in disk-pad braking

79
torque. Consequently, the wheel angular acceleration reference point in addition to a
rules based ABS control method are proposed on this research.
4.4.3.1. An explanation of wheel angular acceleration control based on physics
Both the Bosch and Wabco ABS introductions state that the wheel angular acceleration
represents the difference between the tyre-road braking torque and the disk-pad braking
torque. The change in the behaviour of the wheel angular acceleration is used to observe
the behaviour of the tyre-road braking torque when the disk-pad braking torque is in the
hold state. For example, when the disk-pad braking torque is being held, if the positive
wheel angular acceleration is increasing, it can be concluded that the tyre-road braking
torque is also increasing (if the change in the disk-pad friction coefficient caused by the
change in temperature is isolated as a variable).
The change in the behaviour of the wheel angular acceleration is also used to observe
the interaction between the two braking torques when the current state of both braking
torques is confirmed by the ABS control phase. For example, in the slip ratio increase
control phase (when the disk-pad braking torque is increasing), if wheel angular
acceleration stays at a similar value, it can be concluded that the tyre-road braking
torque is increasing at the same rate as the disk-pad braking torque. And if the absolute
value of wheel angular acceleration is slowly increasing, it can be concluded that the
tyre-road braking torque is increasing with the disk-pad braking torque increase, but at a
lower rate. The relationship between the wheel angular acceleration represented disk-
pad braking torque and the tyre-road braking torque is accurate only when both braking
torques are in their true state. Tyre hysteresis causes a false tyre-road braking torque
state and the change in the brake disk and pad friction coefficient (due to temperature
change) causes a false disk-pad braking torque state. These effects must be considered
in the development of a new ABS control method, especially for rules based control.
But it is always true that wheel angular acceleration accurately represents the difference
between the disk-pad braking torque and the tyre-road braking torque, and this can be
used as an important reference to decide how the disk-pad braking torque should be
controlled. As the disk-pad braking torque is the resistance torque which acts against
rotating tyres, and the tyre-road brake torque is the propulsion torque which acts against
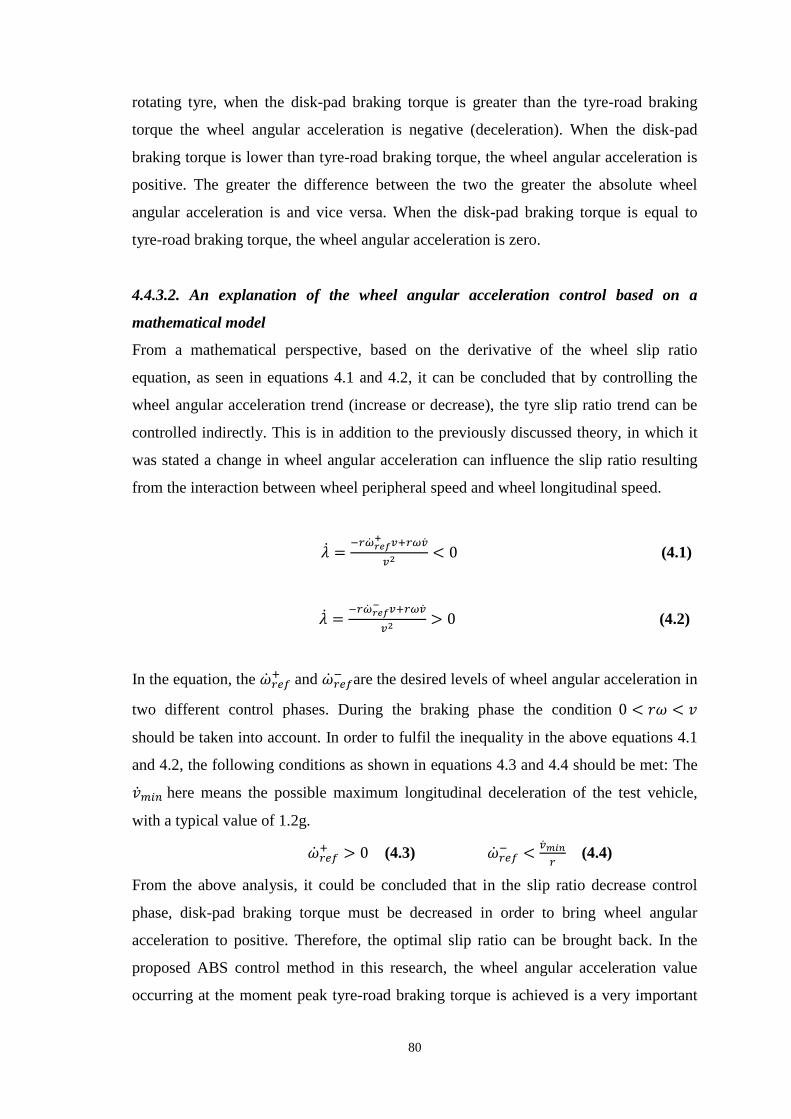
80
rotating tyre, when the disk-pad braking torque is greater than the tyre-road braking
torque the wheel angular acceleration is negative (deceleration). When the disk-pad
braking torque is lower than tyre-road braking torque, the wheel angular acceleration is
positive. The greater the difference between the two the greater the absolute wheel
angular acceleration is and vice versa. When the disk-pad braking torque is equal to
tyre-road braking torque, the wheel angular acceleration is zero.
4.4.3.2. An explanation of the wheel angular acceleration control based on a
mathematical model
From a mathematical perspective, based on the derivative of the wheel slip ratio
equation, as seen in equations 4.1 and 4.2, it can be concluded that by controlling the
wheel angular acceleration trend (increase or decrease), the tyre slip ratio trend can be
controlled indirectly. This is in addition to the previously discussed theory, in which it
was stated a change in wheel angular acceleration can influence the slip ratio resulting
from the interaction between wheel peripheral speed and wheel longitudinal speed.
�̇� =−𝑟�̇�𝑟𝑒𝑓
+ 𝑣+𝑟𝜔�̇�
𝑣2 < 0 (4.1)
�̇� =−𝑟�̇�𝑟𝑒𝑓
− 𝑣+𝑟𝜔�̇�
𝑣2> 0 (4.2)
In the equation, the �̇�𝑟𝑒𝑓+ and �̇�𝑟𝑒𝑓
− are the desired levels of wheel angular acceleration in
two different control phases. During the braking phase the condition 0 < 𝑟𝜔 < 𝑣
should be taken into account. In order to fulfil the inequality in the above equations 4.1
and 4.2, the following conditions as shown in equations 4.3 and 4.4 should be met: The
�̇�𝑚𝑖𝑛 here means the possible maximum longitudinal deceleration of the test vehicle,
with a typical value of 1.2g.
�̇�𝑟𝑒𝑓+ > 0 (4.3) �̇�𝑟𝑒𝑓
− <�̇�𝑚𝑖𝑛
𝑟 (4.4)
From the above analysis, it could be concluded that in the slip ratio decrease control
phase, disk-pad braking torque must be decreased in order to bring wheel angular
acceleration to positive. Therefore, the optimal slip ratio can be brought back. In the
proposed ABS control method in this research, the wheel angular acceleration value
occurring at the moment peak tyre-road braking torque is achieved is a very important

81
control reference. The reference value can be used to identify each of the two different
control phases, and ensure the correct control actions.
4.4.4. A detailed explanation of the interaction between the two braking torques
The delayed response of the tyre-road braking torque (caused by tyre hysteresis) to the
change in disk-pad braking torque, as well as the difference in change efficiency
between the two braking torques, are considered in the proposed control method. As
seen in Figure 4.11, the generation mechanisms of the tyre-road braking force requires
vehicle forward inertia (i.e. the force maintaining the forward motion of the wheel
regardless of whether it is rotating or not); the disk-pad braking force (wheel rotational
motion resistance force); the vertical tyre load force (tyre contact force with the road
surface); and friction property, which guarantees the friction force (the generation of
tyre-road braking force when there is slide action between tyre and road). When the
disk-pad braking force is applied the rotational motion of the wheel slows down.
Vehicle inertia tries to maintain a forward motion so that sliding occurs between tyre
and road. The vertical tyre force helps to maintain the physical contact between tyre and
road, so the friction force generated corresponds to the amount of slide action. On the
same friction coefficient road surface, the peak tyre-road braking torque should be
within a close range throughout the whole ABS control process. The largest influence
on the peak tyre-road braking torque difference is the change in wheel vertical force due
to weight transfer. But once the ABS control action kicks in, the weight transfer should
be roughly same, so the change in the value of wheel vertical force is relatively stable.
Figure 4.11 Wheel braking force free body diagram

82
4.4.5. Detailed discussion of disk-pad braking torque decrease control
In the first control phase of the proposed ABS control method, the desired range of the
decrease in disk-pad braking torque is between x and y, as seen in Figure 4.12. If the
disk-pad braking torque is decreased to a point above x, it could resist the effective
increase in tyre-road braking torque or even stop it from increasing back to its peak
value. If disk-pad braking torque is decreased to a point below y, the decrease could be
excessive and it could take longer to increase in the next control phase (pressure build-
up). If disk-pad braking torque is decreased to a point between x and y, depending on
how much further the tyre-road braking torque decreases below its peak value and how
long the excessive negative wheel angular acceleration lasts (this is to identify how
much further the wheel peripheral speed drops below its reference value), the decrease
in the value of the set disk-pad braking torque may vary, which causes complexity in
the development of the control method.
In order to slowly modulate the disk-pad braking torque to lead and match the change in
the tyre-road braking torque until the latter reaches its peak value, the disk-pad braking
torque control must be very accurate. Due to the uncertainties and nonlinearity involved
in the ABS control process, it is very difficult to achieve mathematical closed loop
point-to-point control. But by considering the combined effect of tyre hysteresis and
faster disk-pad braking torque change, a point ‘a’ on the tyre-road braking torque curve
(as shown in Figure 4.12) can be defined in order to simplify the control method. That
means the disk-pad braking torque is capable to decrease to the current tyre-road
braking torque level (‘a’) fast enough, while the response of tyre-road braking torque to
ABS control is delayed, so it still remains very close to ‘a’. At that very moment, wheel
angular acceleration becomes zero. The disk-pad braking torque then enters the hold
state until the next peak tyre-road braking torque is reached. The ‘a’ is the drop in
percentage of peak tyre-road braking force, and it must be able to maintain the optimum
balance between reducing the measurement noise effect, adapting the physical ABS
control system capability and achieving good control performance.

83
Figure 4.12 Disk-pad braking torque control show case C
4.4.6. Discussion and conclusion of overall control method
If only the revolute joint force measurement is used as a control parameter in the
proposed ABS control method, it is sufficient to detect the peak tyre-road braking force
and the related drop in percentage thresholds for control phase alternation points. But if
disk-pad braking torque is controlled according to the predefined peak tyre-road braking
torque drop percentage thresholds without consideration of other control reference
parameters, the thresholds may not be always accurate (due to the many uncertainties
involved), which can cause an issue that by the time the thresholds are reached the disk-
pad braking torque may have increased or decreased to such an extent that the expected
control performance cannot be achieved and ABS control failure results. The solution to
the problem is to schedule the predefined drop in the percentage of the tyre-road
braking force thresholds for different road surface friction coefficients in different
braking conditions, which requires implementing sophisticated braking conditions
clarification logic. However, this increases the complexity of the control algorithm
significantly and renders it unable to cope with the uncertainties and non-linearity
involved in the ABS control process.
If only wheel angular acceleration is used as control parameter, the difference between
the disk-pad braking torque and the tyre-road braking torque can be accurately
monitored. But if there is a combination of tyre hysteresis, a delay in control actuation,
and a lack of tyre-road braking torque information, even if the status of the disk-pad
braking torque can be confirmed, it might not be possible to confirm if the control
action is correct. Extra control logics and control phases have to be added in order to

84
confirm the real reaction of the tyre-road braking torque to the change in the disk-pad
braking torque. Other parameters such as the estimated reference wheel longitudinal
speed and the slip ratio must be used to ensure the control is adequate and accurate. The
Bosch and Wabco ABS fall into this category in that a significant number of
experiments must be carried out to calibrate and schedule different control parameters
along with the complex control logic, a process which is necessary to achieve good
ABS control performance.
Full scale and accurate calibration mapping of the different reference wheel angular
accelerations and the relative disk-pad braking torque control is required to cope with
every control point in various control conditions. Any mismatch or missing control
point clarification on the mapping could compromise performance and cause control
instability. In the case of a change in brake efficiency (caused by a change in
temperature between the brake disk and pad), extra logic and control action delay must
be implemented to cope with a possible misjudgement of the correct control action.
A control method based on the preceding discussion which uses wheel revolute joint
force measurement to represent tyre-road braking force for its local peak detection and
its drop percentage thresholds as the control phase alternation trigger, as well as
predefined wheel angular acceleration reference values that determine different control
actions, will be implemented in this research. The control method is rules based with
wheel angular acceleration control based on a mathematical model.
4.4.7. Detailed description of proposed ABS control method
The proposed control method will be exposed to an emergency braking situation in
which the vehicle is travelling over a speed threshold of over 5 miles per hour and the
driver applies the brake heavily. This could be determined by brake pedal application to
driver brake demand mapping, which is a look up table containing predefined brake
pedal travel distance and travel speed to braking torque demand. Once the measured
representative local tyre-road braking torque reaches its local peak value and starts to
decrease, the ABS control enters a ‘ready’ state. The wheel angular acceleration is
recorded at this moment for future control reference. Once the measured representative
85
local tyre-road braking torque drops to a predefined level (a percentage of the detected
peak value), the ABS control enters a ‘go’ state. During the ‘go’ state the ABS control
decreases the disk-pad braking torque by closing the inlet solenoid and opening the
outlet solenoid. The wheel angular acceleration is used as one of the control references
and a control reaction observation parameter. Once a new control phase has been
triggered, the previously recorded wheel angular acceleration value is used to identify
which control phase the ABS control is in. When this value is negative, it can be
concluded that ABS control is in a disk-pad braking torque increase phase. ABS control
should enter a disk-pad braking torque decrease phase. When it is positive it can be
concluded that ABS control is in a disk-pad braking torque decrease phase, and then
ABS control should enter a disk-pad braking torque increase phase. In control phase one,
the disk-pad braking torque decreases until wheel angular acceleration increases to zero.
Then the disk-pad braking torque enters a ‘hold’ state, both inlet and outlet solenoids
are closed, and the wheel angular acceleration and measured local representative tyre-
road braking torque are used to observe the effect of the disk-pad braking torque control
on the tyre-road braking torque. Once the measured representative local tyre-road
braking torque drops to the predefined level (as a percentage of the newly detected peak
value), and the reference wheel angular acceleration value determined control phase is
confirmed, ABS control increases disk-pad braking torque by opening the inlet solenoid
and closing the outlet solenoid.
To ensure that the correct solenoid is chosen, the priority is to confirm that the solenoid
actuated disk-pad braking torque change capacity is greater than the ordinary brake
system’s maximum (in an emergency brake situation) change capacity, especially when
in a disk-pad braking torque decrease control phase. A similar property can be found in
both Bosch and Wabco ABS, where in an emergency brake situation the disk-pad
braking torque decreases at its full capacity. In the proposed ABS control method, the
disk-pad braking torque decreases at the system’s maximum capacity.
86
4.5. Low friction surface control method
4.5.1. Estimation of road surface friction conditions
As mentioned in the literature review, the hybrid ABS control method has limitations on
low friction coefficient surfaces. As seen in Figure 4.13 there is no clear peak on the
tyre-road braking torque curve. Accordingly, the road surface friction condition should
be estimated first to overcome this limitation. The road surface friction condition
estimator does not have to be able to identify the exact friction coefficient, but it should
at least identify the low friction surface with no obvious peak tyre-road braking torque
characteristics in order to implement a different control strategy. If a well calibrated
look-up table of peak tyre-road braking force values on different friction coefficient
surfaces can be established, there is potential for the estimator to identify the road
surface friction coefficient.
Figure 4.13 Longitudinal coefficient of friction µ and lateral force versus slip ratio
curve (Kazemi et al., 2005).
4.5.2. A discussion of low friction surface ABS control method
As seen in Figure 4.13, on a low friction coefficient surface the tyre-road braking torque
reaches its peak value and stays at a relatively constant level once it passes the point
indicated by the red dot, which is called the peak split point. The peak split point is the
point which separates the tyre-road braking force’s increase slope and zero (or negative)
slope. The lateral force which can be generated by the tyre becomes the main control
target beyond this point. The peak split point is an important control parameter that
This item has been removed due to 3rd Party Copyright.This item has been
removed due to 3rd Party Copyright. The unabridged version of the thesis can be
found in the Lanchester Library, Coventry University
87
could be used in low friction surface detection and control. One possible peak split point
detection method is to identify a moment that the tyre-road braking torque has been at
zero or in a negative slope for a predefined time period. Once the peak split point is
detected, a relative ABS control action is triggered. But with this detection method,
precious control time could be wasted, which is critical, especially on a low friction
surface. Moreover, this method may have a problem detecting low friction surfaces with
a very small positive tyre-road braking torque slope. The adopted low friction surface
detection method will be described and discussed in the next chapter.
As tyre-road braking torque remains steady before reverting to the peak split point
(irrespective of change in disk-pad braking torque), wheel angular acceleration could be
more accurate in monitoring disk-pad braking torque behaviour. The effect of tyre
hysteresis effect could be amplified on a low friction surface. Overall tyre-road braking
torque is in its low range and its overall change rate is low. While disk-pad braking
torque remains at its full change capacity, it is more sensitive, so a moderate control
method should be adopted to avoid over control due to inaccurate tyre-road braking
torque state observation. Regular small steps in change should be a feature of it and a
hold action should be added to identify the true tyre-road braking torque trend.
One suggestion regarding low friction ABS control is to decrease disk-pad braking
torque to the same level as the steady peak tyre-road braking torque so wheel angular
acceleration reaches zero. If there were no decrease in tyre-road braking torque, which
would prevent the detection of the peak split point after a predetermined period of time
(that would provide sufficient time for it to overcome tyre hysteresis and react to the
change in the disk-pad braking torque). In such a scenario, a further decrease in the
disk-pad braking torque is required. The decrease control should be in a short pulse
format, and it would remain on until tyre-road brake force decreases, which would
allow the detection of the peak split point.
Another suggestion is that once the peak split point is detected (when disk-pad braking
torque is increasing), the ABS control decreases disk-pad braking torque immediately
until a pre-defined positive angular acceleration is achieved. Then ABS control would
enter a hold action. The pre-defined positive angular acceleration should represent disk-
88
pad braking torque just below the steady state peak tyre-road braking torque. The wheel
angular acceleration should also be relatively steady during the disk-pad braking torque
hold action. The brake hysteresis causes less trouble in this control phase, as the tyre-
road braking torque remains at a steady value after the peak split point. The tyre
hysteresis could cause problems while disk-pad braking torque is holding and tyre-road
braking torque is reverting to the peak split point. Therefore, the true tyre-road braking
torque change trend may not be observed (which is the case when the regular disk-pad
braking torque hold action is implemented). A sudden decrease in wheel angular
acceleration could indicate the presence of the peak split point in this control phase.
Negative angular acceleration is expected in next control phase as soon as the peak split
point is detected and disk-pad braking torque enters an increase state.
The first suggestion is advantageous in regard to maintaining the peak tyre-road braking
torque, but it could result in the lateral force control target being missed. The second
suggestion may result in a slight loss in available tyre-road braking torque, but it could
achieve efficient lateral force control.
4.6. A discussion of split-mu surface control
The split-mu ABS control is a higher-level control that runs by Electronic Stability
Program (ESP). The split-mu control uses the surface friction estimation method during
a braking event to clarify the road surface friction on both the left and the right sides of
the vehicle. The ABS control keeps the low friction side under the control of the low
friction ABS control method. On the high friction side, with the aid of a yaw rate sensor
and a steering wheel angle sensor from ESP, the driver steering intention can be
extracted from the steering wheel angle and its change speed; and the current vehicle
yaw motion can be measured by the yaw rate sensor. Then the disk-pad braking torque
is decreased in order to reduce the tyre-road braking torque so that it can match the low
friction surface side’s tyre-road braking torque according to the comparison between
driver’s demanded and the vehicle’s yaw motion. This control method could reduce the
unintended vehicle yaw motion to a safe level, so the vehicle stays controllable by the
standards of an average driver.

89
Apart from the surface friction estimation method, ABS control can compare the value
of the angular acceleration of the four wheels before the ABS control kicks in to
identify the split-mu condition. If the angular acceleration value of the left side wheels
is different from those on the right side, and the difference is over a pre-defined
threshold, then a split-mu brake condition could be identified. As such, it can be
concluded that the side with the higher absolute wheel angular acceleration value is on a
low friction surface and that it should be under the control of the low friction ABS
control method. The side with the lower absolute wheel angular acceleration value is on
a high friction surface and it should be controlled to match the value of tyre-road
braking torque on the low friction side.
4.7. Overview of the implementation of different ABS control methods
in different braking situations
There are a number of specific brake situations that the ABS must accommodate:
All four wheels are on a medium to high friction surface - Normal ABS.
All four wheels are on a low friction surface - Low friction surface ABS.
Left and right split: Two wheels on one side of the vehicle are on a medium to
high friction surface and the other two wheels are on a low friction surface –
Split-mu ABS low friction ABS on low friction side, which decreases disk-pad
braking torque on high friction side to match disk-pad braking torque on low
friction side (to restore reasonable yaw rate).
Front and back split: Two wheels are on a medium to high friction surface and
the other two wheels are on a low friction surface - Normal ABS for medium to
high friction surface, low friction ABS for low friction surface.
One wheel is on a medium to high friction surface and the other three wheels are
on low friction surface – Split-mu ABS.
One wheel is on a low friction surface and the other three wheels are on a
medium to high surface - Low friction ABS for low friction surface, normal ABS
for medium to high friction surface.
90
4.8. Conclusion
This chapter established a frame and detailed the contents of an ABS control method
based on an understanding of basic property of tyre forces generation mechanism and
accompanying scenarios of ABS controlled disk-pad braking torque and tyre-road
braking torque interaction (extracted from extensive analyses of commercialised ABS
control methods and related basic physics). A high friction, a low friction and a split-mu
ABS control methods are proposed and analysed. The detailed Simulink model of the
proposed control methods are presented in next chapter.

91
5. ABS Control Logic Development & Performance Analysis
5.1. Control logic model development
Based on the control method development discussion and summarisations in chapter 4,
a detailed Matlab Simulink control model is developed. This is shown in Figure 5.1.
Due to the complex nature of the control model, a clear full page version of the overall
model Figure is shown in landscape format and can be found in Appendix 1. A detailed
explanation of the individual subsystem of the control model is described and discussed
in this chapter.
5.1.1. Description and discussion of overall control logic model
Figure 5.1 Main ABS control logic model
Once the brake pedal is heavily and quickly applied at a vehicle speed of over 5mph, the
ABS is initiated. The first stage is to detect if the vehicle is travelling on a low or a high
friction coefficient road surface. The ABS then engages a low or high friction
coefficient surface control method accordingly. Following this, throughout the rest of
the ABS control process, low and high friction surface detection is on. If the road
surface friction coefficient changes the ABS changes its control logic, and the low and
high friction coefficient road surface detection logic is at a dominant level. If the low-
high friction surface detection logic detects that the two left hand wheels are on a
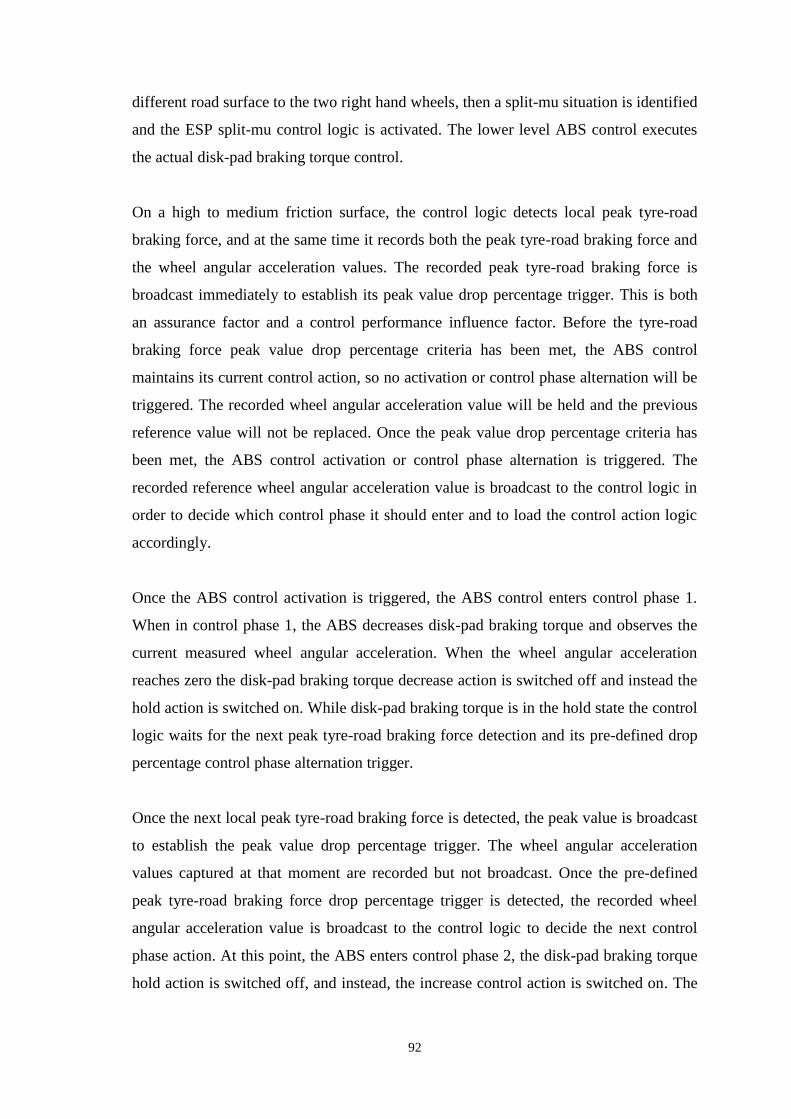
92
different road surface to the two right hand wheels, then a split-mu situation is identified
and the ESP split-mu control logic is activated. The lower level ABS control executes
the actual disk-pad braking torque control.
On a high to medium friction surface, the control logic detects local peak tyre-road
braking force, and at the same time it records both the peak tyre-road braking force and
the wheel angular acceleration values. The recorded peak tyre-road braking force is
broadcast immediately to establish its peak value drop percentage trigger. This is both
an assurance factor and a control performance influence factor. Before the tyre-road
braking force peak value drop percentage criteria has been met, the ABS control
maintains its current control action, so no activation or control phase alternation will be
triggered. The recorded wheel angular acceleration value will be held and the previous
reference value will not be replaced. Once the peak value drop percentage criteria has
been met, the ABS control activation or control phase alternation is triggered. The
recorded reference wheel angular acceleration value is broadcast to the control logic in
order to decide which control phase it should enter and to load the control action logic
accordingly.
Once the ABS control activation is triggered, the ABS control enters control phase 1.
When in control phase 1, the ABS decreases disk-pad braking torque and observes the
current measured wheel angular acceleration. When the wheel angular acceleration
reaches zero the disk-pad braking torque decrease action is switched off and instead the
hold action is switched on. While disk-pad braking torque is in the hold state the control
logic waits for the next peak tyre-road braking force detection and its pre-defined drop
percentage control phase alternation trigger.
Once the next local peak tyre-road braking force is detected, the peak value is broadcast
to establish the peak value drop percentage trigger. The wheel angular acceleration
values captured at that moment are recorded but not broadcast. Once the pre-defined
peak tyre-road braking force drop percentage trigger is detected, the recorded wheel
angular acceleration value is broadcast to the control logic to decide the next control
phase action. At this point, the ABS enters control phase 2, the disk-pad braking torque
hold action is switched off, and instead, the increase control action is switched on. The
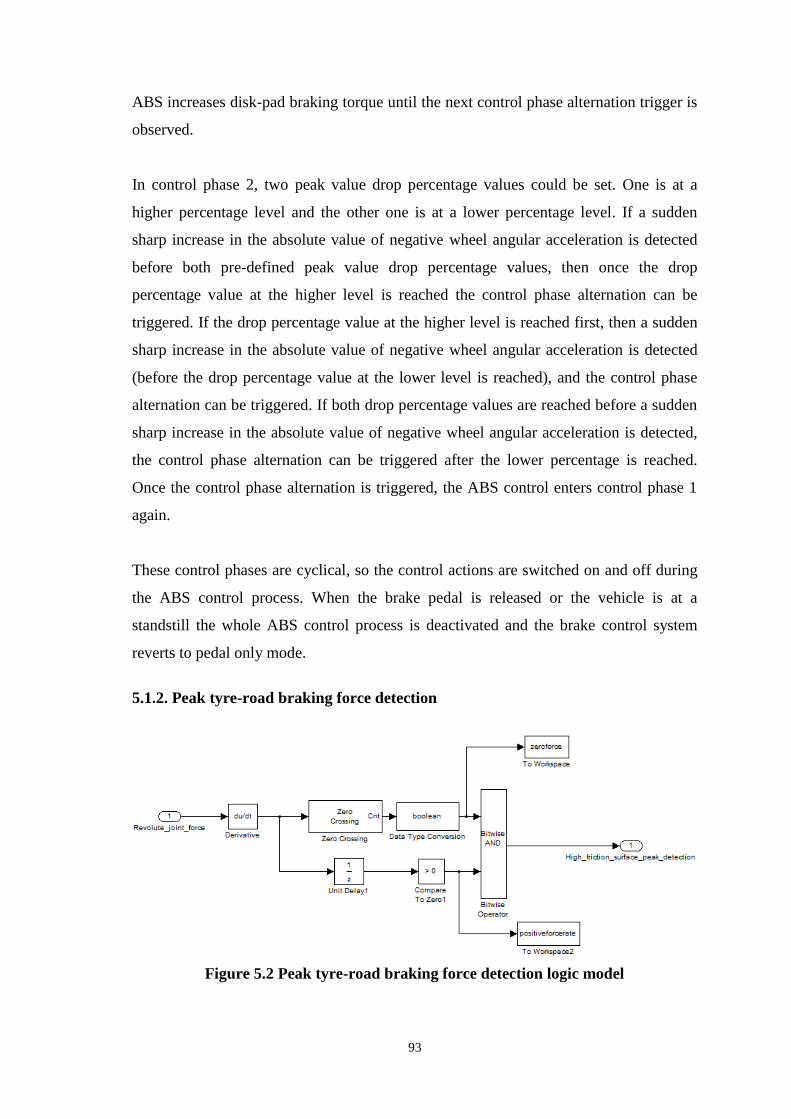
93
ABS increases disk-pad braking torque until the next control phase alternation trigger is
observed.
In control phase 2, two peak value drop percentage values could be set. One is at a
higher percentage level and the other one is at a lower percentage level. If a sudden
sharp increase in the absolute value of negative wheel angular acceleration is detected
before both pre-defined peak value drop percentage values, then once the drop
percentage value at the higher level is reached the control phase alternation can be
triggered. If the drop percentage value at the higher level is reached first, then a sudden
sharp increase in the absolute value of negative wheel angular acceleration is detected
(before the drop percentage value at the lower level is reached), and the control phase
alternation can be triggered. If both drop percentage values are reached before a sudden
sharp increase in the absolute value of negative wheel angular acceleration is detected,
the control phase alternation can be triggered after the lower percentage is reached.
Once the control phase alternation is triggered, the ABS control enters control phase 1
again.
These control phases are cyclical, so the control actions are switched on and off during
the ABS control process. When the brake pedal is released or the vehicle is at a
standstill the whole ABS control process is deactivated and the brake control system
reverts to pedal only mode.
5.1.2. Peak tyre-road braking force detection
Figure 5.2 Peak tyre-road braking force detection logic model
94
The tyre-road braking force signal under ABS control resembles a wave shape, and the
same sign is present throughout the effective ABS control process. These are based on
typical ideal ABS control cycles. The initial logic is to compare the current time step
measured value to a previous time step measured value. If the current value is smaller
than the previous value, the local peak tyre-road braking force is assumed to have been
reached. But it is difficult for this logic to identify a peak value on a negative slope on
the tyre-road braking force curve as the nature of the negative slope means that the
current value is smaller than the previous value. It might also be difficult for the logic to
cope when the tyre-road braking force value remains the same sometime after passing
the optimal slip ratio. In this case, the ABS control active process will be delayed so the
risk of a wheel lock will increase.
The implemented peak detection logic is used to determine when the slope (derivative)
of the tyre-road braking force curve reaches zero. The zero slope detection method is
used, but the waves are characterised by upper and lower peaks, and only the upper
peak is desired. Considering the nature of the curve, the control logic requires extra
logic to identify whether the previous slope was positive. If it is true that there is a zero
slope at the current step and a positive slope at the previous step the tyre-road braking
force peak is assumed to have been detected. The peak tyre-road braking value is then
recorded and broadcast until the next peak value is detected. During the implementation
of the peak detection logic, the local peak tyre-road braking force is not fixed. Instead, it
updates every time a peak value is detected throughout the ABS control activation
period. This gives the logic more ability to cope with changes and is more adaptive for
real vehicle implementation. The Simulink model of the proposed peak tyre-road
braking force detection logic as described above and can be seen in Figure 5.2.

95
5.1.3. Control Phase alternation trigger
Figure 5.3 Control phase switch trigger logic model
As discussed previously, due to the measurement noise and the vehicle and tyre
dynamic nonlinearity, the peak tyre-road braking force detection may not be completely
accurate. An assurance factor must be used to ensure the accuracy of the peak tyre-road
braking force detection. ABS control action activation or control phase alternation will
not materialise until the assurance factor is satisfied.
The assurance factor used in this ABS control logic is based on a previous analysis of
the tyre-road braking force curve during emergency braking. On a medium to high
friction coefficient road surface, after reaching the peak value at optimal slip ratio the
tyre-road braking force starts to decrease. A predefined drop in the percentage of the
peak value is used as the assurance factor. This means that once the peak value has been
reached, and the current measured tyre-road braking force drops to a pre-defined
percentage of the detected local peak value, the ABS control activation or control phase
alternation is triggered. In the event that the next detected peak tyre-road braking force
is either at the same, or an even greater level than the current peak value, then the
current pre-defined drop percentage of the peak value detection will be false within the
same control phase (before the next peak is detected). Therefore, the true negative slope
logic and the trigger state change logic are added to confirm that the next control phase
is only activated once the next peak value is detected and its drop percentage trigger is
active again. The Simulink model of the proposed control phase switch trigger logic
(described above) can be seen in Figure 5.3.
96
Ideally, the assurance factor can use just a single point value in a normal simulation
environment. But in reality, due to the measurement noise and sensor measurement
limitations, a group of calibrated values within a very tight range may have to be used.
5.1.4. Disk-pad braking torque control
5.1.4.1. Disk-pad braking torque hold action in control phase 1
In addition to the assurance factor which assures the correct ABS control activation and
control phase alternation in both control phases, the drop percentage is also a very
important control action justification factor for the proposed ABS control method,
which has a great influence on the ABS control performance. Based on the discussion of
control action development in control phase 1, the disk-pad braking torque decreases at
its full capability until it reaches the same level as the tyre-road braking torque. This
happens when the negative wheel angular acceleration reaches zero, making the control
method more simple. At this point, the disk-pad braking torque decrease action stops
and its hold action is on until the next control phase alternation is triggered. As
discussed previously, when the ABS control is on the disk-pad braking torque changes
much faster than the tyre-road braking torque. This means that even when the disk-pad
braking torque decreases to the current tyre-road braking torque level and holds its
value, the tyre-road braking torque may only have just started to react to the change in
the disk-pad braking torque. It takes some time for the tyre-road braking torque to fully
achieve its true status (i.e. to be in accordance with the current level of disk-pad braking
torque).
If an adequate peak tyre-road braking force drop percentage value is adopted, when the
disk-pad braking torque quickly decreases to the same level and holds its position, the
current disk-pad braking torque level is sufficient to revert tyre-road braking torque
back to its peak level again in a more efficient way during control phase 1. At the same
time, if the current disk-pad braking torque level in the hold position is not much below
the peak tyre-road braking torque, a faster peak tyre-road braking torque recovery could
be expected in control phase 2.

97
As per the conclusion of the previous discussion, in control phase 1, the decrease in the
level of disk-pad braking torque could be justified if the tyre-road braking torque is at a
pre-defined peak tyre-road braking force drop percentage. However, in such a scenario,
the disk-pad braking torque must decrease quickly enough to avoid the tyre-road
braking torque increasing more significantly when the disk-pad braking torque decrease
control is triggered in control phase 1. The zero wheel angular acceleration hold action
trigger could be implemented in order to simplify the ABS control logic and make it
more efficient. So when choosing ABS hardware the ABS controlled disk-pad braking
torque change capability must be higher than the tested tyre’s tyre-road braking torque
reaction capability. The hold control action trigger logic model for control phase 1 can
be seen in Figure 5.4.
Figure 5.4 Hold control action trigger for control phase 1
5.1.4.2. Comparison between proposed ABS and Bosch ABS, with further discussion
on Bosch ABS
The proposed ABS control method can use this zero wheel angular acceleration hold
action because the proposed ABS algorithm uses the measured wheel revolute joint
force. This offers a good representation of the tyre-road braking force and it can observe
the tyre-road braking force conditions more efficiently than the Bosch and Wabco ABS.
This means that it could make an earlier control decision. In the Bosch and Wabco ABS,
due to the extra logics and determination processes that are required to confirm the
status of the tyre-road braking force, the control action decision is delayed and the tyre-
road braking force decreases further than its local peak value (considering the fact that
the change in disk-pad braking torque is faster than the tyre-road braking torque in

98
control phase 1). If the Bosch ABS quickly decreases the disk-pad braking torque to the
same level as the excessively reduced tyre-road braking torque and holds its value, tyre-
road braking torque will revert to its local peak value. However, the level of the disk-
pad braking torque will be well below that of the peak tyre-road braking torque, so it
will take more time and effort for the ABS to recover the tyre-road braking torque to its
peak again in control phase 2.
To be specified with previous discussion. In the same disk-pad braking torque decrease
and hold control phase, the Bosch ABS uses pre-defined parameters, for example the
wheel angular acceleration to ensure effective control performance. But even if the
reference wheel angular acceleration is used the disk-pad braking torque could still be
decreased too much. To prevent this, the Bosch ABS has to include another pre-defined
wheel angular acceleration value to identify the over-decrease and to increase the disk-
pad braking torque before reaching next control phase. This would allow the Bosch
ABS to regain effective control performance, but this will also cause a further delay in
the detection of the next peak tyre-road braking force due to the simultaneous change in
both braking torque. At this point, the only observer for the Bosch ABS (wheel angular
acceleration) is insufficient in identifying the peak tyre-road braking force. Therefore,
the Bosch ABS has to hold the disk-pad braking torque again to observe the status of
the tyre-road braking torque via the wheel angular acceleration. As the proposed ABS
control method provides a more accurate observation of the status of the tyre-road
braking force, the ABS control activation and control phase alternation could be
triggered earlier and more efficiently.
5.1.4.3. Disk-pad braking torque control actions model
In the ABS control simulation test the disk-pad braking torque must firstly be brought to
a level where the reacting tyre-road torque force reaches its peak value and starts to
decrease. Once the ABS control activation or control phase alternation is triggered the
representative revolute joint braking force is set as a start reference value for the new
control phase. The wheel angular acceleration value is recorded when the peak tyre-road
braking force is detected and it is used as a reference to decide which control phase it
should be in and which control action is adequate for the current control phase.
99
As discussed previously, during ABS activation negative wheel angular acceleration
indicates it is in control phase 2, but it should enter control phase 1, and disk-pad
braking torque decrease control action is required when the next control phase
alternation is triggered. Positive wheel angular acceleration indicates that ABS is in
control phase 1, but it should have entered control phase 2 and the disk-pad braking
torque increase control action is required when new control phase alternation is
triggered. The functions described above are translated in the Simulink model as seen in
Figure 5.5.
Figure 5.5 Angular acceleration reference determined control action
Figure 5.6 Disk-pad braking torque control action model
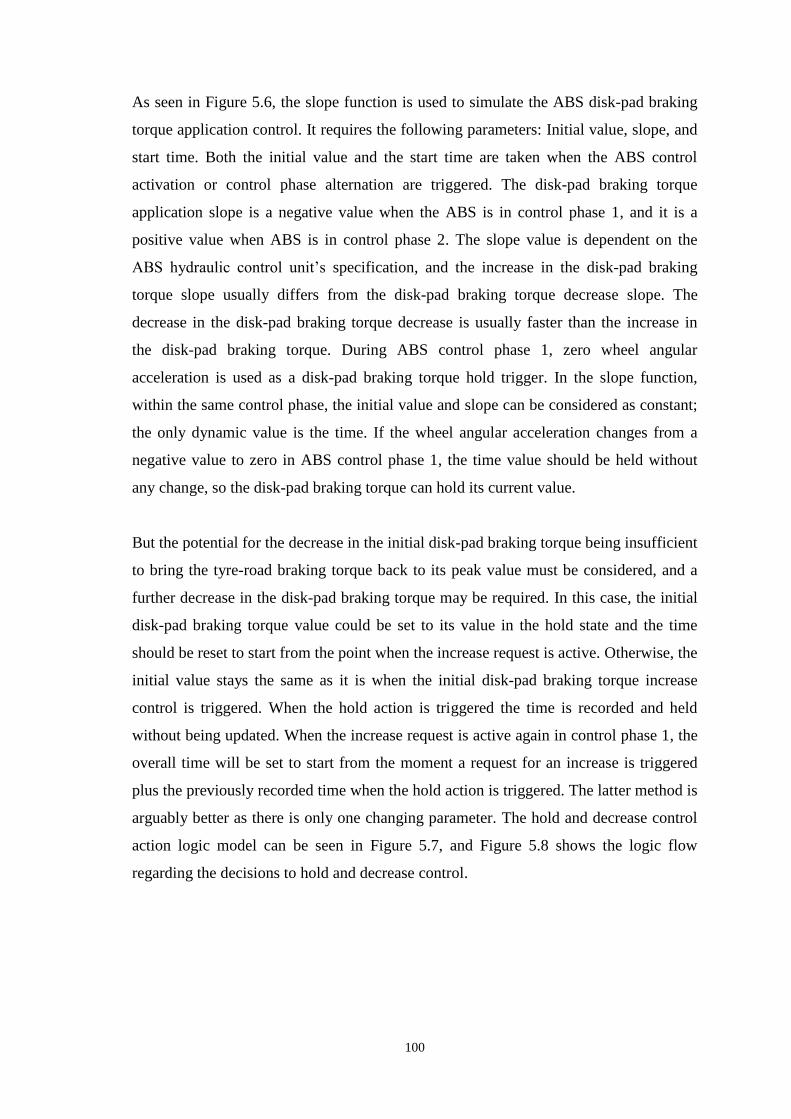
100
As seen in Figure 5.6, the slope function is used to simulate the ABS disk-pad braking
torque application control. It requires the following parameters: Initial value, slope, and
start time. Both the initial value and the start time are taken when the ABS control
activation or control phase alternation are triggered. The disk-pad braking torque
application slope is a negative value when the ABS is in control phase 1, and it is a
positive value when ABS is in control phase 2. The slope value is dependent on the
ABS hydraulic control unit’s specification, and the increase in the disk-pad braking
torque slope usually differs from the disk-pad braking torque decrease slope. The
decrease in the disk-pad braking torque decrease is usually faster than the increase in
the disk-pad braking torque. During ABS control phase 1, zero wheel angular
acceleration is used as a disk-pad braking torque hold trigger. In the slope function,
within the same control phase, the initial value and slope can be considered as constant;
the only dynamic value is the time. If the wheel angular acceleration changes from a
negative value to zero in ABS control phase 1, the time value should be held without
any change, so the disk-pad braking torque can hold its current value.
But the potential for the decrease in the initial disk-pad braking torque being insufficient
to bring the tyre-road braking torque back to its peak value must be considered, and a
further decrease in the disk-pad braking torque may be required. In this case, the initial
disk-pad braking torque value could be set to its value in the hold state and the time
should be reset to start from the point when the increase request is active. Otherwise, the
initial value stays the same as it is when the initial disk-pad braking torque increase
control is triggered. When the hold action is triggered the time is recorded and held
without being updated. When the increase request is active again in control phase 1, the
overall time will be set to start from the moment a request for an increase is triggered
plus the previously recorded time when the hold action is triggered. The latter method is
arguably better as there is only one changing parameter. The hold and decrease control
action logic model can be seen in Figure 5.7, and Figure 5.8 shows the logic flow
regarding the decisions to hold and decrease control.
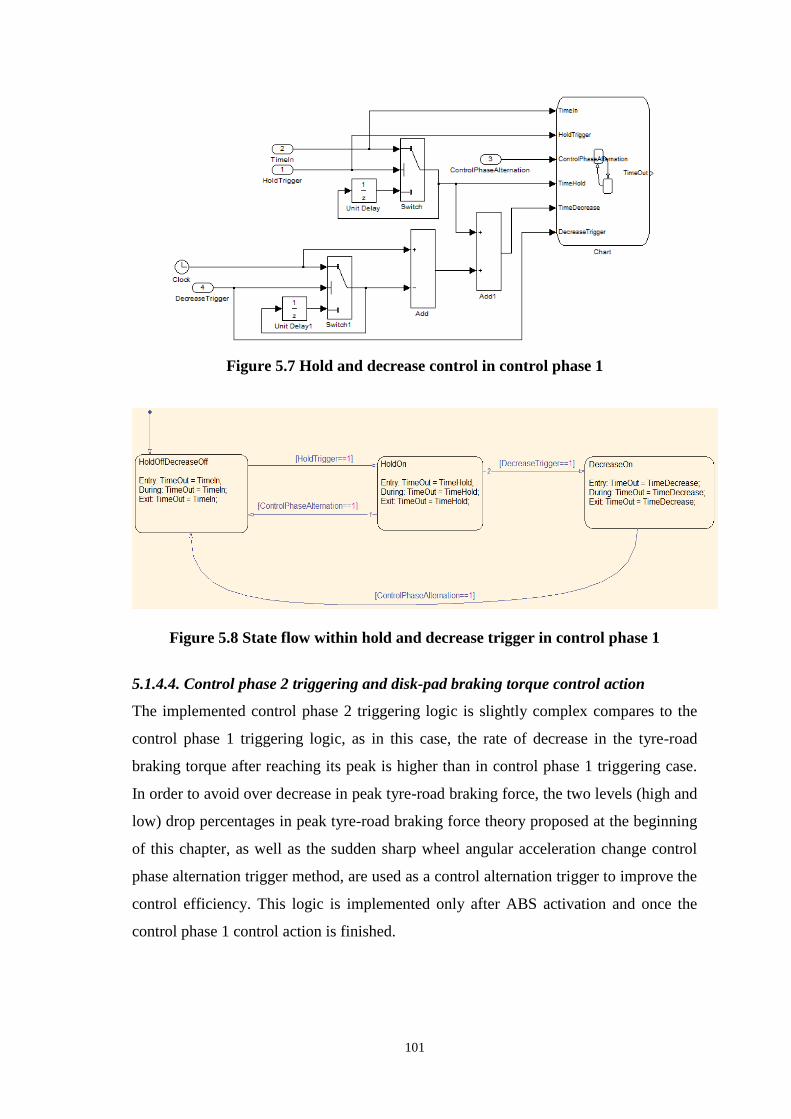
101
Figure 5.7 Hold and decrease control in control phase 1
Figure 5.8 State flow within hold and decrease trigger in control phase 1
5.1.4.4. Control phase 2 triggering and disk-pad braking torque control action
The implemented control phase 2 triggering logic is slightly complex compares to the
control phase 1 triggering logic, as in this case, the rate of decrease in the tyre-road
braking torque after reaching its peak is higher than in control phase 1 triggering case.
In order to avoid over decrease in peak tyre-road braking force, the two levels (high and
low) drop percentages in peak tyre-road braking force theory proposed at the beginning
of this chapter, as well as the sudden sharp wheel angular acceleration change control
phase alternation trigger method, are used as a control alternation trigger to improve the
control efficiency. This logic is implemented only after ABS activation and once the
control phase 1 control action is finished.

102
As previously discussed, the tyre-road braking force has a sharper increase slope on the
left-hand side than on the right-hand side of the optimal slip ratio. This means that the
tyre-road braking torque may react faster to the change in the disk-pad braking torque
when it is on the left-hand side. In the Bosch ABS the disk-pad braking torque increase
control has been divided into many short increase and hold steps. The purpose of this is
to observe the status of the tyre-road braking torque and reduce suspension vibration. In
the Wabco ABS there are disk-pad braking torque hold actions which, via the wheel
angular acceleration, are mainly used to observe the response of the tyre-road braking
torque and its status. Once the tyre-road braking force can be monitored directly, the
hold actions in control phase 2 could be removed if the delay caused by tyre hysteresis
is well understood.
Also, due to the nature of the brake pressure build-up and its releasing processes, the
brake pressure build-up process usually takes longer than the brake pressure release
process with the same set of ABS components in the same braking environment.
Accordingly, the difference in the rate of change between the disk-pad braking torque
and the tyre-road braking torque is smaller in the brake pressure build-up phase, and in
turn the difference between the two braking torques increases slowly. Therefore, in
control phase 2, the tyre-road braking torque increases with the disk-pad braking torque,
and the tyre-road braking torque follows the increase in disk-pad braking torque closely.
Accordingly, the braking action in control phase 2 is not as complex as in control phase
1, it is designed to keep the disk-pad braking torque increasing until the next pre-
defined peak tyre-road braking force drop percentage control phase alternation trigger is
active. The same slope function is used to simulate the disk-pad braking torque increase,
and the slope value is positive.
5.1.5. Low friction coefficient surface detection
As discussed previously, the logic used to identify a low friction surface is based on the
measurements of longitudinal tyre-road braking force on a low friction coefficient
surface taken in an experiment. The logic detects a low friction coefficient surface
before the tyre-road braking force reaches its peak range. When the tyre-road braking
force derivative (change rate) drops below a pre-defined threshold, (while the tyre-road

103
braking force value is below a pre-defined threshold and the same state lasts for a pre-
defined time step) then the logic could conclude that a low friction coefficient surface
has been detected. The discussed low friction surface detection model is seen in Figure
5.9. The pre-defined tyre-road braking force derivative threshold should be greater than
zero, as a zero derivative usually represents a local peak force value.
Figure 5.9 Low friction surface detection logic model
The corresponding tyre-road braking force threshold is determined by a summary of
experimental test data which represents the overall average tyre-road braking force
value when its derivative drops below the specified level. The logic is not used to
clarify road surface friction in detail; it is just employed to distinguish between high and
low friction surfaces. If a detailed look-up table with tyre-road braking force value at its
specified derivative level, under different friction coefficients road surfaces can be
established via the in-wheel force sensor measurements in the experimental test, the
exact road friction coefficients could be identified. In the current simulation
environment, the difference between high and low surface is significant enough to avoid
misjudgement, and the pre-defined continuous status identification threshold will not be
implemented. In practice, as the peak tyre-road braking force representative wheel
bearing longitudinal force is used for the force measurement, calibration must be carried
out to compensate for the offset of the two.

104
5.1.6. Low friction coefficient surface control
Figure 5.10 Peak split point detection and related control action logic model
Once it has been identified that the vehicle is travelling on a low friction coefficient
surface when ABS is active, low friction coefficient surface control is engaged. The first
step is to identify the peak split point. This is the point when the tyre-road braking force
stops increasing, or even starts to decrease. Due to the nature of the tyre-road braking
force curve on a low friction coefficient surface, the peak value drop percentage method
used to switch the disk-pad braking torque control phases cannot be used. After
reaching its peak value the tyre-road braking force always remains the same or within a
similar range. The peak split point identification logic, as seen within orange frame of
Figure 5.10, detects the zero or negative tyre-road braking force derivative on an
increase slope. In parallel, the logic detects sudden significant drop of tyre-road braking
force derivative, which happens when approaching the peak split point, the drop in
values is extracted from low friction coefficient surface brake experiment tests in
practice. If any of these conditions is met, then the peak tyre-road braking force can be
confirmed and the peak split point is identified. In real vehicle implementation, the tyre-
road braking force recorded when the peak tyre-road braking force was first detected
can be used as a second assurance factor. A range of measured peak tyre-road braking
105
force values, also extracted from low friction coefficient surface brake experiment tests,
are compared to the recorded force value. If the recorded force value is within the
reference force value range, a peak tyre-road braking force can be confirmed. If all these
conditions are satisfied, then the ABS control action is active or a control action
alternation is triggered.
Once the peak force and peak split point are detected, it is very important to bring the
disk-pad braking torque down quickly. On a low friction coefficient surface the wheel
locks condition very quickly. In this disk-pad braking torque decrease control phase,
due to the tyre-road braking torque reacting slowly to the change in disk-pad braking
torque (even more slowly than on high friction surfaces) and the available tyre-road
braking torque being very limited, the preferred control action is to decrease the disk-
pad braking torque to a level just below peak tyre-road braking torque. Wheel angular
acceleration can be used as a control reference. If the wheel angular acceleration reaches
zero before the peak split point is detected again, it can be concluded that the disk-pad
braking torque has been decreased close to the peak split point and it should enter hold
action. This hold control action trigger model is the same as the one used in high
friction ABS control, which can be seen in Figure 5.4. The ABS control logic then
waits for the tyre-road braking torque to react to the change in disk-pad braking torque.
Once the peak split point is detected again and the tyre-road braking force drops to a
pre-defined percentage after the peak split point, the disk-pad braking torque increase
control is on, and the control logic enters control phase 2.
The peak split point detection method used in control phase 2 is different from that
employed in control phase 1. It uses a current tyre-road braking force derivative which
is higher than the pre-defined threshold, and a previous tyre-road braking force
derivative which is lower than the pre-defined threshold to detect sudden significant
increase of tyre-road braking force derivative. This proposed control model can be seen
within red frame of Figure 5.10. In real vehicle implementation, during this control
phase, due to the same slow response of the tyre-road braking torque to the change in
disk-pad braking torque, many short pulses of the increase and hold control action are
preferred in order to avoid over-increasing the disk-pad braking torque. Once the next
peak split point is detected, the control logic enters control phase 1 again.
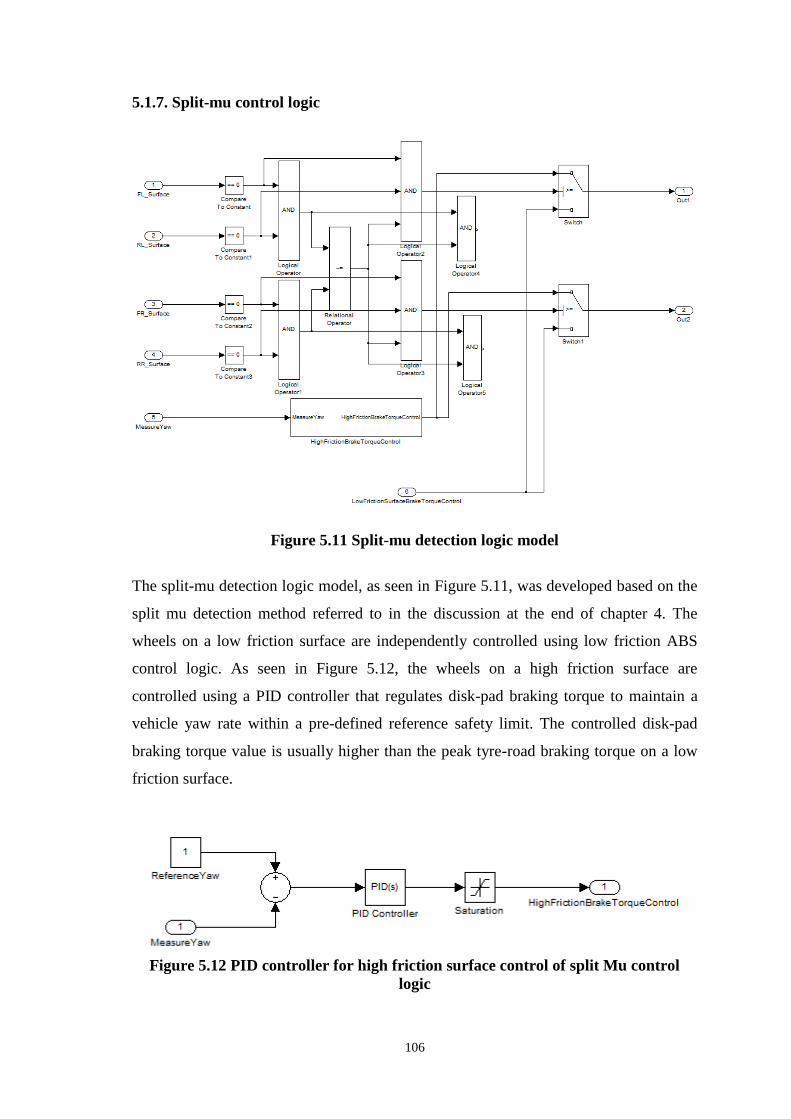
106
5.1.7. Split-mu control logic
Figure 5.11 Split-mu detection logic model
The split-mu detection logic model, as seen in Figure 5.11, was developed based on the
split mu detection method referred to in the discussion at the end of chapter 4. The
wheels on a low friction surface are independently controlled using low friction ABS
control logic. As seen in Figure 5.12, the wheels on a high friction surface are
controlled using a PID controller that regulates disk-pad braking torque to maintain a
vehicle yaw rate within a pre-defined reference safety limit. The controlled disk-pad
braking torque value is usually higher than the peak tyre-road braking torque on a low
friction surface.
Figure 5.12 PID controller for high friction surface control of split Mu control
logic
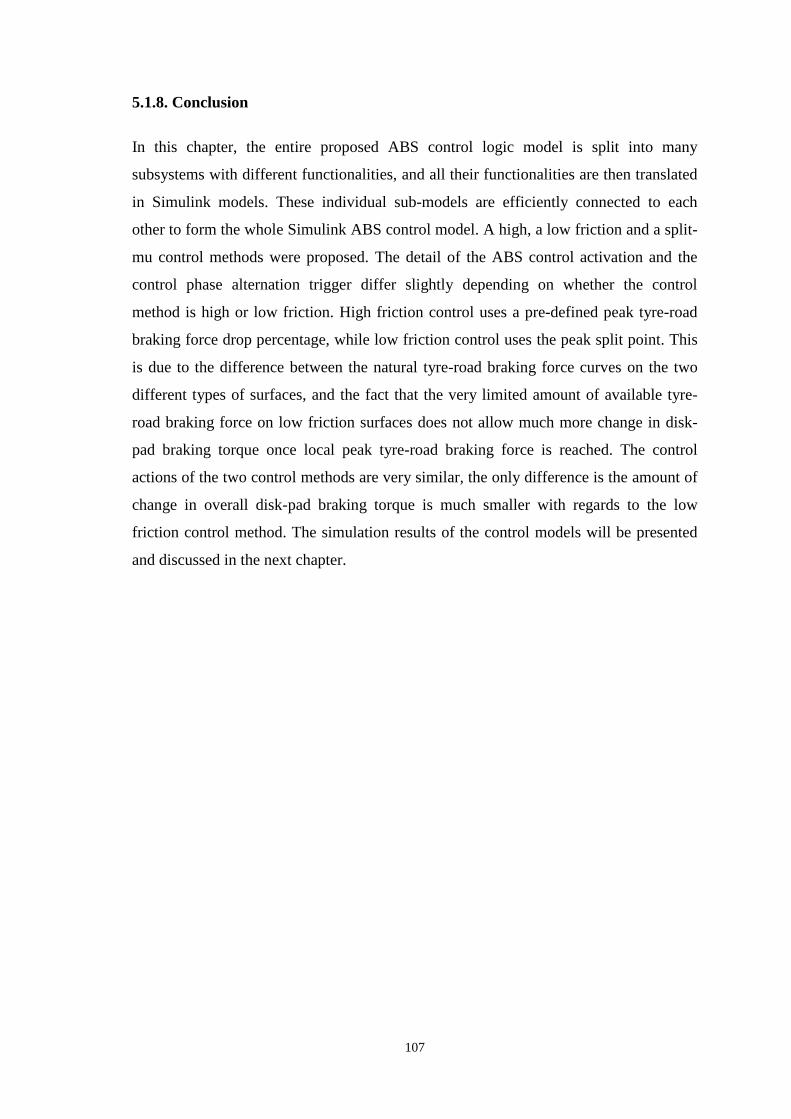
107
5.1.8. Conclusion
In this chapter, the entire proposed ABS control logic model is split into many
subsystems with different functionalities, and all their functionalities are then translated
in Simulink models. These individual sub-models are efficiently connected to each
other to form the whole Simulink ABS control model. A high, a low friction and a split-
mu control methods were proposed. The detail of the ABS control activation and the
control phase alternation trigger differ slightly depending on whether the control
method is high or low friction. High friction control uses a pre-defined peak tyre-road
braking force drop percentage, while low friction control uses the peak split point. This
is due to the difference between the natural tyre-road braking force curves on the two
different types of surfaces, and the fact that the very limited amount of available tyre-
road braking force on low friction surfaces does not allow much more change in disk-
pad braking torque once local peak tyre-road braking force is reached. The control
actions of the two control methods are very similar, the only difference is the amount of
change in overall disk-pad braking torque is much smaller with regards to the low
friction control method. The simulation results of the control models will be presented
and discussed in the next chapter.

108
6. Results Analysis
In this chapter, an emergency brake scenario in which the vehicle is travelling at
80km/h is simulated. The simulation results of the high friction ABS control method,
low friction ABS control method, and split-mu ESP and ABS control method are
presented and discussed.
6.1. High friction ABS control logic results
In total there are five sets of simulation results with different sets of input parameters. In
general, the simulation results can be described as follows: The ‘a’ picture in Figures
6.1, 6.2, 6.3, 6.4, and 6.5 shows the revolute joint longitudinal force time history while
the ABS is active. In all the test results it can be seen that the revolute joint longitudinal
force is maintained around its peak range. The up and down slide action can be clearly
seen, which is the reaction of the tyre-road braking force resulting from the ABS
controlled disk-pad braking torque. The slide reaction shows that the ABS control logic
tries to keep the tyre-road braking force around its peak range, but due to actuators and
ABS control method efficiency limitations, the exact peak tyre-road braking force value
cannot be maintained all the time.
The up and down slide action matches the expected response of the proposed ABS
control method’s tyre-road braking force, and the control logic maintains tyre-road
braking force around its peak range. Each up and down slide motion usually represents
one control phase, or half a control cycle. Although each up and down slide motion
looks similar, the disk-pad braking torque control actions are different for the two
neighbouring up and down slide motions. During ABS control process, the peak tyre-
road braking force will not be the same but it should remain similar within a tight range
unless the road surface friction changes significantly.
The ‘b’ picture in Figures 6.1, 6.2, 6.3, 6.4, and 6.5 shows the wheel angular
acceleration time history. As can be seen, it moves up and down and the zero axis
represent a reference middle point. This is also an expected action as acceleration and
deceleration indicates that the wheel rotational motion is maintained in parallel to the

109
peak tyre-road braking force range (which is maintained by the control method). From
the revolute joint longitudinal force time history, it can be seen at start of each control
phase that an immediate effective disk-pad braking torque control cannot change tyre-
road braking torque states in the same efficient way. This is represented by a fast
change in wheel angular acceleration and a slow change in the tyre-road braking force,
as seen in the figures. The control actions are balanced, as there is a similar level of
change in wheel angular acceleration on both sides of the zero axis in each control cycle.
The ‘c’ picture in Figures 6.1, 6.2, 6.3, 6.4, and 6.5 shows the wheel longitudinal speed
time history. As can be seen, it decreases through time at a relatively stable rate. The
observed noise is due to the change in the tyre-road braking force which is the dominant
force slowing down the wheel from moving forward. In all these simulation results the
wheel longitudinal speed value reduced by more than half within 2 seconds. If these
results are compared to the reference braking time data in chapter 2, the performance of
this ABS control method is superior.
The ‘d’ picture in Figures 6.1, 6.2, 6.3, 6.4, and 6.5 shows the wheel angular speed time
history. It can be seen that it never reaches zero while the vehicle is moving. This
directly proves that the wheel rotational motion was maintained during the ABS control
process and that accordingly the wheel has not been locked.
The ABS control action can be observed in its time history curve. When wheel angular
speed has been decreased too much compared to relative wheel longitudinal speed, the
ABS control increases it again, and its overall average curve trace follows the curve
trace of the wheel longitudinal speed. Similar traces can be observed between the curves
in the simulation results and the Bosch and Wabco ABS control curves, which indicates
correct basic ABS control actions. It is important to use the commercialised ABS as a
benchmark, not because they set the standard ABS control pattern, but because they
follow the natural behaviour of the tyre and adopt a reasonable pattern of control actions.
Moreover, the commercialised ABS considers all the practical limitations, which result
in an effective brake system and a tyre interaction that slows the vehicle down without
locking the wheels.
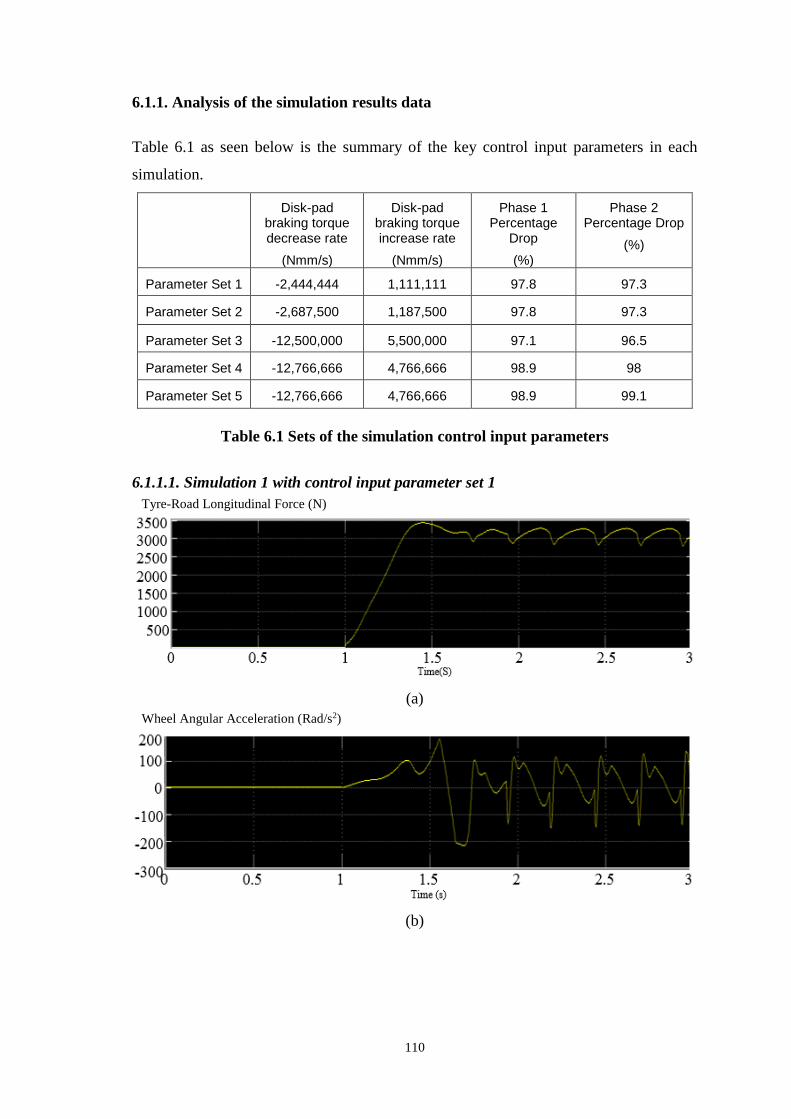
110
6.1.1. Analysis of the simulation results data
Table 6.1 as seen below is the summary of the key control input parameters in each
simulation.
Disk-pad
braking torque decrease rate
(Nmm/s)
Disk-pad braking torque increase rate
(Nmm/s)
Phase 1 Percentage
Drop
(%)
Phase 2 Percentage Drop
(%)
Parameter Set 1 -2,444,444 1,111,111 97.8 97.3
Parameter Set 2 -2,687,500 1,187,500 97.8 97.3
Parameter Set 3 -12,500,000 5,500,000 97.1 96.5
Parameter Set 4 -12,766,666 4,766,666 98.9 98
Parameter Set 5 -12,766,666 4,766,666 98.9 99.1
Table 6.1 Sets of the simulation control input parameters
6.1.1.1. Simulation 1 with control input parameter set 1
(a)
(b)
Tyre-Road Longitudinal Force (N)
Wheel Angular Acceleration (Rad/s2)

111
(c)
(d)
Figure 6.1 ABS control simulation results set 1
In simulation 1, the rate of the decrease in disk-pad braking torque in control phase 1 is
-2,444,444Nmm/s and its rate of increase in control phase 2 is 1,111,111 Nmm/s. The
percentage drop is 97.8% in control phase 1, and 97.3% in control phase 2. Overall, as
seen in Figure 6.1, the initial increase in disk-pad braking torque was too high, and at
this point the wheel angular speed was decreased to a very low level compared to the
wheel longitudinal speed. This indicates that with this control input parameter set it
takes longer for the ABS control logic to activate and decrease the disk-pad braking
torque efficiently, especially in the initial stage.
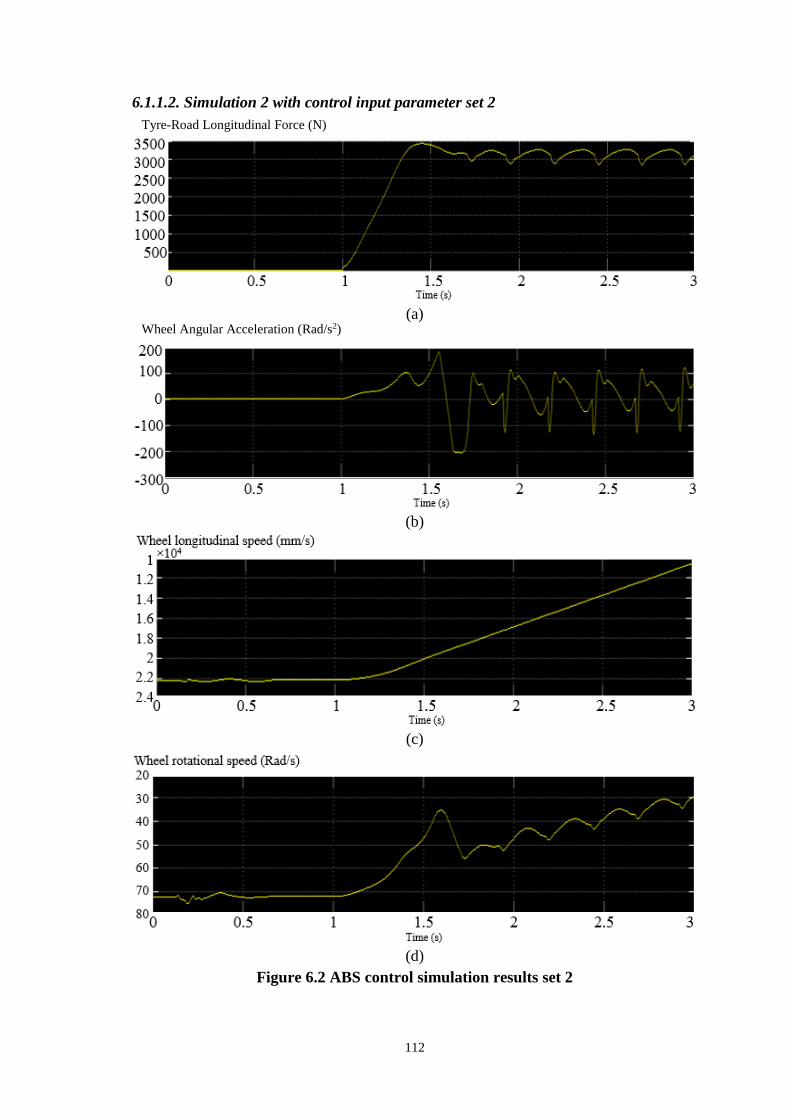
112
6.1.1.2. Simulation 2 with control input parameter set 2
(a)
(b)
(c)
(d)
Figure 6.2 ABS control simulation results set 2
Tyre-Road Longitudinal Force (N)
Wheel Angular Acceleration (Rad/s2)
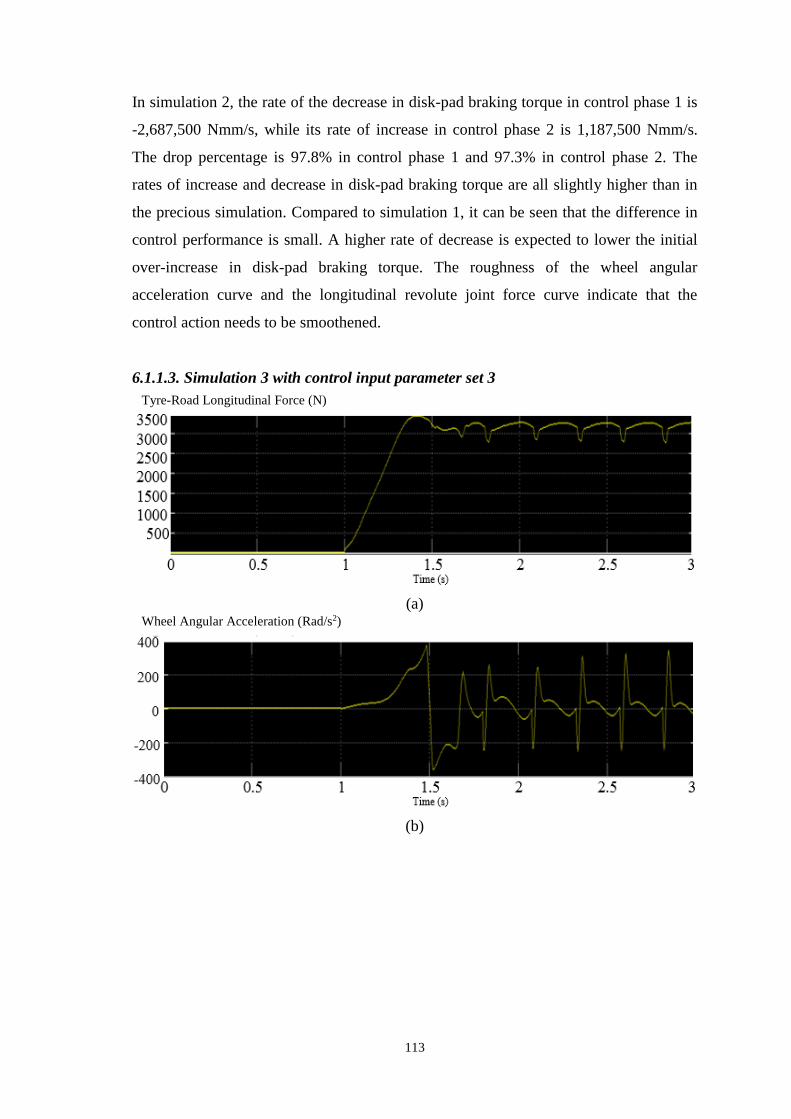
113
In simulation 2, the rate of the decrease in disk-pad braking torque in control phase 1 is
-2,687,500 Nmm/s, while its rate of increase in control phase 2 is 1,187,500 Nmm/s.
The drop percentage is 97.8% in control phase 1 and 97.3% in control phase 2. The
rates of increase and decrease in disk-pad braking torque are all slightly higher than in
the precious simulation. Compared to simulation 1, it can be seen that the difference in
control performance is small. A higher rate of decrease is expected to lower the initial
over-increase in disk-pad braking torque. The roughness of the wheel angular
acceleration curve and the longitudinal revolute joint force curve indicate that the
control action needs to be smoothened.
6.1.1.3. Simulation 3 with control input parameter set 3
(a)
(b)
Tyre-Road Longitudinal Force (N)
Wheel Angular Acceleration (Rad/s2)

114
(c)
(d)
Figure 6.3 ABS control simulation results set 3
In simulation 3, the rate of the decrease in disk-pad braking torque in control phase 1 is
-12,500,000Nmm/s. Its rate of increase in control phase 2 is 5,500,000Nmm/s.
Compared to the first two simulations, both the rates of decrease and increase in the
disk-pad braking torque are significantly higher. The drop percentage in phase 1 has
fallen to 97.1%, and in phase 2 it has fallen to 96.5%. As seen in Figure 6.3, the control
reaction is even volatile. The initial increase in disk-pad braking torque is excessive and
the wheels are almost locked. This rough behaviour is due to the reduced drop
percentage which delays the activation of the ABS control, even with a greater decrease
in the rate of the disk-pad braking torque. This highlights the importance of the ABS
control activation and phase alternation trigger tuning. Further simulations are required
to study other related issues. But it can be concluded that the performance of the ABS
disk-pad braking torque control is more sensitive to changes in drop percentage.

115
6.1.1.4. Simulation 4 with control input parameter set 4
(a)
(b)
(c)
(d)
Figure 6.4 ABS control simulation results set 4
Tyre-Road Longitudinal Force (N)
Wheel Angular Acceleration (Rad/s2)

116
In simulation 4, the rate of the decrease in disk-pad braking torque in control phase 1 is
-12,766,666Nmm/s. Its rate of increase in control phase 2 is 4,766,666Nmm/s.
Compared to the last simulation, both the rates of decrease and increase in the disk-pad
braking torque are slightly higher. The drop percentage in phase 1 has increased to 98.9%
and to 98% in control phase 2. As seen in Figure 6.4, all the result curves are smoother
compared to the last three simulations, especially the wheel angular acceleration curve,
which indicates a smoother control action. But in the last 0.2 seconds of the wheel
angular speed curve the ABS failed to meet its control target. The wheel angular speed
reaches zero while the wheel longitudinal speed is still above a certain level. On the
other hand, it can be seen that the wheel angular speed was brought back to a reasonable
level in control phase 1, which indicates a good disk-pad braking torque decrease
control. Considering that this control input parameter set provides smooth control, the
failure could be caused by a lower rate of increase in the disk-pad braking torque in
control phase 2 than in control phase 1, and a low drop percentage in control phase 2.
6.1.1.5. Simulation 5 with control input parameter set 5
(a)
(b)
Tyre-Road Longitudinal Force (N)
Wheel Angular Acceleration (Rad/s2)

117
(c)
(d)
Figure 6.5 ABS control simulation results set 5
In simulation 5, the rate of the decrease in disk-pad braking torque in control phase 1 is
-12,766,666Nmm/s. Its rate of increase in control phase 2 is 4,766,666Nmm/s. Both the
rates of decrease and increase in the disk-pad braking torque remain the same as in the
last parameter setting. The drop percentage in phase 1 is 98.9% but it has increased to
99.1% in control phase 2. As seen in Figure 6.5, control instability could be observed on
the longitudinal revolute joint force curve and the wheel angular acceleration curve.
This could be caused by the high drop percentage value in control phase 2. Once the
control cycle tightens, the delay in the change of the tyre-road braking force (caused by
tyre hysteresis) might not be fully observed by the ABS control method before the ABS
control actions are implemented.
The measured longitudinal revolute joint force curve oscillation is explained by the
attempts of the ABS control actions to match the delayed response in tyre-road braking
force during the initial state of its change in status. The zero wheel angular speed
indicates that the overall increase in disk-pad braking torque is excessive in control

118
phase 2. Considering the results of the analysis from simulation 4 (which found a low
rate in the increase of disk-pad braking torque in control phase 2), in this simulation,
only the drop percentage was increased, the rate of increase in disk-pad braking torque
stays the same as in simulation 4, but the simulation analysis results indicate the
increase in disk-pad braking torque was excessive. Therefore, it can be concluded that
the balance between the change in the rate of disk-pad braking torque and the drop
percentage must be well understood and tuned. If attempts are made to improve one
without considering the other, optimal control performance is hard to achieve.
6.1.2. Discussion of simulation results
The performance of the ABS control method relies on both pre-defined drop percentage
and the disk-pad braking torque change rate, and consequently it is sensitive to changes
in both. The higher the drop percentage value, the more quickly the ABS control
method can take action and the shorter the ABS control cycle. But the limitations of the
force measurement sensor and tyre reaction hysteresis must be considered. A high drop
percentage value does not necessarily mean reliable and smooth ABS control; instead it
can cause unstable control. This is explained by a combination of limitations in control
method efficiency and resonant vehicle dynamic behaviours, especially regarding tyres.
In order to reduce the excessive initial decrease in wheel angular speed in the ABS
activation phase, a higher rate of decrease in disk-pad braking torque is necessary. But
if the rate of decrease is too high it could make the whole control process rougher.
During the simulation tests, with regards to the first three control input parameter sets,
very rough wheel angular acceleration curves can be observed. Compared to control
input parameter set 4, it can be concluded that the rate of increase in disk-pad braking
torque is insufficient (in simulation 4 a much higher rate of increase is implemented).
Based on the related wheel angular acceleration curves, an adequately high rate of
increase in braking torque could help to smoothen the control process in phase 2. If the
rate of increase in disk-pad braking torque is low, it will revert the tyre-road braking
torque back to its peak, but the process is slow, so the vehicle or tyres could react
unexpectedly. Based on the analyses of all the simulation results, it can be concluded
that a well-balanced tuning between drop percentage and the rate of change in disk-pad

119
braking torque, as well as an understanding of the influence of the interaction on the
control process (based on the interaction between physical tyre and ABS control), can
help to achieve efficient control actions. Preventing wheel lock is always the priority of
the whole ABS control logic and this cannot be compromised, even if the resulting
control process is rough and could cause discomfort to passengers. No control logic and
control input parameter set is perfect, but a well-balanced logic and control input
parameter set which makes compromises between the key ABS control performance
requirements can help to achieve reliable and smooth control in many different
emergency brake situations. The tuning of real vehicle test and control parameters is a
very important process in establishing balance in the implementation of the ABS control
logic due to the non-linearity and uncertainty involved in real emergency braking
scenarios.
6.2. Low friction coefficient surface ABS control method results
The simulation test environment is set for emergency braking on a low friction
coefficient surface with a 0.2 friction coefficient and an initial 80km/h vehicle speed.
The low friction ABS control method is implemented. Both the predictive method
proposed for peak split point confirmation, and the drop percentage method, which is
similar to the one used in high friction ABS control method, are used, as some decrease
in tyre-road braking force (after it reaches its peak point) can be observed during the
simulation. The combined effect of the two control action triggering methods improves
the overall efficiency of the low friction ABS control method. Therefore, the drop
percentage value can be set at a relatively high level.
6.2.1. Simulation 1 with control input parameter set 1
In simulation 1, the low friction ABS control method did not implement the disk-pad
braking torque hold action while the disk-pad braking torque was decreasing (during
which the zero angular acceleration point is detected). Accordingly, the disk-pad
braking torque decreases until it is confirmed that the peak split point has been passed.
The purpose here is to compare the control performance of this aggressive control
method with the balanced control method used in simulation 2. The rate of the decrease
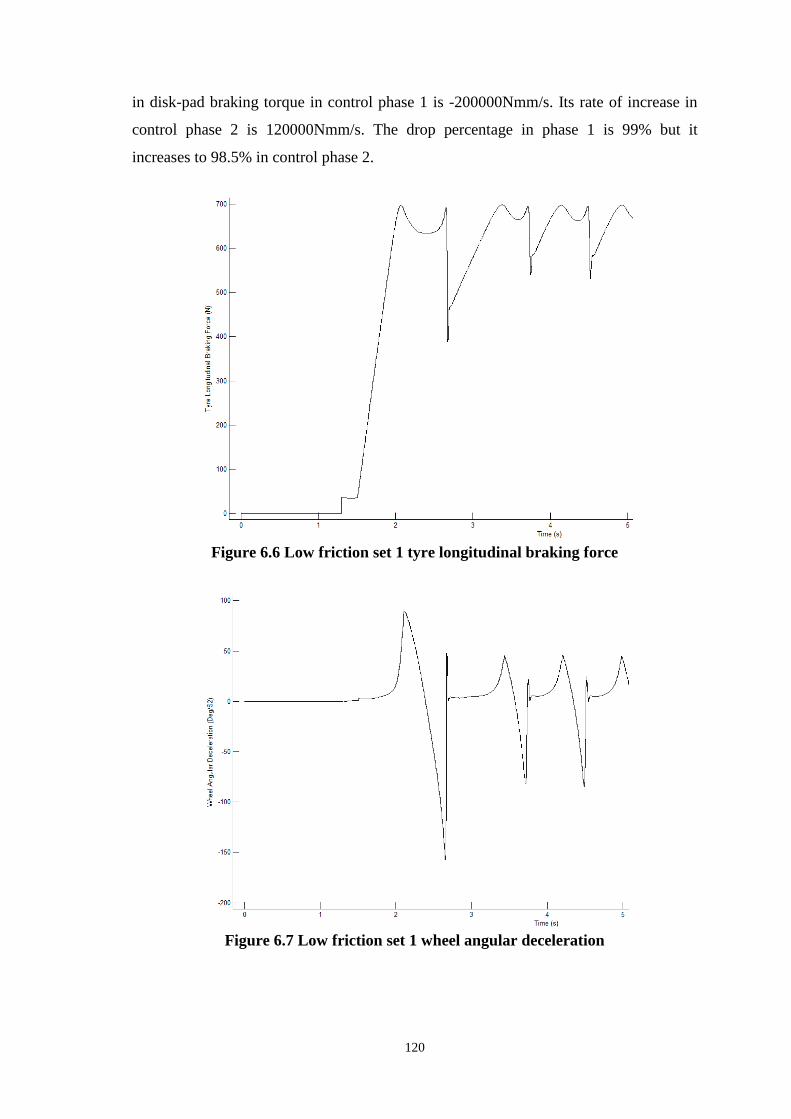
120
in disk-pad braking torque in control phase 1 is -200000Nmm/s. Its rate of increase in
control phase 2 is 120000Nmm/s. The drop percentage in phase 1 is 99% but it
increases to 98.5% in control phase 2.
Figure 6.6 Low friction set 1 tyre longitudinal braking force
Figure 6.7 Low friction set 1 wheel angular deceleration

121
Figure 6.8 Low friction set 1 vehicle longitudinal speed
It can be clearly seen that the available peak tyre-road braking force on a low friction
surface is very limited compared to on a high friction surface. It drops to around 700N,
which is around one fifth of the peak force (around 3500N) on a high friction surface. It
also becomes more sensitive to the change in disk-pad braking torque, especially when
the ABS control first kicks in. As seen in Figure 6.6, tyre longitudinal braking force
drops below 400N, which causes a significant change in wheel angular deceleration,
which can be seen in Figure 6.7. Although it stabilises later, the ABS control decreases
the tyre-road braking force to below around 550N on average, when it is in the braking
torque decrease phase. As seen in Figure 6.8, due mainly to the overall low levels of
peak tyre-road braking force and the inefficient use of the available tyre-road braking
force, the vehicle speed slows considerably compared to on a high friction surface.
After 3.5 seconds of ABS control, it only drops to 1580mm/s. As the available peak
tyre-road braking force on a low friction surface is very limited, the loss of precious
available tyre-road braking force must be minimised, and at the same time the risk of
wheel lock must be eliminated. Accordingly, an improved ABS control with a braking
torque hold action is implemented and tested next.

122
6.2.2. Simulation 2 with control input parameter set 2, with hold control action
In simulation 2, the rate of decrease in disk-pad braking torque in control phase 1 is -
200000Nmm/s. The rate of increase in control phase 2 is 120000Nmm/s. The drop
percentage in phase 1 is 99% but it decreases to 98.5% in control phase 2. All these
control input parameters are the same as in simulation 1, but the zero angular
acceleration triggered disk-pad braking torque hold action is added during the disk-pad
braking torque decrease control phase.
Figure 6.9 Low friction set 2 tyre longitudinal braking force

123
Figure 6.10 Low friction set 2 wheel angular deceleration
Figure 6.11 Low friction set 2 vehicle longitudinal speed
As seen in Figure 6.9, after the adoption of the hold action, the initial steep tyre-road
braking force drop is fixed, so is the significant change in the wheel angular
deceleration that can be seen in Figure 6.10. The average drop in tyre-road braking
force was limited to above 600N. The control cycle is longer, so the proposed control
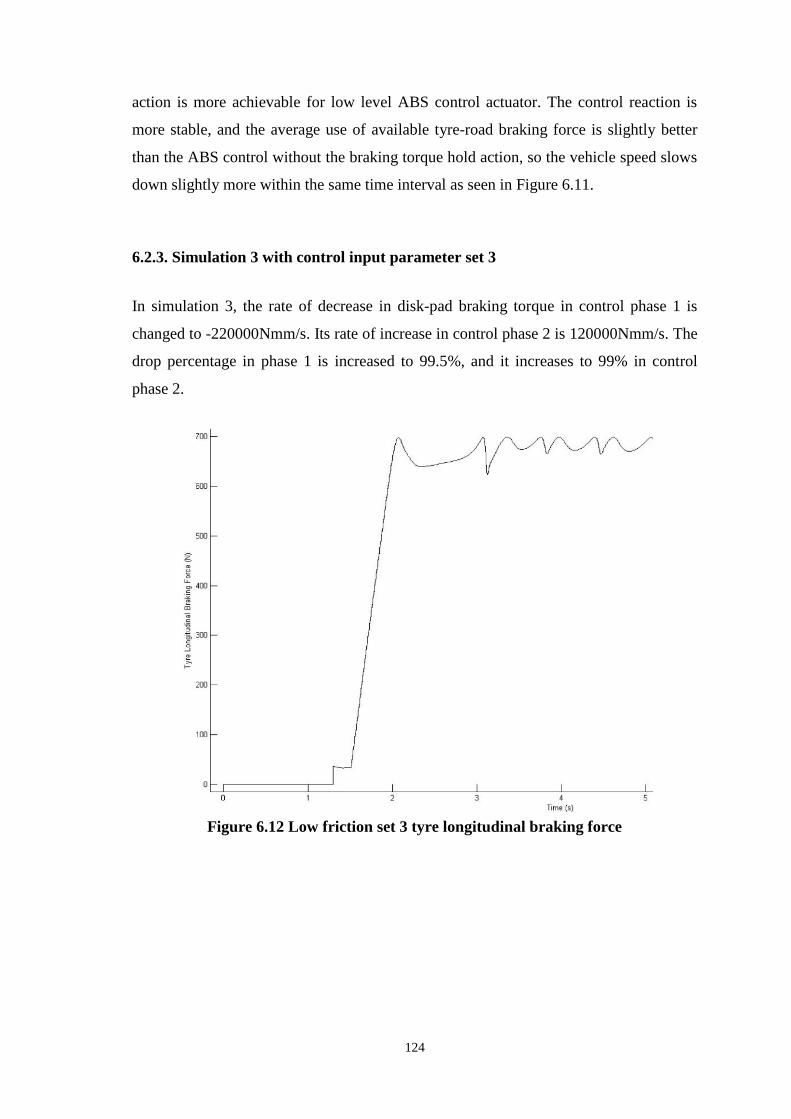
124
action is more achievable for low level ABS control actuator. The control reaction is
more stable, and the average use of available tyre-road braking force is slightly better
than the ABS control without the braking torque hold action, so the vehicle speed slows
down slightly more within the same time interval as seen in Figure 6.11.
6.2.3. Simulation 3 with control input parameter set 3
In simulation 3, the rate of decrease in disk-pad braking torque in control phase 1 is
changed to -220000Nmm/s. Its rate of increase in control phase 2 is 120000Nmm/s. The
drop percentage in phase 1 is increased to 99.5%, and it increases to 99% in control
phase 2.
Figure 6.12 Low friction set 3 tyre longitudinal braking force

125
Figure 6.13 Low friction set 3 wheel angular deceleration
Figure 6.14 Low friction set 3 vehicle longitudinal speed
This represents further tuning of the low friction ABS control with braking torque hold
action. On the one hand, the control cycle is even tighter as both drop percentages are
advanced, which results in a faster disk-pad braking torque decrease action. On the

126
other hand, a decent level of overall stability in the control actions is maintained due to
the efficiency of the control method and the healthy tuning of the control input
parameters. This can be observed in Figure 6.13 that the overall change in wheel
angular acceleration and its change overshoot are reduced, which indicates an even
smoother control process. All these improvements result in overall better use of
available tyre-road braking force, which can be observed in Figure 6.12. Accordingly,
the vehicle speed slows down even more, as seen in Figure 6.14.
6.2.4. Low friction ABS conclusion
The overall performance of the proposed low friction ABS control is satisfactory. The
tyre longitudinal braking force is cycled around its peak range, which indicates the
efficient use of available tyre-road braking force. Therefore, a possible shorter braking
distance could be achieved. It can be seen that the rotational wheel is cycled between
deceleration and acceleration, which indicates the wheel rotating motion is under
controlled manner, so the tyre’s lateral force generation capability is maintained. It can
also be seen that the disk-pad braking torque control is smooth and stable, which makes
it easier for the ABS actuator to handle, so better ABS stability and durability could be
achieved.
6.3. Split-mu ABS control method results
The simulation test environment is set for an emergency braking situation on a split-mu
road surface with an initial 80km/h vehicle speed. It is a low friction road surface with a
0.2 friction coefficient on the left-hand side of vehicle and a high friction road surface
with a 1 friction coefficient on the right-hand side. The low friction ABS control
method is implemented on the left-hand side of the vehicle, while the disk-pad braking
torque matching control method is implemented on the right-hand side. This ensures
that the generated tyre-road braking force matches the tyre-road braking force which
can be generated on the low friction surface side in order to avoid unwanted yaw motion
which causes a conflict between the direction of the vehicle and the driver’s intended
trajectory. The inputs in the low friction ABS control are as follows: The rate of
decrease in disk-pad braking torque in control phase 1 is -220000Nmm/s. Its rate of

127
increase in control phase 2 is 120000Nmm/s. The drop percentage in phase 1 is 99.5%,
and it is 99% in control phase 2.
Figure 6.15 Split-mu tyre longitudinal braking force on low friction surface
Figure 6.16 Split-mu tyre longitudinal braking force on high friction surface
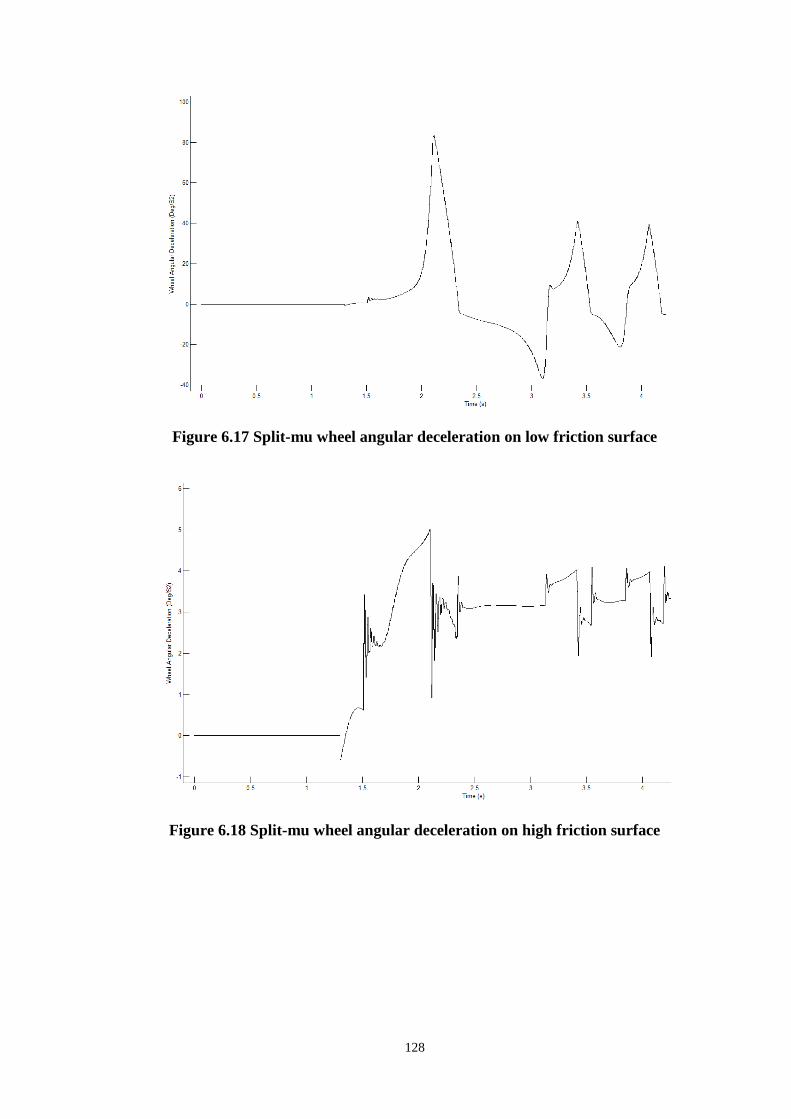
128
Figure 6.17 Split-mu wheel angular deceleration on low friction surface
Figure 6.18 Split-mu wheel angular deceleration on high friction surface

129
Figure 6.19 Split-mu vehicle longitudinal speed on low friction surface
Figure 6.20 Split-mu vehicle longitudinal speed on high friction surface
As seen in Figure 6.15, on a low friction surface, the ABS control tries to maintain the
tyre-road braking force at around its peak value, which is only around 700N. As seen in
Figure 6.16, on a high friction surface, ABS control tries to keep the tyre-road braking
force in a similar range as it would be on a low friction surface, instead of maintaining it
at its true peak value (around 3500N). Therefore, the tyre-road braking force is roughly

130
balanced between the left-hand side and the right-hand side, and the vehicle moves in a
straight line without any steering wheel input.
As seen in Figure 6.17, on a low friction surface, the wheel angular deceleration moves
up and down with the 0 axis as its middle line. This indicates full ABS control action,
which decelerates and accelerates to avoid wheel lock. As seen in Figure 6.18, on a high
friction surface, the wheel angular deceleration also moves up and down, but it is
always in a deceleration state and at a lower level than that on a low friction side. This
indicates that ABS control has not sufficiently slowed the wheels down. In the same
graph, a lot of noise can been seen, which is caused by some control instability.
Therefore, further control calibration is required.
As seen in Figure 6.19 and Figure 6.20, vehicle longitudinal speed slows down at a
similar rate on both low and high friction surfaces. This guarantees the synchronised
motion on both sides of the vehicle, so the vehicle moves in a straight line, which is one
of the main targets of the split-mu control.
6.3.1. Split-mu ABS conclusion
All the above simulation results prove the base line of the effectiveness of the
developed split-mu control method. As expected the stopping distance is increased by
about 90% compared with braking on a completely dry road, but the split-mu control
method allows the vehicle to decelerate without the wheels locking, with optimum tyre-
road braking force and with stabilisation of the yaw moment acting on the vehicle.
During the simulation only a small vehicle yaw angle presented. The split-mu control is
operated by ESP, therefore further control performance improvement on the high
friction side should be targeted with full ESP capability considered.
131
6.4. Overall discussion
6.4.1. Big data and reverse engineering
To develop a practical control method for an ABS vehicle safety system, especially
when tyre behaviour and other highly nonlinear parameters are involved, pure
mathematical model based control methods can be only used to establish initial control
set up guidance. Even very complex mathematical models can only guarantee a certain
level of accuracy. In real ABS control method implementation, a rules based control
method, or a combination of mathematical models and a rules based control method, are
superior.
Other than simulation, it is essential to implement the developed control method on a
real vehicle, and carry out related experiment tests. To achieve good control
performance, actual performance outputs should be compared with expected
performance outputs, bias should be identified, and the established control method
should be recalibrated. As well as being used for recalibration purposes, the real vehicle
experiment test can even be used to reverse engineer the basic control method. The idea
is to use real vehicle experiment tests results to establish an overall behavioural map of
the test vehicle. The experiment tests must cover the test vehicle’s behaviours under
different braking situations as thoroughly as possible. The data of the test results is then
analysed, which can enhance knowledge of how the controlled plant is behaving during
the expected control actions. The control method can then be redeveloped based on the
data from the analysis of the understood behaviours. The more data collected, and the
more efficient the data analysis method used, the more efficient and accurate a control
method can be developed.
6.4.2. Further improvement
On both high and medium friction road surfaces the high friction surface control logic
performs satisfactorily. But during the control input parameters tuning process some
compromises must be made to enable a balanced control logic to perform equally well
on both high and medium friction surfaces with only one set of control input parameters.

132
If the control logic can distinguish between high and medium friction surfaces, control
input parameters can be tuned individually so even better control performance on the
specified friction road surface could be achieved.
The low friction surface detection logic could be extended to distinguish between high
and medium friction surfaces. As discussed previously, it is a matter of extracting
another set of tyre-road braking force derivative threshold and the corresponding tyre-
road braking force value threshold from the data of the experimental test results. It
could share the same tyre-road braking force derivative threshold as the low friction
surface detection logic, albeit with a different tyre-road braking force value threshold.
133
7. Conclusions and Future Work
7.1. Conclusions
In this research, a new ABS control method has been developed based on reviews of the
commercialised and theoretical ABS control methods, an extensive understanding of the
physics of tyre force generation mechanisms, the disk-pad braking force generation
mechanism and the interaction between the two in a braking situation. In addition, with
the aid of the proposed in-wheel representative tyre forces measurement sensor that uses
an ultra-thin and flexible force sensor within the wheel hub, the new ABS control
method features the practicality of the commercialised ABS, but with reduced
complexity. Therefore, a reduction in the implementation costs is possible. A Simulink
control model had been developed based on the developed control method. A Subaru
Impreza ADAMS vehicle model has been developed and validated to simulate real
braking situations. A co-simulation environment has also been established between the
Simulink control model and the ADAMS vehicle model to test the performance
efficiency of the developed ABS control method. The overall performance of the
developed ABS control method is satisfactory.
Following this research, it can be concluded that, considering current technological and
implementation costs, there is no simple and straight forward solution for ABS control
method development. All current commercialised ABS control methods need to be
subject to analysis and understand the data from related real vehicle experimental tests
to adapt their algorithms to different types and models of vehicles in different
emergency braking scenarios. The tuning of the control input parameters and calibration
are also required to get the adapted control algorithm to perform efficiently in all
circumstances. Real vehicle testing and tuning requires man-power, effort, time, related
expertise and money, in order to achieve satisfactory ABS control performance. Adding
more ABS control related information from different kinds of sensors will help to
improve the accuracy and efficiency of ABS control, as well as reduce the cost and
complexity of implementation. This research has followed this direction to seek
alternatives to the current commercialised ABS control methods, while considering the
practical implementation in a real vehicle.

134
The ABS control method developed in this research is based on an understanding of the
fundamentals of an emergency braking scenario and the basic functionality of ABS. The
function of ABS is to maintain wheel rotational motion during emergency braking while
the vehicle is still moving. The ABS control target is to keep the tyre-road braking force
at its peak range while keeping the tyre-road lateral force capability within a sufficient
range, so that the overall brake distance could be shortened and steering ability can be
maintained. Fortunately, during emergency braking on a medium to high friction
coefficient road surface, when tyre-road braking force is maintained around its peak
range the tyre-road lateral force generation capability remains within a sufficient range
by default. ABS can then just focus on maintaining the tyre-road braking force at its
peak range. Fundamental theory based ABS control methods use slip ratio as a control
reference, but in reality, it remains difficult to acquire the information that is used to
calculate the slip ratio. At the same time, complex tyre experimental tests must be
carried out to determine the optimal slip ratio for different braking situations, for
example, with regards to braking on different friction coefficient road surfaces, at
different initial vehicle speeds, with different tyre vertical load forces, and so on. The
slip ratio control method must be able to identify the exact type of braking situation, so
it can establish the appropriate optimal slip ratio from the pre-scheduled slip ratio
mapping. This presents as another difficulty since a misjudgment could cause overall
control failure. Commercialised ABS, which is based on control rules, as well as the
majority of academic research oriented ABS, which is based on mathematical models,
have been developed to achieve the same control results.
The commercialised ABS control methods from Bosch and Wabco use sophisticated
logic that is based on information extracted from a large quantity of data from reverse
engineered experimental test results, along with ABS related theories. They use wheel
angular acceleration as an observer to ascertain the relationship between disk-pad
braking torque and tyre-road braking torque. For example, once disk-pad braking torque
is held constant, the trend of tyre-road braking torque could be observed. They also use
angular acceleration as a control reference to switch between different control phases.
Extra logic which adopts other control input parameters, such as reference wheel
peripheral speed and an estimation of its rate of decrease, and an estimation of the
reference slip ratio etc. must be used to aid the control phase alternation decision. Their

135
goal is to achieve an ABS control target in a practical way, by using a large amount of
real vehicle test data, sophisticatedly calibrated control input parameters, along with
complex logics to overcome practical issues encountered during different emergency
braking scenarios.
Some of the complex control logic and control references used in the commercialised
ABS control methods are not required in the proposed ABS, for example the reference
slip ratio, so the overall control method is simpler. This makes tuning and
implementation easier. Control decision time is therefore saved which allows the overall
control method to deliver faster control decisions, so more efficient control performance
is achieved. Also, the need for the related experimental tests which are required to
determine and calibrate different control input parameters used in this extra logic is
reduced. This leads to an easier and faster implementation process, so cost saving is
achieved. Finally, the dependency on wheel angular acceleration as the only direct main
control reference, and the inaccuracy and uncertainties introduced by the dynamic
changes involved in ABS related components in real ABS working conditions can be
overcome by using more directly measured information.
It is difficult for a purely mathematical model based ABS control algorithm to include
all the nonlinearities and uncertainties involved in an emergency braking scenario, even
when the model is very complex with many extra functionality models added. Even
then, if the behavioural interaction between these extra complex functionality models
and the main model are not fully understood, the whole model becomes inflexible. It
was established that within purely mathematical model based ABS control methods
there are always assumptions that some of the important parameters are known, but in
reality these parameters are very hard to measure. This is the main reason
commercialised ABS control methods are mainly rules based instead of mathematical
models based.
Compared to a purely mathematical model based ABS control method, the ABS control
method developed in this thesis is not characterized by unrealistic assumptions; second,
it does not rely heavily on mathematical models which in turn depend on a large number
of highly accurate measurements to be representative, so it is more practical to

136
implement. Once the new ABS control method is tuned and adapted on a vehicle in a
real vehicle experiment test based development process, it has the capability and
flexibility to cope with changes and uncertainties in different real braking situations.
The ABS control method proposed in this thesis shares the same control philosophy as
the basic theory based ABS, which is to maintain optimal wheel slip ratio. In
implementation, the new ABS control method uses the peak longitudinal tyre-road
braking force as a basic control reference. The longitudinal tyre-road braking force is
representable by an in-wheel force sensor measurement, which is used to detect the
point at which the local peak tyre-road braking force is reached and to identify its drop
in percentage after it has reached its peak point. This information is used to decide when
to activate ABS control or the alternate ABS control phase. Learning from
commercialised ABS and mathematical model based ABS control methods, the new
ABS control method adopted wheel angular acceleration as another control reference.
The wheel angular acceleration is used to identify control phases and decide which disk-
pad braking torque control action the control method is going to implement in the
identified control phase.
The new ABS control method then uses appropriate control actions learnt from
theoretical ABS control method and those from the commercialised ABS control
methods. These represent the natural and practical control actions and deliver good
control performance. Finally, the new ABS control method includes extra control logics
that do not require complex input parameters to aid the response to the changes in the
braking environment involved in real emergency braking situations. Accordingly, the
rules based control action switch method, in combination with the representative tyre-
road braking force measurement, and the wheel angular acceleration mathematical
model resulting from the tyre-road and disk-pad braking torques makes the control
method efficient enough to handle the nonlinearities and uncertainties involved in a real
ABS control process.
The proposed in-wheel tyre-road braking force measurement sensor integrates a
commercialised ultra-thin and flexible printed circuit force sensor into the space
between the outside wall of the wheel bearing and the inside wall of the wheel hub. The
137
individual force sensor can be placed at the front, back, and top of the outside wall of
the wheel bearing to measure the tyre acceleration force, braking force, and vertical load
force. In the proposed ABS control method, the exact tyre-road braking force
measurement is not required, only a representation of the tyre-road braking force is
necessary. This means that it does not necessarily have to match the exact value of the
measured target signal, but it must represent its trend and rate of change. The
representative measurement will increase, decrease, or hold whenever the original
signal does the same, and its rate of change must also match that of the original signal.
This reduces the performance requirements of the proposed sensor. This is in contrast to
the current complex force measurement sensors that use sophisticated wheel bearing
deformation mapping to extract the tyre-road braking force information (with an error
rate up to 20%).
This approach can also be contrasted to the method of planting metal wires inside the
tyre carcass to measure tyre deformation. The measurements are acquired by using the
electrical capacitance change between the wires, and the tyre deformation is then used
to extract tyre forces. In conclusion, the proposed tyre-road braking force representative
in-wheel force measurement sensor is more promising. It would be cheaper to
manufacture, easier to implement, and the measurement method is straight forward, so it
would generate accurate measurements. To further improve the performance of the
measurement of sensor, an automated recalibration logic could be implemented and
activated every time the brake pedal is pressed.
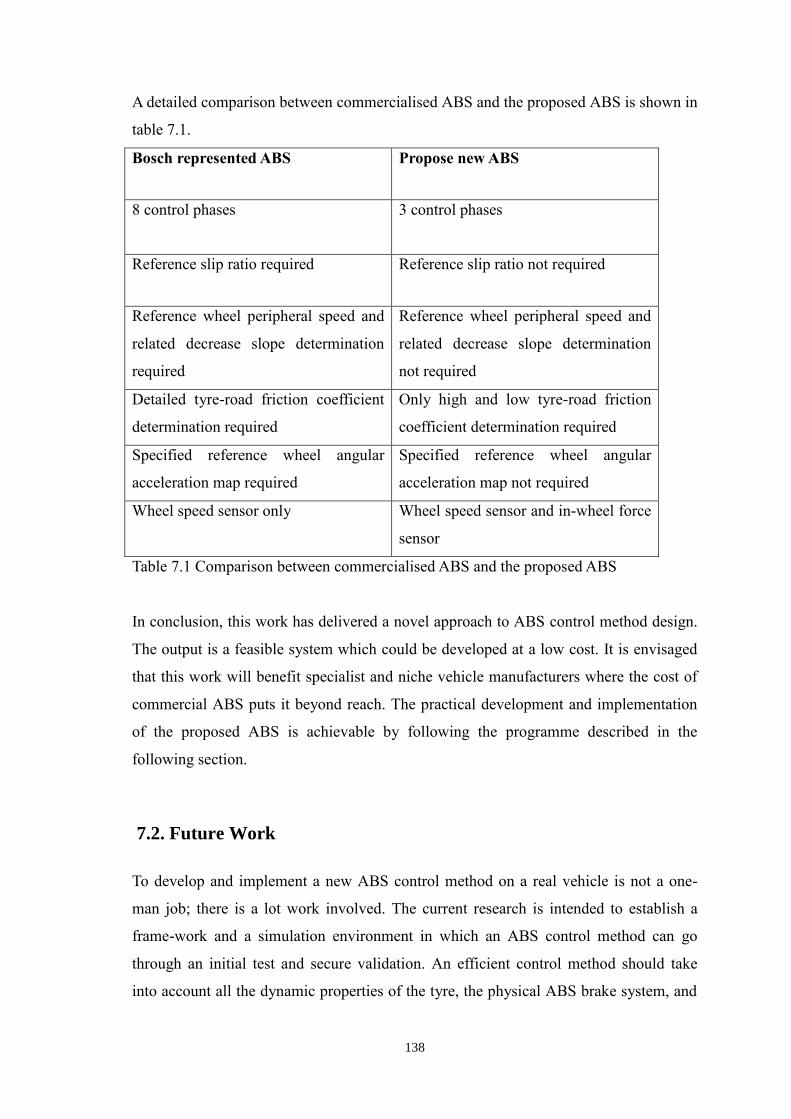
138
A detailed comparison between commercialised ABS and the proposed ABS is shown in
table 7.1.
Bosch represented ABS Propose new ABS
8 control phases 3 control phases
Reference slip ratio required Reference slip ratio not required
Reference wheel peripheral speed and
related decrease slope determination
required
Reference wheel peripheral speed and
related decrease slope determination
not required
Detailed tyre-road friction coefficient
determination required
Only high and low tyre-road friction
coefficient determination required
Specified reference wheel angular
acceleration map required
Specified reference wheel angular
acceleration map not required
Wheel speed sensor only Wheel speed sensor and in-wheel force
sensor
Table 7.1 Comparison between commercialised ABS and the proposed ABS
In conclusion, this work has delivered a novel approach to ABS control method design.
The output is a feasible system which could be developed at a low cost. It is envisaged
that this work will benefit specialist and niche vehicle manufacturers where the cost of
commercial ABS puts it beyond reach. The practical development and implementation
of the proposed ABS is achievable by following the programme described in the
following section.
7.2. Future Work
To develop and implement a new ABS control method on a real vehicle is not a one-
man job; there is a lot work involved. The current research is intended to establish a
frame-work and a simulation environment in which an ABS control method can go
through an initial test and secure validation. An efficient control method should take
into account all the dynamic properties of the tyre, the physical ABS brake system, and

139
the suspension system. The control method should also have different control logics to
cope with different braking situations, such as different road surfaces, brake disk and
pad friction coefficient changes due to temperature change, and other unpredictable
situations. A large number of experimental tests and an analysis of the results are
necessary to tune and fit the control method for it to be ready for implementation on the
target vehicle.
The mechanical and hydraulic brake system properties, such as pressure build-up or
release delay, have not been taken into account in the simulation model presented here.
Further work could include the ABS hydraulic system model in the simulation.
The implementation of the ABS control method on a real vehicle is an important aspect
of potential future research. In regard to implementing the developed ABS control
method on a real vehicle, the first stage in the progress requires the collection of the
target vehicle’s basic statistics, including its vehicle mass, mass distribution, tyre
dimensions, brake disk and pad dimensions, friction coefficient (including changes
related to temperature), brake force distribution ratio and so on. With this information
some fundamental calculations can be carried out to establish a basic set-up of the
necessary ABS control input parameters for the developed control method. The second
stage is to carry out tyre testing on different friction coefficient surfaces with different
vertical loads, to collect the related tyre-road braking force data. The collected data is
then analyzed to establish some other ABS control related parameters, including the
average available tyre-road braking force on high medium and low friction surfaces, as
well as the maximum percentage drop in the peak tyre-road braking force that would
still maintain a sufficient tyre-road braking force and lateral force (which guarantee
basic ABS functionality).
A method could be developed to analyse the data from these tests efficiently. Such a
method could also be used to improve the test procedures plan. A systematic method
could be developed by combining both the test procedure plan and the test data analysis.
Lastly, all the analyzed data from the tests can be used to identify the ABS hardware
specification necessary to meet the proposed ABS control method’s requirements for
disk-pad braking torque and tyre-road braking torque interaction. When choosing ABS
140
hardware it is very important to strike a good balance between the hardware capability,
the tyre-road braking torque capability, and the ABS control method operational
capability which regulates the disk-pad braking torque to achieve the desired tyre-road
braking torque interaction. Once the real vehicle test environment is established, the
initially developed ABS control method can be tested in real time. The real action
control performance data is then analyzed to recalibrate any offset control input
parameters before being added to the control method for retesting until a stable control
performance is achieved.
ABS is fundamental to a vehicle safety system. Traction control is the opposite of ABS;
it brakes the spinning wheels while the vehicle accelerates; but its control goal is similar
to ABS, in that it seeks to maximize longitudinal tyre-road force while maintaining the
lateral tyre-road force capacity. ESP is developed based on ABS and traction control but
at a higher level. It requires extra sensors, including a steering wheel angle sensor, a
yaw rate sensor and a lateral acceleration sensor. ESP has the capability to build up
disk-pad braking pressure independent of the brake pedal position, which could be used
in an ABS to improve its disk-pad braking torque reapplication efficiency. Other than
the above three systems, more advanced vehicle safety systems at different levels have
been developed recently, including adaptive load control, roll over mitigation control,
adaptive cruise control and so on.
The well-established integration of these vehicle safety systems could allow all the data
from the sensors’ measurements to be shared through an efficient communication layout
between all individual systems. This leads to high accuracy, efficient control
performance and less complexity regarding to the implementation of the ABS control
method. For example, ABS can use the yaw rate sensor and steering wheel angle sensor
to identify a split mu braking situation, as well as to adjust the control action according
to the difference between the reference and measured yaw rate. All these require an
effective higher level controller that could coordinate different individual systems to
work as one to adapt to different emergency situations. The development of such a high-
level controller should be an important feature of future research.
141
References
Sahin, M. and Samim Ünlüsoy, Y. (2010) ‘Design and simulation of an ABS for an
integrated active safety system for road vehicles’, Int. J. Vehicle Design, Vol. 52, Nos.
1/2/3/4, 64–81.
Damiano Capra, Nicolò D’Alfio, Andrea Morgando and Alessandro Vigliani, (2009)
‘Experimental Test of Vehicle Longitudinal Velocity and Road Friction Estimation for
ABS System’, SAE paper 2009-01-0428.
Fredrik Gustafsson, Stefan Ahlqvist, Urban Forssell, and Niclas Persson, (2001) ‘Sensor
fusion for accurate computation of yaw rate and absolute velocity’, SAE 2001-01-1064.
Mathieu Gerard, Matteo Corno, Michel Verhaegen, and Edward Holweg, (2010) ‘Two-
phase Anti-lock Braking System using Force Measurement’, AVEC 10, Coventry
University.
Bulent Ozdalyan, (1999) The integration of tyre, suspension and ABS models into
vehicle braking simulations. PhD Thesis. Coventry University.
Mathieu Gerard, Antonio Loria, William Pasillas-Lepine, and Michel Verhaegen, (2010)
‘Design and experimental validation of a cascaded wheel slip control strategy’, AVEC
10, Coventry University.
Terry D. Day and Dydney G. Roberts, (2002) ‘A simulation model for vehicle braking
systems fitted with ABS’, SAE paper 2002-01-0559.
Robert Bosch GmbH, (2004) Bosch Automotive Handbook 6th edition. Wiley-
Blackwell.
Gobbi, M., Guarneri, P., Mastinu, G., and Rocca, G. (2010) ‘A smart wheel for
improving the active safety of road vehicles’, AVEC 10, Coventry University.

142
Jorge Sans Sangorrin, Jan Sparbert, Ulrike Ahlrichs and Wolfgang Branz, (2010)
‘Sensor data fusion for active safety systems’, SAE paper, 2010-01-2332.
Ryosuke Matsuzaki, and Akira Todoroki, (2006) ‘Passive wireless strain monitoring of
actual tyre using capacitance–resistance change and multiple spectral features’, Sensors
and Actuators, A 126 277–286.
Sami Koskinen, (2010) Sensor data fusion based estimation of tyre/road friction to
enhance collision avoidance. PhD thesis. Tampere University of Technology.
Hossein Mirzaeinejad, and Mehdi Mirzae, (2010) ‘A novel method for non-linear
control of wheel slip in anti-lock braking systems’, Control Engineering Practice 18,
918–926.
Deng Kun, Li Kaijun, and Xia Qunsheng, (2006) ‘Application of Unscented Kalman
Filter for the state estimation of Anti-lock Braking System’, Vehicular Electronics and
Safety, ICVES 2006, IEEE International Conference.
Shannon L. Miller, Brett Youngberg, Alex Millie, Patrick Schweizer, J. Christian
Gerdes, (2001) ‘Calculating longitudinal wheel slip and tyre parameters using GPS
velocity’, Proceedings of the American control conference Arlington, VA June 25-27.
Tanelli, M., Savaresi, S., and Cantoni, C. (2006) ‘Longitudinal vehicle speed estimation
for traction and braking control systems’, Proceedings of 2006 IEEE International
Conference on Control Applications.
Eichhorn, U., and Roth, J. (1992) ‘Prediction and Monitoring of Tyre/Road Friction’,
Proceeding of XXIV FISITA Congress, London.
Kiencke, U., and Nielsen, L. (2000) Automotive Control Systems. Spring-Verlag.
Van, der, Jagt, P., Pacejka, H.B., and Savkoor, A.R.(1989) ‘Influence of tyre and
suspension dynamics on the braking performance of an anti-lock system on uneven

143
roads’, Proceedings of 2nd International EAEC conference on New Developments in
Powertrain and Chassis Engineering, Strasbourg, France.
Blundell, M., and Harty, D. (2004) The multibody systems approach to vehicle
dynamics. Elsevier.
Pacejka, H. B., Bakker, E. (1993) ‘The magic formula tyre model, supplement Vehicle
system dynamics’, Vol 21:1-28.
Gipser, M. (1999) ‘FTire, a New Fast Tire for Ride Comfort Simulations’, International
ADAMS User’s Conference, Berlin, Germany
Crolla, D.A., and Whitehead, J.P. (2003) ‘Vehicle Dynamics, Control and Suspensions’,
University of Leeds, Leeds.
Kimbrough, S., and Datla, K. (1996) ‘Effective means for implementing wheel slip
control without a groundspeed sensor’. In: Proceedings of the 14th IAVSD Symposium
on the Dynamics of Vehicles on Roads and Tracks, in Vehicle System Dynamics, vol. 25,
p. 327–39.
Hee Young Jo, Jae Min Yun, Sang Ho Lee, Jun Hong Park, and Jung Yun Kim, (2010)
‘Measurement Method of the Tyre Lateral Force for the Use of Chassis Control System’,
AVEC 10, Coventry University.
Bosch Website
<http://de.Bosch-automotive.com> [Accessed Jan.2012]
Clemson University Vehicular Electronics Laboratory website
<http://www.cvel.clemson.edu/auto/systems/braking.html> [Accessed Jan.2012]
EU vehicle safety regulation
<http://eur-lex.europa.eu/legal-content/EN/TXT/?uri=CELEX:32015R0068> [Accessed
Jan.2012]
144
Ftyre website
<http://cosin.eu> [Accessed Jan.2012]
Hyundai Motor company ABS training document
<http://www.myshared.ru/slide/885201> [Accessed Jan.2012]
Tekscan website force sensor
<www.tekscan.com> [Accessed May.2012]
Transport research lab UK
<http://www.rulesoftheroad.ie/index.html> [Accessed Jan.2012]