a service curve approach to demand response jean-yves le boudec dan-cristian tomozei 1 1
Post on 19-Dec-2015
262 views
TRANSCRIPT

A SERVICE CURVE APPROACH TO DEMAND RESPONSE
Jean-Yves Le BoudecDan-Cristian Tomozei
11

AgendaDemand Response
Service Curve ApproachUser Side Optimization
Operator Side Optimization
2
Demand Response
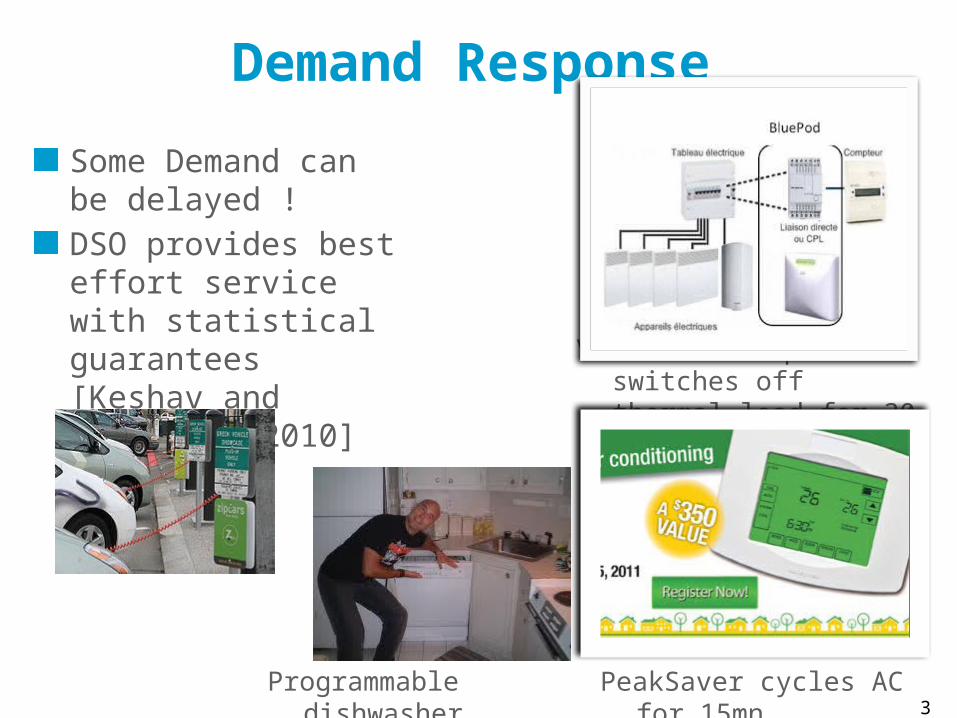
Some Demand can be delayed !DSO provides best effort service with statistical guarantees [Keshav and Rosenberg 2010]
3
Voltalis Bluepod switches off thermal load for 30 mn
PeakSaver cycles AC for 15mnProgrammable dishwasher

Price vs QuantityPeaksaver, Bluepod act by quantity control
DSO/Aggregator switches off appliance
Price control often proposed as alternative
Users save when price is high[Meyn 2010] : high volatility is an inherent feature of electricity markets
4
[Conejo et al, 2010]

Centralized vs Distributed ControlDirect control by DSO/Aggregator for air conditioning, dryers
Not scalable, does not adapt to diversity and flexibility
Appliance control should be done close to end-users
5
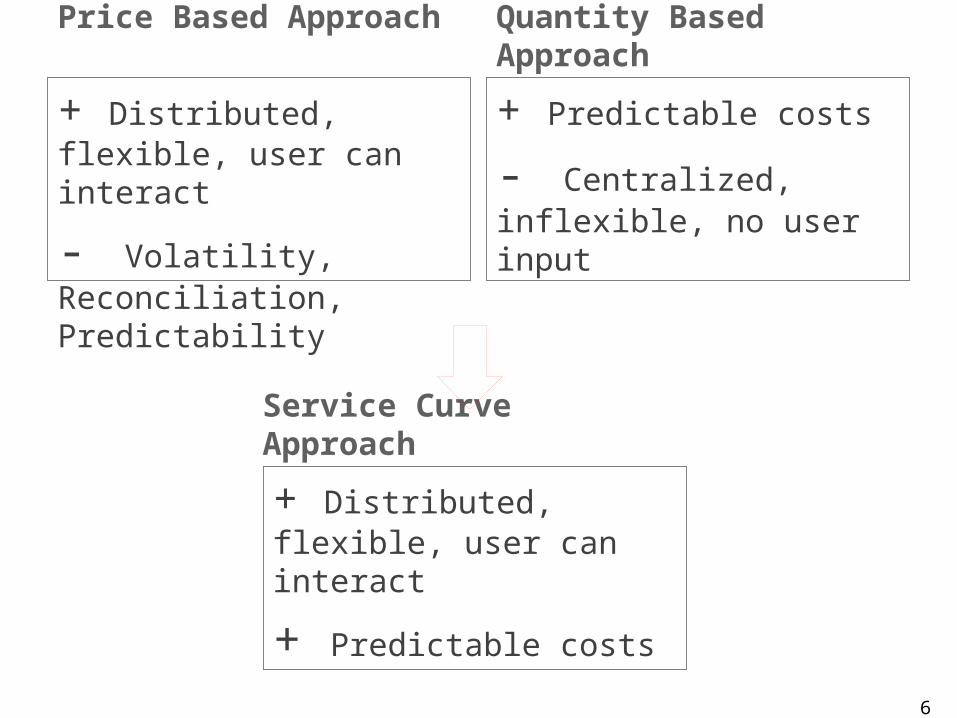
Price Based Approach
+ Distributed, flexible, user can interact
- Volatility, Reconciliation, Predictability
Quantity Based Approach
+ Predictable costs
- Centralized, inflexible, no user input
6
Service Curve Approach
+ Distributed, flexible, user can interact
+ Predictable costs

Definition of Service Curve Approach
1. Customer agrees to be throttled, with a bound
2. Fixed price per kWh3. Total load is controlled
7
DSO
Service curvecontract
Instant power
Control by DSO
Service curve

Example 1:Load
Switching
At most 30 mn of interruption total per dayOr reduction to for 60mn total per day
8

Example 2:Two Level
Control
Similar, but a minimum power is guaranteedBetter suited (than ex 1) when applied to an entire home /enterprise
9

The Maths of Two-Level
ControlThe constraint on is equivalent to
i.e. the allowed energy per window of time is lower bounded
10

User Side OptimizationUser can observe past signals and predict worst case futureSmart home controller can manage load accordingly
[LeBoudec Tomozei 2011]
11

Provider Side Optimization
Provider may send smooth signals
E.g. to many customers, for long periods of time
Or bursty signalsE.g. to selected customers, for shorter periods of time
Smooth signals are optimal for stationary but random loads, bursty signal are better for shaving peaks
12

EPFL Testbed
13

ConclusionsWe propose a service curve approach to demand response
DistributedApplies to total customer loadProvides large flxibility to providerProtects user from price uncertainty
14
[Le Boudec Tomezei 2011] Le Boudec J.Y. and Tomozei, D.C “Demand Response Using Service Curves”, EPFL-REPORT-168868, https://infoscience.epfl.ch/record/168868, 2011