a sensitive colorimetric procedure for nitrogen determination in micro-kjeldahl digests
TRANSCRIPT

416 J. Agric. Food Chem. 1982, 30, 416-420
for trace levels of psoralens. We have shown that root and foliage samples of the carrot variety studied here contain no or, a t most, very low (((0.5 ppm) quantities of any of a number of psoralens, including several of simple bio- genetic complexity. Thus, our studies suggest that carrot, unlike many related plants (including some edible vege- tables) does not possess biosynthetic pathways for the production of linear furocoumarins.
Psoralens are highly biologically active compounds with much medicinal value. As a result of their biochemical modes of action, particularly their photomutagenic prop- erties which may lead to photocarcinogenicity and possibly other detrimental effects in man, it seems prudent to carefully evaluate the potential for exposure of man to psoralens through foodstuffs. The procedures described in this report for the analysis of trace levels of psoralens in plants should prove useful in such investigations.
LITERATURE CITED Ashwood-Smith, M.; Poulton, G.; Barker M.; Mildenberger, M.
Berenbaum, M.; Feeny, P. Science (Washington, D.C.) 1981,212, Nature (London) 1980, 285, 407.
927.
Fahmy, I. J . Pharm. Pharmacol. 1956,8, 653. Ivie, G. J. Agric. Food Chem. 1978a, 26, 1394. Ivie, G. In "Effects of Poisonous Plants on Livestock"; Keeler,
R.; Van Kampen, K.; James, L., Eds.; Academic Press: New York, 1978b; p 475.
Ivie, G.; Holt, D.; Ivey, M. Science (Washington, D.C.) 1981,213, 909.
Musajo, L.; Caporale, G.; Rodighiero, G. Gazz. Chim. Ztal. 1954, 84, 870.
Pathak, M.; Daniels, F., Jr.; Fitzpatrick, T. J. Znuest. Dermatol. 1962, 39, 225.
Reed, B. Acta Derm.-Venereol. 1976, 56, 315. Scheel, L.; Perone, V.; Larkin, R.; Kupel, R. Biochemistry 1963,
Scott, B.; Pathak, M.; Mohn G. Mutat. Res. 1976, 39, 29. Steck, W. Can. J . Chem. 1967,47, 3577. Stern, R.; Thibodeau, L.; Kleinerman, R.; Parrish, J.; Fitzpatrick,
T. N. Engl. J. Med. 1979, 300, 809.
2, 1127.
Received for review August 24,1981. Accepted February 5,1982. This paper reports the resulk of research only. Mention of a trade name, proprietary product, or specific equipment does not con- stitute a guarantee or warranty by the U S . Department of Ag- riculture and does not imply its approval to the exclusion of other products that may be suitable.
A Sensitive Colorimetric Procedure for Nitrogen Determination in Micro-Kjeldahl Digests
Charles Nkonge and G. Murray Ballance*
The need for a sensitive and accurate method for ammonia estimation in micro-Kjeldahl digests led to the reexamination of the optimum conditions of a colorimetric assay based on the Berthelot reaction. The specific procedure involves the reaction of salicylate and hypochlorite with ammonia. A minimum 40 % improvement in sensitivity over other colorimetric procedures was achieved by optimization of reagent concentrations, temperature, pH, and incubation time. Comparison of values obtained by this procedure and by titration is in excellent agreement. A scaled-down procedure agreed well with the standard procedure.
The aim of our work was to measure lysine, tryptophan, and protein from single distal half-seeds. Such measure- ments should allow identification (without destruction) of genotypes with desirable protein quality characteristics. The main difficulty in achieving this goal was finding or developing assays which were sufficiently sensitive to allow the three analyses to be carried out on single half-kernels of common cereals.
For estimation of protein in cereals, the Kjeldahl method has been widely used. This is due to (1) the ability of the Kjeldahl method to quantitate nitrogen from either soluble or insoluble samples, (2) the nitrogen from cereal samples being largely derived from protein, and (3) the amino acid composition of endosperm protein being sufficiently con- stant so as to have a relatively fixed nitrogen to protein ratio within a given cereal. Thus the protein can be es- timated from the nitrogen value.
The classical Kjeldahl procedure involves two steps: (1) digestion of the sample in concentrated acid and (2) dis- tillation and titration of the liberated nitrogen as ammonia. The second step requires special equipment for distillation, and where large numbers of samples are to be analyzed,
Department of Plant Science, University of Manitoba, Winnipeg, Manitoba, Canada R3T 2N2.
002 1-856 1 / 8 2 / 1430-04 16$0 1.25/0
this step is relatively slow. Thus, alternative methods for estimation of liberated ammonia directly from the digest have been examined. These include spectrophotometric estimation of volatilized ammonia (Muroski and Syty, 1980), colorimetric methods (Wall and Gehrke, 1975; Mitcheson and Stowell, 1970), and quantitation using an ammonia specific electrode (Eastin, 1976).
A colorimetric method based on the Berthelot reaction was chosen because of its sensitivity, the availability of equipment, and the potential to automate the method at a later date. Various combinations of different phenol reagents and sources of available chlorine have been tested in the Berthelot reaction of ammonia estimation (Patton and Crouch, 1977; Yamaguchi et al., 1970; Reardon et al., 1966). Because of conflicting reports in the literature regarding optimum conditions, we have reexamined many of the parameters not only to obtain the optimized con- ditions but also to determine how a change in any one parameter affects the overall sensitivity of the reaction.
Our nitrogen assay procedure was developed to be used in conjunction with two other assays, so that a single half-kernel would provide adequate sample for all three analyses. Thus, the need for sensitivity in the nitrogen assay lies (1) in the desire to use the minimum amount of sample for digestion and (2) the requirement that the ammonia can be accurately quantitated after the digest
0 1982 American Chemical Society
Colorimetrlc Procedure for Nitrogen Determination
has been diluted sufficiently to avoid interference by the Kjeldahl catalyst ions. Preliminary tests indicated that if 1 g of catalyst was used, the digest must be diluted to at least 50 mL to avoid interference with the colorimetric assay.
In the development of this assay, the optimization of parameters was conducted by using ammonium sulfate as a source of nitrogen. For comparison of the optimized colorimetric procedure with the classical titration proce- dure, micro-Kjeldahl digests of seed tissues were analyzed. Finally, so that the method could be tested at a scale comparable to that required for half-seeds, the micro- Kjeldahl digest was scaled down, and the results for seed flour samples were compared to those obtained in our standard-sized test.
EXPERIMENTAL SECTION Equipment. Kjeldahl digestions were carried out in
micro-Kjeldahl flasks with 100-mL calibration marks. For the colorimetric assay, the absorbance values were mea- sured by using a Zeiss PMQ I1 spectrophotometer with 1.0-cm glass cuvettes. The variable slit width allowed the effective band-pass to be set a t 3 nm. A Beckman digital pH meter with a general-purpose glass electrode was used for pH measurement. Reported pH values were corrected for sodium error according to the electrode manufacturer's instructions.
Chemicals. All chemicals used in the colorimetric assay were reagent grade. The Kjeldahl catalyst mixture (Pope Kjeldahl Mixtures, Dallas, TX) contained on a weight basis 0.3% TiOz, 0.3% CuS04, and 10% KzS04 with the re- mainder being pumice. Commercial liquid bleach was used as the source of sodium hypochlorite.
Sample Preparation. Samples used in the comparison of the titration and colorimetric procedures were derived from cereal and legume grains ranging in crude protein from 7 to 29% ( N X 5.7). Samples were individually ground to a fine grist in a Udy cyclone mill prior to mi- cro-Kjeldahl digestion.
Micro-Kjeldahl Digestion Conditions. Samples were accurately weighed (50-100 mg) into micro-Kjeldahl flasks to which the catalyst mixture (1.0 g) and concentrated sulfuric acid (3.0 mL) were added. The digests were heated for 20 min beyond the point when the solutions had cleared. They were then cooled and diluted to 100 mL with distilled water.
Standard nitrogen solutions which were used for estab- lishing optimum assay conditions were prepared by using oven-dried (3 h at 103 "C) ammonium sulfate. The am- monium sulfate (47.16 mg) was substituted for the sample in the above digest conditions. This digest, after dilution to 100 mL, yielded a solution of 100 pg of N/mL. Blank digests were prepared in an identical manner by using only catalyst and acid; blank digests were used for dilution of the 100 pg of N/mL standard solution to suitable values,
Reagents for Ammonia Estimation. (1) The working buffer was prepared from two stock solutions. Solution A was composed of Na2HP04 (0.20 M), NaOH (0.20 M), and sodium potassium tartrate tetrahydrate (0.36 M) prepared in distilled deionized water. Solution B was 2.50 M NaOH. The working buffer was prepared by mixing A and B on a 1:l volume basis. (2) Salicylate-nitroprusside reagent was prepared by dissolving sodium salicylate (20.0 g) and sodium nitroprusside (30.0 mg) in distilled deionized water and diluting to 100 mL. (3) Hypochlorite solution of the appropriate concentration was prepared just prior to use by dilution of commercial bleach [5.2% w/v; available chlorine as determined by Method 6.111 (AOAC, 1975)] with distilled deionized water.
J. Agric. Food Chem., Vol. 30, No. 3, 1982 417
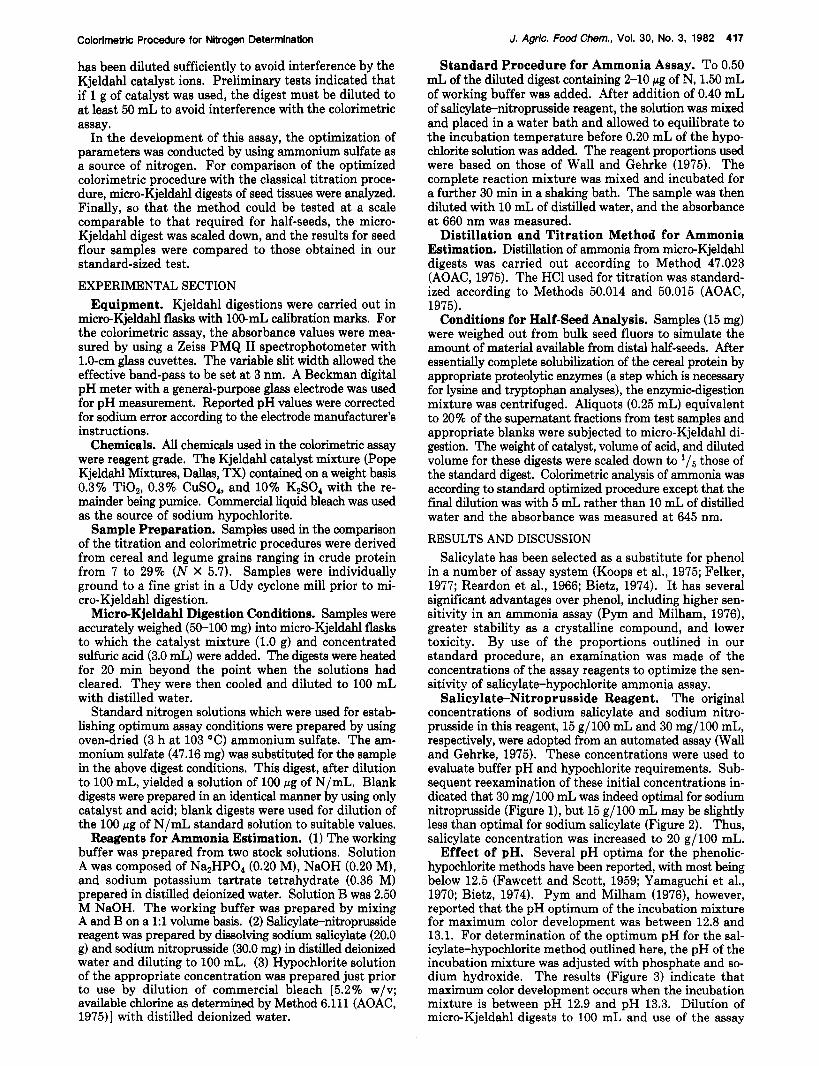
Standard Procedure for Ammonia Assay. To 0.50 mL of the diluted digest containing 2-10 pg of N, 1.50 mL of working buffer was added. After addition of 0.40 mL of salicylatenitroprusside reagent, the solution was mixed and placed in a water bath and allowed to equilibrate to the incubation temperature before 0.20 mL of the hypo- chlorite solution was added. The reagent proportions used were based on those of Wall and Gehrke (1975). The complete reaction mixture was mixed and incubated for a further 30 min in a shaking bath. The sample was then diluted with 10 mL of distilled water, and the absorbance at 660 nm was measured.
Distillation and Titration Method for Ammonia Estimation. Distillation of ammonia from micreKjeldahl digests was carried out according to Method 47.023 (AOAC, 1975). The HC1 used for titration was standard- ized according to Methods 50.014 and 50.015 (AOAC, 1975).
Conditions for Half-Seed Analysis. Samples (15 mg) were weighed out from bulk seed fluors to simulate the amount of material available from distal half-seeds. After essentially complete solubilization of the cereal protein by appropriate proteolytic enzymes (a step which is necessary for lysine and tryptophan analyses), the enzymic-digestion mixture was centrifuged. Aliquots (0.25 mL) equivalent to 20% of the supernatant fractions from test samples and appropriate blanks were subjected to micro-Kjeldahl di- gestion. The weight of catalyst, volume of acid, and diluted volume for these digests were scaled down to 1/5 those of the standard digest. Colorimetric analysis of ammonia was according to standard optimized procedure except that the final dilution was with 5 mL rather than 10 mL of distilled water and the absorbance was measured at 645 nm.
RESULTS AND DISCUSSION Salicylate has been selected as a substitute for phenol
in a number of assay system (Koops et al., 1975; Felker, 1977; Reardon et al., 1966; Bietz, 1974). It has several significant advantages over phenol, including higher sen- sitivity in an ammonia assay (Pym and Milham, 1976), greater stability as a crystalline compound, and lower toxicity. By use of the proportions outlined in our standard procedure, an examination was made of the concentrations of the assay reagents to optimize the sen- sitivity of salicylate-hypochlorite ammonia assay.
Salicylate-Nitroprusside Reagent. The original concentrations of sodium salicylate and sodium nitro- prusside in this reagent, 15 g/100 mL and 30 mg/100 mL, respectively, were adopted from an automated assay (Wall and Gehrke, 1975). These concentrations were used to evaluate buffer pH and hypochlorite requirements. Sub- sequent reexamination of these initial concentrations in- dicated that 30 mg/ 100 mL was indeed optimal for sodium nitroprusside (Figure l), but 15 g/100 mL may be slightly less than optimal for sodium salicylate (Figure 2). Thus, salicylate concentration was increased to 20 g/100 mL.
Effect of pH. Several pH optima for the phenolic- hypochlorite methods have been reported, with most being below 12.5 (Fawcett and Scott, 1959; Yamaguchi et al., 1970; Bietz, 1974). Pym and Milham (19761, however, reported that the pH optimum of the incubation mixture for maximum color development was between 12.8 and 13.1. For determination of the optimum pH for the sal- icylate-hypochlorite method outlined here, the pH of the incubation mixture was adjusted with phosphate and so- dium hydroxide. The results (Figure 3) indicate that maximum color development occurs when the incubation mixture is between pH 12.9 and pH 13.3. Dilution of micro-Kjeldahl digests to 100 mL and use of the assay

410 J. Agric. Food Chem., Vol. 30, No. 3, 1982 Nkonge and Ballance
r
0.0 I 1 1 I I I 0 20 40 60 80 100
SODIUM NITROPRUSSIDE (mg / 100 m4 ) Figure 1. Effect of sodium nitroprusside concentration on color yield for 4 (0) and 10 (0) pg of N.
1.4 [
0.0 0 5 IO 15 20 2 5 30
SODIUM SALICYLATE ( g /100ml) Figure 2. Effect of sodium salicylate concentration on color yield for 4 (0) and 10 (0) kg of N.
buffer described above allowed 0.5-mL samples to be used in the assay mixture without causing a shift in pH away from this optimum region. Routinely, the resultant pH of the incubation mixture is 13.1. The present pH opti- mum curve differs from that of Pym and Milham (1976) in that no shoulder was observed in our study.
Effect of Available Chlorine Concentration on the Sensitivity. In the phenol-based methods for ammonia nitrogen determination with nitroprusside as a catalyst, various concentrations of available chlorine have been used. On the basis of the incubation volume, there con- centrations ranged from as low as 0.016% (Miller and Rice, 1963) to as high as 0.095% (Searcy et al., 1965). Prelim- inary results using a modification ( W d and Gehrke, 1975) of the salicylate-based method of Reardon et al. (1966) indicated that an optimum concentration for available chlorine occurred between the above two values.
For determination of the optimum level of available chlorine, commerical bleach was diluted with distilled deionized water to prepare hypochlorite solutions con-
8 0.6 m m a
0 . 4
A L
0.0 - 7 T T IO. 5 11.5 12.5 13.5
PH Figure 3. Color yield as a function of incubation pH for 0 (A), 5 (O), and 10 (0) pg of N.
1.2 r
0.0 0.4 0.8 1.2 1.6 2.0 0.0 1 - 1 I
0.0 0.4 0.8 1.2 1.6 2.0
AVAILABLE CHLORINE (O/o W/V)
Figure 4. Effect of available chlorine concentration on color yield for 0 (a), 4 (O), and 8 (A) pg of N.
taining available chlorine in the range 0-2.0%. These solutions were used in the standard procedure and resulted in available chlorine in the range 0 4 1 5 % in the incuba- tion mixture.
The absorbance values which were measured for two concentrations of nitrogen at the various available chlorine levels are shown in Figure 4. For optimum sensitivity using the proportions outlined in the standard procedure and an incubation at 25 "C for 30 min, the hypochlorite reagent should be diluted to contain 0.60% available chlorine. This corresponds to 0.046 % available chlorine in the incubation mixture. Incubation concentrations in the range 0.040-0.052% give essentially the same absor- bance values.
Effect of Incubation Temperature. Koops et al. (1975) reported that in using the salicylate-dichloroiso- cyanurate method, any delay between addition of reagenh (at room temperature) and incubation at 40 O C for 15 min resulted in an increase in the absorbance values. Koops et al. thus recommended that not more than two digests be treated a t one time. This severely restricts the use- fulness of such a procedure. Most other authors have used 37 "C as their incubation temperature (Weatherburn, 1967; Yamaguchi et al., 1970; Reardon et al., 1966).
Colorimetric Procedure for Nitrogen Determlnatlon
0.2
Table I. Effect of Incubation Temperature on Maximum Absorbance
- .
J. Agric. FoodChem., Vol. 30. No. 3, 1982 410
1.2 I-
~~
% of max absorbance for incubation exptl temp, "C condi- tions 25 30 35 40 45 50 A 99 95 90 86 79 74 B 99 97 90 86 81 76 C 100 99 96 95 93 90
In the present study, the observation of Koops et al. (1975) was confirmed and three conditions were used to elaborate on this effect. The results are presented in Table I. In all three cases 8 bg of N was used. For condition A, all reagents were added and the complete reaction mixture was placed at the incubation temperature imme- diately upon addition of the hypochlorite. For condition B all reagents except hypochlorite were added and the samples kept a t 22 "C for 10 min. Hypochlorite was then added and the reaction mixture immediately incubated at the incubation temperature. For condition C all reagents including hypochlorite were added and kept a t 22 "C for 10 min before incubating at one of the higher tempera- tures. In all cases the samples were incubated at the higher temperatures for 30 min. It is recognized that for condition C the actual incubation time was 40 min, but since all samples should have reached maximum color development (see Figure 5), comparisons to conditions A and B should not be seriously in error.
Regardless of the conditions used, higher incubation temperatures gave lower absorbance values. Comparisons of conditions A and B indicate that part of the complete reaction mixture is labile, not an intermediate involving just ammonia and salicylate in alkaline solution. Had the latter been the case, condition B might have resulted in diminished color formation compared to condition A. Comparison of condition C to A clearly shows the effect Koops et al. (1975) observed in their study using a 40 "C incubation temperature. Any delay in transferring the complete reaction mixture from room temperature to a higher incubation temperature results in a higher color yield. This appears to be due to a heat-labile intermediate in the overall reaction rather than to a heat-labile final chromophore. The color, once fully developed, decreased by less than 5% upon a further 30-min incubation at 50 "C.
On the basis of the trend in Table I, incubation tem- peratures of less than 25 "C might be even more effective for improved color development. However, for our pro- cedure the recommended incubation temperature is 25 "C as this was the minimum temperature which was readily controllable. The sample plus salicylate-nitroprusside and working buffer mixture should be equilibrated at this temperature prior to hypochlorite addition. This proce- dure overcomes the problem of having to treat only a few samples at a time (Koops et al., 1975).
Incubation Time. By use of the optimum conditions of reagent concentration and pH, the time it took to reach maxmium color development a t 25 "C was measured (Figure 5). An incubation time of 30 min is sufficient for full color development. With incubation times greater than 30 min, a slow increase in blank values is observed.
General Discussion. For maximum color develop- ment, the parameters studied above are considered most important, although age of reagents could be important as well (Felker, 1977). Investigation of the salicylate-ni- troprusside reagent stored in the dark, at 4 "C, and at room temperature, for up to 1 year, indicated this reagent was quite stable, except that for reagent stored at room tem-
Table 11. Comparison of Relative Sensitivities of Reported Methods
absorb- absorb- ance
(10 p g dilution N-l (10 of N)-l v01, mL reference mL)-'
ance final (Pi? of
1.65 2.31 Bietz (1974) 0.038 1.06 10.0 Reardon et al. (1966) 0.106 0.430 25.0 Patton and Crouch (1977) 0.108
0.488 25.0 Pym and Milham (1976) 0.122 1.38 12.6 this paper 0.174
2.55 4.3 Felker (1977) 0.110 1.33 9.1 Koops et al. (1975) 0.121
perature, the blank values increased. Net color values obtained for a given amount of ammonia were identical with those obtained with fresh reagent, however. Because pH is important, it is advisable to keep alkaline buffer solutions tightly capped to minimize the dissolution of COP Our solutions were normally prepared every 2 weeks. The stability of the stock hypochlorite solution was also ex- amined; the level of available chlorine dropped from 5.2 to 3.9% over an 18-month period at room temperature, thus requiring adjustment of the dilution ratio to maintain the optimum level of available chlorine in the incubation mixture.
Because the absorbance maximum is dependent upon pH (Pym and Milham, 19761, the spectrum of the chro- mophore in the optimized digest was examined. The A, occurred a t 647 nm, which is in agreement with values reported by Pym and Milham (1976) for a pH in the region of 13. For convenience and because the absorption curve is broad, all subsequent measurements were made at 645 nm.
Discussion of the relative sensitivities of various methods is complicated by the fact that the various procedures employ different degrees of dilution. So that a comparison with other procedures can be made, the data have been reduced to a common value; the absorbance obtained per microgram of nitrogen in a final dilution of 10 mL. These values (Table 11) represent the color yield efficiencies achieved by the various procedures. The method described in this paper is at least 40% better in ita relative sensitivity than the other reported methods. This improved sensi- tivity, coupled with a clearer understanding of how the various parameters affect both sensitivity and reproduc-
420 J. Agric. Food Chem., Vol. 30, No. 3, 1982 Nkonge and Ballance
down procedure, we believe the nitrogen value can be accurately and reproducibly determined using only 20% of the available protein from a distal half-seed. Although the method could be scaled down further, this was not necessary for our work since the other two analyses could be done from the remaining 80% of the solubilized protein. Distal half-seed analysis by such procedures should allow
identification of seeds with improved protein character- istics (higher lysine or tryptophan) and the potential to reproduce from the embryo half of the seed the genotype responsible for these characteristics. LITERATURE CITED AOAC “Official Methods of Analysis”, 12th ed.; Horwitz, W., Ed.;
Bietz, J. A. Anal. Chem. 1974,46, 1617-1618. Eastin, E. F. Commun. Soil Sci. Plant Anal. 1976, 7, 477-481. Fawcett, J. K.; Scott, J. E. J. Clin. Pathol. 1959, 13, 156-159. Felker, P. Anal. Chem. 1977,49, 1080. Koops, J.; Klomp, H.; Elgersma, R. H. C. Neth. Milk Dairy J .
Miller, G. E.; Rice, J. D. Am. J. Clin. Pathol. 1963, 39,97-103. Mitcheson, R. C.; Stowell, K. C. J. Zmt. Brew. 1970, 76,335-339. Muroski, C. C.; Syty, A. Anal. Chem. 1980, 52, 143-145. Patton, C. J.; Crouch, S. R. Anal. Chem. 1977,49, 464-469. Pym, R. V. E.; Milham, P. J. Anal. Chem. 1976,48,1413-1415. Reardon, J.; Foreman, J. A.; Searcy, R. L. Clin. Chim. Acta 1966,
Searcy, R. L.; Simms, N. M.; Foremans, J. A.; Berquist, L. M. Clin.
Wall, L. L.; Gehrke, C. W. J. Assoc. Off. Anal. Chem. 1975,58,
Weatherburn, M. W. Anal. Chem. 1967, 39, 971-974. Yamaguchi, R.; Suzuki, H.; Hirashima, H. Chem. Pharm. Bull.
AOAC: Washington, DC, 1975.
1975,29, 169-180.
14, 403-405.
Chim. Acta 1965, 12, 170-175.
1221-1226.
1970,18, 1866-1871.
3 36[ 32
I- 12 2 0 I 6 F
/ /
/’. /
/” y=1.004x-0.020
EE 0 4 8 I2 16 20 24 2 8 32
a 0
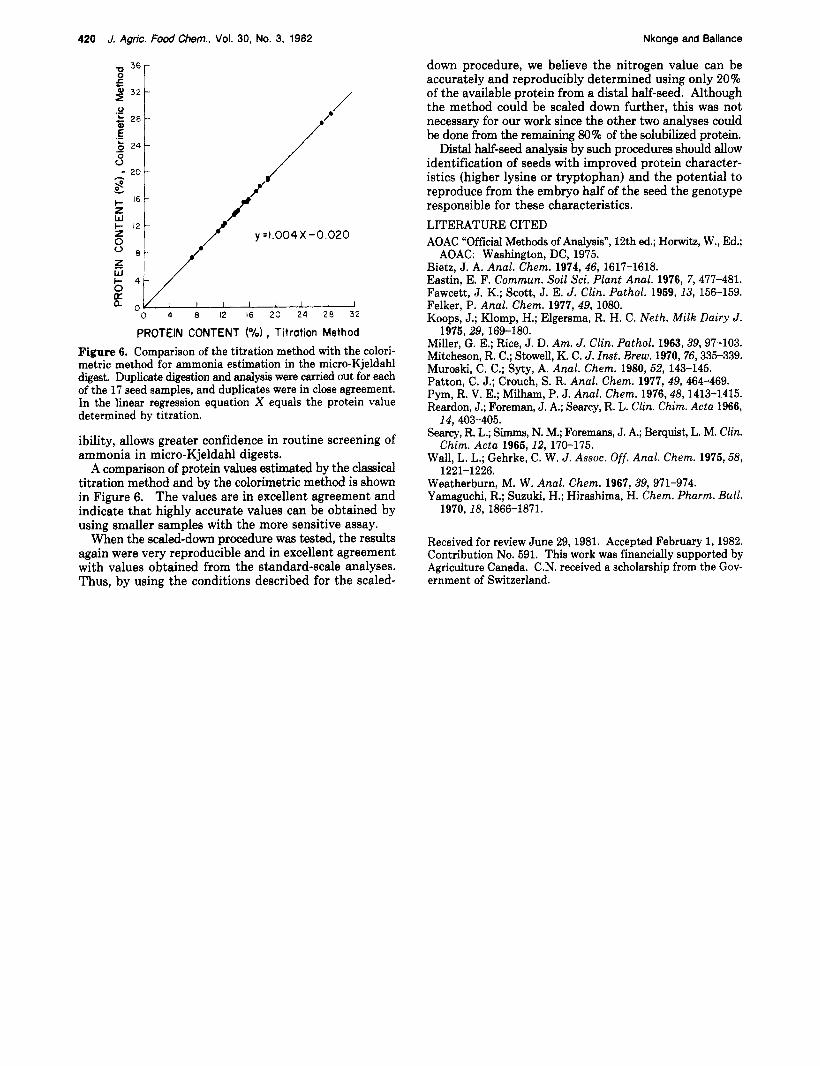
PROTEIN CONTENT ( O h ) , Titration Method Figure 6. Comparison of the titration method with the colori- metric method for ammonia estimation in the micro-Kjeldahl digest. Duplicate digestion and analysis were carried out for each of the 17 seed samples, and duplicates were in close agreement. In the linear regression equation X equals the protein value determined by titration.
ibility, allows greater confidence in routine screening of ammonia in micro-Kjeldahl digests.
A comparison of protein values estimated by the classical titration method and by the colorimetric method is shown in Figure 6. The values are in excellent agreement and indicate that highly accurate values can be obtained by using smaller samples with the more sensitive assay.
When the scaled-down procedure was tested, the results again were very reproducible and in excellent agreement with values obtained from the standard-scale analyses. Thus, by using the conditions described for the scaled-
Received for review June 29, 1981. Accepted February 1, 1982. Contribution No. 591. This work was financially supported by Agriculture Canada. C.N. received a scholarship from the Gov- ernment of Switzerland.