a secondary analysis of retention acr oss the pmtct ... · facility pmtct, labor and delivery, post...
TRANSCRIPT

28 January 2015
This publication was produced for the United States Agency for International Development. It was prepared by Godfrey Woelk, Aida
Yemane Berhan, Kwashie Kudiabor, Martha Mukaminega, John On’gech, Epiphanie Nyirabahizi, Caspian Chouraya, David Kimosop,
Dieudonne Ndatimana, Mafayo Phiri, and Heather Hoffman.
A SECONDArY ANAlYSIS Of rETENTION ACrOSS THE PMTCT CASCADE IN SElECTED COUNTrIESrWANDA, MAlAWI, KENYA, AND SWAZIlAND


A secondAry AnAlysis of retention Across the PMtct cAscAde in selected countries
rWAndA, MAlAWi, KenyA, And sWAZilAnd

This report was made possible through support provided by the President’s Emergency Plan for AIDS Relief and the U.S. Agency for International Development (USAID) via HIVCore, a Task Order funded by USAID under the Project SEARCH indefinite quantity contract (Contract No. AID-OAA-TO-11-00060).
HIVCore improves the efficiency, effectiveness, scale, and quality of HIV treatment, care, and support, and prevention of mother-to-child transmission (PMTCT) programs. The Task Order is led by the Population Council in partnership with the Futures Group, the Elizabeth Glaser Pediatric AIDS Foundation, and the University of Washington.
Published in January 2015. ©2015 Population Council Inc.
Cover photo: A woman’s prevention of mother-to-child transmission (of HIV) journey often begins at an antenatal care clinic, where she can obtain information and counseling to help ensure she has a safe pregnancy and delivery. During her prenatal check-up she will be offered a package of services including HIV testing and counseling, nutrition and family planning advice.
Cover photo Credit: James Pursey (Provided by the Elizabeth Glaser Pediatric AIDS Foundation)
Suggested citation: Woelk, Godfrey, Aida Yemane Berhan, Kwashie Kudiabor, Martha Mukaminega, John On’gech, Epiphanie Nyirabahizi, Caspian Chouraya, David Kimosop, Dieudonne Ndatimana, Mafayo Phiri, and Heather Hoffman. 2015. “A secondary analysis of retention across the PMTCT cascade in selected countries: Rwanda, Malawi, Kenya, and Swaziland,” HIVCore Report. Washington, DC: USAID | Project Search: HIVCore.
AcKnoWledgeMents
We would like to thank Mohammed Mahdi, Judith Kose, Michael Audo, Desmond Boi, Cornelia van Zyl, Jill Peterson, Patricia Mbetu, Allan Ahimbisbwe, Nicole Buono, Susan Duberstein, Penny Smith, and Allison Spensley for assisting in the development and implementation of this study. We would also like to thank the health facility nurses who participated in the study.

tAble of contents
AcronyMs/AbbreviAtions iv
executive suMMAry 1
introduction 4
reseArch questions 6Primary research question 6
Secondary research questions 6
definitions 7
Methodology 8Study population 8
Sample strategy 8
Sample size 9
Data collection and management 10
Data analysis 10
Ethical considerations 11
findings 12Rwanda 12
Malawi 19
Kenya 27
Swaziland 34
suMMAry And conclusion 39Limitations 39
Discussion 39
Conclusion 40
references 41
AcronyMs/AbbreviAtions
3TC LamivudineABC AbacavirANC Antenatal careARV Antiretroviral (prophylaxis)ART Antiretroviral therapyAZT ZidovudineCD4 Cluster of differentiation 4, refers to T-helper cells, a measure of immune statusCI Confidence intervalCTX Co-trimoxazoleCWC Child welfare clinicD4T Stavudine DBS Dried blood spotDNA Deoxynucleic acidEFV EfaviranzEGPAF Elizabeth Glaser Pediatric AIDS FoundationEID Early infant diagnosisGEE Generalized estimating equationsHAART Highly active antiretroviral therapy (same as ART)HC Health centerHCW Health care workerHEI HIV-exposed infantHTC HIV testing and counselingL&D Labor and deliveryMCH Maternal and child healthMOH Ministry of healthMTCT Maternal-to-child transmission (of HIV)NVP NevirapineOGAC US Office of the Global AIDS CoordinatorOR Odds ratioPCR Polymerase chain reaction PHU Public health unitPMTCT Prevention of mother-to-child transmission (of HIV)PNC Postnatal careSDN Single-dose nevirapineTAT Turn-around-timeTDF Tenofovir disoproxil fumarateUNAIDS Joint United Nations Programme on HIV/AIDS USAID U.S. Agency for International DevelopmentWHO World Health Organization
rwanda, Malawi, Kenya, and Swaziland ■ 1
executive suMMAry
There is global consensus that transmission of HIV from mother to child can be eliminated. A goal has been set of eliminating new HIV infections among children (defined as a transmission rate of less than 5 percent) by 2015 (UNAIDS 2011). Many of the countries most affected by mother-to-child transmission (MTCT) of HIV have adopted this goal. Yet reaching the goal depends on the optimal execution of each step in a complex cascade of activities. These activities involve testing and counseling for HIV, early attendance (from 14 weeks of pregnancy) for antenatal care (ANC) to optimize antiretroviral (ARV) prophylaxis for prevention of mother-to-child transmission (PMTCT), adherence to the drugs, CD4 count testing, and, in breastfeeding populations, retention in the PMTCT program until breastfeeding cessation, which may be for up to 24 months.
Thus, retaining pregnant and lactating women in PMTCT programs is a critical element in the cascade. However, there are barriers to retention. They include both facility factors such as staff shortages and the cost of services and community and individual factors such as the cost of transport for clinic attendance, lack of male involvement, fear of HIV-related stigma and of potential for physical and psychological harm, and the lack of knowledge of the importance of the program. Evidence of these barriers is reflected in the estimate that as of 2012 only 62 percent of pregnant women in low and middle income countries received the most effective regimens for PMTCT (UNAIDS 2013).
There are limited data on current retention rates, as well as drug adherence. The Elizabeth Glaser Pediatric AIDS Foundation (EGPAF) carried out a secondary data analysis of patient-level data extracted from registers in selected countries to assess the extent of and factors associated with retention among women and infants in the PMTCT program. The study was conducted under the U.S. Agency for International Development’s (USAID) HIVCore project led by the Population Council.
We constructed retrospective cohorts of HIV-positive pregnant women and their infants by reviewing facility PMTCT, labor and delivery, post natal care, and laboratory registers/records from the time of the mother’s initial registration. We then tracked their retention in the program over 10–12 months. Four countries were selected as examples of countries implementing different models of PMTCT: Rwanda (Option B), Malawi (Option B+), Kenya (Option A), and Swaziland (Option A).
EGPAF-supported sites were utilized to collect data. In all countries except for Swaziland, sites were purposively selected and stratified by type of facility (hospital, health center, etc.) and location, (urban/rural). The selection of sites was also guided by logistical concerns. For example, if a site had only a limited number of HIV-positive pregnant women in a year (e.g., 10) and involved extensive and expensive travel, it was not selected. Also, if a site was known to have poorly maintained records, it was also excluded. In Swaziland, facilities were randomly selected within type of facility (clinic, health center, and public health unit) and by location (urban or rural). Ultimately, 5 facilities were selected in Rwanda, 14 in Malawi, 12 in Kenya, and 16 in Swaziland.
In each of these facilities, trained data assistants—guided by standard operating procedures adapted for that particular country context—traced the selected women and extracted their data from the paper registers/patient charts. Data were entered on laptops directly into an Epi Info v3 (Swaziland) or MS Access database designed for this purpose. Mothers newly diagnosed with HIV and with known status

2 ■ A Secondary Analysis of retention Across the PMTCT Cascade in Selected Countries
during the period of October 2010 to March 2012 were identified from the ANC register using their ANC numbers. Data were then extracted from the following registers: ANC, PMTCT, labor and delivery (L&D)/maternity, child welfare clinic (CWC), post-natal care (PNC), early infant diagnosis (EID) registers, pharmacy and follow-up records. The ANC numbers were linked with the pre-antiretroviral treatment (ART) register to obtain their unique patient number for retrieval of patient files. This was then combined with ART, pharmacy, and lab registers, which were used to obtain details for the mother’s characteristics. The maternity, PNC, and HIV-exposed infant (HEI) registers were used to link the mother-baby pair. The data assistants obtained the infant characteristics from the CWC register, HEI register, HEI card, and polymerase chain reaction (PCR)/dried blood spot files. Infants with positive PCR results also had their details obtained from pre-ART, ART, and patient files.
A total of 3,644 records were analyzed in the study—457 records of women in Rwanda, 624 in Malawi, 434 in Kenya, and 2,129 in Swaziland. Retention was defined as clinic attendance at each of various time points for the mother and for the mother/infant pair separately. Retention rates for mother-infant pairs were calculated for each time periods; for mothers, retention was calculated based on how many of the six expected visits they attended. The time points used were: 1) 30 days after entry into the PMTCT program, 2) at delivery, 3) 6 weeks, 4) 2–4 months, 5) 5–7 months, and 6) 10–12 months post-delivery. We used generalized estimating equations (GEE) methods to estimate the proportion of mothers attending each visit with corresponding exact 95 percent CIs, assuming a Poisson distribution and an unstructured variance covariance matrix. For time points one and two, total number registered was the denominator. For time points three through six, the denominator was the number of mothers who were retained at time point two, as delivery date is the reference point for these visits.
We undertook bivariate and multivariate analyses of factors associated with retention using GEE. For the multivariate analysis we first computed pairwise correlations between independent variables. For any two pairwise correlations above 0.8, one variable was dropped based on the likely importance of each variable. For example, number of trained nurses was highly correlated with the number of staff in a health facility, so we subsequently dropped the number of trained nurses. Variable selection was based on fitting a sequence of models beginning with a simple model with only an intercept term, and then including one additional explanatory variable in each successive model. The importance of the additional explanatory variable was assessed by the difference in deviances between successive models.
Key findings Among the women we found the highest retention rates at 2–4 months post-delivery in Rwanda, 84 percent (95 percent confidence intervals: 79–89 percent); at 2–4 month post-delivery in Kenya for women on highly active antiretroviral therapy (HAART), 59 percent (48–73 percent); and at delivery in Malawi, 62 percent (58–66 percent). Retention rates at 11–13 months post-delivery were 67 percent (61–74 percent) in Rwanda, 3 percent (1–13 percent) for women on HAART in Kenya, and at 9–10 months post-delivery in Malawi, 18 percent (14–24 percent). We were not able to assess the retention rates for women in Swaziland as we could not adequately link their ANC and PNC records.
The highest retention rates among the infants were at 2–4 months in Rwanda (89 percent [(85–93 percent)]), at 2–4 months in Malawi (23 percent [(15–34 percent]), at 2–4 months in Kenya (16 percent [12–21 percent]); and at 6 weeks in Swaziland (80 percent [69–94 percent]). Infant retention rates at 11–13 months were 76 percent (71–81 percent) in Rwanda, 1 percent (0–3 percent) in Kenya, and 6 percent (3–14 percent) in Swaziland; while in Malawi it was 11 percent (14–24 percent) at 9–10 months.

rwanda, Malawi, Kenya, and Swaziland ■ 3
Except for rural location, the multivariate analyses of selected factors of, for example, ANC visits, number of HIV-positive pregnant women, types of health workers, and facility deliveries associated with retention were very contextual and differed for each country. For example, the numbers of ANC clients and doctor visits were inversely associated with retention among women in Rwanda (odds ratios [ORs]: -1.004, p<0.001, -1.0001, p<0.001, respectively), while in Malawi ANC visits were positively associated with retention (OR: 1.18, p<0.001), and in Kenya the number of facility doctors was positively associated with retention (OR: 1.008, p<0.001). We found no relationship between retention and selected health facility and infant characteristics in Swaziland. In all countries, key variables were missing data, in some cases substantial amounts, making that particular variable less useful in the analysis.
discussion And recoMMendAtionsThis series of analytical case studies highlighted a number of issues, including low retention rates among the women, especially at 11–13 months post-partum in Kenya and 9–10 months post-partum in Malawi, and the inability to estimate retention rates in Swaziland. Also, health facility characteristics may be important for retention.
In our study, retention refers to a woman being found/retained in a particular facility. However, it is difficult to track women across facilities or at different clinics in the PMTCT program. If a woman chooses or is referred to another facility, the data will not indicate that she is retained in the program. Therefore the lower than expected levels of retention, especially in urban areas, may be related to this inability to track women across facilities.
It is also difficult to trace women across the multiple registers and files. In order to assess whether a particular woman was retained, even in a particular facility, she may need to be traced from the ANC register to the PMTCT register to the labor and delivery register to the postnatal register, etc. There is a unique identifier (such as an ANC or PMTCT number) to facilitate this process, but since the system is manual and paper-based, transcription errors may occur. Health care workers have to document information in these various registers and files, sometimes duplicating the information in several places. There is also a large number of data fields required. These factors, combined with a limited number of very busy health workers, lead to missing data and misplaced or lost registers or patient files, and consequent data quality challenges.
In terms of the facility characteristics and retention, the rural locations were associated with retention, but this may indicate that rural populations are less mobile than urban populations. The association of rural location with retention may also indicate that smaller sites are associated with lower workloads and better patient relations and support. Adequate staffing and active follow up seem to be important factors for retention.
Improving the patient recording system by reducing the multiple required recording documents and reducing the number of data elements to the most important ones may improve data quality. One recommendation is to encourage one integrated patient record. In selected sites, an electronic patient record surveillance system may prove to be useful. It would be important to have the system be district based, as opposed to only facility based, so patients can be tracked across facilities. Finally, a system with smaller sites with lower workloads and service integration with adequate staffing may lead to improved retention.

4 ■ A Secondary Analysis of retention Across the PMTCT Cascade in Selected Countries
introduction
There is global consensus that transmission of HIV from mother to child can be eliminated. The Global Task Team, co-chaired by UNAIDS and the US Office of the Global AIDS Coordinator (OGAC), has developed a global framework with the goal of eliminating new HIV infections among children (defined as a transmission rate of less than 5 percent) by 2015 (UNAIDS 2011). Many of the countries most affected by mother-to-child transmission (MTCT) of HIV have adopted this goal. Yet reaching the goal depends on the optimal execution of each step in a complex cascade of activities. These activities involve testing and counseling for HIV, early attendance (from 14 weeks of pregnancy) for antenatal care (ANC) to optimize antiretroviral (ARV) prophylaxis for prevention of mother-to-child transmission (PMTCT), adherence to the drugs, CD4 count testing, and, in breastfeeding populations, retention in the PMTCT program until breastfeeding cessation, which may be for up to 24 months. Retaining pregnant and lactating women in the PMTCT program is a critical element in the cascade as it is a measure of program adherence, which is necessary in turn for drug adherence, education, and psychosocial support.
Howevere, there are barriers to the retention of women in the PMTCT program. In low and middle income countries, only 62 percent of pregnant women were receiving the most effective regimens for PMTCT in 2012 (UNAIDS 2013). There is, however, a paucity of knowledge even about the extent of retention, as well as limited information on drug adherence, another critical aspect in the PMTCT program. The Elizabeth Glaser Pediatric AIDS Foundation (EGPAF) carried out a secondary data analysis of patient-level data extracted from registers in selected countries to assess the extent of and factors associated with retention among women and infants in the PMTCT program. The study was conducted under the U.S. Agency for International Development’s (USAID) HIVCore project led by the Population Council.
We used a case study approach where we selected four countries; at the time of the study, Kenya and Swaziland were implementing the Option A guidelines, Rwanda was implementing the Option B guidelines, and Malawi was implementing the Option B+ guidelines. Option A guidelines involve CD4 testing of HIV-positive pregnant women: women with low CD4 counts (<350 cells/µl) are treated with triple highly active antiretroviral therapy (HAART) and women with CD4 counts above that level are given combination ARV prophylaxis (two ARV drugs); all women are given nevirapine (NVP) prophylaxis for their breastfeeding infants until a week after their last exposure to breastfeeding, which may be up to 24 months. Option B guidelines recommend providing HAART to all HIV-positive pregnant women irrespective of CD4 count, and NVP or zidovudine (AZT) for their breastfeeding infants for up to six weeks of age. Women with CD4 <350/µl, continue HAART for life, while those with CD4 >350/µl discontinue HAART after cessation of breastfeeding. Option B+ builds on the Option B guidelines by continuing all HIV-positive pregnant women on HAART for life regardless of CD4 count level.
Retention levels may be affected by the different guidelines. For example, Option B may have lower levels of retention due to apparently healthy women developing side effects from the toxic ARV drugs. In Option B+ programs, it may be that women, on learning that they would be required to be on HAART for life, may decide to leave and not come back, or if they start, they may become lost to follow-up sooner.

rwanda, Malawi, Kenya, and Swaziland ■ 5
Rwanda was selected because it had implemented the Option B guidelines for over two years1, and is regarded as a model country for HIV programming. Though Malawi had only recently fully implemented Option B+ guidelines (January 20122), it was the only country that at the time was currently rolling out this program. With the emphasis on and support for Option B+ (WHO 2012), and with more countries considering this option, or piloting it, it is of critical importance to understand how these new guidelines may impact retention. Kenya was chosen as an Option A country as it is a large country with variable rates of HIV prevalence and because it has a mature program, having implemented the guidelines since July 2010. Swaziland was chosen as another Option A country as it is a small country, also with a mature program—the guidelines were adopted in July 2010, with fast implementation. It is also a country that is reported to have reached 90 percent coverage of prevention mother-to-child transmission with antiretroviral therapy (ART) regimens, and is projected to meet the 2015 targets of virtual elimination of new child HIV infections if the 30 percent decline from 2009 to 2011 is sustained (UNAIDS 2012). A central criterion for the selection of countries (except for Malawi3) was that their programs were mature enough to enable a 12 month post-delivery retrospective analysis so that retention could be assessed over much of the PMTCT cascade, including breastfeeding.
1While Rwanda has since April 2012 elected to now implement Option B+ guidelines, this retrospective chart review will focus on Option B only.2Malawi introduced Option B+ guidelines in July 2011, but only fully implemented them by January 2012.3As Malawi had only relatively recently implemented Option B+, we collected data from November 2011, therefore we have a 12 month post-delivery analysis. We thus limited the review to 9 months post-delivery.

6 ■ A Secondary Analysis of retention Across the PMTCT Cascade in Selected Countries
reseArch questions
PriMAry reseArch questionWhat are the levels of and factors related to retention among women and infants in PMTCT care in purposively selected countries implementing Option A guidelines and those implementing Option B/B+ guidelines? In this analysis, “retention” was measured by rates of program (clinic) attendance as documented in the health facility registers.
Specifically:
1. What are the levels of retention 30 days after entry into the PMTCT program, at delivery, 6 weeks, 2 months (60 days), 3 months (90 days), 6, and 12 months post-delivery among women and infants on Option A and on Option B/B+?
2. How do the levels of retention vary by demographic and clinical characteristics among women and infants on Option A and on Option B/B+?
3. How do the levels of retention vary by facility characteristics such as type of facility, higher versus lower volume PMTCT facility, rural/urban facility, and presence and type of follow-up (active/passive) among women and infants on Option A and on Option B/B+?
4. What are the facility characteristics most associated with retention in Option A and in Option B/B+ sites?
secondAry reseArch questions1. What are the levels of and factors associated with drug adherence for the women on Option A
guidelines and on Option B/B+ guidelines?
2. What proportion of eligible women is initiated onto HAART and what factors are associated with initiation?
The last (#2) secondary research question does not apply to Malawi, an Option B+ country, or to Rwanda, an Option B country, where all HIV-positive positive women are enrolled on HAART.

rwanda, Malawi, Kenya, and Swaziland ■ 7
definitions
In this study, retention was defined as clinic attendance for the mother and for the mother/infant pair separately. Attrition or loss to follow-up was defined as three consecutive missed visits. Type of facility refers to whether the facility is a hospital, health center (HC), clinic, dispensary (Kenya only), or public health unit (Swaziland only). There were no mobile facilities. Health facility characteristics refer to type of facility (hospital, HC, public health unit [PHU]), place of facility (urban/peri-urban/rural), facility size (number of rooms for maternal and child health (MCH)/PMTCT), staffing levels, vacancy rates, payment for services, drug stock-outs, availability of CD4 testing on site/elsewhere, CD4 tests turn-around time, and follow-up mechanisms. Adherence was defined as the proportion of ARV or ART collected from the pharmacy/health clinic as a proportion of the number of required doses.

8 ■ A Secondary Analysis of retention Across the PMTCT Cascade in Selected Countries
Methodology
We constructed a retrospective cohort of HIV-positive pregnant women and babies using the antenatal care (ANC), PMTCT, labor and delivery (L&D) child welfare clinic (CWC), postnatal care (PNC), and early infant diagnosis (EID) registers, as well as pharmacy and follow-up records. We analyzed data for women enrolled in PMTCT and for their HIV-exposed infants4 over the time period October 2010 to March 2012 from ANC, labor and delivery, PNC, and child welfare registers/patient charts as appropriate. We also conducted key informant interviews with the health facility managers of the selected facilities to obtain health facility data.
study PoPulAtionThe study population was HIV-positive women who accessed PMTCT services at the selected study sites and their HIV-exposed and HIV-positive infants who received PMTCT services at these study sites.
sAMPle strAtegyEGPAF-supported sites were utilized to collect data. In all countries except for Swaziland, sites were purposively stratified by type of facility (hospital, HC, etc.) and location, (urban/rural). The selection of sites was also guided by logistical concerns. Sites were also stratified based on cost of travel, distance to the site, and number of positive cases. For example, if a site had only 10 HIV-positive pregnant women in a year and involved extensive and expensive travel5, it would not be selected. Also, if a site was known to have poorly maintained records, it was also excluded. In some of these countries, test-kit stock-outs are highly common and it was important to include sites that had a more regular supply of test kits to ensure the sample size was reached.
In Rwanda, five sites were selected—two urban and three rural hospitals and HCs—based on a minimum number of 40 HIV-positive pregnant women per site in a year. Consideration of stratification by location (rural/urban) and type of facility (hospital/health center) with a minimum number of HIV-positive pregnant women as well as the criteria stated above led to a sample size of only five facilities. Data were extracted on all the HIV-positive pregnant women who registered at these facilities during the time that Option B was implemented (November 2010–February 2012).
In Malawi, in addition to the criteria stated above, we stratified by government supported sites and Christian Health Association of Malawi (church mission) facilities. Participants were randomly sampled. Initially we counted the total number of possible respondents in the ANC register and divided by the planned sample size. For example, if the sample size was 20 and we found 40 HIV-positive clients
4In Rwanda, Malawi, and Kenya we analyzed data for HIV-positive women enrolled in ANC and their HIV exposed infants. However, in Swaziland, we enrolled HIV-exposed infants separately, as there was no mother/baby pair linkage. 5Distances of at least 20 miles between facilities, with poor or difficulty road conditions, and/or taking two hours to reach one facility.

rwanda, Malawi, Kenya, and Swaziland ■ 9
registered for the period under study, we divided 40 by 20, which is 2. We then selected every second eligible client in that particular facility. If there were few clients, they were enrolled serially to reach the sample size.
In Kenya, retrospective data from all 550 EGPAF-supported sites were initially analyzed to establish the possible respondents per site. We then ranked and selected the sites based on the volume in each facility; 12 sites with a minimum of 14 newly identified HIV-positive women attending ANC semiannually were identified. We then stratified by level of facilities: district hospitals, sub-district hospitals, and HCs; one private facility was also included. At the study sites, the research team counted the respondents from the ANC register and compared that number with the planned sample size. In low volume sites, respondents were conveniently selected; beginning with the first registered respondent, while in high volume sites, respondents were randomly selected until the sample size for each site was reached. Data were extracted on HIV-positive pregnant women registered for ANC over the period October 2010 to March 2011.
In Swaziland, five hospitals without child welfare clinics were removed from the 113 EGPAF-supported sites, giving a sampling frame of 108 sites: 97 clinics, 5 HCs, and 6 PHUs. Stratified sampling was used to select facilities for the study, with five strata identified: rural clinics, urban clinics, rural health centers, urban health centers, and PHUs (all PHUs in Swaziland are located in urban areas). Sites were then randomly selected from the strata as follows: six rural clinics, six urban clinics, one rural health center, one urban health center, and two PHUs. At these sites, data were captured on all HIV-positive pregnant women who had registered for ANC over the period January 2011 to July 2012.
sAMPle siZe The primary study objective was to estimate rates of attendance at each study visit—30 days after entry into the PMTCT program, at delivery, 6 weeks, 2 months (60 days), 3 months (90 days), 6, and 12 months post-delivery—among women and infants on Option A, B, B+. The unit of the proposed sample size was a newly diagnosed or known HIV-positive pregnant woman. Sample sizes were based on the estimated number of records available and which would be feasible to capture in each country.
In Rwanda the sample size was 474. We sampled from the five health facilities proportional to the expected number of women who are HIV-positive at ANC. Based on knowledge of retention levels in Rwanda and the existence of patient files we expected 50 percent of the women to attend the 12 month visit. Thus the margin of error for 95 percent confidence intervals (CIs) based on the sample size and expected proportion of women attending the 12 month visit was ±0.044. We interviewed approximately 5–10 health facility managers, speaking to at least one at each facility.
In Malawi our sample size was 500. Based on program implementation reports for Malawi, we expected 50 percent of the women to attend the 9 month visit. Thus the margin of error for 95 percent CIs based on the sample size and expected proportion of women attending the 9 month visit was ±0.044. We interviewed approximately 10–15 health facility managers, speaking to at least one at each facility.
In Kenya our sample size was 428. Based on estimates of retention from the routine data, we expected 20 percent of the women to attend the 12 month visit. Thus the margin of error for 95 percent CIs based on the sample size and expected proportion of women attending the 12 month visit was ±0.038. We interviewed approximately 10–12 health facility managers, speaking to at least one at each facility.

10 ■ A Secondary Analysis of retention Across the PMTCT Cascade in Selected Countries
In Swaziland, our sample size was 500. We expected 20 percent of the women to attend the 9 month visit, based on routine data reports. Thus the margin of error for 95 percent CIs based on the sample size and expected proportion of women attending the 9 month visit is ±0.044. We interviewed 16–25 health facility managers, speaking to at least one at each facility.
In all the countries except for Swaziland, the number of health facilities was determined by feasibility/availability of the study population.
dAtA collection And MAnAgeMentTrained data assistants extracted the data from the paper registers/patient charts and entered them directly into an Epi Info v3 (Swaziland) or MS Access database designed for this purpose on laptops. Standard operating procedures were developed to guide the data collection process.
Data were extracted from the following registers: ANC, PMTCT, L&D, CWC, PNC, and EID, as well as pharmacy and follow-up records. Mothers newly diagnosed with HIV and with known status over the relevant time periods stated above were identified from the ANC register using their ANC numbers. We then linked them up with the pre-ART register to obtain their unique patient number for retrieval of patient files and used ART, pharmacy, and lab registers to obtain details for the mother characteristics. The maternity, PNC, and HIV-exposed infant (HEI) registers were used to link the mother-baby pair. The data assistants obtained the infant characteristics from the CWC register, HEI register, HEI card, and polymerase chain reaction (PCR)/dried blood spot (DBS) files. Infants with positive PCR results also had their details obtained from pre-ART, ART, and patient files.
dAtA AnAlysisEndpoint derivation: The period from the registration date to the end of the observation time was divided into 6 non-overlapping time segments centered at 30 days after registration, delivery date, 6 weeks, 3 months, 6 months, and 12 months after delivery. For each time interval, a mother/child received “1” if there was an indication that she made at least one visit to a health center, clinic/hospital, or pharmacy to pick up drugs and “0” otherwise. For each mother, retention was a count outcome indicating how many visits were accomplished out of a maximum of six visits that they were expected to attend, so the endpoint was a total of “1”s received out of “6” expected. Thus to estimate retention 30 days after registration we examined the first ART receipt date from the registration date. If this date was at 30 days or within 2 weeks after the 30 days, we concluded that the mother was retained. For retention at delivery we used all possible records that suggested that delivery had occurred; place of delivery, delivery date (where available), child’s date of birth (if available). If any of these was available, we concluded that the mother was retained at delivery. For retention after delivery at 2–4 months, 5–7 months, and 11–13 months (for Rwanda and Kenya) and 9–10 months for Malawi we looked for any indication of ART receipt during those periods. We analyzed both mothers and infants separately.
Analysis: We used generalized estimating equations (GEE) methods to estimate the proportion of mothers attending each visit with corresponding exact 95 percent CIs assuming a Poisson distribution and an unstructured variance covariance matrix. For time points one and two, total number registered was the denominator. For time points three through six, the denominator was the number of mothers who were retained at time point two, as delivery date is the reference point for these visits.

rwanda, Malawi, Kenya, and Swaziland ■ 11
Association: We undertook bivariate and multivariate analyses of factors associated with retention using GEE. For the multivariate analysis we first computed pairwise correlations between independent variables. This was to assess for collinearity. For any two pairwise correlations above 0.8, one variable was dropped based on the likely importance of each variable. Variable selection was based on fitting a sequence of models beginning with a simple model with only an intercept term, and then including one additional explanatory variable in each successive model. The importance of the additional explanatory variable was assessed by the difference in deviances between successive models. All statistical analyses were generated using SAS/STAT software, Version 9.1 of the SAS System for Windows (SAS Institute Inc., Cary, NC, USA).
ethicAl considerAtionsAll study-related personnel were trained and certified in research ethics, and the data assistants signed confidentiality agreements before handling data or interacting with the health facility managers. The study was approved by the Population Council Institutional Review Board (IRB), and by the research ethic committees/institutional review boards of the four countries. Data were recorded on password protected laptops and entered into a password protected database. For the analyses, the data were stripped of individual identifiers.
12 ■ A Secondary Analysis of retention Across the PMTCT Cascade in Selected Countries
findings
rWAndA
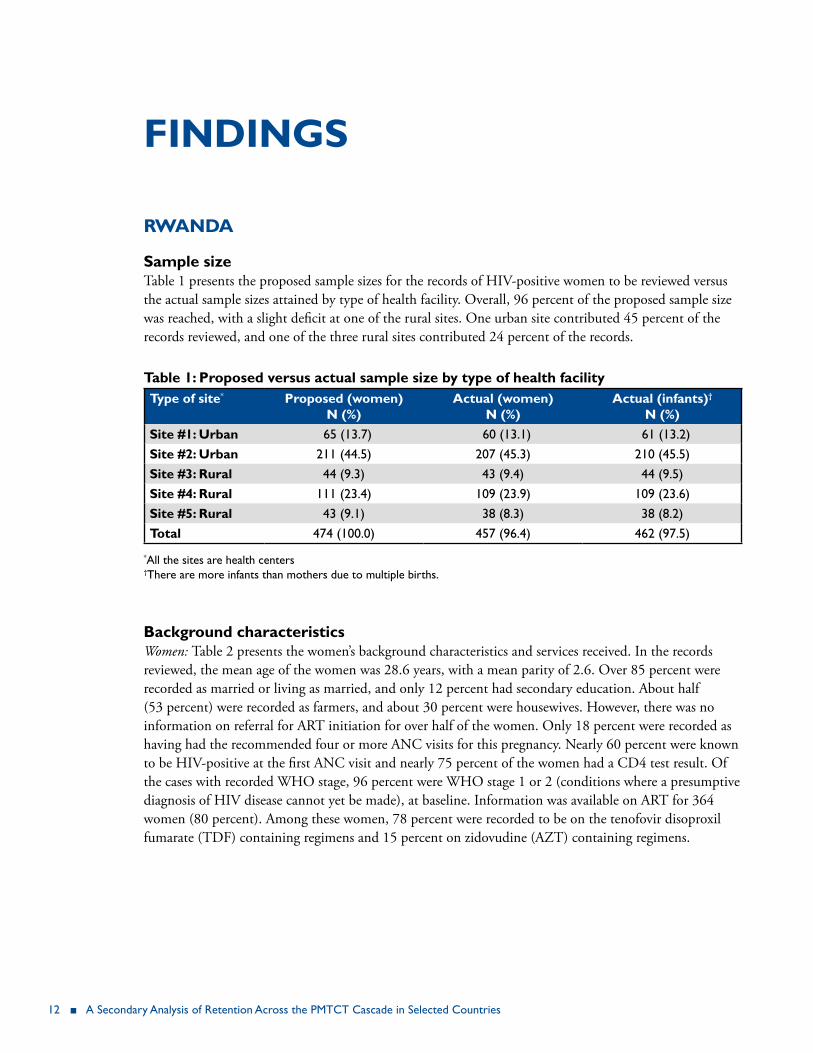
sample sizeTable 1 presents the proposed sample sizes for the records of HIV-positive women to be reviewed versus the actual sample sizes attained by type of health facility. Overall, 96 percent of the proposed sample size was reached, with a slight deficit at one of the rural sites. One urban site contributed 45 percent of the records reviewed, and one of the three rural sites contributed 24 percent of the records.
table 1: Proposed versus actual sample size by type of health facilitytype of site* Proposed (women)
n (%)Actual (women)
n (%)Actual (infants)†
n (%)site #1: urban 65 (13.7) 60 (13.1) 61 (13.2)site #2: urban 211 (44.5) 207 (45.3) 210 (45.5)site #3: rural 44 (9.3) 43 (9.4) 44 (9.5)site #4: rural 111 (23.4) 109 (23.9) 109 (23.6)site #5: rural 43 (9.1) 38 (8.3) 38 (8.2)total 474 (100.0) 457 (96.4) 462 (97.5)
*All the sites are health centers †There are more infants than mothers due to multiple births.
background characteristicsWomen: Table 2 presents the women’s background characteristics and services received. In the records reviewed, the mean age of the women was 28.6 years, with a mean parity of 2.6. Over 85 percent were recorded as married or living as married, and only 12 percent had secondary education. About half (53 percent) were recorded as farmers, and about 30 percent were housewives. However, there was no information on referral for ART initiation for over half of the women. Only 18 percent were recorded as having had the recommended four or more ANC visits for this pregnancy. Nearly 60 percent were known to be HIV-positive at the first ANC visit and nearly 75 percent of the women had a CD4 test result. Of the cases with recorded WHO stage, 96 percent were WHO stage 1 or 2 (conditions where a presumptive diagnosis of HIV disease cannot yet be made), at baseline. Information was available on ART for 364 women (80 percent). Among these women, 78 percent were recorded to be on the tenofovir disoproxil fumarate (TDF) containing regimens and 15 percent on zidovudine (AZT) containing regimens.

rwanda, Malawi, Kenya, and Swaziland ■ 13
table 2 baseline characteristics of the women (n=457)variable n %
Age [n, mean (sd), median (q1, q3)] 455, 28.6 (6.3), 28.5 (23.5, 32.9)
Parity [n, mean (sd), median (q1, q3)] 443, 2.6 (1.8), 2.0 (1.0, 4.0)
Marital status (n=455)Married 203 44.6living as married 192 42.2Single 36 7.9Divorced/separated 22 4.8Widowed 2 0.4
education—highest level completed (n=421)None 60 14.3Primary 310 73.6Secondary 51 12.1
employment status (n=420)farmer 222 52.8Housewife 123 29.3Trader 53 12.6Other 22 5.21
referral to Art initiating site (n=206)Yes 100 48.5No 106 51.5
number of Anc visits for this pregnancy (n=369)1 75 20.32 101 27.43 125 33.94 or more 68 18.4
Known HIV positive at first ANC (n=457)Yes 272 59.5No 185 40.5
cd4 tested this pregnancy (n=456)Yes 339 74.3No 117 25.6
Who staging at baseline (n=324)Stage 1 291 89.8Stage 2 20 6.2Stage 3 or 4 13 4.0
type of regimen (n=364)TDf/3TC/EfV 196 53.8TDf/3TC/NVP 84 23.0AZT/3TC/EfV 55 15.1D4T/3TC/NVP 17 4.7ABC/3TC/EfV 5 1.3ABC/3TC/NVP 3 0.8TDf/3TC/Kaletra 2 0.5TDf/3TC/ABC 1 0.2
toxicities/side effects (n=247) 247Yes 4 1.6No 243 98.4
Notes: TDf=tenofovir disoproxil fumarate, 3TC= lamivudine, EfV=efavirenz, NVP=nevirapine, AZT=zidovudine, D4T=stavudine, ABC=abacavir

14 ■ A Secondary Analysis of retention Across the PMTCT Cascade in Selected Countries
Infants: Table 3 presents the background characteristics of the infants. Many of the reconstructed infant records were missing critical information, including place of delivery (37 percent), as well as mode of delivery, administration of infant PCR, dispensing of co-trimoxazole (CTX), and infant feeding practices (over 30 percent for each of these variables).
table 3 baseline characteristics of the infants (n=457)variable n %Place of delivery (n=290)
Health center 288 99.3Home 2 0.7
gender (n=289)Male 155 53.6female 134 46.4
Mode of delivery (n=284)Normal vaginal delivery 244 85.9C-section 34 12.0Other 6 2.1
infant dnA Pcr (n=292)Yes 286 97.9No 6 2.1
ctx (n=294)Yes 283 96.3No 3 1.0Not applicable 8 2.7
Mode of feeding (n=285)Exclusive breastfeeding 279 97.8replacement feeding (e.g., bottle feeding) 3 1.1Not applicable 3 1.1
hiv antibody testing at 18 months (n=254)Yes 111 43.7No 6 2.4Not applicable 137 53.9
Health facilities: All five sampled health facilities were health centers, with one owned by a religious organization and the remainder government-run public facilities. Table 4 presents selected characteristics for these health facilities for the year 2011. These characteristics were the number of ANC clients, HIV-positive pregnant women, facility deliveries, health staff, HIV trained nurses, doctor visits in the preceding quarter, health staff vacancy rates (defined as the number of filled posts divided by the number of officially available posts), CD4 testing turn-around-time (TAT), and whether client follow up for non-attendance was begun within a week or not. The number of first-visit ANC clients ranged from 880 to 2,254, and the number of HIV-positive pregnant women ranged from 31 to 156. Deliveries ranged from 393 to 1,086. Only one facility had a vacancy, and all facilities indicated that they had active follow-up mechanisms, with the follow up starting within a week in three facilities and after more than a week in two facilities. One facility experienced drug stock outs in the past three months, and four facilities provide

rwanda, Malawi, Kenya, and Swaziland ■ 15
both adult and pediatric ART services. All facilities provided ART refill and follow-up for PMTCT services.
table 4 description of the health facilities (n=5)variable* site 1 site 2 site 3 site 4 site 5 Mean (sd)
urban urban urban rural rural
no. of Anc clients 880 1,124 2,254 1,885 1,350 1,498.6 (562.4)no. of hiv+ pregnant women 31 34 156 81 50 70.4 (51.8)no. of deliveries 393 403 1,086 713 640 647.0 (283.4)no. of health staff 18 24 38 35 31 29.2 (8.2)no. of hiv trained nurses 11 10 10 8 12 10.2 (1.5)no. of doctor visits† last quarter 0 8 - 12 9 7.3 (5.1)cd4 test tAt‡ 7 2 14 3 7 7 follow up starts <week Yes Yes No No Yes NA
*Data for 2011. †Doctors normally visit health facilities for consultation, supervision, and support purposes. ‡Turn-around-time (days): This is the amount of time taken from collection of samples at the health facility to the availability of the test results at the same health facility.
Program retentionHealth facility retention, women: Table 5 presents the proportion of women that attended at the specified time periods of 30 days after entry into the PMTCT program; at delivery; 6 weeks, 2–4 months, 5–7 months, and 11–13 months post-delivery. At 12 months post-delivery 67 percent of the women were retained at the same health facility.
Table 5 Women’s retention by specified time intervals*
n expected n observed time period Prop. 95% cis348 175 30 days 0.51 0.46, 0.56348 204 Delivery 0.59 0.54, 0.64202 151 6 wks 0.75 0.69, 0.81202 169 2–4 m 0.84 0.79, 0.89202 158 5–7 m 0.78 0.73, 0.84202 136 11–13 m 0.67 0.61, 0.74
*The retention analysis for the women is from 4 instead of the 5 selected health facilities as it was discovered that one of the facilities (Site #4) was not an ArT site during the records review period (2011). This facility referred HIV-positive women to a nearby hospital for follow up. However, the facility retained the infants for follow-up.
Health facility retention, infants: This analysis includes data from all five facilities, as infants from the facility that referred HIV-positive women to a nearby hospital retained the infants for follow-up. Table 6 shows the infant retention overall. At 6 weeks, only 40 percent of the infants appear to have returned to the program. However, this increased to 89 percent at 2–4 months, and at 12 months, 76 percent of the infants were seen.

16 ■ A Secondary Analysis of retention Across the PMTCT Cascade in Selected Countries
Table 6 Infants’ retention at specified time intervals n expected n observed time period Prop. 95% cis348 140 6 wks 0.40 0.34, 0.46348 310 2–4 m 0.89 0.85, 0.93348 303 5–7 m 0.87 0.83, 0.91348 265 11–13 m 0.76 0.71, 0.81
demographic and clinical characteristics associated with retentionWe investigated whether there was a relationship between retention and demographic and clinical characteristics of marital status, parity, number of ANC visits, employment, known HIV positivity, and referral for ART initiation. Tables 7–11 present these findings.
Compared to married women, women who reported that they were living as married had higher retention levels (p<0.05) at all specified time periods except at delivery, with 64 percent (56–74) retained at 12 months compared to 39 percent (32–48) among the married women (Table 7).
table 7 Marital status by levels of retention d/s 95% cis lM 95% cis M 95% cis s 95% cis p-value
30 days 0.27 0.14, 0.54 0.52 0.47, 0.60 0.29 0.23, 0.36 0.42 0.28, 0.61 <0.001delivery 0.73 0.56, 0.94 0.57 0.51, 0.65 0.72 0.66, 0.79 0.44 0.31, 0.64 0.0016 wks 0.40 0.22, 0.74 0.70 0.62, 0.79 0.44 0.36, 0.53 0.53 0.33, 0.86 <0.0012–4 m 0.33 0.16, 0.68 0.82 0.75, 0.90 0.48 0.40, 0.57 0.60 0.40, 0.91 <0.0015–7 m 0.33 0.16, 0.68 0.78 0.70, 0.86 0.46 0.38, 0.55 0.05 0.27, 0.80 <0.00111–13 m 0.47 0.27, 0.80 0.64 0.56, 0.74 0.39 0.32, 0.48 0.40 0.22, 0.74 <0.001
D/S: Divorced/separated; lM: living as married; M: Married; S: Single
Analysis of retention by employment status showed similar retention levels among “housewife” and “other” employment status, but significant differences between these groups and “farmer” (Table 8).
table 8 retention by employment status farmer 95% cis other* 95% cis housewife 95% cis
30 days 0.29 0.23, 0.36 0.51 0.41, 0.63 0.49 0.41, 0.59delivery 0.73 0.68, 0.79 0.52 0.42, 0.65 0.47 0.39, 0.576 wks 0.43 0.36, 0.51 0.71 0.58, 0.87 0.69 0.58, 0.822–4 m 0.45 0.38, 0.53 0.76 0.64, 0.91 0.86 0.78, 0.965–7 m 0.44 0.37, 0.52 0.74 0.61, 0.89 0.76 0.66, 0.8811–13 m 0.35 0.29, 0.43 0.63 0.50, 0.81 0.73 0.62, 0.85
*Includes trader and other.

rwanda, Malawi, Kenya, and Swaziland ■ 17
Table 9 presents the findings of retention by whether the women were referred to an ART initiating site. With the exception of delivery, women who were not referred had much higher levels of retention compared to women who were referred.
table 9 referral to Art initiating site by retention levelsyes 95% cis no 95% cis p-value
30 days 0.05 0.02, 0.12 0.51 0.43, 0.62 <0.001delivery 0.80 0.72, 0.88 0.71 0.626, 0.80 0.1246 wks 0.05 0.02, 0.12 0.81 0.731, 0.91 <0.0012–4 m 0.07 0.03, 0.16 0.90 0.827, 0.97 <0.0015–7 m 0.09 0.04, 0.18 0.84 0.762, 0.93 <0.00111–13 m 0.07 0.03, 0.16 0.65 0.555, 0.77 <0.001
Table 10 shows the levels of retention in women by ANC visits 1 to 4+. There appears to be no association between ANC visit and levels of retention.
table 10 levels of retention in women by Anc visits 1 visit 95% cis 2 visits 95% cis 3 visits 95% cis 4 visits 95% cis
30 days 0.27 0.19, 0.39 0.50 0.41, 0.61 0.50 0.42, 0.60 0.43 0.32, 0.56delivery 0.56 0.45, 0.68 0.77 0.69, 0.86 0.81 0.74, 0.88 0.83 0.74, 0.936 wks 0.36 0.25, 0.54 0.67 0.57, 0.78 0.48 0.40, 0.59 0.55 0.44, 0.702–4 m 0.56 0.43, 0.73 0.72 0.62, 0.83 0.57 0.48, 0.67 0.53 0.42, 0.685–7 m 0.51 0.38, 0.68 0.67 0.57, 0.78 0.57 0.48, 0.67 0.48 0.36, 0.6311–13 m 0.39 0.27, 0.57 0.63 0.53, 0.75 0.42 0.34, 0.53 0.42 0.31, 0.58
Table 11 presents levels of retention by women of known HIV status at first ANC. There appears to be no association between retention and known HIV status.
table 11 levels of retention by women of known hiv statusKnown 95% cis not 95% cis
30 days 0.45 0.40, 0.52 0.32 0.26, 0.40delivery 0.65 0.60, 0.71 0.60 0.54, 0.686 wks 0.57 0.50, 0.65 0.52 0.43, 0.622–4 m 0.62 0.56, 0.70 0.60 0.51, 0.695–7 m 0.60 0.53, 0.67 0.55 0.47, 0.6511–13 m 0.49 0.42, 0.57 0.49 0.41, 0.59

18 ■ A Secondary Analysis of retention Across the PMTCT Cascade in Selected Countries
facility characteristics associated with retentionWe used GEE modeling also to assess the facility and other characteristics associated with retention. The GEE assumes a Poisson distribution with the log link and unstructured variance-covariance for the dependent variable. As stated earlier, to assess factors associated with retention we first computed pairwise correlations between independent variables. For any two pairwise correlations above 0.8, one variable was dropped based on the clinical importance of each variable. Variable selection was based on fitting a sequence of models beginning with a simple model with only an intercept term, and then including one additional explanatory variable in each successive model. We considered the following variables: number of health staff, facility location, number of deliveries in 2011, number of ANC clients in 2011, total number of HIV-positive pregnant women in 2011, number of trained nurses, number of staff, and number of doctor visits. Demographic and clinical variables of age, marital status, parity, number of ANC visits, employment, known HIV positivity, and referral for ART initiation were included in the model also.
Table 12 presents the findings of the GEE modeling, with the parameter estimates, 95 percent CIs and p-values, standard errors, and odds ratio (OR). Rural location was positively associated with retention with an odds ratio of 29.37, as was the number of deliveries in 2011, while the number of ANC clients and doctor visits in 2011 were inversely related to retention. None of the demographic and clinical factors was retained in the model.
table 12 factors associated with retentionvariable Parameter
estimatestandard
erroror 95% cis on
parameter estimates
p-value
intercept 3.522 0.435 2.669, 4.375 <0.001facility location (rural) 3.381 0.664 29.37 2.079, 4.682 <0.001Anc clients 2011 -0.004 0.0007 -1.004 -0.005, -0.002 <0.001deliveries 2011 0.0015 0.0005 1.001 1.0004, 1.0025 0.007doctor visits -0.0001 0.00001 -1.0001 -1.0001,-1.0001 <0.001
discussionOur study demonstrated that about 67 percent of HIV-positive pregnant women were retained at 12 months post-partum, which is similar to reports by the Rwanda Ministry of Health (MOH) showing retention rates of 70 percent (Republic of Rwanda, MOH 2012). The 12-month infant retention rate was 76 percent; it is possible that this could approximate and be a better proxy for the retention rate of the women, given that these infants are most likely to be brought by their mothers. In a multi-country study, McNairy et al. (2013) found that the retention among Rwandan infants on ART was 86 percent at 12 months. The findings that retention improved in the time periods soon after delivery suggests that a number of women do not deliver in the facilities they initially attend, returning after delivery for the follow-up services. Women may prefer to deliver elsewhere due to perceived better services or to be near their mothers, who may help and support them at this time. However, the fact that many women deliver elsewhere makes tracking and tracing of the women more challenging, and consideration should be given

rwanda, Malawi, Kenya, and Swaziland ■ 19
to the development of electronic databases which would allow for the tracing of women at different facilities, at least within the same region or province.
The higher retention of mothers and infants in rural facilities is suggestive of greater mobility in urban as compared to rural settings. The association of improved retention with lower facility workload as measured by the number of ANC clients and the ratio of clinical staff to ANC clients suggests that with a lower workload, staff may have more time to work with individual clients. Our finding is supported by a South African study which found that higher clinic patient loads was associated with higher loss to follow up of ART patients (Fatti et al. 2011).
This study found that women who reported they were living as married had better retention. This may be a reflection of socioeconomic differences between women or a reflection of social support and male involvement. Though we were unable to adequately measure this factor, it is likely that the married women may have been of higher socioeconomic status and subsequently may have either attended other facilities or been lost to follow up. In general non-married women (single, divorced/separated), had poorer retention levels than married women (WHO 2010). Lower socioeconomic status has been found to be unfavorably associated with a number of poorer health outcomes including retention (Panditrao 2011). The finding that women who stated their employment status as “farmer” had lower levels of retention may be a reflection of a lower socioeconomic status. Providing comprehensive services in a facility has been found to improve various outcomes including retention. This is supported by the finding that women were better retained when they were not referred to another facility. None of these factors, however, was retained in the final retention model.
Concerning the multivariate analysis of factors associated with retention, the finding of retention being associated with rural facility location suggests greater mobility in urban as compared to rural settings. The inverse association of ANC clients, but positive association with number of deliveries, suggests an association with facilities that may be larger and more comprehensive, where women come to deliver from other areas. This is supported by the finding that retention is associated with fewer doctor visits, perhaps because these sites already had adequate numbers of doctors. Sites may have more doctor visits where there is insufficient staff and doctors, and these sites may tend to be smaller. The Rwandan program emphasizes the provision of comprehensive care services (UNAIDS 2011).
MAlAWi
sample sizeTable 13 presents the actual compared with the proposed sample size by type of facility. The sampled records exceeded the proposed sample size by 21 percent with the largest addition of 90 extra records among rural/community hospitals, and the addition of three more hospitals. Records sampled from health centers still constituted the largest proportion (45 percent), though reduced from the proposed 51 percent. A total of 272 records (43 percent) were sampled from the three urban facilities in the study.

20 ■ A Secondary Analysis of retention Across the PMTCT Cascade in Selected Countries
table 13 Proposed versus actual sample size by type of health facilityfacility type Proposed sample size Actual sample size
n* n† % n n %
health center 5 266 51.3 6 324 51.9rural/community hospital 3 113 21.8 6 159 25.5district hospital 2 140 26.9 2 141 22.6total 10 519 100.0 14 624 100.0
*facility type, †HIV+ pregnant women at ANC.
background characteristics Women: In the records reviewed the mean age of the women was 26.8 years, with mean parity at this pregnancy of two. Table 14 presents the demographic and selected clinical characteristics of the women. There was no information on marital status or education. There was information on employment status for 370 (59 percent) of the women. Of these, 78 percent were recorded as housewives and 15 percent as farmers. Information on referral for ART initiation was available for 416 (67 percent) of the women; among these, over 95 percent had been referred for ART initiation. About 24 percent of women were recorded as having had the recommended four or more ANC visits for this pregnancy, and 85 percent overall were known to be HIV positive at the first ANC visit. The mean gestational age at booking was 22 weeks. There were few data on the WHO clinical staging, as this information was missing for 74 percent of the records. Almost all 609 (98 percent) of the women were on TDF+ lamivudine (3TC)+EFV (efavirenz) regimen, with this information missing for 11 women.

rwanda, Malawi, Kenya, and Swaziland ■ 21
table 14 baseline characteristics of the women (n=624)n %
Age [n, mean, (sd) median, (q1, q3)] 608, 26.8 (5.4) 27, (23, 30)
employment status (n=370)Housewife 289 78.1Employed 9 2.43farmer 55 14.9Trader 13 3.5Other – –Unemployed 4 1.1
referral to Art initiating site (n=416)Yes 406 97.6No 10 2.4
Parity at this pregnancy [n, mean (sd), median, (q1, q3)] 599, 2 (1.56) 2, (1, 3)
number of Anc visits for this pregnancy (n=599)1 146 24.42 148 24.73 162 27.14 or more 143 23.9
Known HIV positive at first ANC (n=542) Yes 532 98.2 No 10 1.8
Who staging at baseline (n=163)Stage 1 151 92.6Stage 2 7 4.3Stage 3 or 4 5 3.1
gestation weeks [n, mean (sd), median, (q1, q3)] 596, 21.9 (6.08), 22, (18, 26)
Infants: Table 15 presents the background characteristics of the infants. About 95 percent of the infants were born at the health facilities, though for 236 women (38 percent), this information was unknown. Information on mode of delivery was available for less than half of the infants; where this was available, 96 percent had normal vaginal deliveries. The mean birth weight of the infants was 2,523 grams (5.6 pounds). About 86 percent of the infants had had an infant DNA PCR test done, but these data were not available for 351 infants (57 percent). Concerning mode of feeding, 89 percent were reported to be exclusively breastfed, while 6 percent were mixed fed. Again, however, these figures are from limited data, as for 386 infants (62 percent), this information was missing. About 35 percent were recorded to have had an HIV antibody test at age 18 months. However, this information was unknown or missing for 386 infants (62 percent). About 83 percent of the infants were recorded to have received CTX supplementation; however, this information was unknown for 346 infants (57 percent).

22 ■ A Secondary Analysis of retention Across the PMTCT Cascade in Selected Countries
table 15 baseline characteristics of the infants (n=624)n %
Place of delivery for first child (n=385)Health facility 366 95.1Home 10 2.6Baby brought alive (to the health facility) 9 2.3
gender (n=368)Male 174 47.3female 194 52.7
Mode of delivery (n=305)Normal vaginal delivery 293 96.0C-section 9 3.0Breech 2 0.7Vacuum extraction 1 0.3
birth weight [n, mean (sd)] 598, 2,523 (608)
infant dnA Pcr (n=264)Yes 226 85.6No 38 14.4
Mode of feeding (n=238)Complementary feeding 12 5.04Exclusive breastfeeding 212 89.08Mixed feeding 14 5.88
infant hiv antibody tested at 18m (n=238)Yes 82 34.5No 155 65.1Not applicable 1 0.4
ctx supplementation (n=261)Yes 216 82.8No 45 17.2
Health facilities: Of the 14 facilities that were surveyed, seven were primary level facilities, five secondary level and two tertiary level (Table 16). In 2012, the median number of ANC clients in these facilities was 2,395, while the median number of HIV-positive pregnant women was 88. The median number of deliveries in the 6 facilities in which this indicator was analyzed was 2,147, and 11 of the 14 health facilities were located in rural/semi-urban areas. There was a median number of 10 health staff and 13 trained nurses per facility. All 14 health facilities provided maternity services, and they all provided both adult and pediatric ART services. ART drug stock outs in the last three months had been experienced by about a third (five) of the facilities, and eight facilities indicated that they had active follow-up mechanisms for clients on ART. However, there were no data on when the follow up started (within a week or later).

rwanda, Malawi, Kenya, and Swaziland ■ 23
table 16 description of the health facilities (n=14)n
type of facilityCommunity/rural hospital 6District hospital 2Health center 6
number of Anc clients 2012 [n, mean (sd), median, (q1, q3)] 14, 2946.93 (1571.52), 2395, (1810, 3916)number of hiv+ pregnant women 2012 [n, mean (sd), median, (q1, q3)]
14, 142(145), 87.5, (53, 143)
number of deliveries [n, mean (sd), median, (q1, q3)] 6, 2564 (1569.43), 2147.5, (1270, 3618)
Place of facilityrural 11Urban 3
number of health staff [n, mean (sd), median, (q1,q3)] 12, 10.91 (7.48), 10, (4.5, 16)number of hiv trained nurses [n, mean (sd), median, (q1, q3)]
14, 22.78 (23.26), 12.5, (8, 31)
Number of clinical officer [n, mean (sd), median, (Q1, Q3)] 14, 4.42 (7.32), 1.5, (0, 7)vacancy rate [n, median (sd), (q1, q3)] 6, 48.66 (10.30), 50, (40, 52)number of trained health care workers [n, mean (sd), median, (q1, q3)]
13, 17.61 (27.71), 10, (5, 13)
number of medical doctors [n, mean (sd), median, (q1, q3)] 14, 0.64 (1.39), 0, (0, 1)number of medical assistant [n, mean (sd), median, (q1, q3)] 14, 5.21 (5.53), 3.5, (2, 4)number of Pnc clients [n, mean (sd), median, (q1, q3)] 11, 1,134.55 (952.93), 887, (511, 1405)
Maternity services providedYes 14No 0
Art drug stock outs last 3 monthsYes 9No 5
Art adult servicesYes 14No 0
Pediatric Art servicesYes 14No 0
follow up mechanismsActive 8Passive 6

24 ■ A Secondary Analysis of retention Across the PMTCT Cascade in Selected Countries
Program retention Health facility retention; women: The retention levels of the women by the specified time intervals are presented in Table 17. About 35 percent of the women returned to the same facility 30 days after registration. At delivery, however, 62 percent of the registered women were retained, but by 9–10 months only 34 percent were retained.
Table 17 Retention of women by specified time intervalsn expected n observed time period Prop. 95% cis600 209 30 days 0.35 0.31, 0.39624 384 Delivery 0.62 0.58, 0.66384 147 6 wks 0.28 0.23, 0.33384 186 2–4 m 0.36 0.32, 0.41384 165 5–7 m 0.31 0.27, 0.37384 151 9–10 m 0.34 0.29, 0.39
Health facility retention; infants: The retention of infants by specified time intervals is presented in Table 18. Only 14 percent were returned to the same health facilities at 6 weeks of age, though this proportion increased to 23 percent at 2–4 months, and then decreased to 11 percent at 9–10 months.
Table 18 Retention of infants by specified time intervalsn expected n observed time period Prop. 95% ci624 91 6 wks 0.14 0.88, 0.23624 141 2–4 m 0.23 0.15, 0.34624 130 5–7 m 0.21 0.14, 0.32624 71 9–10 m 0.11 0.14, 0.24
demographic and clinical characteristics associated with retentionDue to the paucity of data on these characteristics, we examined retention by ANC visits only for the current pregnancy for the women; these findings are presented in Table 19.
At all specified time intervals, ANC visits were associated with retention, where women who had 3–4 visits were better retained than women who had 1–2 visits, p<0.05.
Table 19 Retention at specified time intervals by ANC visits for current pregnancy
TIME Anc visits 1–2 Anc visits 3–4
Prop 95% ci Prop 95% ci p-value
30 days 0.24 0.18, 0.33 0.43 0.38, 0.49 <0.001delivery 0.49 0.41, 0.59 0.72 0.66, 0.79 <0.0016 wks 0.30 0.25, 0.38 0.42 0.36, 0.48 0.0122–4 m 0.36 0.30, 0.43 0.55 0.49, 0.61 <0.0015–7 m 0.32 0.27, 0.39 0.48 0.44, 0.53 <0.0019–10 m 0.35 0.27, 0.44 0.54 0.47, 0.61 <0.001

rwanda, Malawi, Kenya, and Swaziland ■ 25
retention by facility characteristics We used GEE modeling to assess facility and other characteristics associated with retention. The GEE assumes a Poisson distribution with the log link and unstructured variance-covariance for the dependent variable. We considered the following variables: medical assistants, trained health care workers (HCWs), facility location, number of deliveries, ANC visits, and number of HIV-positive pregnant women. Tables 20 and 21 present these findings for women and infants respectively.
Rural location and number of ANC visits were positively associated with retention, while lower numbers of HIV-positive pregnant women, medical assistants, and trained health care workers were negatively associated with retention. Women in rural facilities were nearly 60 percent more likely to be retained than women in urban facilities.
table 20 characteristics associated with retention among womenvariable Parameter
estimatestandard
erroror 95% ci on or/
parameter estimate*
p-value
intercept 1.015 0.139 -1.284, -0.747 <0.001
facility location (rural) 0.408 0.091 1.579 1.354, 1.840 <0.001no. of Anc visits 0.169 0.038 1.184 1.097, 1.276 <0.001no. of medical assistants -0.040 0.010 -1.041 -1.062, -1.020 <0.001no. of trained hcWs -0.002 0.001 -1.002 -1.005, -1.0006 0.013no. of hiv+ pregnant women -0.0003 0.0001 -1.0003 -1.0006, -1.00009 0.032
For infants, not paying for services was negatively associated with retention, as were lower numbers of medical assistants, clinical officers, and trained health care workers. As with the women, attending more ANC visits was associated with retention, as were more trained nurses. Infants attending rural facilities were two and one half times more likely to be retained compared with those attending urban facilities.
table 21 characteristics associated with retention among infantsvariable Parameter
estimatestandard
erroror 95% ci on or/
parameter estimate*
p-value
intercept -2.817 0.177 -3.165, -2.470 <0.001
facility location (rural) 0.925 0.176 2.523 1.785, 3.566 <0.001Pay for service (no) -0.449 0.136 0.638 0.488, 0.833 <0.001no. of Anc visits 0.337 0.052 1.401 1.315, 1.618 <0.001no. of trained nurses 0.061 0.003 1.063 1.055, 1.071 <0.001no. of medical assistants -0.113 0.015 -1.119 -1.155, -1.087 <.0001No. of clinical officers -0.119 0.021 -1.126 -1.175, -1.079 <0.001no. of trained hcWs -0.006 0.002 -1.006 -1.010, -1.002 0.004

26 ■ A Secondary Analysis of retention Across the PMTCT Cascade in Selected Countries
discussionAccording to the Government of Malawi MOH Integrated HIV Program Report, July–September 2013, 72 percent of women enrolled on ART were retained at 12 months (Government of Malawi, MOH 2013b). A paper published by Tenthani et al. (2014) found that retention of Option B+ patients at 6 months was estimated to be 76 percent from electronic patient record data and 82 percent from non-electronic patient records. Our findings of retention of about 31 percent at 6 months, and 34 percent at 9–10 months are at variance with the reported national estimates. Explanations for these differences include site performance variations, different data sources, sample sizes, data quality and completeness, timing of the study framework, and definitions of retention.
Site performance variations: In general in Malawi, there is a sizeable variation in site performance as documented in the MOH quarterly supervision visits/ reports, according to the MOH July–September 2013, Integrated HIV Program Report (2013b). This study sampled 14 sites of 675 static sites. Sites were selected for the study based on patient load and HIV prevalence regardless of performance.
Data sources: The MOH measures PMTCT/ART retention from the ART register as the entry point, whereas we used ANC and maternity registers as the entry points. The objective of the study was to assess the retention on ART of the HIV-positive mothers starting from pregnancy to delivery and postnatal care. Hence the ANC register was used as an entry point and the maternity register was also used to capture information about delivery. Ultimately this should not matter as all persons on ART (including pregnant and lactating women) are referred to the ART clinic after delivery and/or breastfeeding. However, there are more steps in the documentation process to go from ANC to ART (than a patient initiating ART in ART) and therefore some women and/or records may not transfer. In addition, the ART records are of higher quality because of the many years of intense supervision and data quality checks, which are not systematically done in ANC and maternity register; therefore the ANC/maternity records tend to have more missing and inaccurate information.
Sample size: This study sampled 14 facilities, whereas the MOH reviews retention in all 675 facilities offering ART. This could mean that some women seen in ANC at a study site moved to another non-study site for delivery and/or subsequent ART services. This cannot be determined when reviewing results at 14 facilities, but may be determined when reviewing results at all facilities in the country. This is one of the study limitations.
Data quality and completeness: EGPAF has observed data quality issues within and independent of this study related to human resource limitations, knowledge and training on the completion of national data tools, data use, and other factors. The MOH records data quality issues in their quarterly quality improvement reports. The proportion of sites with data quality issues varies, but in the MOH Quarter 3, 2013 Quality Improvement report, there were over 400 sites identified (out of 675) with data completeness and/or quality issues (Government of Malawi, Ministry of Health 2013a).
Timing of the study frame: We sampled cohorts of women from sites during the October to December 2011 and January to March 2012 time period. This corresponds with the first one to six months of the rollout of Option B+ in Malawi. An analysis completed but not presented found that there was lower retention in the October to December period compared with the January to March period, but that this was limited. There had been insufficient beneficiary and community preparedness and communication

rwanda, Malawi, Kenya, and Swaziland ■ 27
prior to the rollout (UNAIDS 2011). This was later rectified through community sensitizations. However, very early on, some women identified as HIV-positive in pregnancy and instructed to start ART for life were reluctant and rather than refuse treatment, disposed of the ARVs (based on anecdotal stories from implementing partners’ observations). A recent presentation suggested that stigma, confidentiality, privacy, and the method of initiating ART continue to challenge PMTCT services in Malawi (Cataldo et al. 2013).
Definition of retention: The definition of retention in this study was more specific and restrictive than is generally used to calculate retention in a programmatic setting. Retention in the study was based on the dates indicated in the patient card for drug pickups. The study considered women to be retained on ART only if she adhered to the schedule for drug pickup as documented in the patient card or register. Retention in programmatic settings is typically a calculation of individual alive and current on ART in a given period.
Tenthani and Haas, in reviewing data for the period October 2011–March 2012 for 21,939 patients from 540 nationally representative facilities as well as 11,534 patient records from the electronic medical record system from 19 large facilities, also found that compared to ART patients in an advanced stage of the disease, Option B+ patients are at increased risk of loss to follow-up and that pregnant Option B+ patients are at particularly high risk to get lost. In addition, most Option B+ patients who were lost started at the day of HIV testing and never came back. This finding was supported by Coulborn in a study of a rural district in Malawi (Coulborn et al. 2013). Our data show that a large proportion of the women indeed were lost to follow up soon after testing and being enrolled in the PMTCT/ART program.
We found rural sites to be at least twice as likely to retain mothers and infants. This is consistent with Tenthani et al.’s (2014) findings that urban sites tended to have higher loss to follow up (OR: 1.4, [1.0–2.0]) compared to rural sites. Lower numbers of trained health workers, medical assistants, and HIV-positive pregnant women may be associated also with the smaller (rural) health facilities. Our findings of an association between smaller centers as measured by smaller numbers of health workers is consistent with a report of the success of a Rwanda program for HIV-infected children on ART by McNairy et al. (2013).
Health services in the public facilities are free, so the finding that infant retention was associated with payment services is an indicator of faith-based managed facilities. Our finding is consistent with Tenthani et al.’s (2014) finding that faith-based managed facilities had 19 percent better retention than publicly managed facilities among pregnant and breastfeeding women on Option B+. Programs with active follow up are associated with decreased patient loss to follow up (Thomson, Cheti, and Reid 2011; Tweya et al. 2010).
KenyA
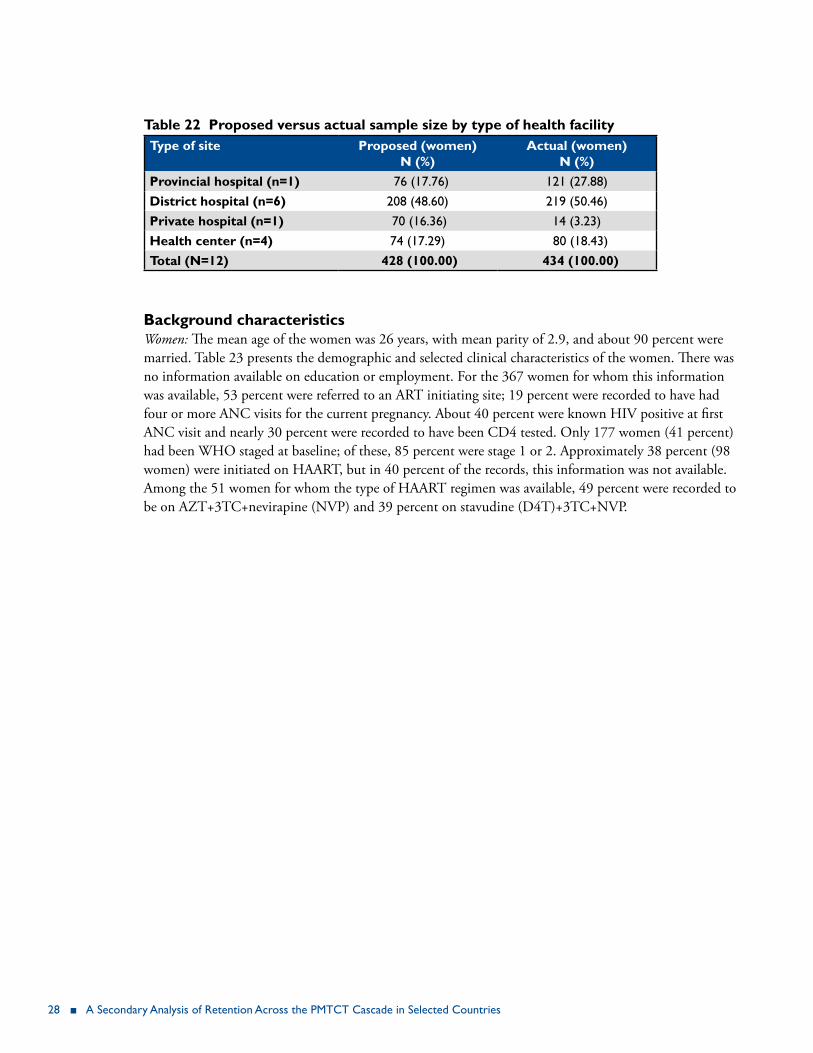
sample size Table 22 presents the proposed sample sizes for the records of HIV-positive women to be reviewed versus the actual sample sizes attained by type of health facility. Overall, 100 percent of the proposed sample size was reached. The district hospitals contributed 50 percent of the total number of records sampled and the provincial hospital contributed 28 percent.
28 ■ A Secondary Analysis of retention Across the PMTCT Cascade in Selected Countries
table 22 Proposed versus actual sample size by type of health facilitytype of site Proposed (women)
n (%)Actual (women)
n (%)Provincial hospital (n=1) 76 (17.76) 121 (27.88)district hospital (n=6) 208 (48.60) 219 (50.46)Private hospital (n=1) 70 (16.36) 14 (3.23)health center (n=4) 74 (17.29) 80 (18.43)total (n=12) 428 (100.00) 434 (100.00)
background characteristics Women: The mean age of the women was 26 years, with mean parity of 2.9, and about 90 percent were married. Table 23 presents the demographic and selected clinical characteristics of the women. There was no information available on education or employment. For the 367 women for whom this information was available, 53 percent were referred to an ART initiating site; 19 percent were recorded to have had four or more ANC visits for the current pregnancy. About 40 percent were known HIV positive at first ANC visit and nearly 30 percent were recorded to have been CD4 tested. Only 177 women (41 percent) had been WHO staged at baseline; of these, 85 percent were stage 1 or 2. Approximately 38 percent (98 women) were initiated on HAART, but in 40 percent of the records, this information was not available. Among the 51 women for whom the type of HAART regimen was available, 49 percent were recorded to be on AZT+3TC+nevirapine (NVP) and 39 percent on stavudine (D4T)+3TC+NVP.

table 23 baseline characteristics of the women (n=434)variable n %Age [n, mean (sd) median, (q1, q3)] 430, 26.3 (5.20), 26(22, 30)
Parity [n, mean (sd), median, (q1, q3)] 424, 2.9 (1.4), 3(1.0, 4.0)
Marital status (n=410)Married 373 91.0Single 21 5.1Divorced/separated/widowed 16 3.9
referral to Art initiating site (n=367)Yes 195 53.1No 172 46.9
number of Anc visits for this pregnancy (n=363)1 163 44.92 72 19.83 60 16.54 or more 68 18.7
Known HIV positive at first ANC (n=434)Yes 172 39.6No 262 60.4
cd4 tested (n=434)Yes 133 30.7No 301 69.3
Who staging at baseline (n=177)Stage 1 98 55.4Stage 2 53 29.9Stages 3&4 26 14.7
initiated on prophylaxis or hAArt (n=258)HAArT 98 38.0Prophylaxis 160 62.0
type of regimen
Prophylaxis (n=73)AZT 48 65.8AZT+3TC 9 12.3AZT+NVP 6 8.2AZT+3TC+NVP 7 9.6SDN 3 4.1
hAArt (n=51)AZT+3TC+NVP 25 49.0D4T+3TC+NVP 20 39.2AZT+3TC+EfV 4 7.8AZT+D4T+EfV 1 2.0ABC+3TC+NVP 1 2.0
toxicities/side effects (n=133)Yes 2 1.50No 131 98.50
Notes: AZT=zidovudine, 3TC=lamivudine, NVP=nevirapine, SDN=single-dose nevirapine, EfV=efavirenz, D4T=stavudine, ABC= abacavir
30 ■ A Secondary Analysis of retention Across the PMTCT Cascade in Selected Countries
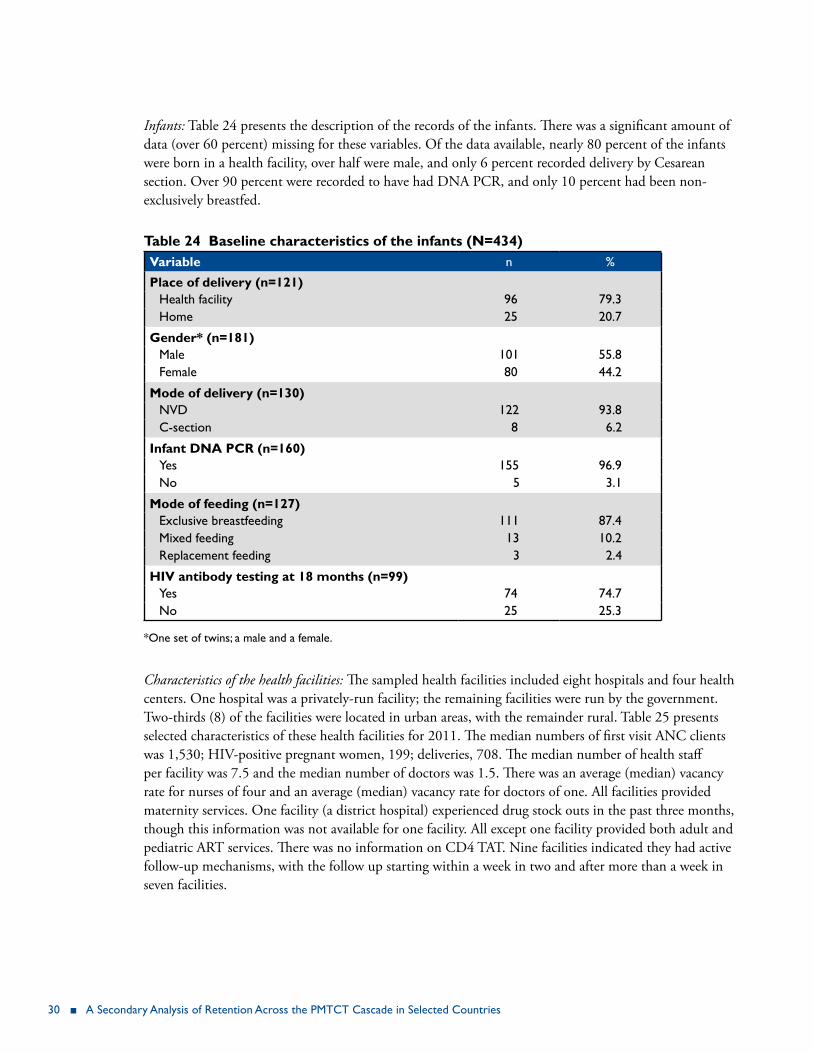
Infants: Table 24 presents the description of the records of the infants. There was a significant amount of data (over 60 percent) missing for these variables. Of the data available, nearly 80 percent of the infants were born in a health facility, over half were male, and only 6 percent recorded delivery by Cesarean section. Over 90 percent were recorded to have had DNA PCR, and only 10 percent had been non-exclusively breastfed.
table 24 baseline characteristics of the infants (n=434)variable n %
Place of delivery (n=121)Health facility 96 79.3Home 25 20.7
gender* (n=181)Male 101 55.8female 80 44.2
Mode of delivery (n=130)NVD 122 93.8C-section 8 6.2
infant dnA Pcr (n=160)Yes 155 96.9No 5 3.1
Mode of feeding (n=127)Exclusive breastfeeding 111 87.4Mixed feeding 13 10.2replacement feeding 3 2.4
hiv antibody testing at 18 months (n=99)Yes 74 74.7No 25 25.3
*One set of twins; a male and a female.
Characteristics of the health facilities: The sampled health facilities included eight hospitals and four health centers. One hospital was a privately-run facility; the remaining facilities were run by the government. Two-thirds (8) of the facilities were located in urban areas, with the remainder rural. Table 25 presents selected characteristics of these health facilities for 2011. The median numbers of first visit ANC clients was 1,530; HIV-positive pregnant women, 199; deliveries, 708. The median number of health staff per facility was 7.5 and the median number of doctors was 1.5. There was an average (median) vacancy rate for nurses of four and an average (median) vacancy rate for doctors of one. All facilities provided maternity services. One facility (a district hospital) experienced drug stock outs in the past three months, though this information was not available for one facility. All except one facility provided both adult and pediatric ART services. There was no information on CD4 TAT. Nine facilities indicated they had active follow-up mechanisms, with the follow up starting within a week in two and after more than a week in seven facilities.

rwanda, Malawi, Kenya, and Swaziland ■ 31
table 25 description of health facilities (n=12)n
number of Anc clients 2011 [n, mean (sd), median (q1, q3)]
12, 1729.8 (1165.5),1530 (905.5, 2416)
number of hiv+ pregnant women 2011 [n, mean (sd), median (q1, q3)]
12, 1212.5 (1673.5), 199 (51, 2319)
number of deliveries [n, mean (sd), median (q1, q3)] 12, 1355.4 (1725.4),708.5 (393.5, 1287.5)number of health staff [n, mean (sd), median (q1,q3)] 12, 15.9 (18.3), 7.50 (5, 22)number of doctor last quarter [n, mean (sd), median (q1, q3)]
12, 6.4 (14.9), 1.50 (0, 4)
vacancy rates: nurses [n, mean (sd), median (q1, q3)] 12, 9.3 (13.1), 4 (3, 7)vacancy rates: doctors [n, mean (sd), median (q1, q3)] 11, 2.6 (3.9), 1 (0, 8)
Art drug stock outs last 3 monthsYes 1No 9Missing 1
follow up mechanismsActive 9Passive 3
if active, when does follow-up mechanism startless than a week 2More than a week 7
Program retention Health facility retention; women: We examined retention of women overall and on HAART specifically, as under Option A, these women should be followed over time, including postnatal. Table 26 presents these data.
Table 26 Retention of women overall and on HAART by specified time intervalsexpected observed time overall on hAArt
Prop 95% ci Prop 95% ci
434 79 30 days 0.18 0.14, 0.21 0.41 0.33, 0.52434 122 Delivery 0.28 0.24, 0.32 0.42 0.34, 0.53182 39 6 wks 0.21 0.16, 0.28 0.40 0.29, 0.54182 57 2–4 m 0.31 0.25, 0.39 0.59 0.48, 0.73182 30 5–7 m 0.16 0.12, 0.23 0.25 0.16, 0.39182 4 11–13 m 0.02 0.01, 0.06 0.03 0.008, 0.126
For the 30 day, delivery, and 6 week visits, about 40 percent of the women on HAART were retained, and at the 2–4 month visit, this increased to nearly 60 percent. Thereafter, the proportion declined to 25 percent, and subsequently to 3 percent at 11–13 months.

32 ■ A Secondary Analysis of retention Across the PMTCT Cascade in Selected Countries
Health facility retention; infants: Table 27 shows the infant retention by specified time period. The highest proportion of infants retained (16 percent, 12–21) was at 2–4 months after delivery.
Table 27 Retention of infants by specified time intervalsexpected observed time Prop 95% ci434 43 6 wks 0.10 0.07, 0.14434 70 2–4 m 0.16 0.12, 0.21434 57 5–7 m 0.11 0.07, 0.17434 7 11–13 m 0.01 0.00, 0.03
demographic and clinical characteristics associated with retentionWe examined retention levels by selected demographic and clinical characteristics. These characteristics were referral to ART initiating site and number of ANC visits for the current pregnancy, (<3, 3+). The findings are presented in Tables 28–29.
At delivery, women who were not referred were better retained, p<0.001 (Table 28). However, referred women had better retention levels at 6 weeks and 2–4 months, p=0.008, p=0.014, respectively.
Table 28 Retention at specified time intervals by referral to ART initiating sitetime referred did not refer p-value
Prop 95% ci Prop 95% ci
30 days 0.15 0.11, 0.21 0.22 0.17, 0.29 0.073delivery 0.22 0.16, 0.28 0.38 0.31, 0.46 <0.0016 wks 0.31 0.23, 0.43 0.14 0.08, 0.24 0.0082–4 m 0.42 0.33, 0.54 0.24 0.16, 0.36 0.0145–7 m 0.19 0.12, 0.30 0.16 0.10, 0.27 0.63911–13 m 0.04 0.01, 0.11 0.01 0.001, 0.09 0.335
At all time periods, except for 11–13 months (which had very limited data), women with 3–4 ANC visits had higher retention proportions, though these reached statistical significance only for the 30 days, delivery, and at 6 weeks visits, p<0.05. Table 29 presents these data.
Table 29 Retention at specified time intervals by ANC visits for current pregnancytime Anc visits 1–2 Anc visits 3–4
Prop 95% ci Prop 95% ci p-value
30 days 0.04 0.03, 0.06 0.26 0.18, 0.35 <0.001delivery 0.12 0.07, 0.19 0.39 0.25, 0.60 <0.0016 wks 0.09 0.03, 0.29 0.24 0.13, 0.43 0.0422–4 m 0.19 0.09, 0.39 0.34 0.22, 0.53 0.0915–7 m 0.13 0.04, 0.39 0.17 0.09, 0.35 0.50311–13 m 0.03 0.01, 0.19 0.02 0.01, 0.05 0.693

rwanda, Malawi, Kenya, and Swaziland ■ 33
retention by facility and other characteristicsAs mentioned previously, we used GEE modeling to assess the characteristics associated with retention. In addition to referral for initiation and number of ANC visits, the facility characteristics of location, numbers of first ANC visits, HIV-positive pregnant women, deliveries, nurses, doctors, health staff, and follow up mechanism, whether active or passive, were included in the model. These findings are presented in Table 30. Facility location, type of follow-up mechanism, and number of facility doctors were associated with retention. Women in urban facilities were 22 percent less likely to attend visits compared to those from rural facilities, with an OR of 0.78 (0.62, 0.98). Women who attended facilities with active follow up mechanisms were more likely to attend visits compared to those who attended facilities with passive follow up mechanisms, OR: 1.83, (1.42, 2.35). Similarly, the likelihood of attending health facility visits increased with the number of doctors, OR: 1.01 (1.00, 1.01).
table 30 characteristics associated with retention among womenvariable Parameter
estimatestd error or 95% ci on or/
parameter estimate
p-value
facility location (urban) -0.244 0.116 0.782 0.623, 0,983 0.035follow up mechanism (active) 0.603 0.127 1.827 1.423, 2.346 <0.001no. of doctors 0.008 0.002 1.008 1.003, 1.013 <0.001
discussionThe reportedly low retention rates among both the women and the infants is likely due to the movement of women between facilities, and perhaps poor record-keeping. Women attending ANC in one facility but choosing to deliver in another facility is a practice that has been found in other countries. A study in Zimbabwe found that though delivery facilities were available in the rural health centers, many women chose to deliver at the district or mission hospitals, despite the longer distances, possibly because of the perception of better services, including the presence of doctors (Muchedzi et al. 2013). In addition, Kenya, as an Option A country, does not specifically track HIV-positive pregnant women. A study of two government hospitals found inaccurate recording and reporting of PMTCT data, where register data indicated that about a third of the women attending ANC were not given maternal prophylaxis (Ferguson et al. 2012). Interviews with the nurses revealed that they sometimes failed to record the provision of prophylaxis despite actually giving it. Though not strictly comparable, Kenyan children under the age of one year on ART were reported to have a rate of 70 percent retention in care in a multi-country study (McNairy et al. 2013). The data in the multi-country study came from a collaboration (Identifying Optimal Models of HIV Care and Treatment Study, 5U2GPS001537-03), which had resources to invest in improving training, oversight, and documentation, including electronic patient-level databases. Thus these findings probably do not represent the operational status of retention. EGPAF 2011 aggregate data for HIV-exposed infants showed that the retention rate at 18 months was 42 percent (EGPAF 2011). Data for 12 months retention were not available. Women who attended more ANC visits were better retained than women who attended fewer.
However, women on HAART are tracked, and while these retention levels were also relatively low, they decreased precipitously after 3 months post natal. This may have been because these women were transferred for follow-up at the ART clinics, and were therefore no longer available in the MCH clinics.
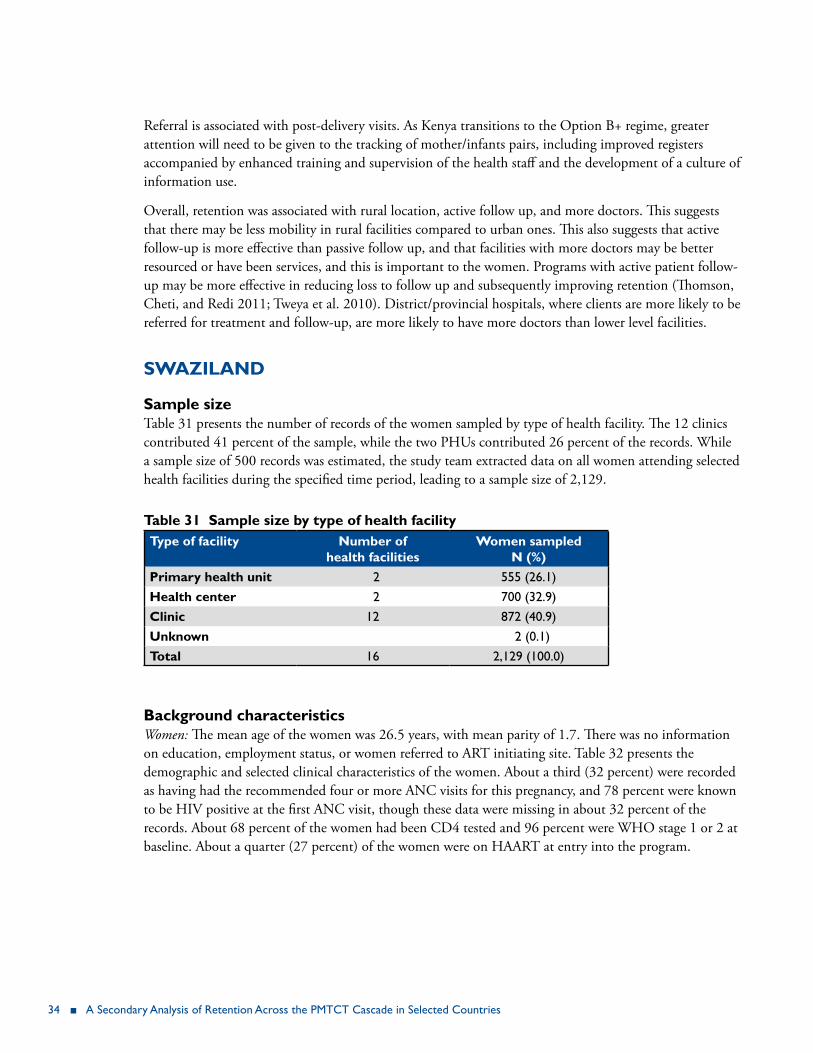
34 ■ A Secondary Analysis of retention Across the PMTCT Cascade in Selected Countries
Referral is associated with post-delivery visits. As Kenya transitions to the Option B+ regime, greater attention will need to be given to the tracking of mother/infants pairs, including improved registers accompanied by enhanced training and supervision of the health staff and the development of a culture of information use.
Overall, retention was associated with rural location, active follow up, and more doctors. This suggests that there may be less mobility in rural facilities compared to urban ones. This also suggests that active follow-up is more effective than passive follow up, and that facilities with more doctors may be better resourced or have been services, and this is important to the women. Programs with active patient follow-up may be more effective in reducing loss to follow up and subsequently improving retention (Thomson, Cheti, and Redi 2011; Tweya et al. 2010). District/provincial hospitals, where clients are more likely to be referred for treatment and follow-up, are more likely to have more doctors than lower level facilities.
sWAZilAnd
sample size Table 31 presents the number of records of the women sampled by type of health facility. The 12 clinics contributed 41 percent of the sample, while the two PHUs contributed 26 percent of the records. While a sample size of 500 records was estimated, the study team extracted data on all women attending selected health facilities during the specified time period, leading to a sample size of 2,129.
table 31 sample size by type of health facilitytype of facility number of
health facilitiesWomen sampled
n (%)Primary health unit 2 555 (26.1)health center 2 700 (32.9)clinic 12 872 (40.9)unknown 2 (0.1)total 16 2,129 (100.0)
background characteristics Women: The mean age of the women was 26.5 years, with mean parity of 1.7. There was no information on education, employment status, or women referred to ART initiating site. Table 32 presents the demographic and selected clinical characteristics of the women. About a third (32 percent) were recorded as having had the recommended four or more ANC visits for this pregnancy, and 78 percent were known to be HIV positive at the first ANC visit, though these data were missing in about 32 percent of the records. About 68 percent of the women had been CD4 tested and 96 percent were WHO stage 1 or 2 at baseline. About a quarter (27 percent) of the women were on HAART at entry into the program.
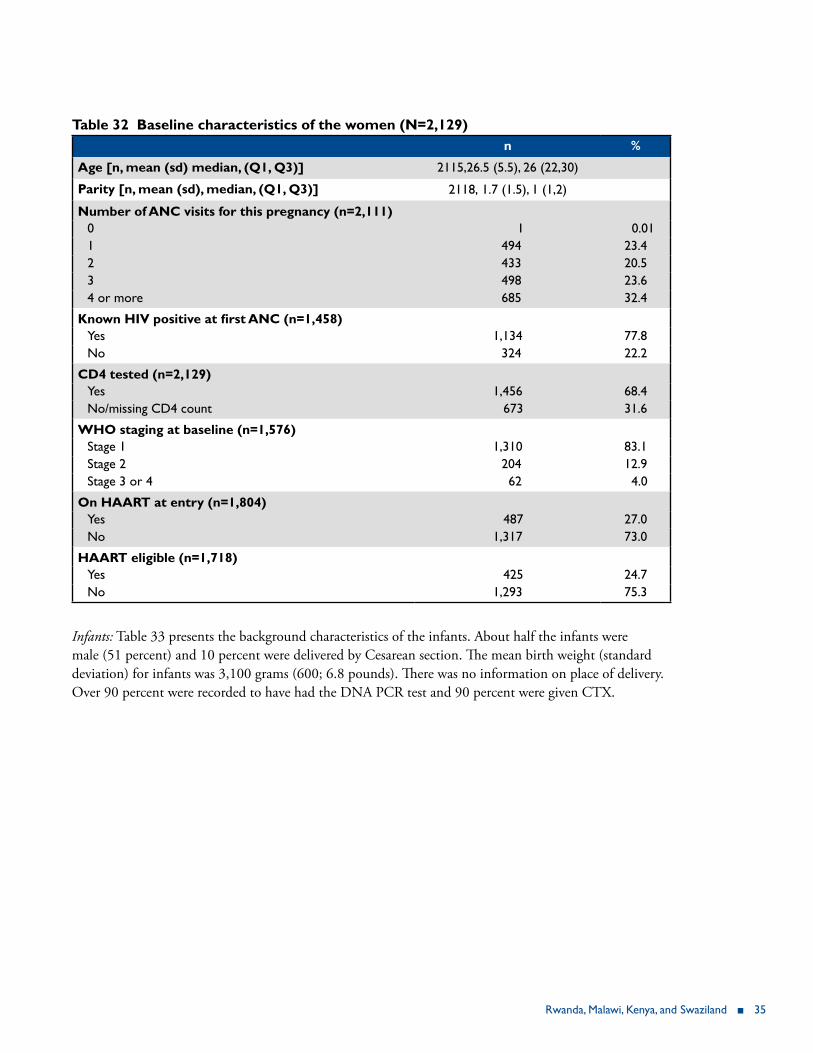
rwanda, Malawi, Kenya, and Swaziland ■ 35
table 32 baseline characteristics of the women (n=2,129) n %
Age [n, mean (sd) median, (q1, q3)] 2115,26.5 (5.5), 26 (22,30)
Parity [n, mean (sd), median, (q1, q3)] 2118, 1.7 (1.5), 1 (1,2)
number of Anc visits for this pregnancy (n=2,111)0 1 0.011 494 23.42 433 20.53 498 23.64 or more 685 32.4
Known HIV positive at first ANC (n=1,458)Yes 1,134 77.8No 324 22.2
cd4 tested (n=2,129)Yes 1,456 68.4No/missing CD4 count 673 31.6
Who staging at baseline (n=1,576)Stage 1 1,310 83.1Stage 2 204 12.9Stage 3 or 4 62 4.0
on hAArt at entry (n=1,804)Yes 487 27.0No 1,317 73.0
hAArt eligible (n=1,718)Yes 425 24.7No 1,293 75.3
Infants: Table 33 presents the background characteristics of the infants. About half the infants were male (51 percent) and 10 percent were delivered by Cesarean section. The mean birth weight (standard deviation) for infants was 3,100 grams (600; 6.8 pounds). There was no information on place of delivery. Over 90 percent were recorded to have had the DNA PCR test and 90 percent were given CTX.
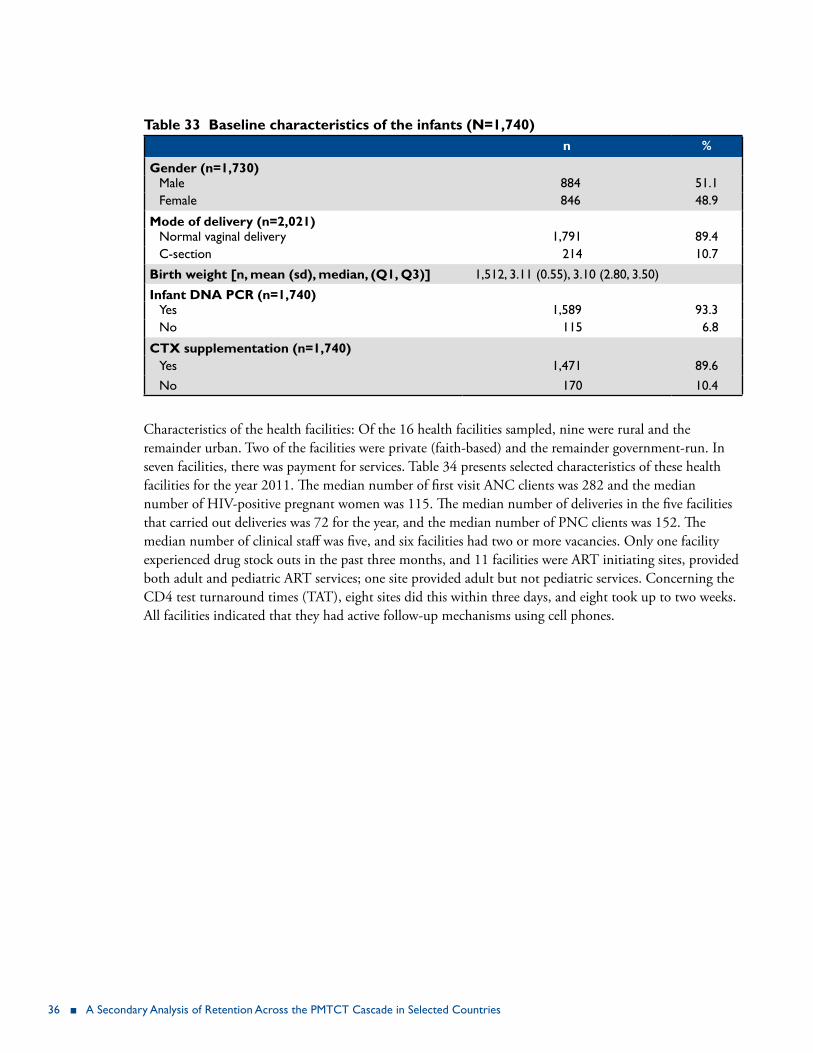
36 ■ A Secondary Analysis of retention Across the PMTCT Cascade in Selected Countries
table 33 baseline characteristics of the infants (n=1,740)n %
gender (n=1,730)Male 884 51.1female 846 48.9
Mode of delivery (n=2,021)Normal vaginal delivery 1,791 89.4C-section 214 10.7
birth weight [n, mean (sd), median, (q1, q3)] 1,512, 3.11 (0.55), 3.10 (2.80, 3.50)
infant dnA Pcr (n=1,740)Yes 1,589 93.3No 115 6.8
ctx supplementation (n=1,740)Yes 1,471 89.6No 170 10.4
Characteristics of the health facilities: Of the 16 health facilities sampled, nine were rural and the remainder urban. Two of the facilities were private (faith-based) and the remainder government-run. In seven facilities, there was payment for services. Table 34 presents selected characteristics of these health facilities for the year 2011. The median number of first visit ANC clients was 282 and the median number of HIV-positive pregnant women was 115. The median number of deliveries in the five facilities that carried out deliveries was 72 for the year, and the median number of PNC clients was 152. The median number of clinical staff was five, and six facilities had two or more vacancies. Only one facility experienced drug stock outs in the past three months, and 11 facilities were ART initiating sites, provided both adult and pediatric ART services; one site provided adult but not pediatric services. Concerning the CD4 test turnaround times (TAT), eight sites did this within three days, and eight took up to two weeks. All facilities indicated that they had active follow-up mechanisms using cell phones.
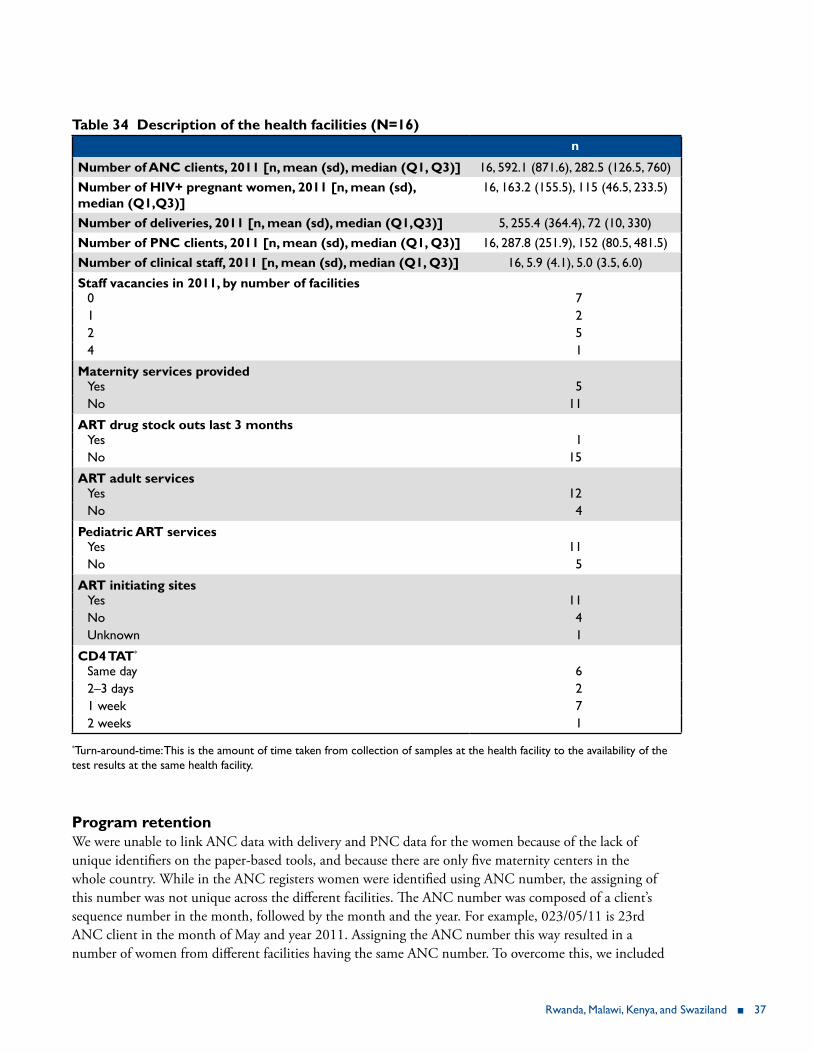
rwanda, Malawi, Kenya, and Swaziland ■ 37
table 34 description of the health facilities (n=16)n
number of Anc clients, 2011 [n, mean (sd), median (q1, q3)] 16, 592.1 (871.6), 282.5 (126.5, 760)number of hiv+ pregnant women, 2011 [n, mean (sd), median (q1,q3)]
16, 163.2 (155.5), 115 (46.5, 233.5)
number of deliveries, 2011 [n, mean (sd), median (q1,q3)] 5, 255.4 (364.4), 72 (10, 330) number of Pnc clients, 2011 [n, mean (sd), median (q1, q3)] 16, 287.8 (251.9), 152 (80.5, 481.5)number of clinical staff, 2011 [n, mean (sd), median (q1, q3)] 16, 5.9 (4.1), 5.0 (3.5, 6.0)
staff vacancies in 2011, by number of facilities0 71 22 54 1
Maternity services providedYes 5No 11
Art drug stock outs last 3 monthsYes 1No 15
Art adult servicesYes 12No 4
Pediatric Art servicesYes 11No 5
Art initiating sitesYes 11No 4Unknown 1
cd4 tAt*
Same day 62–3 days 21 week 72 weeks 1
*Turn-around-time: This is the amount of time taken from collection of samples at the health facility to the availability of the test results at the same health facility.
Program retention We were unable to link ANC data with delivery and PNC data for the women because of the lack of unique identifiers on the paper-based tools, and because there are only five maternity centers in the whole country. While in the ANC registers women were identified using ANC number, the assigning of this number was not unique across the different facilities. The ANC number was composed of a client’s sequence number in the month, followed by the month and the year. For example, 023/05/11 is 23rd ANC client in the month of May and year 2011. Assigning the ANC number this way resulted in a number of women from different facilities having the same ANC number. To overcome this, we included

38 ■ A Secondary Analysis of retention Across the PMTCT Cascade in Selected Countries
other background variables such as area of residence, parity, and age to match and link the women at least from ANC to maternity. Thus we took all the HIV-positive pregnant women enrolled during the period for data abstraction and attempted to match the records on the selected variables and remove all unmatched records to be able to reach the required sample size. However, this did not work, as there were multiple duplicates of the background variables and we ended up with the large sample size. There were also multiple versions of the registers over the period of the data abstraction with different data elements. It was impossible to match ANC records with PNC and mother-baby-pair in child welfare registers, as ANC numbers were missing from both PNC and CWC records. Therefore we present retention levels for the infants only. Table 35 presents retention of infants by the specified time intervals.
Table 35 Retention of infants by specified time intervalsexpected observed time period Prop 95% ci1,839 1,471 6 wks 0.80 0.69, 0.941,839 1,142 2–4 m 0.61 0.51, 0.731,839 372 5–7 m 0.20 0.13, 0.321,821 255 8-10 m 0.14 0.075, 0.261,698 107 11–13 m 0.063 0.027, 0.14
At 6 weeks, 80 percent of the infants were retained in the program; this declined to 61 percent at 2–4 months, but then declined sharply to 20 percent at 5–7 months. At 12 months, the percentage of infants retained was only 6 percent.
retention by facility and other characteristics As mentioned previously, we used GEE modeling to assess the characteristics associated with retention. We modeled location (urban/rural) and ANC volume (high/low), as defined as below or above the mean. We found no association between retention and these variables.
discussionThe inability to effectively track women from the prenatal to the postnatal periods and to link mother/baby pairs represents a significant limitation to PMTCT program monitoring and evaluation. The Option A strategy acknowledged the logistical difficulties of tracking mothers over time, and thus did not attend to this process; focusing instead on the highest period of mother-to-child transmission risk (the antenatal period), while attempting to counter the risk from breastfeeding with feeding guidelines and use of extended NVP. Infants were more likely to return to the health facility regularly due to established immunization and growth monitoring clinics, so the mothers would be able to collect the NVP at the same time. In this study, however, only 60 percent returned at 2–4 months, and by 6 months, 80 percent were lost to follow up. As a number of women breastfeed until at least 12 months, this suggests that there may be ongoing HIV transmission risk through breast milk. Over 70 percent of mothers were still breastfeeding infants at 12–17 months; this declined to 38 percent at 18–23 months (Central Statistical Office/Macro International Inc. 2008). However, these infants may have simply been lost to follow up at that particular facility, and may have been receiving care elsewhere. This finding also reinforces the need to track babies and mothers over time and across facilities. With the movement to Option B+, the need to track mother/infant pairs will be more important, similar to Kenya.
rwanda, Malawi, Kenya, and Swaziland ■ 39
suMMAry And conclusion
In summary, we found retention rates to be lower than expected and that health facility characteristics may be important in retention. However, except for rural location, the specific association of these factors with retention was contextual and differed by country.
liMitAtionsA limitation of the study design is that except for Swaziland, the facility sampling methodology was purposive and excluded very low volume sites, thus having the potential for bias toward higher workload facilities which may have more staff. Also, we cannot assess the degree to which the findings may be representative of particular facilities or geographical areas because of the lack of randomization. Additionally we did not assess the socioeconomic status of women that participated in this study. A strength of the study is that it was carried out in multiple sites in a number of countries, increasing the likely validity of the main findings.
discussionThe implication of these findings for the implementation of Option B+ shows the need for a greater focus on the ability to track and trace clients over time and place. This is especially true given that they will be on ARV drugs for life and that careful attention needs to be paid to specific health facility characteristics which can facilitate or constrain retention. Under the Option A protocol, HIV-positive pregnant women were essentially discharged from the health facility after they had delivered. The lower-than-expected levels of retention may be related to the inability to track the women across facilities as well as the difficulty in tracking the women across the different clinics in the PMTCT program. In our study, retention refers to a woman being found/retained in a particular facility, yet while she may not be found in the records for that facility, she may be receiving services elsewhere and thus still being retained in the program. For various reasons a woman may choose or be referred to another facility, and currently there is no system that adequately tracks women across facilities. Additionally, and of special importance, is the difficulty of tracing women across the multiple registers and files. In order to assess whether a particular woman may be retained even in a particular facility she needs to be traced from the ANC register through, in some cases, to the PMTCT register, to the labor and delivery register, to the postnatal register, etc. There needs to be a unique identifier (such as ANC or PMTCT number) to facilitate this process, and as the system is manual and paper-based, transcription errors are likely to occur. In addition, the limited numbers of often over-worked health care workers need to document information in these various registers and files, sometimes duplicating the information in several places. This combined with the large number of data fields required leads also to the situation of missing data and misplaced or lost registers or patient files and consequent data quality challenges. In many instances, for example, key variables were missing data, in some cases substantial amounts, making that particular variable less useful in the analysis and making interpretation of findings problematic.

40 ■ A Secondary Analysis of retention Across the PMTCT Cascade in Selected Countries
conclusionPotential solutions to these difficulties include improving the patient recording system by reducing the multiple required recording documents to one. Data quality might be improved by integrating patient records and reducing the number of data elements to the most critically important ones. Electronic patient records have the potential to facilitate this process. However, the cost and logistics of implementing this in every site would be very challenging. At a minimum however, a surveillance system in selected sites on a district or regional basis to include the district or referral hospital could be implementable. There would still be, however, the challenge of the unique identification of each mother-baby pair and tracking and tracing of mothers from ANC to labor and delivery and into the PNC period. Many women choose or are referred to secondary level facilities such as district hospitals for their delivery. They thus need to be tracked and traced there, which may be difficult as women come from various ANC facilities and their ANC and PMTCT numbers may not be unique. This is because these numbers are allocated by each ANC facility independently. This situation is compounded in places where many women have the same surname and even the same first name, or even change their surname by that time, making tracking and tracing very difficult. Clearly there is a need for developing a national unique identification system, which would be a combination of the ANC/PMTCT number, facility number, date and women’s age. In countries with national registration numbers, consideration could be given to utilizing this system, though not every woman necessarily has a number.

rwanda, Malawi, Kenya, and Swaziland ■ 41
references
Cataldo, F. et al. 2013. “Exploring women and health care workers’ experience in the context of PMTCT Option B+ in Malawi,” presented at 17th International Conference on AIDS and STIs in Africa, Cape Town, abstract ADSO69.
Central Statistical Office/Macro International Inc. 2008. Swaziland Demographic and Health Survey 2006–7. Mbabane, Swaziland and Calverton, Maryland, USA: Central Statistical Office/Macro International Inc.
Coulborn, RM et al. 2013. “Preliminary findings of a routine PMTCT Option B+ programme in a rural district in Malawi,” presentation at the International AIDS Conference, Kuala Lumpur, Malaysia, 30 June–3 July.
EGPAF. 2011. “EGPAF Program Review 2011.” Washington, DC: EGPAF.
Fatti, G. et al. 2011. “The effect of patient load on anti-retroviral therapy programmatic outcomes in primary health care facilities in South Africa,” J Acquir Immune Defic Syndr 58(1): e17–e18.
Ferguson, L. et al. 2012. “Prevention of mother-to-child transmission of HIV: assessing the accuracy of routinely collected data on maternal antiretroviral prophylaxis coverage in Kenya,” Sex Trans Infect 88: 120–124.
Government of Malawi, Ministry of Health. 2013a. “HIV services quality improvement report, 2013, quarter 3.” Lilongwe: Government of Malawi.
Government of Malawi, Ministry of Health. 2013b. “Integrated HIV program report, July–September 2013.” Lilongwe: Government of Malawi.
McNairy et al. 2013. “Retention of HIV-infected children on antiretroviral treatment in HIV care and treatment programs in Kenya, Mozambique, Rwanda and Tanzania,” J Acquir Immune Defic Syndr 62(3): e70–e81.
Tenthani, L. et al. 2014. “Retention in care under universal antiretroviral therapy for HIV-infected pregnant and breastfeeding women (‘Option B+’) in Malawi,” AIDS 28(4): 589–598.
Muchedzi, A. et al. 2013. “A randomized control trial to evaluate the effect of a community-based peer facilitator intervention in Hurungwe District Zimbabwe,” End of Project Report. Elizabeth Glaser Pediatric AIDS Foundation.
Panditrao, M. et al. 2011. “Socio-demographic factors associated with loss to follow-up of HIV-infected women attending a private sector PMTCT program in Maharashtra, India,” AIDS Care 23(5): 593–600. doi: 10.1080/09540121.2010.516348.
Republic of Rwanda, Ministry of Health. 2012.
42 ■ A Secondary Analysis of retention Across the PMTCT Cascade in Selected Countries
Thomson, K. A., E. O. Cheti, and T. Reid. 2011. “Implementation and outcomes of an active defaulter tracing system for HIV, prevention of mother to child transmission of HIV (PMTCT), and TB patients in Kibera, Nairobi, Kenya,” Trans R Soc Trop Med Hyg. 105(6): 320–326. doi: 10.1016/j.trstmh.2011.02.011.
Tweya, H. et al. 2010. “Early active follow-up of patients on antiretroviral therapy (ART) who are lost to follow-up: the “Back-to-Care” project in Lilongwe, Malawi,” Trop Med Int Health 15(Suppl 1): 82–89. doi: 10.1111/j.1365-3156.2010.02509.x.
UNAIDS. 2013. “Global report: UNAIDS report on the global AIDS epidemic 2013.” Geneva: UNAIDS. http://www.unaids.org/en/media/unaids/contentassets/documents/epidemiology/2013/gr2013/UNAIDS_Global_Report_2013_en.pdf Accessed May 12, 2014.
UNAIDS. 2012. Joint United Nations Programme on HIV/AIDS (UNAIDS). “Together we will end AIDS.” Geneva: UNAIDS.
UNAIDS. 2011. “UNAIDS: Countdown to zero. Global plan towards the elimination of new HIV infections among children by 2015 and keeping their mothers alive.” Geneva: UNAIDS. http://www.unaids.org/en/media/unaids/contentassets/documents/unaidspublication/2011/20110609_JC2137_Global-Plan-Elimination-HIV-Children_en.pdf. Accessed February 28, 2012.
WHO. 2012. “Programmatic update: Use of antiretroviral drugs for treating pregnant women and preventing HIV infection in infants,” Executive summary. Geneva: WHO.
WHO. 2010. “Towards universal access. Scaling up priority HIV/AIDS interventions in the health sector. Progress Report 2010.” Geneva: WHO. http://www.who.int/hiv/pub/2010progressreport/full_report_en.pdf. Accessed February 27, 2012.


u.s. Agency for international development1300 Pennsylvania Avenue, NW
Washington, DC 20523Tel: (202) 712-0000fax: (202) 216-3524
www.usaid.gov