a scientific look at the design of aesthetically and ... · aesthetically and emotionally engaging...
TRANSCRIPT

A Scientific Look at the Design of Aesthetically and Emotionally Engaging Interactive Entertainment Experiences
Magy Seif El-Nasr Simon Fraser University, Canada Jacquelyn Ford Morie University of Southern California, USA Anders Drachen IT University, Copenhagen ABSTRACT The interactive entertainment industry has become a multi-billion dollar industry with revenues overcoming those of the movie industry (ESA, 2009). Beyond the demand for high fidelity graphics or stylized imagery, participants in these environments have come to expect certain aesthetic and artistic qualities that engage them at a very deep emotional level. These qualities pertain to the visual aesthetic, dramatic structure, pacing, and sensory systems embedded within the experience. All these qualities are carefully crafted by the creator of the interactive experience to evoke affect. In this book chapter, we will attempt to discuss the design techniques developed by artists to craft such emotionally engaging experiences. In addition, we take a scientific approach whereby we discuss case studies of the use of these design techniques and experiments that attempt to validate their use in stimulating emotions.
INTRODUCTION Virtual 3D environments can be developed to evoke emotions similar to what people feel within their everyday lives. For example, in the 1960s Eleanor Gibson conducted a perceptual study known as the visual cliff experiment (E. J. Gibson & Walk, 1960). She developed an environment with surfaces of two different heights: a raised surface next to one positioned a few feet below it. A black and white checkered cloth was then draped over the two surfaces. Then, a large sheet of heavy clear plastic was placed atop the entire setup ensuring the top surface was physically level and continuous, yet, the surfaces below the plastic created the perception that the floor dropped sharply. Babies who learned to crawl (typically from six months on) were placed on one side of this setup and were called by their mothers who were on the opposite side. The babies showed no hesitation as they set out across the shallow side, but when they reached the ‘drop,’ they showed emotional stress even though they could feel with their hands that the plastic surface was continuous. The act of crawling presumably gave them enough visual knowledge of how physical space works that they would not crawl over the illusive drop.
Fred Brooks and colleagues at the University of North Carolina (Meehan, Insko, Whitton, & Brooks, 2002) replicated a similar setup within a virtual environment. With 3D modeling tools they constructed a sunken room surrounded by a ledge that was experienced with a stereo head mounted display. The stereo view reinforced the illusion that the sunken room was located about ten feet below the participant’s position. The visitor was instructed to drop a ball onto a target within the pit room and to do this he or she had to walk to and lean over the edge of the ledge. There was a small section of molding on the floor that

2
the feet touched, which served to provide physical corroboration that there was a real ledge in the virtual space. Even seasoned VR veterans had difficulty over-coming the feeling that the pit was real. One of our co-authors experienced this space. She described a visceral gut reaction to being on the edge and looking down. Physiological signals collected from the participants during the experiment showed that the virtual cliff provoked the same physiological responses as the traditional visual cliff or a corresponding real space.
In addition to stimulating emotions such as fear of heights, virtual environments can also be developed and designed to evoke a myriad of emotions and affect. In order to discuss these, we first introduce the concept of emotional affordances. In the late 1970s, perceptual scientist J. J. Gibson (J. J. Gibson, 1979) outlined a concept wherein elements in an environment are considered in the possibilities for actions they provide. He termed such possibilities affordances. Gibson’s work led him to develop a theory of ecological psychology, in which behavior is mediated by the affordances present. While Gibson’s work focuses on concrete perceptual possibilities for action, we use an expanded definition, called emotional affordances, that includes a wide range of affective elements that could provide opportunities for emotional reaction (Morie et al. 2005). The addition of affective elements requires a broader definition of perception. Perception is usually thought of as conscious reactions to stimuli. The affordances we use can, and often does, fall below the levels of conscious perception. Such subconscious stimuli still afford mental and physical reactions, as intense, sometimes even more so, than reactions from stimuli of which we are aware (as with the visual cliff (E. J. Gibson & Walk, 1960)) (Bornstein, 1992). Gibson’s affordances are extrinsic; they allow for external behavior (physical actions or reactions). Emotional affordances are intrinsic; they allow for internal actions or reactions. If a perceptual affordance is a perceptual cue to the function of an object that causes an action, then an emotional affordance is a sensory cue to the function of a stimulus that causes an emotional reaction.
Emotional affordances must be designed to seem natural to the situation. They can serve various purposes beyond eliciting emotions, including subtly guiding the participant along a desired path through the virtual environment (J. Morie et al., 2003). Clive Fencott (Fencott, 1999) describes affordances for virtual environments in terms of three basic perceptual opportunities—sureties, shocks and surprises. He further breaks down these opportunities into attractors, connectors, and retainers. Fencott’s work was the first to include both perceptual and emotional affordances. These affordances can be viewed as a continuum to illustrate the complementary and overlapping domains of perception and emotion. All affordances are user contingent; in an interactive game environment, they are essentially triggers that result in an action (physical response) or a reaction (emotional response) from the participant. This affordance continuum – from perceptual actions to emotional reactions – is illustrated in Figure 1.
< figure 1 placed here >
Artists and designers have mastered the skill of developing virtual environments with such emotional affordances – environments that engage the participants in a deep emotional level and evoke emotions, such as fear, empathy, and others. In fact, if one takes a virtual roller coaster ride at Universal Studio, one would feel similar, if not the same, emotions stimulated during that the ride as in a real roller coaster ride. An example of this experience is the Simpson’s virtual roller coaster ride, which was experienced by one of the co-authors and described as a successfully designed ride that elicited many of the same emotions as a real roller coaster ride and has, in fact, deceived many participants into thinking they are in a real roller coaster while they didn’t even leave the room.
Developing such an emotionally evocative interactive virtual environment involves a large number of techniques that engage participants at both emotional and cognitive levels. These techniques include, but are not limited to, visual effects, environmental composition, color choices, lighting and design, audio

3
work, character implementation, and effective story. In this chapter, we take a scientific approach to discussing these techniques. While there are many resources where designers discuss design techniques to elicit emotions, these resources are not scientific in nature. They do not set out to prove or evaluate the design techniques used. In this book chapter, we will discuss both a set of successful design techniques for eliciting arousal and measurement methods for validating the arousal level elicited. In addition, we discuss two case studies: one on the use of lighting for eliciting emotions and the other on the use of an amalgam of sensory modalities for stimulating arousal. Both case studies were validated through arousal identification devices and quantitative analysis methods.
Identifying and measuring emotions is an inexact science. There are many approaches discussed in the literature, including self-report measures, or more objectives methods such as the use of biometric or physiological sensory data. There are systems built on new and emerging measurement devices, which are increasingly demanded by companies that need to evaluate their products for their perceived emotional engagement. In this book chapter, we discuss these approaches and devices as well as discuss their validity. In the case studies discussed, we focus on arousal rather than specific complex or simple emotional states due to the lack of validated analysis techniques that can reliably identify emotions at the time we ran our experiments.
Therefore, this chapter provides the reader with the following contributions: (1) an understanding of the myriad emotions and affect that can be elicited within an interactive entertainment product through a discussion of design techniques used by designers and artists and case studies that validate some of these techniques scientifically and (2) a listing and explanation of methods that can be used to identify and measure different types of emotions and arousal, including devices and analysis methods developed.
The chapter proceeds by first discussing and defining emotions and methods for identifying them. We then discuss the two case studies discussing the design details and methods to evoke emotions and methods to measure the elicited emotional reactions.
DEFINING AND IDENTIFYING EMOTIONS Emotions work through neuro-chemical transmitters, which influence areas of the brain, successively guiding behavior and modifying how information is perceived and decisions are made (Norman, 2004). There is, however, an ongoing debate about how emotions can be defined, represented and measured, with empirically based studies only recently beginning to converge towards a consensus.
As there seems to be no empirical solution to the debate on which component is sufficient or necessary to define emotions, at present the most favored solutions is to say that emotions are best treated as a multifaceted phenomenon consisting of the following components: behavioral reactions (e.g. approaching), expressive reactions (e.g. smiling), physiological reactions (e.g. heart pounding), and subjective feelings (e.g. feeling amused). Each instrument that is claimed to measure emotions in fact measures one of these components. As a consequence, both the number of reported instruments and the diversity in approaches to measure emotions is abundant. Today’s instruments range from simple pen-and-paper rating scales to dazzling high-tech equipment that measures brain waves or eye movements. (Desmet, 2003).
Emotions and arousal form a vital component of the experience of interacting with interactive entertainment, motivating the cognitive decisions made during gameplay (Holson, 2004, April 10; Ravaja & Kivikangas, 2008; Ravaja, Saari, Salminen, Laarni, & Kallinen, 2006). Emotions are important to understanding and predicting user behavior and also in determining the quality of the user experience within interactive entertainment applications such as digital games. Because of this, during the last decade there has been an increase in the amount of research dedicated to the assessment of emotional responses during interactions with digital applications. In the wider human-computer interface community, emotion

4
and affect assessment is a growing research domain under the wider context of user experience research, focusing on improving interaction quality by bringing it closer to human-to-human communication. This development mirrors the continuing rapid expansion of interactive entertainment applications from a marginal leisure activity to a direct competitor of traditional forms, such as movies, books, sports and music, e.g., (Grodal, 2000; L. E. Nacke, 2009).
The assessment of emotion in the context of digital interactive entertainment is generally focused on the individual user experience, and generally oriented towards assessment during the period of interaction, although it is recognized that other factors, such as prior experiences, can impact the user’s experience (L. E. Nacke, 2009). Emotions can be expressed via several channels, such as voice, speech, facial responses and physiological responses. Various features can be analyzed to assess the emotional state of a participant; using a variety of techniques both subjective and objective. Psycho-physiological measures and qualitative methods such as interviews, self-reporting, observational analysis and behavioral analysis, are the most common. The latter subjective and qualitative methods are notably used when the usage of time- and resource-consuming psycho-physiological measures such as fMRI, EEG and EMG are not possible (Drachen, Canossa, & Yannakakis, 2009; Isbister & Schaffer, 2008; Pagulayan, Keeker, Wixon, Romero, & Fuller, 2003). In general, there is a lack of non-cumbersome, real-time tools for measuring arousal and other emotions during interaction periods. Psycho-physiological measures with established validity can provide real-time assessments, and have been used in research or medical contexts. However, these often require specialized equipment and laboratory environments. In addition, the expenditures of time and resources needed for industry-based evaluation are major roadblocks inhibiting successful evaluations of digital entertainment applications. This is true for both evaluating individual emotional components of the user experience as well as modeling and assessing user cognition and emotions during the interaction period. Recent innovations, however, led to several companies producing simplified mobile equipment for in game user-experience interaction experience assessment, usable in real-life settings, e.g. Emotive, OCZNia and EmSense. It remains an open question whether this type of technology can be suitably validated to be able to serve as the basis of scientific studies as well as those of simpler industry-based consumer research. That being said, there currently exists a wide range of more sophisticated testing methods for evaluating emotion and affect. In this section, we will briefly review these approaches. A more in-depth review is beyond the scope of this book chapter, and readers are referred to individual articles for more details. Dimensional models of continuous emotion Paralleling the work on developing methods for measuring emotion, models and theories for identifying and classifying emotions was also being developed. Wundt (1896) was one of the earliest psychologists to use classification as a means of grouping feelings. In this case a three-dimensional model containing three fundamental axes: Pleasure-displeasure, arousal-composure and tension-resolution. This was one of the earliest examples of dimensional theories of emotion, which hypothesized that all emotions can be located in a dimensional space defined by orthogonal axes (usually 2D or 3D, up to n-dimensional). Emotions were not considered as discrete phenomena, but rather continuous.
One of the most influential dimensional models – the circumplex model - in emotion assessment was developed by Russel (1980 and 2003). In this model, emotions are divided along two axis formed by valence (negative to positive) and arousal/bodily activation (low-high). Emotional categories defined by everyday language such as joy, depression and anger can be located within the dimensional space, correlating with specific ratios of valence and arousal. There have been several adaptations of the model (e.g. Watson & Tellegen, 1985; Posner et al., 2005). Additionally, Cowie (2000, 2001) used a valence/activation model, similar to the valence/arousal space, to model and evaluate emotions based on speech. Although dimensional spaces do not provide direct verbal description, it is possible to map points or areas which can be labeled categorically according to the specific emotion. These dimensional models are the de facto standard in psycho-physiological research, contrasted by theories of basic emotions (Nacke, 2009).

5
Psycho-Physiological Player Testing Psycho-physiological measures are controlled measures of emotion, generally utilized in a laboratory environment. They are used by e.g. psychologists and HCI-experts to identify emotions; and are used widely in Human Factors for studying mental effort and stress (Wilson, 2001).
Psycho-physiological signals can be divided into those originating from the peripheral nervous system, such as heart rate and galvanic skin response, and those originating from the central nervous system, such as brain waves, measured e.g. via ElectroEnchephaloGrams (EEG). The actual meaning of psycho-physiological measures and data is dependent on the context and research approach (Ravaja, 2004), and thus, the interpretation of these measures in the context of digital interactive entertainment requires more study and validation before consistent results can be ensured.
There are two overall ways of conducting psycho-physiological testing: Tonic testing or phasic testing (Nacke, 2009; Lim et al., 1997; O’Donnel, Creamer, Elliot, & Bryant, 2007). In tonic testing, the technology is used to accumulate psycho-physiological data over a specific time period (i.e. averaged across the time period). In phasic measurement, a higher resolution view of the data is allowed, e.g. automated scoring of events.
Experience using psycho-physiological research suggests that it is possible to quantitatively measure some emotional states using these measures, which, thus, permits one to invasively or covertly assess physical reactions of users. Different types of psycho-physiological measures operate differently and are not independently reliable indicators of even well-characterized feelings. Therefore, these methods are usually applied in tandem, or at least cross-correlated across empirical studies, to increase the reliability of measurements. This process is important to identify which patterns of physiological responses reflect which emotional responses. Importantly, the many-to-one relation between psychological processing and physiological responses (Oatley, Keltner, & Jenkins, 2006) allow for specific psycho-physiological measures to be linked with difference psychological effects, e.g. cognition or emotion. Therefore, attention has been given to the correlation of patterns of physiological measurement with subjective characterizations of emotion (Cacioppo, Tassinary, & Berntson, 2007; L. Nacke, Lindley, & Stellmach, 2008).
There is, however, an increasing body of evidence supporting these approaches. For example, Ravaja et al. (2006) reported that tonic measures of facial EMG and EDA have been shown to be associated with positive and negative affect responses or arousal during interaction (playing) with digital games.
The key psycho-physiological measurement techniques used in emotional assessment and affective computing include cardiovascular measures, EMG, fMRI, EEG, EDA, and respiratory measures. Cardiovascular Measures: The cardiovascular system includes the organs regulating blood flow in the body and offers a variety of measuring options to determine valence or arousal (Oatley et al., 2006), including: heart rate (HR), which is known to correlate with arousal (Anttonen & Surakka, 2005). Additional differentiation is possible with finger temperature. Blood Volume Pressure (BVP) has been used to show a correlation between greater dilation in the blood vessels and decreasing arousal (Ward & Marsden, 2003). Heart Rate Variability (HRV) is the interval between consecutive heartbeats. The variability of the heart rate, which can be determined from an ElectroCardioGram (ECG), occurs due to the synergistic action of the two branches of the autonomous nervous system. This strives towards a balance via neural, mechanical, hormonal and other physiological mechanisms to maintain cardiovascular parameters in the optimal ranges, to facilitate optimal reaction to changing conditions externally and internally. HRV is generally used as a metric for assessing the positive and negative valence of experiences (Anttonen & Surakka, 2005), and as an indicator of mental workload (Rowe, Sibert, & Irwin, 1998). For example, Rani et al. (Rani, Sims, Brackin, & Sarkar, 2002) correlated HRV with stress, finding that HRV is low under stress, and high during relaxation. Additionally as shown by Rowe et al. (1998), HRV decreases with mental effort. The
6
normalized HRV correlates with subjective ratings of effort, but not with task difficulty (using a normalized HRV).
Finally, HR, HRV and Respiratory Sinus Arrhythmia (RSA) (Gentzler et al., 2009) can be computed from measuring the electrical activity of the heart (ECG). And ECG is externally recorded using skin electrodes and is non-invasive, normally translating the electrical activity into line tracings (Mandryk, Atkins, & Inkpen, 2006).
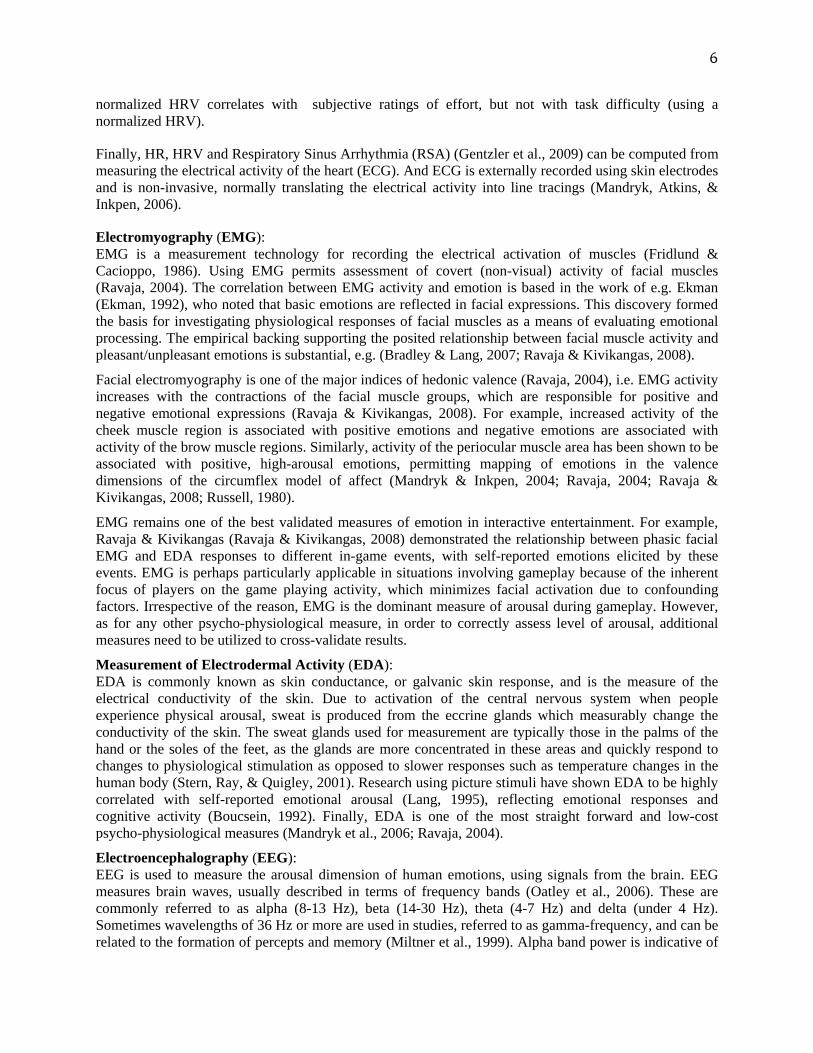
Electromyography (EMG): EMG is a measurement technology for recording the electrical activation of muscles (Fridlund & Cacioppo, 1986). Using EMG permits assessment of covert (non-visual) activity of facial muscles (Ravaja, 2004). The correlation between EMG activity and emotion is based in the work of e.g. Ekman (Ekman, 1992), who noted that basic emotions are reflected in facial expressions. This discovery formed the basis for investigating physiological responses of facial muscles as a means of evaluating emotional processing. The empirical backing supporting the posited relationship between facial muscle activity and pleasant/unpleasant emotions is substantial, e.g. (Bradley & Lang, 2007; Ravaja & Kivikangas, 2008).
Facial electromyography is one of the major indices of hedonic valence (Ravaja, 2004), i.e. EMG activity increases with the contractions of the facial muscle groups, which are responsible for positive and negative emotional expressions (Ravaja & Kivikangas, 2008). For example, increased activity of the cheek muscle region is associated with positive emotions and negative emotions are associated with activity of the brow muscle regions. Similarly, activity of the periocular muscle area has been shown to be associated with positive, high-arousal emotions, permitting mapping of emotions in the valence dimensions of the circumflex model of affect (Mandryk & Inkpen, 2004; Ravaja, 2004; Ravaja & Kivikangas, 2008; Russell, 1980).
EMG remains one of the best validated measures of emotion in interactive entertainment. For example, Ravaja & Kivikangas (Ravaja & Kivikangas, 2008) demonstrated the relationship between phasic facial EMG and EDA responses to different in-game events, with self-reported emotions elicited by these events. EMG is perhaps particularly applicable in situations involving gameplay because of the inherent focus of players on the game playing activity, which minimizes facial activation due to confounding factors. Irrespective of the reason, EMG is the dominant measure of arousal during gameplay. However, as for any other psycho-physiological measure, in order to correctly assess level of arousal, additional measures need to be utilized to cross-validate results.
Measurement of Electrodermal Activity (EDA): EDA is commonly known as skin conductance, or galvanic skin response, and is the measure of the electrical conductivity of the skin. Due to activation of the central nervous system when people experience physical arousal, sweat is produced from the eccrine glands which measurably change the conductivity of the skin. The sweat glands used for measurement are typically those in the palms of the hand or the soles of the feet, as the glands are more concentrated in these areas and quickly respond to changes to physiological stimulation as opposed to slower responses such as temperature changes in the human body (Stern, Ray, & Quigley, 2001). Research using picture stimuli have shown EDA to be highly correlated with self-reported emotional arousal (Lang, 1995), reflecting emotional responses and cognitive activity (Boucsein, 1992). Finally, EDA is one of the most straight forward and low-cost psycho-physiological measures (Mandryk et al., 2006; Ravaja, 2004).
Electroencephalography (EEG): EEG is used to measure the arousal dimension of human emotions, using signals from the brain. EEG measures brain waves, usually described in terms of frequency bands (Oatley et al., 2006). These are commonly referred to as alpha (8-13 Hz), beta (14-30 Hz), theta (4-7 Hz) and delta (under 4 Hz). Sometimes wavelengths of 36 Hz or more are used in studies, referred to as gamma-frequency, and can be related to the formation of percepts and memory (Miltner et al., 1999). Alpha band power is indicative of

7
a relaxed stage, where there is limited arousal and cognitive load, and little attentional demand, i.e. permits evaluation of the state of arousal (Pfurtscheller, Zalaudek, & Neuper, 1998; Ray & Cole, 1985). Beta activity relates to a state of attention and alertness, associated with cognitive and information processing (Ray & Cole, 1985). Theta activity appears to be connected with creative processes, intuition, emotions and sensations (Aftanas & Golocheikine, 2001). Delta waves are prominent during deep sleep and can according to Cacioppo et al. (Cacioppo et al., 2007), be associated with unconscious processes. Thanks to the relationship between psychological processing and physiological responses, these measures of brain activity can be linked to psychological structures such as attention, cognitive demand, and arousal. A primary challenge of EEG measurement is that the mechanisms and timing of temporal synchronization of brain activity with exact emotional responses are as yet not well known (Sander, Grandjean, & Scherer, 2005).
EEG is in practice measured as the voltage recorded between two electrodes on the scalp. In order to acquire a signal, EEG requires the users to wear scalp electrodes (usually positioned on a headcap), and can therefore feel intrusive; however, experience indicates that users quickly forget that the electrodes are present during gameplay (L. Nacke et al., 2008).
Functional Magnetic Resonance Imaging (fMRI), Positron Emission Tomography (PET) and Functional Near-infrared Spectroscopy (fNIR):
Functional imaging is generally conducted in order to understand the activity of a given brain region in its relationship to a particular behavior state, or its interaction with inputs from the activity of another region of the brain. fMRI and PET are limited in their practical application because of the size and cost of the equipment as well as requirements on shielding, and a predilection to motion artifacts, making them difficult to utilize in studies focusing on real-time active gameplay. PET scans also require participants to ingest a radioactive tracer in the case of PET. A few studies have emerged using fMRI, e.g. (Mathiak & Weber, 2006), who used fMRI toward brain correlates of natural behavior during video game play. An advantage of fMRI is that the technique provides a better spatial resolution than e.g. EEG, which may make it useful for detecting complex emotions.
Introduced during the last decade, the fNIR technique has gained attention in HCI research because it is portable and more affordable than fMRI (Hirshfield et al., 2009). This method is used to evaluate which regions of the brain that are activated, and functions via the application of near-infrared light (specific wavelengths within the optical window) to find the ratio of oxygenated and deoxygenated hemoglobin in the blood flow of the brain. The method is, therefore, useful for studying the hemodynamic changes due to cognitive and emotional brain activity. Unlike, fMRI, which can detect activity through the brain, fNIR penetrates a shorter distance into the skull, yet it can be used in a similar capacity to EEG. fNIR studies of emotion and cognition have focused on specific areas of the brain (Broadman’s areas), showing that specific regions play a critical role in sustained attention, problem solving etc. (Cabeza & Nyberg, 2000). The technology is still new and immature. However, its advantages over fMRI and PET give it future potential for emotion studies during active gameplay.
Unlike the simpler psychophysiological techniques, fMRI, PET, fNIR, EEG and EMG requires the participants to be attached to bulky equipment, and it is therefore not suitable for long-term studies, unlike e.g. HR which can be examined over extended time periods as sensors can be integrated into wearable devices such as watches. Most equipment for EDA measures provides wearable sensors, but not complete participant mobility.
Eye Tracking: Eye tracking is based on measuring the fixations (dwell times) and saccades (fast movements) of human gazes (Duchowski, 2007). Eye tracking is used for inferring cognitive processes arising from the relationship between eye fixations and attentional focus (Sennersten, 2008). This measure is particularly applicable for the exploration of virtual environments. Combined with other measures, this may give a

8
means of factoring out those EMG signals, for example, that may indicate facial muscle movement due to cognitive processes and not emotions.
In summary, table 1 shows the different measures, affect (arousal/valance/emotions) that they can measure as well as the applicability of the device.
< table 1 here>
Qualitative Measures Semi-quantitative and qualitative approaches, such as subjective self-reports through surveys, interviews and think-aloud protocols, traditionally form the basis for user-feedback gathering and evaluation of digital interactive entertainment, combined with objective analysis via observational video analysis increasingly coupled with psycho-physiological measures (L. E. Nacke, 2009). Surveys developed to evaluate emotions in digital interactive entertainment have generally focused on the enjoyment-aspects of user experience; however, recent developments have included dimensions such as tension, frustration or negative affect (IJsselsteijn, Poels, & de Kort, 2008; Poels, Kort, & IJsselsteijn, 2007). Using surveys during natural breaks in the gameplay action is usually the preferred method of deployment (Kim et al., 2008). Self-reported emotions have been successfully correlated with psycho-physiological measures, e.g. (Merkx, Truong, & Neerincx, 2007; L. Nacke et al., 2008; Ravaja & Kivikangas, 2008).
Subjective reporting via surveys, interviews and focus groups are – depending on the openness and closedness of the questions being asked – generalizable, convenient, uncomplicated to administer, providing data that can be statistically treated. There are substantial drawbacks, however. First of all, surveys are hard to develop in a manner that ensures unbiased results. Also, respondents may not all clearly understand the questions (Kuniavsky, 2003). Furthermore, surveys are not conducive to locate complex patterns, and respondent data may not correspond to the actual experience of interacting with an application, for example due to a bias caused by time (Marshall & Rossman, 1999). Additionally, respondents may not be trustworthy, consciously or unconsciously biasing their replies to e.g. make themselves look better than they are; or may try to answer what they think the researcher wants to hear rather than what they actually feel/experience. Finally, people being interviewed may be biased, because they are aware they are being recorded. In essence, subjective self-report data are cognitively mediated, and may not reflect what is actually occurring (Kuniavsky, 2003).
Think-aloud techniques, on the other hand, provide a popular technique in the evaluation of productivity applications. However, they are progressively harder to utilize in conjunction with digital interactive entertainment applications because they disturb the user, thus impacting on immersion/engagement. This has not prevented the method from being employed for usability evaluation of games (Medlock, Wixon, Terrano, Romero, & Fulton, 2002; Pagulayan et al., 2003). Observations and analysis of nonverbal behavior Taking video recordings of users interacting with computers is one of the oldest practices in HCI. The data include using video to code gestures, body language as well as verbal language. Data are analyzed using methods, such as protocol analysis (verbal or non-verbal), cognitive task analysis and discourse analysis, or coding of user actions (Drachen & Heide-Smith, 2008; Fisher & Sanderson, 1996). The major drawback of such approach is the time commitment required for coding of gestures, verbal communication, body language as indicators of user experience and emotion. This coding process also places substantial emphasis on the skill of the researcher in coding the data correctly. Personal bias and

9
inter-rater reliability are typical problems that need addressing. The time commitment is substantial, with the analysis of the recorded material taking up to 100 times the period of time actually recorded (Fisher & Sanderson, 1996). The issues and challenges related to objective analysis of observational data has been a major factor in the popularity of self-report, subjective data in the study of user-computer interaction. Current work on automated coding and logging of user-initiated events in virtual environments may assist in bridging the gap between self-report and objective data (Drachen et al., 2009; Kim et al., 2008).
While there are many methods that have been explored in previous work for measuring emotions and affect, there are pros and cons to each one. In the case studies we outline in this chapter, we decided to use more objective methods, and thus we chose physiological sensors. Due to this decision, our studies only discuss arousal rather than simple or complex emotions. Thus, we will only show how the design methods discussed in section 3 were used to stimulate arousal. In the future, we would like to address the measurement of simple and complex emotions and valence as part of our studies.
TECHNIQUES TO ELICIT EMOTIONS Developing a successful experience will depend on devising several patterns that evoke specific affective states from participants. This process is more of an art than a science. Designers, cinematographers, dramateurs, and directors use an amalgam of techniques and tricks to evoke emotions and deliver and emotionally effective experience. These techniques range from narrative-based techniques to cinematographic or visual patterns.
In his book, The Visual Story, Bruce Block (Block, 2001) discusses many techniques that rely on the use of color features, such as contrast and affinity of color in terms of its warmth or coolness, saturation, and brightness. He discusses how cinematographers can, through carefully changing these properties in time, increase or decrease arousal. In addition, film theory documents the use of several color-based techniques to increase dramatic tension and evoke emotional responses from the audience (Birn, 2000; Block, 2001; Calahan, 1996; Thomas & Johnston, 1981; Thompson, 2001). For example, the use of high contrast scenes, as seen in Film Noir movies, was used to increase tension and arousal. These techniques are quite similarly used within visual interactive environments. For example, one can see the interplay between contrast and color within Bioshock (2K Games, 2007) and Assassin’s Creed (Ubisoft, 2007).
Within an interactive experience, the plot structure, characters, and pacing also play an important role in evoking and sustaining emotions in the immersed players. Writer and game expert David Freeman (Freeman, 2003) discusses different narrative and writing techniques – developing plot and character – as a way of enhancing participants’ emotional experience within interactive entertainment products.
In this section we will give examples of artistic design and narrative techniques used in eliciting emotions within entertainment experiences, most, if not all, work within interactive products as well. Visual aesthetics and design, narrative, environment design, reward systems, identification with the character, use of symbols, agency, engagement and fun, are all tools used to elicit and intensify the dramatic experience. A discussion of all of these techniques is beyond the scope of this chapter, but we cover examples of many basic methods here.
Color and lighting

10
As outlined in many film books, movies use several color and lighting techniques to create a desired effect based on the director’s style (Birn, 2000; Block, 2001; Brown, 1996; Calahan, 1996; Crowther, 1989; Gillette, 1998; Knopf, 1979; Knoph, 1979; Thompson, 2001). In this section, we will discuss several color patterns that we formulated based on a qualitative study of over thirty movies, including The Cook, The Thief, His Wife and Her Lover (1989), Equilibrium (2002), Shakespeare in Love (1998), Citizen Kane (1941), and The Matrix (1999). According to our study, the techniques used can be divided into shot-based color techniques: color techniques used in one shot, and scene-based color techniques: techniques used on a sequence of shots.
An example shot-based color technique is the use of high brightness contrast in one shot. High brightness contrast denotes high difference between brightness in one or two areas in the scene and the rest of the scene. This effect is not new; it was used in paintings during the Baroque era and was termed Chiaroscuro— an Italian word meaning light and dark. This kind of composition has also been used in many movies to increase arousal. Perhaps the most well known examples of movies that use this kind of effect are film noir movies, e.g. Citizen Kane (1941), The Shanghai Gesture (1941), This Gun For Hire (1942). Another variation on this technique is contrast between warm and cool colors, which can be seen in many Color Noir movies. These kinds of patterns are usually used in peak moments in an experience, such as a turning point. Lower contrast compositions usually precede these heightened shots, thus developing another form of contrast, contrast between shots.
In addition to color and brightness contrast, filmmakers have also used affinity of color to elicit emotional responses (Birn, 2000; Block, 2001; Brown, 1996; Calahan, 1996; Crowther, 1989; Gillette, 1998; Knopf, 1979; Thompson, 2001). Movies, such as The Cook, The Thief, His Wife, and Her Lover shown in figure 2, sustain an affinity of highly saturated warm colors for a period of time. The temporal factor is key to the effect of this approach; this is due to the nature of the eye. The eye tries to balance the projected color to achieve white color. Hence, when projected with red color, the eye tries to compensate the red with cyan to achieve white color. This causes eye fatigue, which in turn affects participant’s stress level, thus affecting arousal. This technique can also be seen in games, such as Devil May Cry.
< figure 2 here >
In contrast, designers have used de-saturated colors to project low energy scenes, thus decreasing arousal. For example, Equilibrium (2002) and The English Patient (1996) both use low saturation cool colors, as shown by the screenshots in figure 3, to increase detachment and decrease arousal.
< figures 3-1 3-2 here >
Of course the perception of contrast, saturation, and warmth of color of any shot within a continuous movie depends on colors used in the preceding shots. Several movies used contrast between shots to evoke emotions (Alton, 1995; Block, 2001). For instance, filmmakers have used warm saturated colors in one shot then cool saturated colors in the other, thus forming a warm/cool contrast between shots to affect arousal (in this case decrease arousal). By graphically analyzing the movie, The Cook, The Thief, His Wife, and Her Lover, we can visualize these techniques. Figure 4 shows the starting frame and the ending frame for the first section of the movie. We can then graphically plot the frequency of pixels against color properties (saturation, warmth, and brightness) over the individual frames making up this section of the movie.

11
< figures 4-1 4-2 here >
Figure 5-a illustrates color dropping from high saturation to low saturation as time progresses. As shown the drop is significant (more than 40% of the saturation value), which shows a high saturation contrast between shots. Similarly, figures 5-b and 5-c show brightness contrast (shift from low brightness color to high brightness), and warmth contrast (shift from high warmth to low warmth) over time. This sequence tends to decrease arousal. While moving from less saturated to more saturated or cool to warm or bright to dark, seems to escalate arousal. After reviewing other movies, we deduced that the change of contrast over time should affect arousal linearly.
< figures 5-1, 5-2, 5-3 here>
Thus, there are established patterns that designers use to manipulate color and lighting to stimulate emotions. These patterns constitute the use of contrast and affinity of colors within one shot or through a series of shots. These patterns can be seen in many movies and interactive experiences, including games, virtual rides, etc. One of the case studies discussed below will further evaluate these patterns and explore if arousal was stimulated through contrast and affinity through time.
Environment Design Environment design is another element that designers extensively use to layout the space and emotional experience for their participants. Through the placements of objects, shape and materials of the space, and environmental lighting, designers can create rich atmospheres that elicit desired emotional responses. Architects, for example, often increase the amount of light coming into a space or a building (through windows or skylights), or extend the height of a ceiling (through vaults) to establish a sense of openness, airiness and expansive space (Fitchen, 1961; Millet, 1996). Elements within an environment are also selected and placed to evoke specific responses, whether those objects and furnishings are of a medieval castle or a 1960s modern dining room. The chosen elements evoke certain associations and feelings, based in part, on our knowledge and previous experiences with those items. While people’s experience are widely varied, it is safe to assume that a Victorian parlor replete with knick-knacks, ornaments, beaded cushions and flowery fabrics will have a very different impact on a person than the frugal elegance of a Zen garden.
Narrative There are numerous theories and techniques published on narrative and its influence on emotions within different media. Experiments on using film to induce emotions have found that there are certain emotions that can be evoked through films. For example, Gross and Levenson found that they can successfully elicit amusement, disgust, and sadness, but it was harder to elicit anger, contentment, and fear. They found that contentment films elicit high degree of happiness, while anger films elicit other emotions like disgust, and fear films elicit tension and interest (Gross and Levenson, 1995). Thus, there is no question that films can elicit emotions and affect. However, the question is how filmmakers, and consequently game and interactive narrative designers, can make use of these theories and techniques to embed emotions in their designs.
In this section, we describe tacit knowledge collected through years of training in acting, directing, screenwriting, and animation, particularly, Joseph Campbell’s (J. Campbell, 1972) and Propp’s (Propp, Wagner, & Scott, 1968) work on storytelling, and Boal’s on acting theories (Boal, 1979, 2002).
Plot Structure and Magnitude

12
Aristotle defined quality of plot using five basic principles: completeness, magnitude, unity, structure, and universality (Aristotle, 1967). He defined the structure of a plot as the order of events in time, where each event constitutes an important part of the plot, and which, if removed cause the plot to lose its meaning. He also identified several plot components, including events leading to astonishment, recognition, reversal (twist), or suffering. In this section we focus on plot structure and magnitude.
The order of events and their dramatic progression in time are important factors affecting plot quality (Baid, 1973). Dramatic tension in a typical film or a play escalates through time until it reaches a peak (the crisis point) after which it is released. The shape of dramatic tension through time can be visualized as an arc, and thus called the Dramatic Arc (Baid, 1973; Styan, 1960). This relationship is non-monotonic, however. As Benedetti describes, a play is composed of scenes and scenes are composed of beats (the word beat here defines the smallest unit of action that has its own complete shape with a goal and an action), each has its own arc with a turning point where tension reaches its maximum point after which it is released (Benedetti, 1994). Therefore, one can imagine the shape of drama as a nonlinear function with many local maxima points representing turning points in beats, but one global maximum point marking the crisis point of the performance. Choosing and ordering events to form this structure define the quality of a plot.
Another factor that is used to evoke emotions is the amount of time spent within each event (such as the pauses), which Aristotle calls Magnitude (Aristotle, 1967). To illustrate this concept consider a scene where a character opens a door leading to an unknown place. One way to animate this scene is to show the character opening the door and walking in. As an alternative way is to show the character as he slowly reaches for the door, gradually opens it and then hesitantly walks in. Slowing the pace of the scene, in this way creates a different dramatic quality to the scene. Therefore, orchestrating the pacing and magnitude of each event is as important to engagement as plot structure. These techniques are already explored in many game narratives. Examples include Prince Persia IV (Ubisoft, 2009), Assassin’s Creed (Ubisoft, 2007).
Ticking Clock:
The concept of the ticking clock has been used as a dramatic device in many productions. Dramatists use dialogue, visual, and audio events to project possible future events. For example, in the movie the Saw (2004) a killer traps two people in a room and gives them until 6:00p to find a way out. The director interjected shots of the ticking clock at various points during the movie to create an anticipation of a death event. This dramatic instrument is very effective at creating anticipation, one form of pleasure (Blythe & Hassenzahl, 2004) as noted earlier. Examples of this instrument can be seen in Nick of Time (1995) and Ninth Gate (1999).
Character Arc:
Boorstin (Boorstin, 1990) describes the vicarious eye with which the audience identifies emotionally with a character and his actions. Freeman defines a method which screenwriters use to illicit this type of engagement, called Character Arc (Freeman, 2003), which is a method of defining character’s growth through time. An example is the birth of the hero as described by Joseph Campbell (D. Campbell, 1999), where a character struggles and reluctantly becomes the hero in the middle or end of the story.
There are more techniques that artists use including the use of audio, infrasound, scent, bio-feedback, and haptics which can not be discussed here due to space limitations.
CASE STUDIES Case Study: Validating the Color and Lighting Techniques

13
To validate the effect of the patterns discussed above on arousal, we conducted several experiments testing each pattern individually within a 3D interactive environment. For this purpose we developed a simple interactive 3D environment. The environment is composed of six rooms where participants are only allowed to navigate through the environment, thus no object manipulation was required.
In this environment all walls and ceilings were designed with white texture to allow maximum control using colored light. In computer graphics, the final color of objects within a 3D scene is calculated by adding light color to the color of the texture. Since we want to control all the colors projected, we decided to use white textures for all textures used in the environment, thus all colors are determined by the light colors. For each room, we strategically placed eight lights to cover all surfaces of the room. We implemented several algorithms that dynamically control the saturation, lightness, warmth, and contrast of these lights depending on the pattern used.
To validate if there was an influence on arousal with time, we monitored participant’s physiological responses using the SenseWear® PRO2 Armband, a wearable body monitor that enables continuous collection of low-level physiological factors. It includes several sensors that continuously gather heat flux, skin temperature, near body temperature, and galvanic skin response data from the body. However, it does not include a heart rate monitor. We used the Triax Elite (shown in Figure 6 (right)) for that purpose. It is composed of a stopwatch and a heart rate monitor strap that displays heart rate, current running pace, and pace target information for interval training. We were able to collect readings from these devices and feed it through MATLAB for further data analysis.
We ran 19 experiments, one experiment for each pattern identified. For each experiment we gathered readings from 20-24 participants. We asked participants to volunteer for more than one experiment if they can. If they signed up for more than one experiment, we asked that when they sign up for times to perform the experiment that experiments should be at least one week apart. We think a one week period is enough time to eliminate bias of prior exposure to one experiment on the results collected in the other experiment. Participants were male graduate and undergraduate students between the ages of 18-30 from the Information Science and Technology, Electrical Engineering, and Computer Science departments of The Pennsylvania State University. Students were recruited from classes taught in Computer Science, Information Sciences and Technology and Electrical Engineering. We specifically targeted male students due to fluctuations on female hormonal state which may affect arousal, and thus interfere with the results.
All nineteen experiments followed the same procedure. In accordance to IRB regulations, before they started the experiment, participants were given consent forms and a brief introduction of the entire experiment. We also asked them to take a color blindness test, to check if they can differentiate between colors. Once they are done with the test, participants were asked to wear the BodyMedia device around their arm and the heart rate device around their chest. They were then asked to navigate within a 3D environment that does not exhibit any of the patterns depicted above. This was done to allow them to relax and get acquainted with the controls and the environment.
After one-two minutes of interacting within this environment, we asked them to navigate through a similar environment, but where we embedded the algorithm recreating one of the patterns discussed above. We simultaneously recorded their physiological measures while they navigated and interacted within the environment. After navigating through the environment the participants were asked to fill out a questionnaire which was used as a self report. This procedure was repeated for all the patterns discussed above. We used a different pool of people for each pattern to alleviate the bias of knowing the environment. The experiments were conducted over a period of three weeks.
The response data from the armband i.e. the EDA, HF and body temperature for each input parameter (i.e. the color pattern of saturation, warmth, lightness and contrast) was recorded. This recorded data from the armband, the heart rate monitor, and the time stamp from which the participant started viewing the environment was matched. The response data was normalized by subtracting the mean of the EDA, Heat Flux and Temperature for each participant from the raw data.

14
Assuming the physiological parameters have a linear response to the color pattern, we used a linear prediction models discussed in more detail in the appendix. This approach can be used to test the hypothesis of whether individual visual parameters affect physiological response variables. If the mean-squared error on a test set is size-ably smaller than the variance of the output sequence for some amount of delay/ latency between the causal inputs and the target output, it indicates that there exists a linear correlation between the two sequences. If it is not then a linear correlation doesn’t exist. Using this method, we can deduce with some confidence that there is a linear relationship between the participants’ arousal and the pattern used.
We ran subjects through 6 environments set up with high saturation with 6 different colors (red, green, yellow, orange, blue, and cyan). The hypothesis is that arousal will increase as a function of time within a high saturated environment. Results shown confirm this result. Specifically, results for the high saturated red environment are depicted in table 2 for EDA, HF, and body temperature; similar results were found for other colors tested. As shown in the table the variances of the color patterns were more than the error test values, this indicates that there is a linear correlation between the expected response (linear increase in arousal through time) and the physiological response. The low error rate also indicates that all participants had the same reaction, an increase in arousal as time passes within a 100% saturation. As shown by the results color does not have any significant impact on arousal.
< table 2 >
We also tested this environment with linearly changing saturation from 0% to 100%. The hypothesis is that arousal will also be linearly stimulated as a result. We tested it with 6 different environments with different colors. The data analysis results are shown in table 3. Similar to the results above, the low error rate indicates that participants all went through the same experience. The variance is more than the error which indicates a linear co-relation between the physiological reaction and the change in saturation, which validates our hypothesis.
< table 3 >
We ran another experiment to validate the pattern that arousal will increase within an increase of brightness over time. The data analysis results are shown in table 4. The low error rate show that participants all went through the same experience. The variance is more than the error which indicates a linear co-relation between the physiological reaction and the change in lightness, which validates our hypothesis.
< table 4 >
We ran another experiment to explore the relationship between arousal and change in contrast. We setup the environment with all lights set to white color. We then adjusted the lightness of lights in the corners to create local contrast. Contrast here is measured as the difference in lightness between the lights in the center of the room and the ones in the back and around the corner of the room. We varied the contrast from low, moderate, to high contrast and then from high to medium to low. The data analysis results are shown in table 5. These results show that participants all went through the same experience. The variance is more than the error which indicates a linear co-relation between the physiological reaction and the change in contrast, which validates our hypothesis.

15
< table 5 >
These experiments and results validate the relationship between arousal increase/decrease as a result of manipulation of lighting and texture colors over time. However, we did not attempt to deduce valence component of emotions within this experiment. An interesting future direction is to explore the relationship between these patterns and valence or emotions. We anticipate that these patterns will have specific influence on arousal and valence but may not induce specific emotional states, still, this needs to be validated. Case Study: The SEE Project’s DarkCon Scenario Following the design concepts discussed above, we present a project, The Sensory Environments Evaluation (SEE) project (2003-2005), as a case study. The SEE project was undertaken with the purpose of developing techniques that could evoke affective responses at specific moments of an interactive, game-like system from players of that game. In addition to developing an emotionally evoking interactive game-like experience, we also conducted a series of experiments to determine if the design patterns developed were effective (i.e. were correlated to the arousal states of the participants during the interactive experience). Results showed high correlations between design patterns developed and emotional responses desired. In this section, we will discuss the design patterns and experiments conducted referencing design techniques and experimental designs and analysis methods discussed above, when appropriate. The details of the experiments themselves are beyond the scope of this chapter; interested readers are referred to (J. F. Morie, Tortell, & Williams, 2007) for more details.
Since the sponsor of the SEE project was the United States Army Research Office, we developed a military, albeit game-like scenario. We built a fully immersive, old-style virtual reality recon mission, which we called DarkCon, as it took place at night. The player’s ‘mission’ was to determine if abandoned buildings in an area of Eastern Europe were inhabited by refugees or paramilitary forces. The ostensible goal was to drop a signaling device at the location if the recon scout, the player, could confirm through observation, that the “rebels” were holding this area.
For this project, we developed an emotionally evocative space through the use of many sensory modalities, including not only visual and audio, as discussed above, but also a device that makes use of the sense of smell, which is a well known evocateur of emotional response (Proust, 1971). The device provided four distinct odors to be released throughout the scenario, to which we assigned a valence (fresh odors were positive, unpleasant ones negative). We also used a head-mounted display (HMD), full three-dimensional spatialized (surround) sound, and kinesthetic inputs through a custom-designed infrasound floor (with ten sub-sonic transducers). All these modalities served to create an extremely immersive experience that in effect, isolated the participant from the external everyday world, allowing them to be fully engaged within the virtual space and its series of intense and changing emotions.
Sensory modalities are the main techniques used in SEE to stimulate emotions. Although we discussed above several techniques, including narrative, these were not part of our design. In fact, there was no narrative, per se, in the DarkCon scenario except the journey and choices the participant chooses to make. There were also no developed characters in this particular experience. The only people encountered are rebels who can spot you and kill you with no interaction. Thus, our discussion in this section will be constrained to the sensory stimulation design patterns developed within this project and their influence on evoking desired emotions or arousal states.
DarkCon’s use of Sensory Patterns to Evoke Emotions The DarkCon environment is rich with both perceptual and emotional affordances. For example, the culvert in which the journey begins is dark, confined and claustrophobic. It is filled with strange,
16
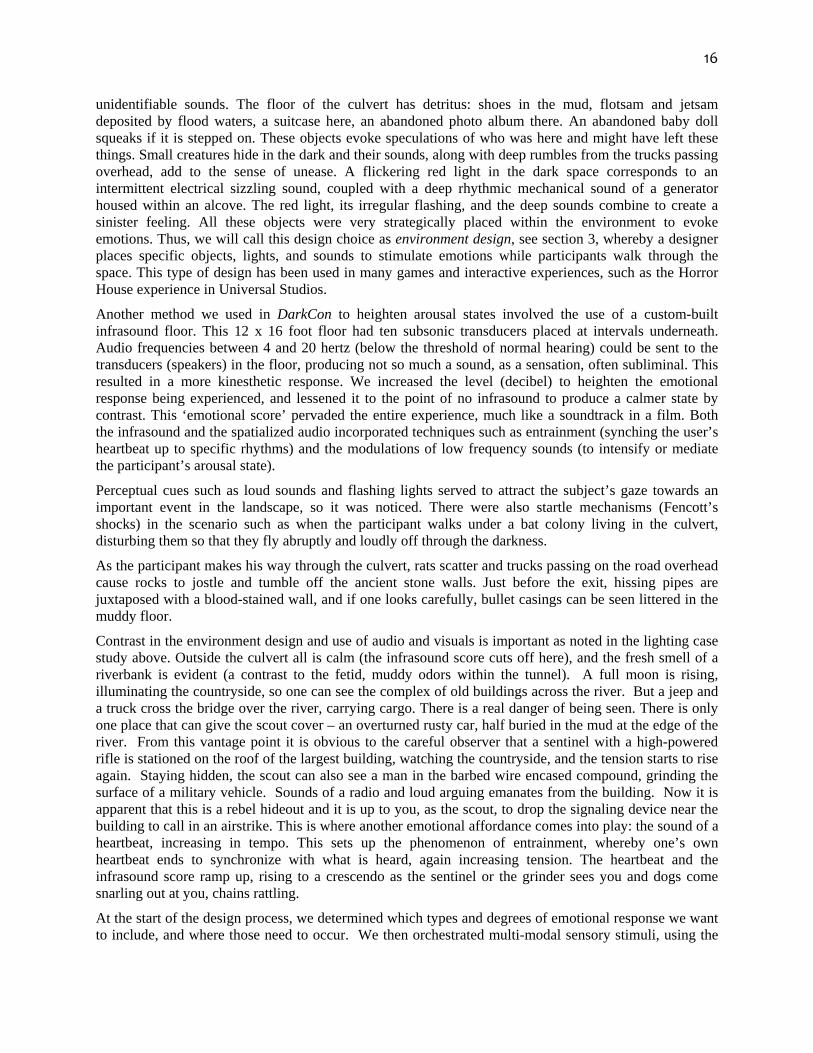
unidentifiable sounds. The floor of the culvert has detritus: shoes in the mud, flotsam and jetsam deposited by flood waters, a suitcase here, an abandoned photo album there. An abandoned baby doll squeaks if it is stepped on. These objects evoke speculations of who was here and might have left these things. Small creatures hide in the dark and their sounds, along with deep rumbles from the trucks passing overhead, add to the sense of unease. A flickering red light in the dark space corresponds to an intermittent electrical sizzling sound, coupled with a deep rhythmic mechanical sound of a generator housed within an alcove. The red light, its irregular flashing, and the deep sounds combine to create a sinister feeling. All these objects were very strategically placed within the environment to evoke emotions. Thus, we will call this design choice as environment design, see section 3, whereby a designer places specific objects, lights, and sounds to stimulate emotions while participants walk through the space. This type of design has been used in many games and interactive experiences, such as the Horror House experience in Universal Studios.
Another method we used in DarkCon to heighten arousal states involved the use of a custom-built infrasound floor. This 12 x 16 foot floor had ten subsonic transducers placed at intervals underneath. Audio frequencies between 4 and 20 hertz (below the threshold of normal hearing) could be sent to the transducers (speakers) in the floor, producing not so much a sound, as a sensation, often subliminal. This resulted in a more kinesthetic response. We increased the level (decibel) to heighten the emotional response being experienced, and lessened it to the point of no infrasound to produce a calmer state by contrast. This ‘emotional score’ pervaded the entire experience, much like a soundtrack in a film. Both the infrasound and the spatialized audio incorporated techniques such as entrainment (synching the user’s heartbeat up to specific rhythms) and the modulations of low frequency sounds (to intensify or mediate the participant’s arousal state).
Perceptual cues such as loud sounds and flashing lights served to attract the subject’s gaze towards an important event in the landscape, so it was noticed. There were also startle mechanisms (Fencott’s shocks) in the scenario such as when the participant walks under a bat colony living in the culvert, disturbing them so that they fly abruptly and loudly off through the darkness.
As the participant makes his way through the culvert, rats scatter and trucks passing on the road overhead cause rocks to jostle and tumble off the ancient stone walls. Just before the exit, hissing pipes are juxtaposed with a blood-stained wall, and if one looks carefully, bullet casings can be seen littered in the muddy floor.
Contrast in the environment design and use of audio and visuals is important as noted in the lighting case study above. Outside the culvert all is calm (the infrasound score cuts off here), and the fresh smell of a riverbank is evident (a contrast to the fetid, muddy odors within the tunnel). A full moon is rising, illuminating the countryside, so one can see the complex of old buildings across the river. But a jeep and a truck cross the bridge over the river, carrying cargo. There is a real danger of being seen. There is only one place that can give the scout cover – an overturned rusty car, half buried in the mud at the edge of the river. From this vantage point it is obvious to the careful observer that a sentinel with a high-powered rifle is stationed on the roof of the largest building, watching the countryside, and the tension starts to rise again. Staying hidden, the scout can also see a man in the barbed wire encased compound, grinding the surface of a military vehicle. Sounds of a radio and loud arguing emanates from the building. Now it is apparent that this is a rebel hideout and it is up to you, as the scout, to drop the signaling device near the building to call in an airstrike. This is where another emotional affordance comes into play: the sound of a heartbeat, increasing in tempo. This sets up the phenomenon of entrainment, whereby one’s own heartbeat ends to synchronize with what is heard, again increasing tension. The heartbeat and the infrasound score ramp up, rising to a crescendo as the sentinel or the grinder sees you and dogs come snarling out at you, chains rattling.
At the start of the design process, we determined which types and degrees of emotional response we want to include, and where those need to occur. We then orchestrated multi-modal sensory stimuli, using the

17
design concepts and emotion inducing techniques such as those described here and the previous section. Visual design, including lighting, color and contrast are extensively employed. Audio design is paramount to setting the mood, and enhancing the visual schemas. This, coupled with a secondary technique of coercive narrative that helps steer the actions and behavior of a player within the environment, makes possible predictable patterns of emotional response within the game experience.
Evaluating the stimulated arousals through the embedded design patterns Studies where the subject self report emotional response via surveys or other instruments tend to be much less reliable and direct that in situ measurements. Therefore, to aid in determining whether our design approach really elicited strong responses, participants were outfitted with two physiological measurements: skin conductance (EDA) and a standard EKG module, provided through (initially) a BioRadio wireless device, and later via a BioPack system1. Real time monitoring of these systems allowed us to see the intensities of arousal states experienced by the players during their session. We were also able to playback a full recording of what they saw and heard throughout the experience with a concurrent display of the physiological signals. A typical screen from this playback and monitoring system, called Phloem, is shown in figure 6.
< figure 6 > This process permitted us to also annotate the biometric data, in preparation for final analysis, an example of which can be seen in the two images in figure 7, below.
< figure 7 >
In addition, we used two questionnaires at the beginning and end of the session: the Immersive Tendencies Questionnaire (Witmer & Singer, 1998) and the Simulator Sickness Questionnaire (SSQ) (Kennedy, Lane, Berbaum, & Lilienthal, 1993) before entering the environment, and afterwards a modified Presence questionnaire (Witmer & Singer, 1998), along with a second SSQ test. The Immersive Tendencies, along with the Presence questionnaire provide a rough measurement of immersion or engagement. The Simulator Sickness test was necessary to ensure that any physical discomfort a participant experienced due to the simulator, or motion sickness, was excluded from the arousal data.
While we were unable, with our measurements, to determine the actual valence of the arousal states (with the exception of those tests that were done with specifically valenced smell triggers), we were able to confirm the exact moments in the game where these states happened, and they did correspond to the actual sections, events or encounters during the game where we designed them to occur.
It should be noted that the task was set up to be nearly impossible to complete successfully. When a participant was close enough to the abandoned building where there were many clues to indicate the rebels had control, he or she was always discovered, and either shot, set upon by dogs, or blown up by a landmine. This was done deliberately to cause an extreme state of heightened arousal- a flight or fight, panic-type situation in the player.
1 The BioRadio is a wireless physiological monitoring device used for medical research. It is made by Cleveland Medical Devices, Chicago, IL. The BioPack physiological monitoring system consists of the base module MP150, to which multiple sensor modules can be connected. It is from BioPack Systems, Goleta, CA.
18
The DarkCon experiments for the SEE Project provided valuable information that supported the validity of our design approach to eliciting emotions in an interactive game-like experience. We assumed that most of these arousal states were of negative valence, as that was the purpose of most of the sensory stimuli utilized in the scenario. It can be seen from the sample annotated data sheets shown in figure 8, that peaks tended to correspond to the designed triggers. Two moments where the arousal state eased were at the exit from the culvert, designed to be a calmer area with a running stream and relative quiet after the tunnel, and when the scout was hidden behind a wrecked car, ‘safely’ observing the situation around him.
The amount of data derived from the biometric measurement device was extensive and a challenge to process. It was subject to a great deal of noise from the participant being able to move about over the extent of the infrasound floor in the traditional virtual reality mode in which this environment was implemented. So, while this modality allowed us much more flexibility in creating techniques to elicit emotional responses, it was more difficult to both process and analyze. Nonetheless, this work can be seen as an interesting effort to both design and measure emotions within interactive experiences.
CONCLUSION In this book chapter we discussed several methods that artists use in various interactive and non-interactive media to elicit emotions from the audience to provide the audience with an emotionally rich experience. We believe these techniques are very important, but what is more important is understanding their use and validating them scientifically. This book chapter discussed various techniques for assessing and measuring users’ emotions while playing or participating within an interactive experience. We discussed two case studies that attempt to embed several artistic design techniques to evoke emotions and validate these techniques through objective measurements of arousal. This chapter starts to scratch the surface on what we believe as an important area of understanding emotional affordances as tools for developing more engaging emotionally rich interactive experiences. We believe more studies as the ones discussed here is needed to move this field forward.
REFERENCES Aftanas, L., & Golocheikine, S. A. (2001). Human anterior and frontal midline theta and lower alpha
reflect emotionally positive state and internalized attention: high-resolution EEG investigation of meditation. Neuroscience Letters, 310(1), 57-60.
Alton, J. (1995). Painting with Light. Berkeley: University of California Press. Anttonen, J., & Surakka, V. (2005). Emotions and heart rate while sitting on a chair. Paper presented at
the CHI '05: Proceedings of the SIGCHI conference on Human factors in computing systems. Aristotle. (1967). Poetics (G. F. Else, Trans.). Ann Arbor: University of Michigan Press. Baid, C. E. (1973). Drama. New York: W. W. Norton & Company. Benedetti, R. (1994). Actor at Work (6th ed.). Englewood Cliffs: Prentice-Hall. Birn, J. (Ed.). (2000). Digital Lighting & Rendering. Indianapolis: New Riders. Block, B. (2001). The Visual Story: Seeing the Structure of Film, TV, and New Media. New York: Focal
Press. Blythe, M. A., & Hassenzahl, M. (2004). The Semantics of Fun: Differentiating Enjoyable Experiences.
In M. A. Blythe, K. Overbeeke, A. F. Monk & P. C. Wright (Eds.), Funology : From Usability to Enjoyment (Human-Computer Interaction Series). MA: Kulwer Academic Publishers.
Boal, A. (1979). Theatre of the Oppressed. New York, NY: Urizen Books. Boal, A. (2002). Games for Actors and Non-Actors (2 ed.). London: Routledge. Boorstin, J. (1990). Making Movies Work: Thinking Like a Filmmaker. LA, CA: Silman-James Press. Bornstein, R. F. (1992). Perception without Awareness: Retrospect and Prospect, in Perception without
Awareness: Cognitive, Clinical and Social Perspectives. New York, New York: BoGuilford. Boucsein, W. (1992). Electrodermal Activity. New York: Plenum Press.

19
Bradley, M. M., & Lang, P. J. (2007). Emotion and motivation. In J. T. Cacioppo, L. G. Tassinary & G. G. Berntson (Eds.), Handbook of Psychphysiology. New York, NY: Cambridge University Press.
Brown, B. (1996). Motion Picture and Video Lighting. Boston: Focal Press. Cabeza, R., & Nyberg, L. (2000). Imaging cognition II: An empirical review of 275 PET and fMRI
studies. J. Cogn. Neurosci., 12(1). Cacioppo, J. T., Tassinary, L. G., & Berntson, G. G. (2007). Handbook of Psychophysiology (3rd ed.):
Cambridge University Press. Calahan, S. (1996). Storytelling through lighting: a computer graphics perspective. Paper presented at the
Siggraph Course Notes. Campbell, D. (1999). Technical Theatre for Non-technical People. New York City, NY: Allworth Press. Campbell, J. (1972). The Hero with a Thousand Faces. New Jersey: Princeton University Press. Crowther, B. (1989). Film Noir: Reflections in a Dark Mirror. New York: Continuum. Desmet, P. M. A. (2003). Measuring emotion; development and application of an instrument to measure
emotional responses to products. . In M. A. Blythe, K. Overbeeke, A. F. Monk & P. C. Wright (Eds.), Funology: from usability to enjoyment. Dordrecht, Boston, London: Kluwer Academic Publishers.
Drachen, A., Canossa, A., & Yannakakis, G. (2009). Player Modeling using Self-Organization in Tomb Raider: Underworld. . Paper presented at the IEEE Computational Intelligence in Games (CIG).
Drachen, A., & Heide-Smith, J. (2008). Player Talk - The functions of communication in multi-player Role Playing Games - Players and Media. ACM Computers in Entertainment, 6(3).
Duchowski, A. T. (2007). Eye tracking methodology: Theory and practice (Second ed. ed.). Berlin: Springer.
Ekman, P. (1992). An argument for basic emotions. Cognition and Emotion, 6(3/4), 169-200. Fencott, C. (1999). Content and Creativity in Virtual Environment Design. Paper presented at the 5th
International Conference on Virtual Systems and Multimedia. Fisher, C., & Sanderson, P. (1996). Exploratory Data Analysis: Exploring Continuous Observational
Data. Interactions, 3, 25 - 34. Fitchen, J. (1961). The Construction of Gothic Cathedrals: A Study of Medieval Vault Erection. Oxford:
Oxford University Press. Freeman, D. (2003). Creating Emotions in Games. IN: New Riders. Fridlund, A. J., & Cacioppo, J. T. (1986). Guidelines for human electromyographic research.
Psychophysiology, 23(567-589). Gibson, E. J., & Walk, R. D. (1960). The "Visual Cliff". Scientific American, 202, 67-71. Gibson, J. J. (1979). The Ecological Approach to Visual Perception. New York, New York: Houghton
Mifflin. Gillette, J. M. (1998). Designing with Light (3rd. ed.). Mountain View, CA: Mayfield. Grodal, T. (2000). Video games and the pleasures of control. In I. Mahwah (Ed.), D. Zillmann & P.
Vorderer (Eds.), Media entertainment: The psychology of its appeal. NJ: Lawrence Erlbaum Associates.
Hayes, M. H. (1996). Statistical Digital Signal Processing and Modeling. New York: Wiley. Hirshfield, L. M., Solovey, E. T., Girouard, A., Kebinger, J., Jacob, R. J. K., Sassaroli, A., et al. (2009).
Brain measurement for usability testing and adaptive interfaces: an example of uncovering syntactic workload with functional near infrared spectroscopy. Paper presented at the In Proceedings of the 27th international conference on Human factors in computing systems (CHI).
Holson, L. M. (2004, April 10). Out of Hollywood, rising fascination with video games. . The New York Times on the Web.
IJsselsteijn, W. A., Poels, K., & de Kort, Y. A. W. (2008). The game experience questionnaire: Development of a self-report measure to assess player experiences of digital games. Eindhoven, The Netherlands: FUGA technical report,TU Eindhoven.
Isbister, K., & Schaffer, N. (2008). Game Usability: Advancing the Player Experience: Morgan Kaufmann.

20
Kennedy, R. S., Lane, N. E., Berbaum, K. S., & Lilienthal, M. G. (1993). Simulator sickness questionnaire: an enhanced method for quantifying simulator sickness. International Journal of Aviation Psychology, 3(3), 203-220.
Kim, J. H., Gunn, D. V., Schuh, E., Phillips, B., Pagulayan, R. J., & Wixon, D. (2008). Tracking real-time user experience (true): a comprehensive instrumentation solution for complex systems. Paper presented at the Proceedings of twenty-sixth annual SIGCHI conference on Human factors in computing systems (CHI 2008).
Knopf, D. C. a. A. (1979). The Book of Movie Photography. London: Alfred Knopf, Inc. Knoph, D. C. a. A. (1979). The Book of Movie Photography. London: Alfred Knopf. Kuniavsky, M. (2003). Observing the user experience. A practitioners guide to user research. . San
Francisco: CA: Morgan Kauffman publishers. Lagrange, M., Marchand, S., Raspaud, M., & Rault, J.-B. (2003). Enhanced Partial Tracking Using
Linear Prediction. Paper presented at the DAFx, London. Lang, P. J. (1995). The emotion probe: studies of motivation and attention. . American Psychologist, 50,
372-385. Lim, C. L.; Rennie, C., Barry, R. J., Bahramali, H., Lazzaro, I., manor, B., Gordon, E. (1997). Decompos-
ing skin conductance into tonic and phasic measurements”, International Journal of Psycho-physiology, 25 (2), 97-109
Mandryk, R. L., Atkins, S. M., & Inkpen, K. M. (2006). A continious and objective evaluation of emotional experience with interactive play environments. Paper presented at the CHI 2006.
Mandryk, R. L., & Inkpen, K. M. (2004). Physiological indicators for the evaluation of co-located collaborative play. Paper presented at the CSCW.
Marshall, C., & Rossman, G. B. (1999). Designing Qualitative Research. Thousand Oaks, CA: Sage. Mathiak, K., & Weber, R. (2006). Toward brain correlates of natural behavior: fmri during violent video
games. Human Brain Mapping, 27(12), 948-956. Medlock, M., Wixon, D., Terrano, M., Romero, R. L., & Fulton, B. (2002). Using the rite method to
improve products: A definition and a case study. Paper presented at the Proceedings of UPA Conference.
Meehan, M., Insko, B., Whitton, M., & Brooks, F. P. J. (2002). Physiological Measures of Presence in Stressful Virtual Environments. ACM Transactions on Graphics, 21(3), 645-652.
Merkx, P. A. B., Truong, K. P., & Neerincx, M. A. (2007). Inducing and measuring emotion through a multiplayer first-person shooter computer game. Paper presented at the Proceedings of the Computer Games Workshop 2007.
Millet, M. S. (1996). Light Revealing Architecture. New York, New York: Wiley. Miltner, W. H. R., Braun, C., Arnold. M., Witte, H., Taub, E. Coherence of gamma-band EEF activity as
a basis for associative learning. Nature, 397, 434-436. Morie, J., Iyer, K., Valanejad, K., Sadek, R., Miraglia, D., Milam, D., et al. (2003). Sensory design for
virtual environments. Paper presented at the SIGGRAPH Conference 2003. Morie, J. F., Tortell, R., & Williams, J. (2007). Would You Like To Play a Game? Experience and in
Game-based Learning In H. O. a. R. Perez (Ed.), Computer Games and Team and Individual Learning (pp. 269-286. ). Oxford, UK: Elsevier Press.
Morie, J.F., Williams, J., Dozois, A., and Luigi, D.-P. (2005). The Fidelity of Feel: Emotional Affordance in Virtual Environments. Proceedings of the 11th International Conference on Human-Computer Interaction.
Nacke, L., Lindley, C., & Stellmach, S. (2008). Log who’s playing: psychophysiological game analysis made easy through event logging. Paper presented at the Proceedings of Fun and Games, Second International Conference.
Nacke, L. E. (2009). Affective Ludology. Scientific Measurement of User Experience in Interactive Entertainment. . Bleking Technical University, Sweden.
Norman, D. A. (2004). Emotional Design. New York, NY: Basic Books.

21
O´Donnell, M.; Creamer, M.; Elliott, P., Bryant, R. (2007). Tonic and Phasic Heart Rate as Predictors of Psttraumatic Stress Disorder, Psychosomatic Medicine, 69, 256-261.
Oatley, K., Keltner, D., & Jenkins, J. M. (2006). Understanding Emotions: Wiley-Blackwell Publishers Pagulayan, R., Keeker, K., Wixon, D., Romero, R. L., & Fuller, T. (2003). User-centered design in
games. In The human-computer interaction handbook: fundamentals, evolving technologies and emerging applications: L. Erlbaum Associates Inc.
Pfurtscheller, G., Zalaudek, K., & Neuper, C. (1998). Event-related beta synchronization after wrist, finger and thumb movement. Electroencephalography and Clinical Neurophysiology, 109, 154–160.
Poels, K., Kort, Y. d., & IJsselsteijn, W. (2007). It is always a lot of fun!: exploring dimensions of digital game experience using focus group methodology. Proceedings of the 2007 conference on Future Play.
Propp, V., Wagner, L. A., & Scott, L. (1968). Morphology of the Folktale (American Folklore Society Publications). Austin, TX: University of Texas Press.
Proust, M. (1971). The Past Recaptured (A. Mayor, Trans.). New York: Random House. Rani, P., Sims, J., Brackin, R., & Sarkar, N. (2002). Online Stress Detection using Psychophysiological
Signal for Implicit Human - Robot Cooperation. Robotica, 20, 673 - 686. Ravaja, N. (2004). Contributions of psychophysiology to media research: Review and recommendations. .
Media Psychology, 6, 193-235. Ravaja, N., & Kivikangas, J. M. (2008). Psychophysiology of digital game playing: The relationship of
self-reported emotions with phasic physiological responses. Paper presented at the Proceedings of Measuring Behavior 2008.
Ravaja, N., Saari, T., Salminen, M., Laarni, J., & Kallinen, K. (2006). Phasic emotional reactions to video game events: A psychophysiological investigation. . Media Psychology, 8, 343-367.
Ray, W. J., & Cole, H. (1985). EEG alpha activity reflects attentional demands, and beta activity reflects emotional and cognitive processes. Science, 228(4700), 750-752. Rowe, D. W., Sibert, J., & Irwin, D. (1998). Heart Rate Variability: Indicator of User State as an Aid to
Human - Computer Interaction. Paper presented at the Conference on Human Factors in Computing Systems.
Russell, J. A. (1980). A circumplex model of affect. Journal of Personality and Social Psychology, 39(6), 1161-1178.
Sander, D., Grandjean, D., & Scherer, K. R. (2005). A systems approach to appraisal mechanisms in emotion, Neural Networks: Elsevier
Sennersten, C. (2008). Gameplay (3D Game Engine + Ray Tracing = Visual Attention through Eye Tracking). Blekinge Tekniska Högskola.
Stern, R. M., Ray, W. J., & Quigley, K. S. (2001). Psychophysiological Recording. New York: Oxford University Press.
Styan, J. L. (1960). The Elements of Drama. Cambridge: Cambridge University Press. Thomas, F., & Johnston, O. (1981). The Illusions of Life: Disney Animation. New York: Abbeville Press
Publishers. Thompson, D. B. a. K. (2001). Film Art: An Introduction (6th ed.). New York: Mc Graw Hill. Ward, R. D., & Marsden, P. H. (2003). Physiological responses to different WEB page designs. Int. J.
Hum.- Comput. Stud., 59(1-2), 199--212. Witmer, B. G., & Singer, M. J. (1998). Measuring Presence in Virtual Environments: A Presence
Questionnaire. Presence-Teleoperators and Virtual Environments, 7(3), 225-240. APPENDIX Linear Prediction Model

22
In the linear prediction (LP) model, also known as the autoregressive (AR) model, the current sample x(n) is approximated by a linear combination of past samples of the input signal (Lagrange, Marchand, Raspaud, & Rault, 2003). We are looking for a vector a, of d coefficients, d being the order of the LP model. Provided that the a vector is estimated, the predicted value x̂ is computed simply by FIR filtering of the p past samples with the coefficients using Equation:
1
ˆ( ) ( )p
ii
x n a x n i=
= −∑
The main challenge in linear prediction modeling is to use an estimation method that suits the specific need. There are two methods: the autocorrelation method and covariance method. We used the co-variance method of the linear prediction model to estimate if there was a linear relation between the physiological response and expected response using the input pattern, such as change in saturation, warmth over time. As shown above, most patterns describe a linear relationship between color properties over time such as warmth, contrast, or saturation. Thus, we can use the linear prediction model to validate if such linear relationship exists by treating the color properties change over time as output and physiological responses of all participants as input. This will also validate if all participants shared the same response. For patterns that are not defined as a linear relationship between the color properties change over time and arousal, we defined an expected response and treated this as the function to test for linear co-relation.
The covariance method model for linear prediction uses the p order samples to train and design a filter to test predict the p+1 sample. The best designed filter would be the order for which we get minimum error. We calculate the mean square error from the difference between the predicted value and the given data value with this method.
We used the covariance method (Hayes, 1996) of least squares linear prediction to design a causal linear estimator for an output or target sequence based on an input (evocative) sequence. We can build an estimation filter using the response data recorded from the participants. The participants were divided into a test and a training set of equal number. The physiological response of the training set and the input color pattern are used to design a filter that is applied on the test set physiological response. The p+1 response of the test set is estimated and compared to the recorded p+1 value of the response.