a scenario-based approach to asset allocation · 2019-02-21 · a scenario-based approach to asset...
TRANSCRIPT
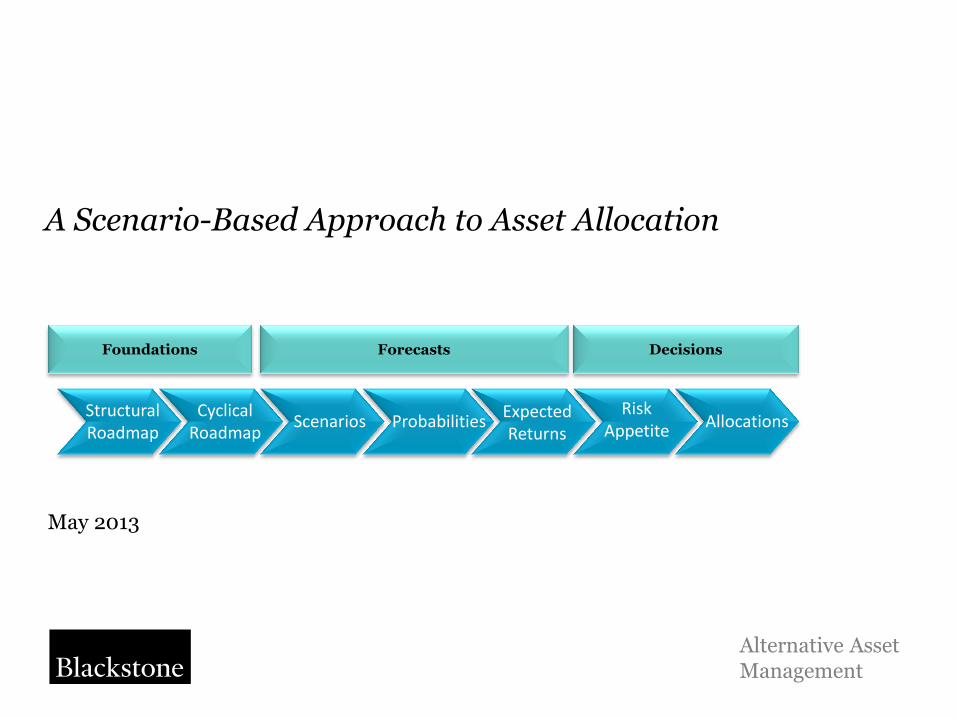
A Scenario-Based Approach to Asset Allocation
May 2013
Alternative Asset Management
Allocations Risk
Appetite
Foundations Forecasts Decisions
Expected Returns
Probabilities Scenarios Cyclical
Roadmap Structural Roadmap
Confidential
Blackstone 1
184 0 92 102 0 70 0 152 195 99 206 202 201 221 3 0 103 120 0 115 99 0 171 146
Disclosure
Important Disclosure Information:
The materials contained herein are for informational purposes only and do not constitute an offer to sell or a solicitation of an offer to purchase any interest in any investment vehicles (the “Blackstone Funds”) managed by Blackstone Alternative Asset Management L.P. or any of its investment advisory affiliates (together, “Blackstone”). Any such offer or solicitation shall be made only pursuant to the confidential private placement memorandum for a Blackstone Fund (“PPM”), which qualifies in its entirety the information set forth herein and contains a description of the risks of investing. These materials are also qualified by reference to the governing documents and the subscription agreement relating to the relevant Blackstone Fund (collectively, the “Agreements”). The PPM and Agreements relating to a Blackstone Fund should be reviewed carefully prior to an investment in that Fund. The Blackstone Funds are speculative and involve a high degree of risk.
In connection with your consideration of an investment in any Blackstone Funds, you should be aware of the following risks:
The Blackstone Funds may be leveraged and their portfolios may lack diversification, thereby increasing the risk of loss. The Blackstone Funds may invest in instruments that are highly illiquid and extremely difficult to value, which may limit an investor's ability to redeem or transfer its investment or delay receipt of redemption proceeds. The Blackstone Funds’ are speculative, involve a high degree of risk and their performance may be volatile. An investor may lose some or all of its investment. Blackstone has total investment authority over the Blackstone Funds, which could result in a lack of diversification and, consequently, higher risk. There is no secondary market for investors’ interests in the Blackstone Funds. There are restrictions on withdrawal and transfer of interests in the Blackstone Funds. The Blackstone Funds’ fees and expenses, and those of underlying portfolio funds, are substantial and will negatively impact performance.
Investments in the Blackstone Funds are not subject to the same regulatory requirements or governmental oversight as mutual funds. Blackstone Funds and their underlying managers may purchase instruments that are traded on exchanges located outside the United States that are “principal markets” and are subject to the risk that the counterparty will not perform with respect to contracts. Furthermore, since there is generally less government supervision and regulation of foreign exchanges, Blackstone Funds and their underlying managers are also subject to the risk of the failure of the exchanges and there may be a higher risk of financial irregularities and/or lack of appropriate risk monitoring and controls.
Investment managers and general partners of Blackstone Funds are not required to provide their Investors with periodic pricing or valuation information and any information provided is generally unaudited. Investors in Blackstone Funds generally will have limited rights with respect to their investment interest, including limited voting rights and limited participation in the management of the Funds. Blackstone Funds may involve complex tax and legal structures.
Investment in any of the Blackstone Funds is only suitable for sophisticated investors for which such an investment does not constitute a complete investment program and which fully understand and are willing to assume the risks involved in such Funds. We strongly encourage Investors to obtain independent advice from their own tax, accounting and legal advisers regarding any investment in any Blackstone Fund. Investors are also urged to take appropriate advice regarding any applicable legal requirements and any applicable taxation and exchange control regulations in the country of their citizenship, residence or domicile which may be relevant to the subscription, purchase, holding, exchange, redemption or disposal of any Blackstone Funds.
This communication is exempt from the restriction on the promotion of unregulated schemes (in section 238 of the Financial Services and Markets Act 2000 and the UK Financial Conduct Authority's Conduct of Business Sourcebook 4.12) on the grounds that the communication is only made to or directed at either (1) persons having professional experience of participating in unregulated schemes and the units to which the communication relates are available only to such persons; persons who do not have professional experience in participating in unregulated schemes should not rely on it, or (2) eligible counterparties and/or professional clients as those terms are defined in the rules of the UK Financial Conduct Authority. The units to which the communication relates are available only to such persons. Any person who is not an investment professional, an eligible counterparty or a professional client must not act or rely upon the contents of this communication. Blackstone is registered as an investment adviser with the SEC. This material has been approved for distribution by The Blackstone Group International Partners LLP which is authorised and regulated by the UK Financial Conduct Authority. The Blackstone Group International Partners LLP performs marketing and investor services activities outside the United States for Blackstone, which is located in the United States.
This document contains highly confidential information regarding Blackstone's investments, strategy and organization. Your acceptance of this document from Blackstone constitutes your agreement to (i) keep confidential all the information contained in this document, as well as any information derived by you from the information contained in this document (collectively, "Confidential Information") and not disclose any such Confidential Information to any other person, (ii) not use any of the Confidential Information for any purpose other than to consider investing in, or monitor investments in, Blackstone Funds, (iii) not use the Confidential Information for purposes of trading any security, including, without limitation, securities of Blackstone or its portfolio companies, (iv) not copy this document without the prior consent of Blackstone, and (v) promptly return this document and any copies hereof to Blackstone upon Blackstone's request. The use of the Confidential Information also is subject to the confidentiality provisions set forth in the Agreements and in any other written agreement between the recipient and Blackstone.

Confidential
Blackstone 2
184 0 92 102 0 70 0 152 195 99 206 202 201 221 3 0 103 120 0 115 99 0 171 146
Additional Disclosure
The provision of this document to any person does not constitute, and may not be used for the purposes of, an offer of, or invitation to subscribe for, securities or financial products of any kind to that person. Any such offer or invitation will only be extended to a person in Australia under the terms of a separate document (such as a Confidential Memorandum), containing the full terms and conditions of any such offer or invitation. This document is not a disclosure document for the purposes of the Corporations Act 2001 (Cth) (“Act”) and has not been lodged with the Australian Securities and Investments Commission.
This document is provided only for the use of persons who are wholesale clients as defined in the Act (“wholesale client”). Any securities or financial products described in, or services that may be referred to or provided in connection with, this document are not made available to any person who is a retail client as defined in the Act. By accepting this document, you expressly acknowledge and represent that you are a wholesale client. This document is not intended to be distributed or passed on, directly or indirectly, to any class of persons in Australia other than wholesale clients.
The information in this document has been prepared without taking into account any recipient’s investment objectives, financial situation, taxation position or other particular needs or requirements and should not be relied on for the purposes of making any investment decision. If a recipient is considering making any decision in connection with the information in this document, that recipient should obtain their own independent advice.
To the extent that this document contains financial product advice, that advice is provided by The Blackstone Group (Australia) Pty Limited ACN 149 142 058 AFSL 408376 (“BGA”). BGA holds an Australian financial services licence authorising it to provide the financial services it provides in Australia. To the extent that advice is provided solely by Blackstone Alternative Asset Management LP (“BAAM”), BAAM is exempt from the requirement to hold an Australian financial services licence under the Corporations Act 2001 (Cth) in respect of the financial services it provides in Australia. BAAM is regulated by the Securities and Exchange Commission under the laws of the United States of America, which differ from Australian laws
Confidential
Blackstone 3
184 0 92 102 0 70 0 152 195 99 206 202 201 221 3 0 103 120 0 115 99 0 171 146
Table of Contents
I. BAAM’s Scenario-Based Approach to Asset Allocation 4 Structural and Cyclical Themes 6 Scenario-Based Approach 7 Probability-Weighted Scenarios 9 Returns Matrix 11 Portfolio Construction 14 II. Insights from Our Views and Framework for Australian Portfolios 15
Portfolio Set 1: No Benchmark 17 Portfolio Set 2: Additional Shocks 19 Portfolio Set 3: Benchmark & Additional Shocks 23 Portfolio Set 4: Post-FX Returns 25
III. Appendix 1 28 Optimization Sensitivity 30 Correlations 31 Asset Class Returns 32
IV. Appendix 2 37 Top Down View Formation 38 Long-Term Scenarios 39
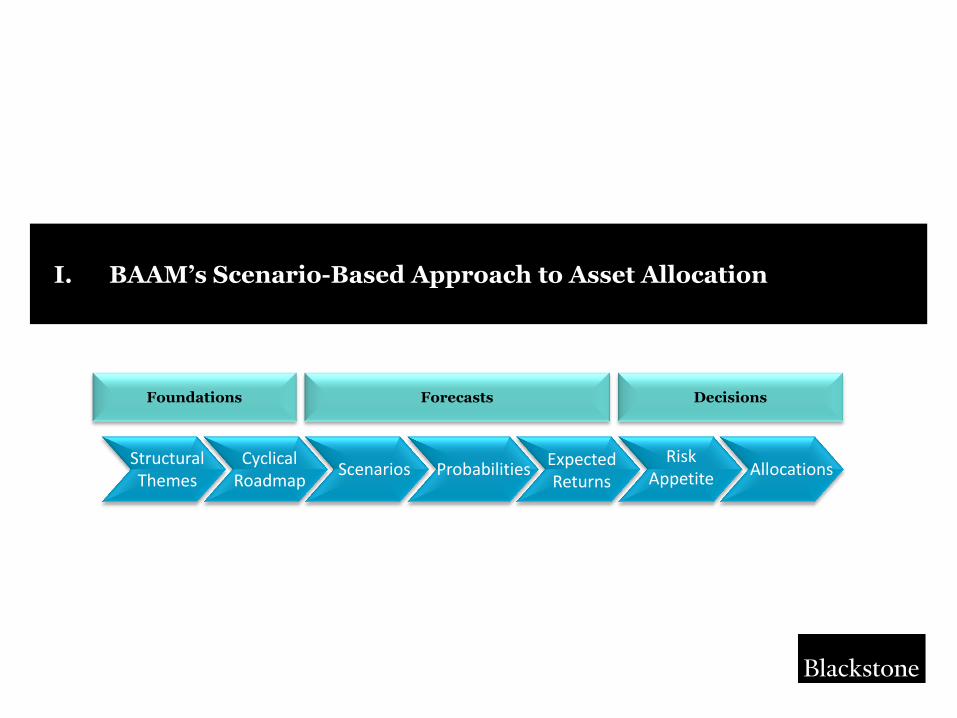
I. BAAM’s Scenario-Based Approach to Asset Allocation
Allocations Risk
Appetite
Foundations Forecasts Decisions
Expected Returns
Probabilities Scenarios Cyclical
Roadmap Structural Themes
Confidential
Blackstone 5
184 0 92 102 0 70 0 152 195 99 206 202 201 221 3 0 103 120 0 115 99 0 171 146
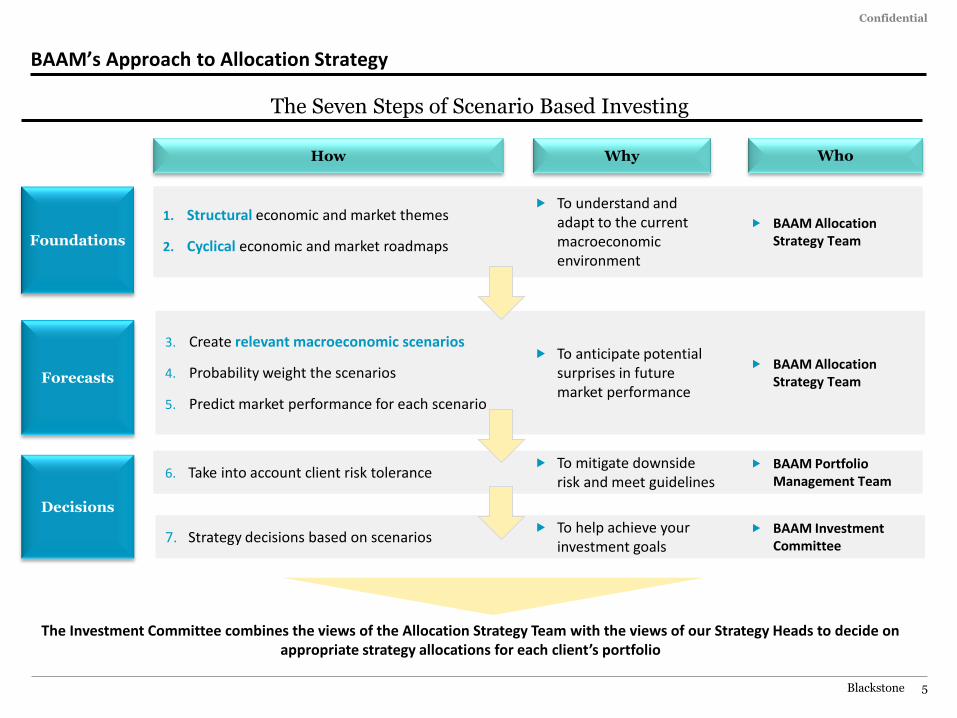
BAAM’s Approach to Allocation Strategy
The Seven Steps of Scenario Based Investing
Foundations
How Why Who
Forecasts
Decisions
1. Structural economic and market themes
2. Cyclical economic and market roadmaps
To understand and adapt to the current macroeconomic environment
To anticipate potential surprises in future market performance
BAAM Allocation Strategy Team
To help achieve your investment goals
BAAM Allocation Strategy Team
3. Create relevant macroeconomic scenarios
4. Probability weight the scenarios
5. Predict market performance for each scenario
BAAM Investment Committee
7. Strategy decisions based on scenarios
The Investment Committee combines the views of the Allocation Strategy Team with the views of our Strategy Heads to decide on appropriate strategy allocations for each client’s portfolio
6. Take into account client risk tolerance To mitigate downside
risk and meet guidelines BAAM Portfolio
Management Team
Confidential
Blackstone 6
184 0 92 102 0 70 0 152 195 99 206 202 201 221 3 0 103 120 0 115 99 0 171 146
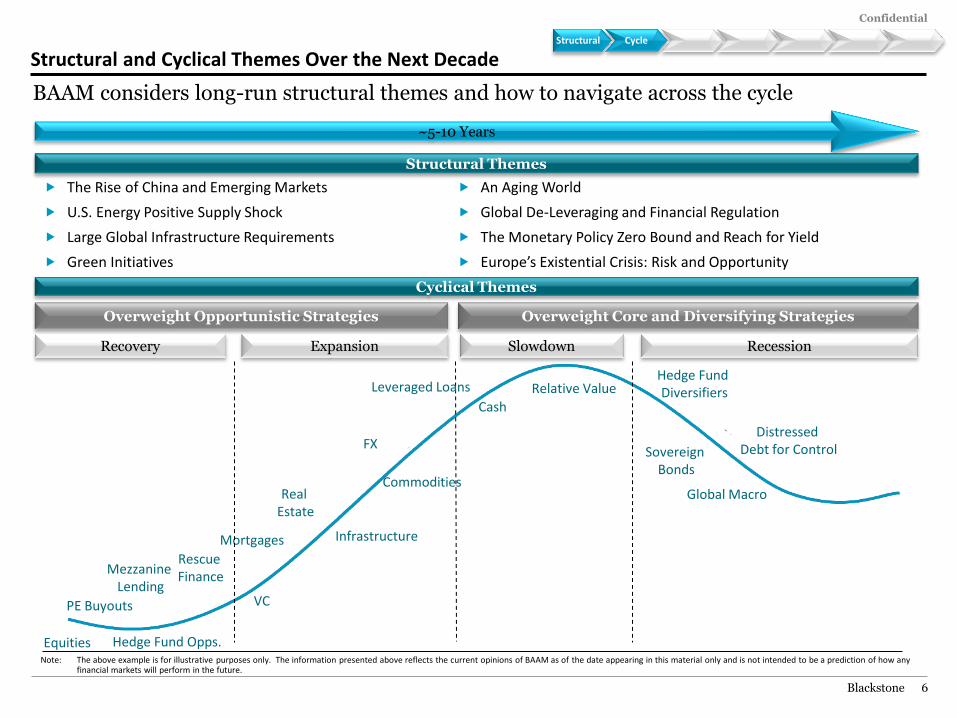
Structural and Cyclical Themes Over the Next Decade
~5-10 Years
Cyclical Themes
Structural Themes
The Rise of China and Emerging Markets
U.S. Energy Positive Supply Shock
Large Global Infrastructure Requirements
Green Initiatives
An Aging World
Global De-Leveraging and Financial Regulation
The Monetary Policy Zero Bound and Reach for Yield
Europe’s Existential Crisis: Risk and Opportunity
Overweight Opportunistic Strategies Overweight Core and Diversifying Strategies
Recovery Expansion Slowdown Recession
Mortgages Infrastructure
Mezzanine Lending
PE Buyouts
Equities
Real Estate
Hedge Fund Opps.
VC
FX
Rescue Finance
Commodities
Cash
Relative Value Hedge Fund Diversifiers
Sovereign Bonds
Global Macro
Distressed Debt for Control
Note: The above example is for illustrative purposes only. The information presented above reflects the current opinions of BAAM as of the date appearing in this material only and is not intended to be a prediction of how any financial markets will perform in the future.
BAAM considers long-run structural themes and how to navigate across the cycle
Leveraged Loans
Structural Themes Cycle
Confidential
Blackstone 7
184 0 92 102 0 70 0 152 195 99 206 202 201 221 3 0 103 120 0 115 99 0 171 146
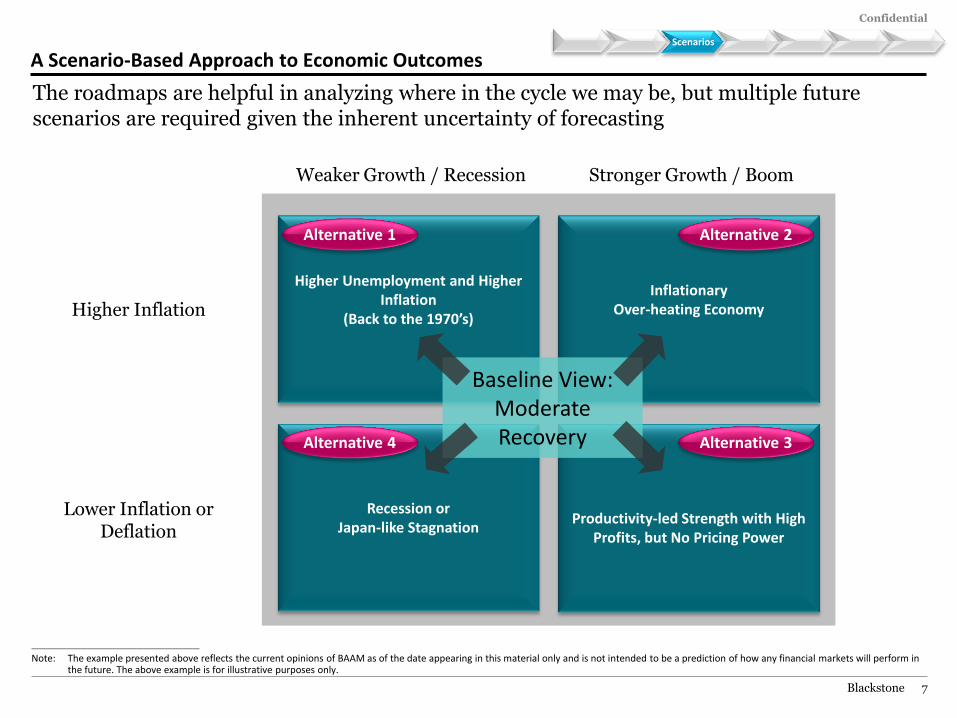
A Scenario-Based Approach to Economic Outcomes
Productivity-led Strength with High
Profits, but No Pricing Power
Higher Unemployment and Higher Inflation
(Back to the 1970’s)
Inflationary Over-heating Economy
Recession or Japan-like Stagnation
Higher Inflation
Lower Inflation or Deflation
Weaker Growth / Recession Stronger Growth / Boom
________________________________________________
Note: The example presented above reflects the current opinions of BAAM as of the date appearing in this material only and is not intended to be a prediction of how any financial markets will perform in the future. The above example is for illustrative purposes only.
Baseline View: Moderate Recovery
Alternative 1 Alternative 2
Alternative 4 Alternative 3
The roadmaps are helpful in analyzing where in the cycle we may be, but multiple future scenarios are required given the inherent uncertainty of forecasting
Scenarios Scenarios
Confidential
Blackstone 8
184 0 92 102 0 70 0 152 195 99 206 202 201 221 3 0 103 120 0 115 99 0 171 146
2%
2%
13%
1%
5%
5%
16%
6%
5%
2%
10%
8%
7% 3%
7%
3%
3%
2%
QE Proves Effective (1)
New Economy, Zero Inflation
Europe Improves
Global Decoupling
Moderate Growth
Financial Healing
China Bust, Developed Markets Up
Inflationary Overheating
Deflationary Slog
Europe Worsens
Greece Exit Triggers Chaos
EMU Disintegrates
Double Dip Light
Stagflation Fears
Double Dip Heavy
China Bust, Developed Markets Down
Germany Leaves Euro
BeautifulInflation
Allowing for Many Types of Financial Market Outcomes within Each of the Four Boxes
________________________________________________
(1) Quantitative Easing. Note: Bubble size represents probability. BAAM determined the scores presented above in its sole discretion based on its views and not necessarily based on objective market data. These scores are not
intended to be a prediction of how any financial markets will perform in the future. The above example is for illustrative purposes only.
Growth
Infl
ati
on
Lower Higher
Lo
we
r H
igh
er
Positive Scenario
Negative Scenario
2%
39%
35%
24%
Although the 2x2 matrix is useful, the reality is that financial markets may perform differently even within the same box. As a result, many scenarios (18 currently) are considered
Scenarios
Confidential
Blackstone 9
184 0 92 102 0 70 0 152 195 99 206 202 201 221 3 0 103 120 0 115 99 0 171 146
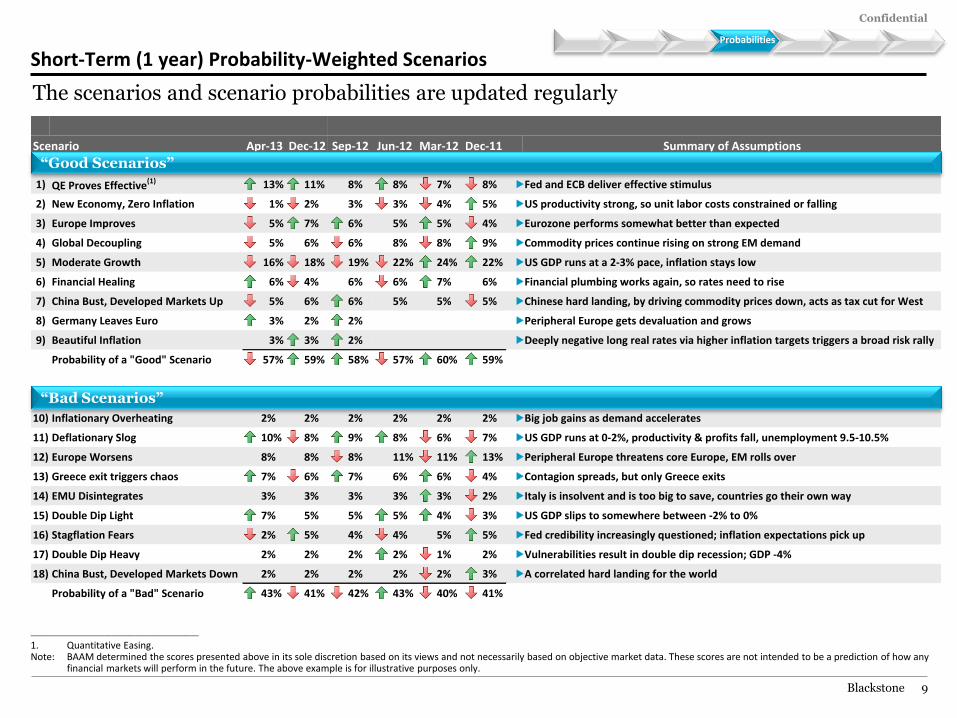
Scenario Sep-12 Jun-12 Mar-12 Dec-11 Summary of Assumptions
"Good" Scenarios
1) QE Proves Effective(1) 13% 11% 8% 8% 7% 8% Fed and ECB deliver effective stimulus
2) New Economy, Zero Inflation 1% 2% 3% 3% 4% 5% US productivity strong, so unit labor costs constrained or falling
3) Europe Improves 5% 7% 6% 5% 5% 4% Eurozone performs somewhat better than expected
4) Global Decoupling 5% 6% 6% 8% 8% 9% Commodity prices continue rising on strong EM demand
5) Moderate Growth 16% 18% 19% 22% 24% 22% US GDP runs at a 2-3% pace, inflation stays low
6) Financial Healing 6% 4% 6% 6% 7% 6% Financial plumbing works again, so rates need to rise
7) China Bust, Developed Markets Up 5% 6% 6% 5% 5% 5% Chinese hard landing, by driving commodity prices down, acts as tax cut for West
8) Germany Leaves Euro 3% 2% 2% Peripheral Europe gets devaluation and grows
9) Beautiful Inflation 3% 3% 2% Deeply negative long real rates via higher inflation targets triggers a broad risk rally
Probability of a "Good" Scenario 57% 59% 58% 57% 60% 59%
"Bad" Scenarios
10) Inflationary Overheating 2% 2% 2% 2% 2% 2% Big job gains as demand accelerates
11) Deflationary Slog 10% 8% 9% 8% 6% 7% US GDP runs at 0-2%, productivity & profits fall, unemployment 9.5-10.5%
12) Europe Worsens 8% 8% 8% 11% 11% 13% Peripheral Europe threatens core Europe, EM rolls over
13) Greece exit triggers chaos 7% 6% 7% 6% 6% 4% Contagion spreads, but only Greece exits
14) EMU Disintegrates 3% 3% 3% 3% 3% 2% Italy is insolvent and is too big to save, countries go their own way
15) Double Dip Light 7% 5% 5% 5% 4% 3% US GDP slips to somewhere between -2% to 0%
16) Stagflation Fears 2% 5% 4% 4% 5% 5% Fed credibility increasingly questioned; inflation expectations pick up
17) Double Dip Heavy 2% 2% 2% 2% 1% 2% Vulnerabilities result in double dip recession; GDP -4%
18) China Bust, Developed Markets Down 2% 2% 2% 2% 2% 3% A correlated hard landing for the world
Probability of a "Bad" Scenario 43% 41% 42% 43% 40% 41%
Dec-12Apr-13
________________________________________________
1. Quantitative Easing. Note: BAAM determined the scores presented above in its sole discretion based on its views and not necessarily based on objective market data. These scores are not intended to be a prediction of how any
financial markets will perform in the future. The above example is for illustrative purposes only.
The scenarios and scenario probabilities are updated regularly
Probabilities
“Good Scenarios”
“Bad Scenarios”
Short-Term (1 year) Probability-Weighted Scenarios
Confidential
Blackstone 10
184 0 92 102 0 70 0 152 195 99 206 202 201 221 3 0 103 120 0 115 99 0 171 146
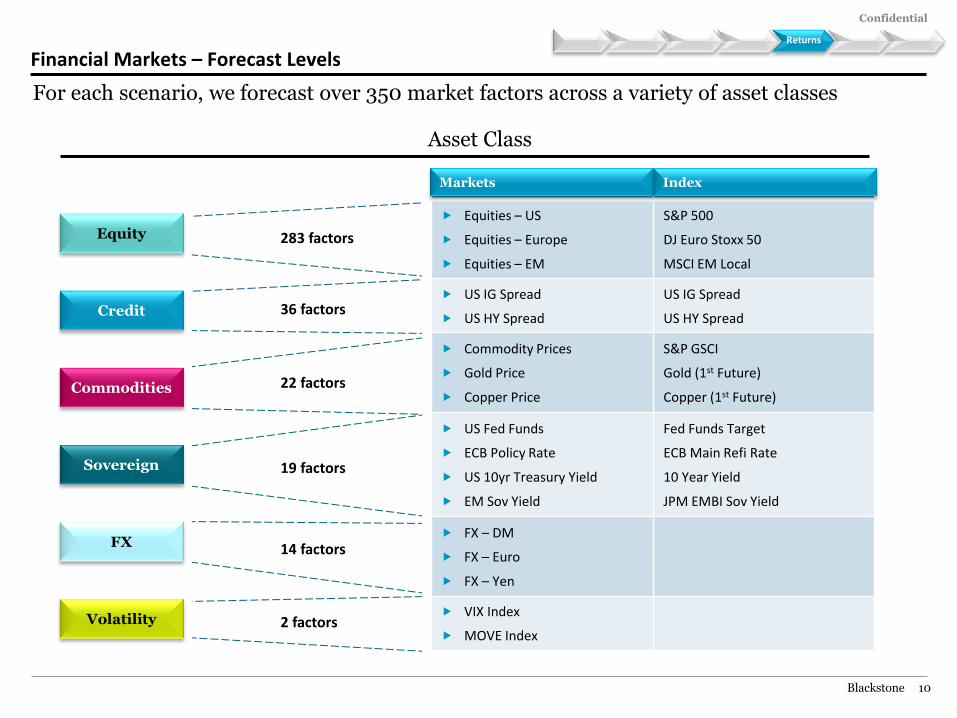
Financial Markets – Forecast Levels
For each scenario, we forecast over 350 market factors across a variety of asset classes
Asset Class
283 factors
22 factors
19 factors
14 factors
2 factors
36 factors
Themes Returns
Equity
Credit
Commodities
Sovereign
FX
Volatility
Markets Index
Equities – US
Equities – Europe
Equities – EM
S&P 500
DJ Euro Stoxx 50
MSCI EM Local
US IG Spread
US HY Spread
US IG Spread
US HY Spread
Commodity Prices
Gold Price
Copper Price
S&P GSCI
Gold (1st Future)
Copper (1st Future)
US Fed Funds
ECB Policy Rate
US 10yr Treasury Yield
EM Sov Yield
Fed Funds Target
ECB Main Refi Rate
10 Year Yield
JPM EMBI Sov Yield
FX – DM
FX – Euro
FX – Yen
VIX Index
MOVE Index
Markets Index
Confidential
Blackstone 11
BEAR BASE BULL
Do
ub
le D
ip H
eav
y
EMU
dis
inte
grat
es
Ch
ina
Bu
st, D
M
Do
wn
De
flat
ion
ary
Slo
g
Do
ub
le D
ip L
igh
t
Stag
flat
ion
Fe
ars
Gre
ece
exi
t
trig
gers
ch
aos
Infl
atio
nar
y
Ove
rhe
atin
g
Euro
pe
Wo
rse
ns
Fin
anci
al H
eal
ing
Mo
de
rate
Gro
wth
QE
Pro
ves
Effe
ctiv
e
Glo
bal
De
cou
plin
g
Ge
rman
y Le
ave
s
Euro
Be
auti
ful I
nfl
atio
n
Ch
ina
Bu
st, D
M U
p
Euro
pe
Imp
rove
s
Ne
w E
con
om
y,
Zero
Infl
atio
n
Pro
bab
ility
-
We
igh
ted
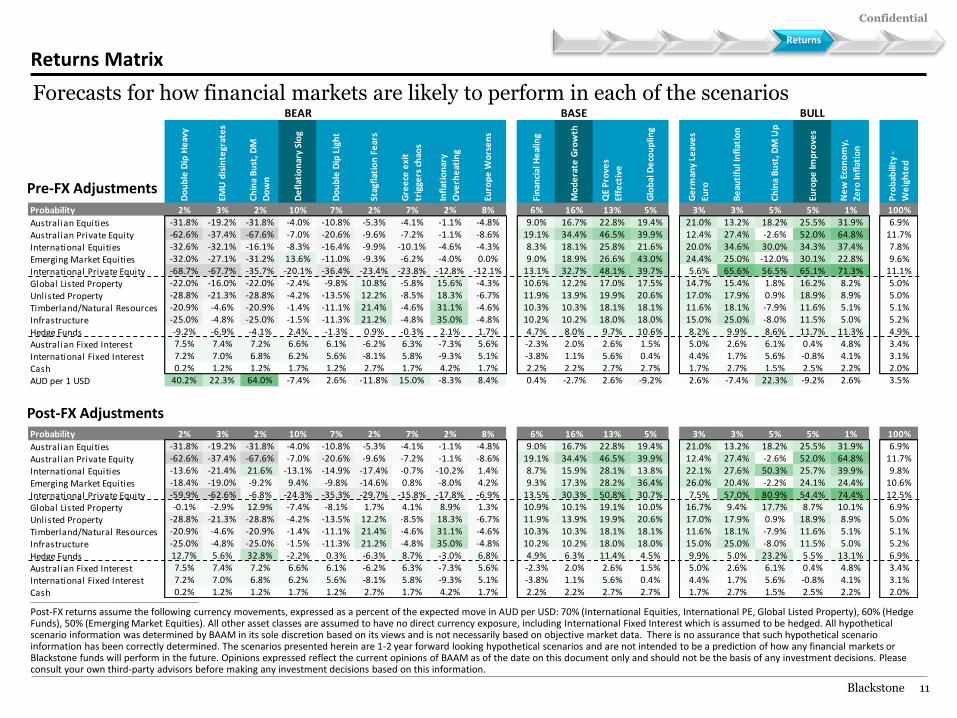
Probability 2% 3% 2% 10% 7% 2% 7% 2% 8% 6% 16% 13% 5% 3% 3% 5% 5% 1% 100%
Australian Equities -31.8% -19.2% -31.8% -4.0% -10.8% -5.3% -4.1% -1.1% -4.8% 9.0% 16.7% 22.8% 19.4% 21.0% 13.2% 18.2% 25.5% 31.9% 6.9%
Australian Private Equity -62.6% -37.4% -67.6% -7.0% -20.6% -9.6% -7.2% -1.1% -8.6% 19.1% 34.4% 46.5% 39.9% 12.4% 27.4% -2.6% 52.0% 64.8% 11.7%
International Equities -32.6% -32.1% -16.1% -8.3% -16.4% -9.9% -10.1% -4.6% -4.3% 8.3% 18.1% 25.8% 21.6% 20.0% 34.6% 30.0% 34.3% 37.4% 7.8%
Emerging Market Equities -32.0% -27.1% -31.2% 13.6% -11.0% -9.3% -6.2% -4.0% 0.0% 9.0% 18.9% 26.6% 43.0% 24.4% 25.0% -12.0% 30.1% 22.8% 9.6%
International Private Equity -68.7% -67.7% -35.7% -20.1% -36.4% -23.4% -23.8% -12.8% -12.1% 13.1% 32.7% 48.1% 39.7% 5.6% 65.6% 56.5% 65.1% 71.3% 11.1%
Global Listed Property -22.0% -16.0% -22.0% -2.4% -9.8% 10.8% -5.8% 15.6% -4.3% 10.6% 12.2% 17.0% 17.5% 14.7% 15.4% 1.8% 16.2% 8.2% 5.0%
Unlisted Property -28.8% -21.3% -28.8% -4.2% -13.5% 12.2% -8.5% 18.3% -6.7% 11.9% 13.9% 19.9% 20.6% 17.0% 17.9% 0.9% 18.9% 8.9% 5.0%
Timberland/Natural Resources -20.9% -4.6% -20.9% -1.4% -11.1% 21.4% -4.6% 31.1% -4.6% 10.3% 10.3% 18.1% 18.1% 11.6% 18.1% -7.9% 11.6% 5.1% 5.1%
Infrastructure -25.0% -4.8% -25.0% -1.5% -11.3% 21.2% -4.8% 35.0% -4.8% 10.2% 10.2% 18.0% 18.0% 15.0% 25.0% -8.0% 11.5% 5.0% 5.2%
Hedge Funds -9.2% -6.9% -4.1% 2.4% -1.3% 0.9% -0.3% 2.1% 1.7% 4.7% 8.0% 9.7% 10.6% 8.2% 9.9% 8.6% 11.7% 11.3% 4.9%
Australian Fixed Interest 7.5% 7.4% 7.2% 6.6% 6.1% -6.2% 6.3% -7.3% 5.6% -2.3% 2.0% 2.6% 1.5% 5.0% 2.6% 6.1% 0.4% 4.8% 3.4%
International Fixed Interest 7.2% 7.0% 6.8% 6.2% 5.6% -8.1% 5.8% -9.3% 5.1% -3.8% 1.1% 5.6% 0.4% 4.4% 1.7% 5.6% -0.8% 4.1% 3.1%
Cash 0.2% 1.2% 1.2% 1.7% 1.2% 2.7% 1.7% 4.2% 1.7% 2.2% 2.2% 2.7% 2.7% 1.7% 2.7% 1.5% 2.5% 2.2% 2.0%
AUD per 1 USD 40.2% 22.3% 64.0% -7.4% 2.6% -11.8% 15.0% -8.3% 8.4% 0.4% -2.7% 2.6% -9.2% 2.6% -7.4% 22.3% -9.2% 2.6% 3.5%
Probability 2% 3% 2% 10% 7% 2% 7% 2% 8% 6% 16% 13% 5% 3% 3% 5% 5% 1% 100%
Australian Equities -31.8% -19.2% -31.8% -4.0% -10.8% -5.3% -4.1% -1.1% -4.8% 9.0% 16.7% 22.8% 19.4% 21.0% 13.2% 18.2% 25.5% 31.9% 6.9%
Australian Private Equity -62.6% -37.4% -67.6% -7.0% -20.6% -9.6% -7.2% -1.1% -8.6% 19.1% 34.4% 46.5% 39.9% 12.4% 27.4% -2.6% 52.0% 64.8% 11.7%
International Equities -13.6% -21.4% 21.6% -13.1% -14.9% -17.4% -0.7% -10.2% 1.4% 8.7% 15.9% 28.1% 13.8% 22.1% 27.6% 50.3% 25.7% 39.9% 9.8%
Emerging Market Equities -18.4% -19.0% -9.2% 9.4% -9.8% -14.6% 0.8% -8.0% 4.2% 9.3% 17.3% 28.2% 36.4% 26.0% 20.4% -2.2% 24.1% 24.4% 10.6%
International Private Equity -59.9% -62.6% -6.8% -24.3% -35.3% -29.7% -15.8% -17.8% -6.9% 13.5% 30.3% 50.8% 30.7% 7.5% 57.0% 80.9% 54.4% 74.4% 12.5%
Global Listed Property -0.1% -2.9% 12.9% -7.4% -8.1% 1.7% 4.1% 8.9% 1.3% 10.9% 10.1% 19.1% 10.0% 16.7% 9.4% 17.7% 8.7% 10.1% 6.9%
Unlisted Property -28.8% -21.3% -28.8% -4.2% -13.5% 12.2% -8.5% 18.3% -6.7% 11.9% 13.9% 19.9% 20.6% 17.0% 17.9% 0.9% 18.9% 8.9% 5.0%
Timberland/Natural Resources -20.9% -4.6% -20.9% -1.4% -11.1% 21.4% -4.6% 31.1% -4.6% 10.3% 10.3% 18.1% 18.1% 11.6% 18.1% -7.9% 11.6% 5.1% 5.1%
Infrastructure -25.0% -4.8% -25.0% -1.5% -11.3% 21.2% -4.8% 35.0% -4.8% 10.2% 10.2% 18.0% 18.0% 15.0% 25.0% -8.0% 11.5% 5.0% 5.2%
Hedge Funds 12.7% 5.6% 32.8% -2.2% 0.3% -6.3% 8.7% -3.0% 6.8% 4.9% 6.3% 11.4% 4.5% 9.9% 5.0% 23.2% 5.5% 13.1% 6.9%
Australian Fixed Interest 7.5% 7.4% 7.2% 6.6% 6.1% -6.2% 6.3% -7.3% 5.6% -2.3% 2.0% 2.6% 1.5% 5.0% 2.6% 6.1% 0.4% 4.8% 3.4%
International Fixed Interest 7.2% 7.0% 6.8% 6.2% 5.6% -8.1% 5.8% -9.3% 5.1% -3.8% 1.1% 5.6% 0.4% 4.4% 1.7% 5.6% -0.8% 4.1% 3.1%
Cash 0.2% 1.2% 1.2% 1.7% 1.2% 2.7% 1.7% 4.2% 1.7% 2.2% 2.2% 2.7% 2.7% 1.7% 2.7% 1.5% 2.5% 2.2% 2.0%
Returns Matrix
________________________________________________
Post-FX returns assume the following currency movements, expressed as a percent of the expected move in AUD per USD: 70% (International Equities, International PE, Global Listed Property), 60% (Hedge Funds), 50% (Emerging Market Equities). All other asset classes are assumed to have no direct currency exposure, including International Fixed Interest which is assumed to be hedged. All hypothetical scenario information was determined by BAAM in its sole discretion based on its views and is not necessarily based on objective market data. There is no assurance that such hypothetical scenario information has been correctly determined. The scenarios presented herein are 1-2 year forward looking hypothetical scenarios and are not intended to be a prediction of how any financial markets or Blackstone funds will perform in the future. Opinions expressed reflect the current opinions of BAAM as of the date on this document only and should not be the basis of any investment decisions. Please consult your own third-party advisors before making any investment decisions based on this information.
Pre-FX Adjustments
Post-FX Adjustments
Forecasts for how financial markets are likely to perform in each of the scenarios
Themes Returns
Confidential
Blackstone 12
184 0 92 102 0 70 0 152 195 99 206 202 201 221 3 0 103 120 0 115 99 0 171 146
-40%
-35%
-30%
-25%
-20%
-15%
-10%
-5%
0%
5%
10%
15%
-10% -5% 0% 5% 10%
Uti
lity
Return
Lambda = 0 (risk neutral, straightline)
Lambda = 5
Lambda = 15
Lambda = 25 (very risk averse,very curved)
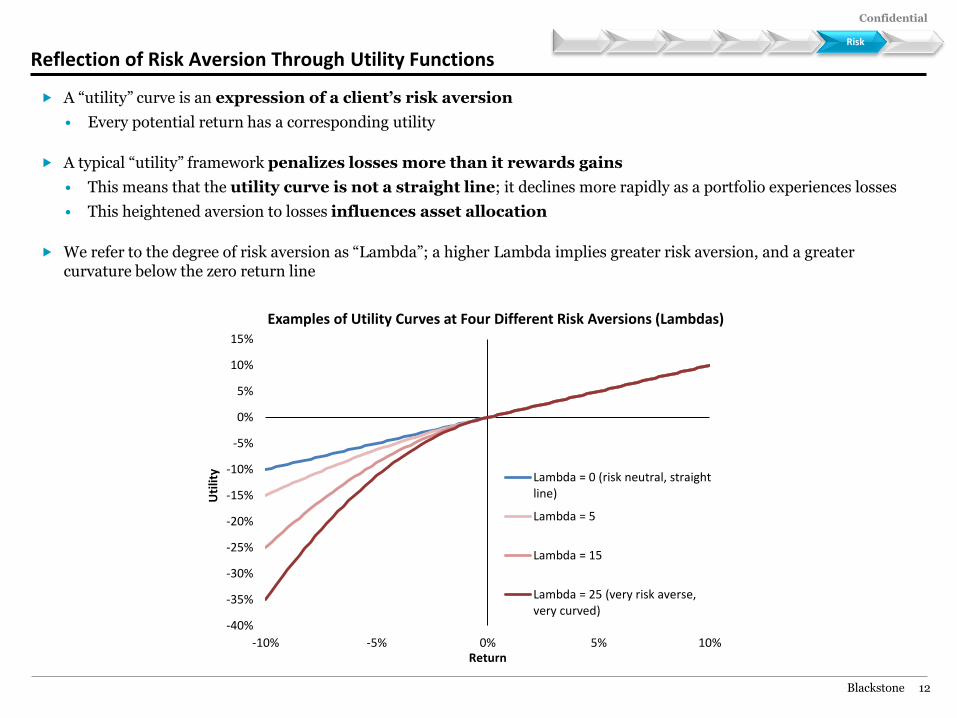
Reflection of Risk Aversion Through Utility Functions
A “utility” curve is an expression of a client’s risk aversion
• Every potential return has a corresponding utility
A typical “utility” framework penalizes losses more than it rewards gains
• This means that the utility curve is not a straight line; it declines more rapidly as a portfolio experiences losses
• This heightened aversion to losses influences asset allocation
We refer to the degree of risk aversion as “Lambda”; a higher Lambda implies greater risk aversion, and a greater curvature below the zero return line
6 Themes Risk
Examples of Utility Curves at Four Different Risk Aversions (Lambdas)
Confidential
Blackstone 13
184 0 92 102 0 70 0 152 195 99 206 202 201 221 3 0 103 120 0 115 99 0 171 146
0 2 5 8 10 15 25 50 100
-2% 1x 1.04x 1.1x 1.16x 1.2x 1.3x 1.5x 2x 3x
-5% 1x 1.1x 1.25x 1.4x 1.5x 1.75x 2.25x 3.5x 6x
-10% 1x 1.2x 1.5x 1.8x 2x 2.5x 3.5x 6x 11x
Risk Aversion (λ)
Re
turn
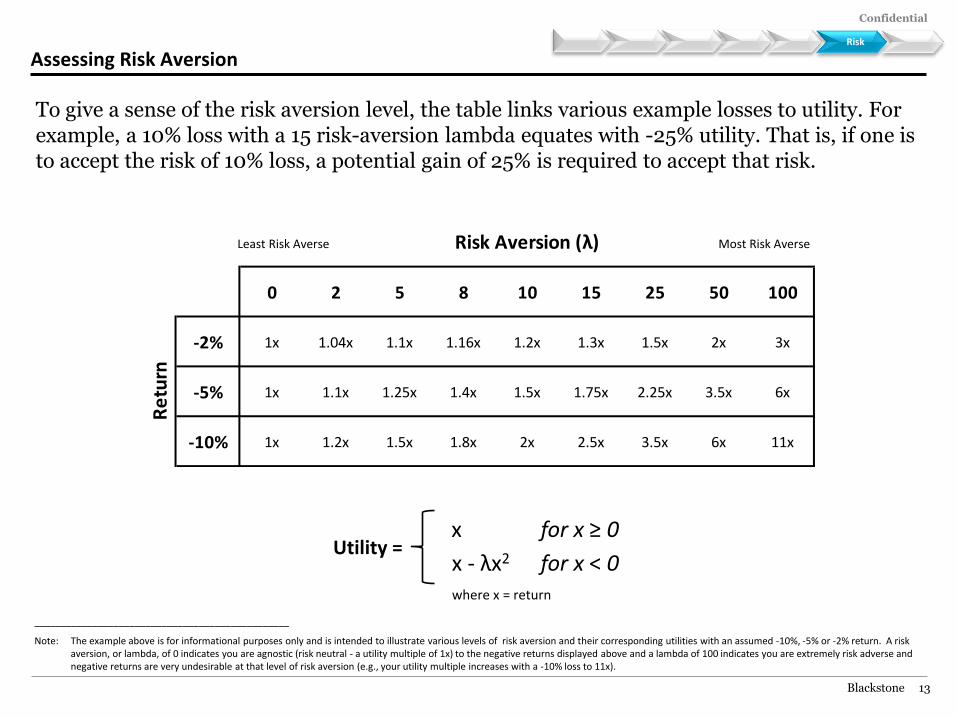
Assessing Risk Aversion
To give a sense of the risk aversion level, the table links various example losses to utility. For example, a 10% loss with a 15 risk-aversion lambda equates with -25% utility. That is, if one is to accept the risk of 10% loss, a potential gain of 25% is required to accept that risk.
________________________________________________
Note: The example above is for informational purposes only and is intended to illustrate various levels of risk aversion and their corresponding utilities with an assumed -10%, -5% or -2% return. A risk aversion, or lambda, of 0 indicates you are agnostic (risk neutral - a utility multiple of 1x) to the negative returns displayed above and a lambda of 100 indicates you are extremely risk adverse and negative returns are very undesirable at that level of risk aversion (e.g., your utility multiple increases with a -10% loss to 11x).
Least Risk Averse Most Risk Averse
Utility = x for x ≥ 0
for x < 0 x - λx2
where x = return
6 Themes Risk
Confidential
Blackstone 14
184 0 92 102 0 70 0 152 195 99 206 202 201 221 3 0 103 120 0 115 99 0 171 146
- 0% +
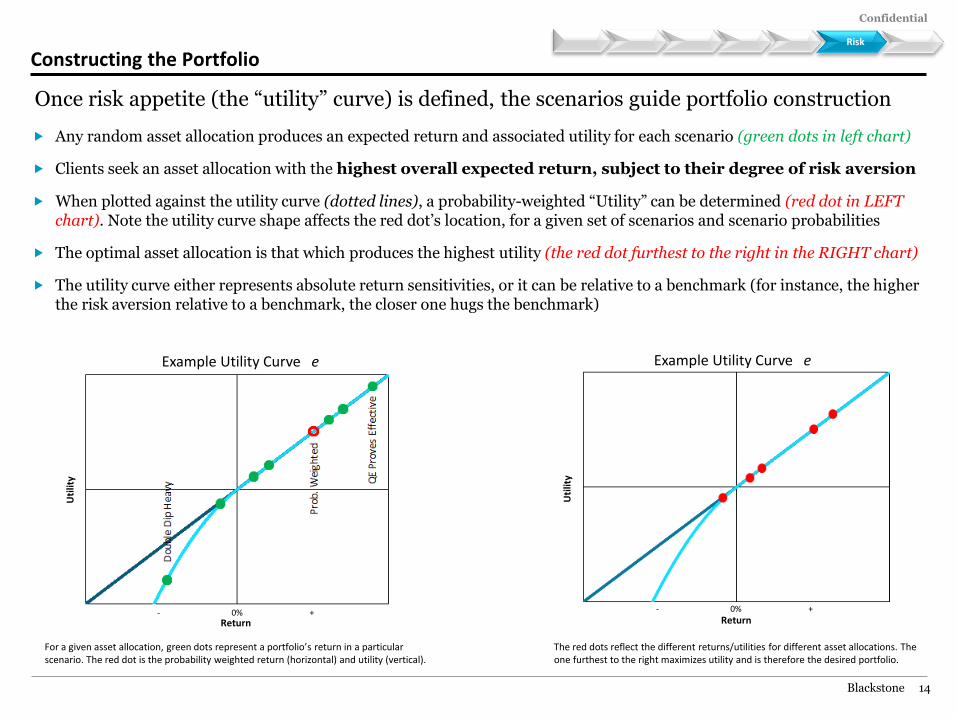
Constructing the Portfolio
Any random asset allocation produces an expected return and associated utility for each scenario (green dots in left chart)
Clients seek an asset allocation with the highest overall expected return, subject to their degree of risk aversion
When plotted against the utility curve (dotted lines), a probability-weighted “Utility” can be determined (red dot in LEFT chart). Note the utility curve shape affects the red dot’s location, for a given set of scenarios and scenario probabilities
The optimal asset allocation is that which produces the highest utility (the red dot furthest to the right in the RIGHT chart)
The utility curve either represents absolute return sensitivities, or it can be relative to a benchmark (for instance, the higher the risk aversion relative to a benchmark, the closer one hugs the benchmark)
Once risk appetite (the “utility” curve) is defined, the scenarios guide portfolio construction
Example Utility Curve e
6 Themes Risk
For a given asset allocation, green dots represent a portfolio’s return in a particular scenario. The red dot is the probability weighted return (horizontal) and utility (vertical).
The red dots reflect the different returns/utilities for different asset allocations. The one furthest to the right maximizes utility and is therefore the desired portfolio.
Uti
lity
Uti
lity
Return Return - 0% +
Example Utility Curve e
II. Insights from Our Views and Framework for Australian Portfolios
Allocations
Decisions
Confidential
Blackstone 16
184 0 92 102 0 70 0 152 195 99 206 202 201 221 3 0 103 120 0 115 99 0 171 146
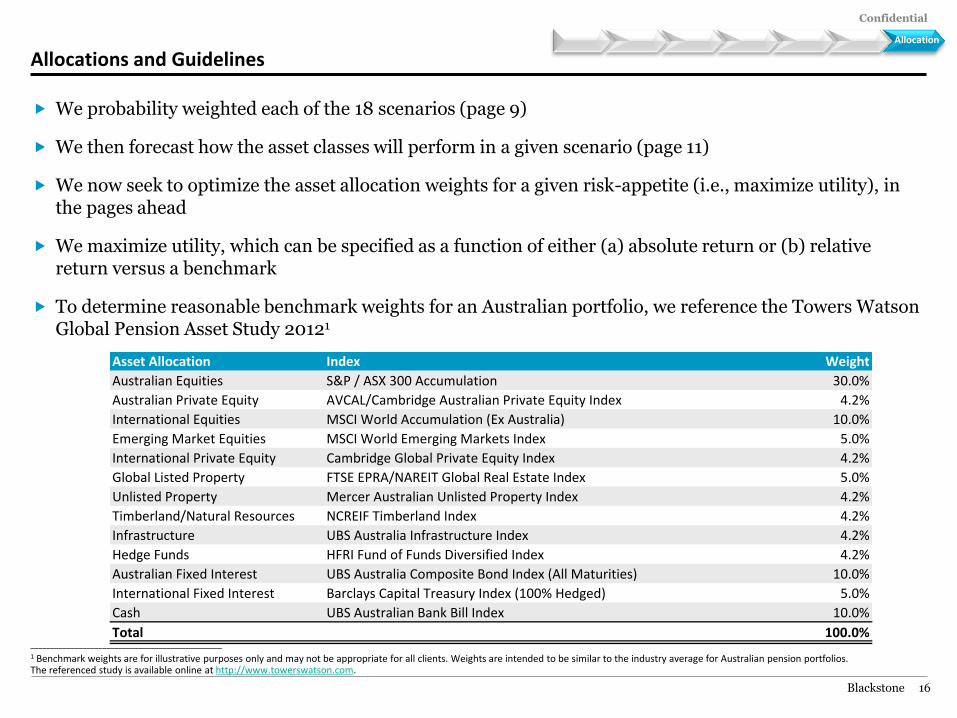
Asset Allocation Index Weight
Australian Equities S&P / ASX 300 Accumulation 30.0%
Australian Private Equity AVCAL/Cambridge Australian Private Equity Index 4.2%
International Equities MSCI World Accumulation (Ex Australia) 10.0%
Emerging Market Equities MSCI World Emerging Markets Index 5.0%
International Private Equity Cambridge Global Private Equity Index 4.2%
Global Listed Property FTSE EPRA/NAREIT Global Real Estate Index 5.0%
Unlisted Property Mercer Australian Unlisted Property Index 4.2%
Timberland/Natural Resources NCREIF Timberland Index 4.2%
Infrastructure UBS Australia Infrastructure Index 4.2%
Hedge Funds HFRI Fund of Funds Diversified Index 4.2%
Australian Fixed Interest UBS Australia Composite Bond Index (All Maturities) 10.0%
International Fixed Interest Barclays Capital Treasury Index (100% Hedged) 5.0%
Cash UBS Australian Bank Bill Index 10.0%
Total 100.0%
Allocations and Guidelines
We probability weighted each of the 18 scenarios (page 9)
We then forecast how the asset classes will perform in a given scenario (page 11)
We now seek to optimize the asset allocation weights for a given risk-appetite (i.e., maximize utility), in the pages ahead
We maximize utility, which can be specified as a function of either (a) absolute return or (b) relative return versus a benchmark
To determine reasonable benchmark weights for an Australian portfolio, we reference the Towers Watson Global Pension Asset Study 20121
________________________________________________
1 Benchmark weights are for illustrative purposes only and may not be appropriate for all clients. Weights are intended to be similar to the industry average for Australian pension portfolios. The referenced study is available online at http://www.towerswatson.com.
Allocation
Confidential
Blackstone 17
184 0 92 102 0 70 0 152 195 99 206 202 201 221 3 0 103 120 0 115 99 0 171 146
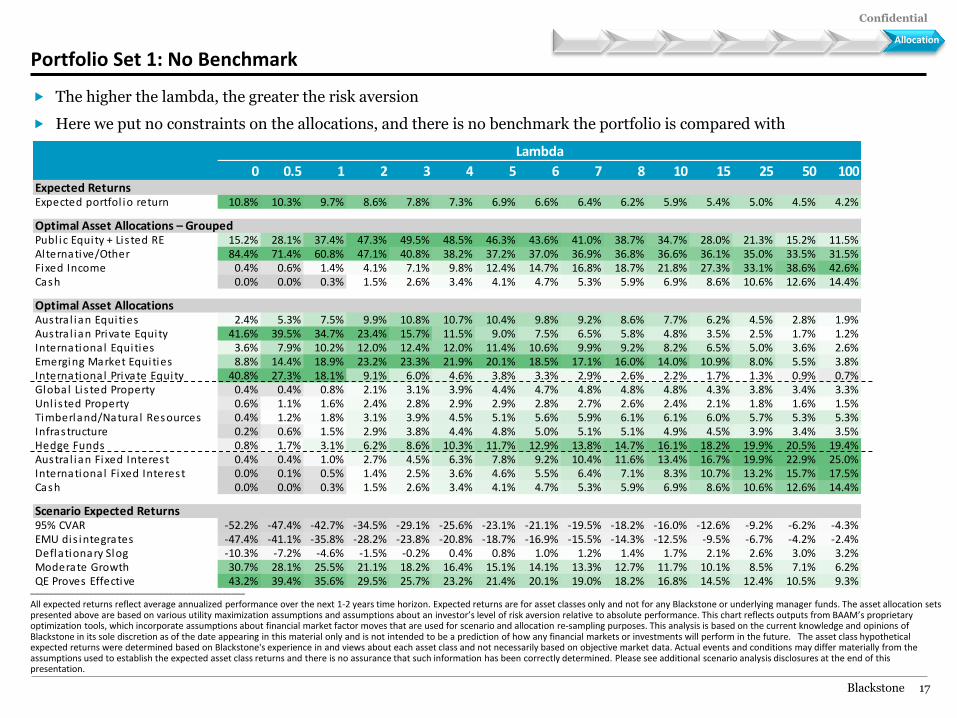
Lambda
0 0.5 1 2 3 4 5 6 7 8 10 15 25 50 100Expected ReturnsExpected portfol io return 10.8% 10.3% 9.7% 8.6% 7.8% 7.3% 6.9% 6.6% 6.4% 6.2% 5.9% 5.4% 5.0% 4.5% 4.2%
Optimal Asset Allocations – GroupedPubl ic Equity + Lis ted RE 15.2% 28.1% 37.4% 47.3% 49.5% 48.5% 46.3% 43.6% 41.0% 38.7% 34.7% 28.0% 21.3% 15.2% 11.5%Alternative/Other 84.4% 71.4% 60.8% 47.1% 40.8% 38.2% 37.2% 37.0% 36.9% 36.8% 36.6% 36.1% 35.0% 33.5% 31.5%Fixed Income 0.4% 0.6% 1.4% 4.1% 7.1% 9.8% 12.4% 14.7% 16.8% 18.7% 21.8% 27.3% 33.1% 38.6% 42.6%Cash 0.0% 0.0% 0.3% 1.5% 2.6% 3.4% 4.1% 4.7% 5.3% 5.9% 6.9% 8.6% 10.6% 12.6% 14.4%
Optimal Asset AllocationsAustra l ian Equities 2.4% 5.3% 7.5% 9.9% 10.8% 10.7% 10.4% 9.8% 9.2% 8.6% 7.7% 6.2% 4.5% 2.8% 1.9%Austra l ian Private Equity 41.6% 39.5% 34.7% 23.4% 15.7% 11.5% 9.0% 7.5% 6.5% 5.8% 4.8% 3.5% 2.5% 1.7% 1.2%International Equities 3.6% 7.9% 10.2% 12.0% 12.4% 12.0% 11.4% 10.6% 9.9% 9.2% 8.2% 6.5% 5.0% 3.6% 2.6%Emerging Market Equities 8.8% 14.4% 18.9% 23.2% 23.3% 21.9% 20.1% 18.5% 17.1% 16.0% 14.0% 10.9% 8.0% 5.5% 3.8%International Private Equity 40.8% 27.3% 18.1% 9.1% 6.0% 4.6% 3.8% 3.3% 2.9% 2.6% 2.2% 1.7% 1.3% 0.9% 0.7%Global Lis ted Property 0.4% 0.4% 0.8% 2.1% 3.1% 3.9% 4.4% 4.7% 4.8% 4.8% 4.8% 4.3% 3.8% 3.4% 3.3%Unl is ted Property 0.6% 1.1% 1.6% 2.4% 2.8% 2.9% 2.9% 2.8% 2.7% 2.6% 2.4% 2.1% 1.8% 1.6% 1.5%Timberland/Natura l Resources 0.4% 1.2% 1.8% 3.1% 3.9% 4.5% 5.1% 5.6% 5.9% 6.1% 6.1% 6.0% 5.7% 5.3% 5.3%Infrastructure 0.2% 0.6% 1.5% 2.9% 3.8% 4.4% 4.8% 5.0% 5.1% 5.1% 4.9% 4.5% 3.9% 3.4% 3.5%Hedge Funds 0.8% 1.7% 3.1% 6.2% 8.6% 10.3% 11.7% 12.9% 13.8% 14.7% 16.1% 18.2% 19.9% 20.5% 19.4%Austra l ian Fixed Interest 0.4% 0.4% 1.0% 2.7% 4.5% 6.3% 7.8% 9.2% 10.4% 11.6% 13.4% 16.7% 19.9% 22.9% 25.0%International Fixed Interest 0.0% 0.1% 0.5% 1.4% 2.5% 3.6% 4.6% 5.5% 6.4% 7.1% 8.3% 10.7% 13.2% 15.7% 17.5%Cash 0.0% 0.0% 0.3% 1.5% 2.6% 3.4% 4.1% 4.7% 5.3% 5.9% 6.9% 8.6% 10.6% 12.6% 14.4%
Scenario Expected Returns95% CVAR -52.2% -47.4% -42.7% -34.5% -29.1% -25.6% -23.1% -21.1% -19.5% -18.2% -16.0% -12.6% -9.2% -6.2% -4.3%EMU dis integrates -47.4% -41.1% -35.8% -28.2% -23.8% -20.8% -18.7% -16.9% -15.5% -14.3% -12.5% -9.5% -6.7% -4.2% -2.4%Deflationary Slog -10.3% -7.2% -4.6% -1.5% -0.2% 0.4% 0.8% 1.0% 1.2% 1.4% 1.7% 2.1% 2.6% 3.0% 3.2%Moderate Growth 30.7% 28.1% 25.5% 21.1% 18.2% 16.4% 15.1% 14.1% 13.3% 12.7% 11.7% 10.1% 8.5% 7.1% 6.2%QE Proves Effective 43.2% 39.4% 35.6% 29.5% 25.7% 23.2% 21.4% 20.1% 19.0% 18.2% 16.8% 14.5% 12.4% 10.5% 9.3%
Portfolio Set 1: No Benchmark
The higher the lambda, the greater the risk aversion
Here we put no constraints on the allocations, and there is no benchmark the portfolio is compared with
Allocation
________________________________________________
All expected returns reflect average annualized performance over the next 1-2 years time horizon. Expected returns are for asset classes only and not for any Blackstone or underlying manager funds. The asset allocation sets presented above are based on various utility maximization assumptions and assumptions about an investor’s level of risk aversion relative to absolute performance. This chart reflects outputs from BAAM’s proprietary optimization tools, which incorporate assumptions about financial market factor moves that are used for scenario and allocation re-sampling purposes. This analysis is based on the current knowledge and opinions of Blackstone in its sole discretion as of the date appearing in this material only and is not intended to be a prediction of how any financial markets or investments will perform in the future. The asset class hypothetical expected returns were determined based on Blackstone's experience in and views about each asset class and not necessarily based on objective market data. Actual events and conditions may differ materially from the assumptions used to establish the expected asset class returns and there is no assurance that such information has been correctly determined. Please see additional scenario analysis disclosures at the end of this presentation.
Confidential
Blackstone 18
184 0 92 102 0 70 0 152 195 99 206 202 201 221 3 0 103 120 0 115 99 0 171 146
Accounting for additional potential shocks in less transparent asset classes
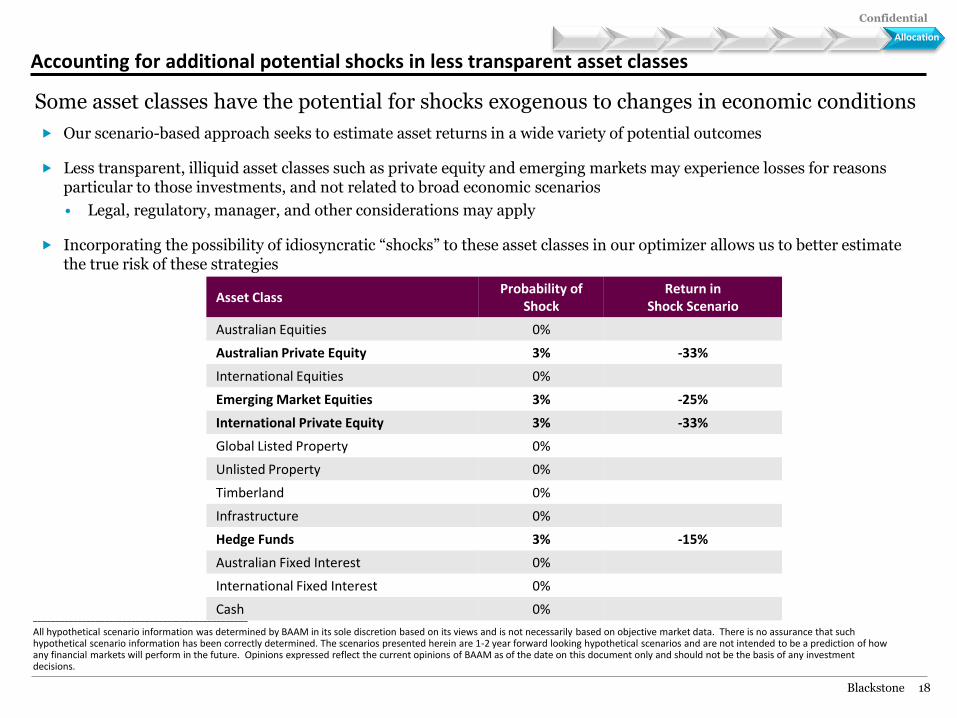
Our scenario-based approach seeks to estimate asset returns in a wide variety of potential outcomes
Less transparent, illiquid asset classes such as private equity and emerging markets may experience losses for reasons particular to those investments, and not related to broad economic scenarios
• Legal, regulatory, manager, and other considerations may apply
Incorporating the possibility of idiosyncratic “shocks” to these asset classes in our optimizer allows us to better estimate the true risk of these strategies
Some asset classes have the potential for shocks exogenous to changes in economic conditions
Asset Class Probability of
Shock Return in
Shock Scenario
Australian Equities 0%
Australian Private Equity 3% -33%
International Equities 0%
Emerging Market Equities 3% -25%
International Private Equity 3% -33%
Global Listed Property 0%
Unlisted Property 0%
Timberland 0%
Infrastructure 0%
Hedge Funds 3% -15%
Australian Fixed Interest 0%
International Fixed Interest 0%
Cash 0%
Allocation
________________________________________________
All hypothetical scenario information was determined by BAAM in its sole discretion based on its views and is not necessarily based on objective market data. There is no assurance that such hypothetical scenario information has been correctly determined. The scenarios presented herein are 1-2 year forward looking hypothetical scenarios and are not intended to be a prediction of how any financial markets will perform in the future. Opinions expressed reflect the current opinions of BAAM as of the date on this document only and should not be the basis of any investment decisions.
Confidential
Blackstone 19
184 0 92 102 0 70 0 152 195 99 206 202 201 221 3 0 103 120 0 115 99 0 171 146
Lambda
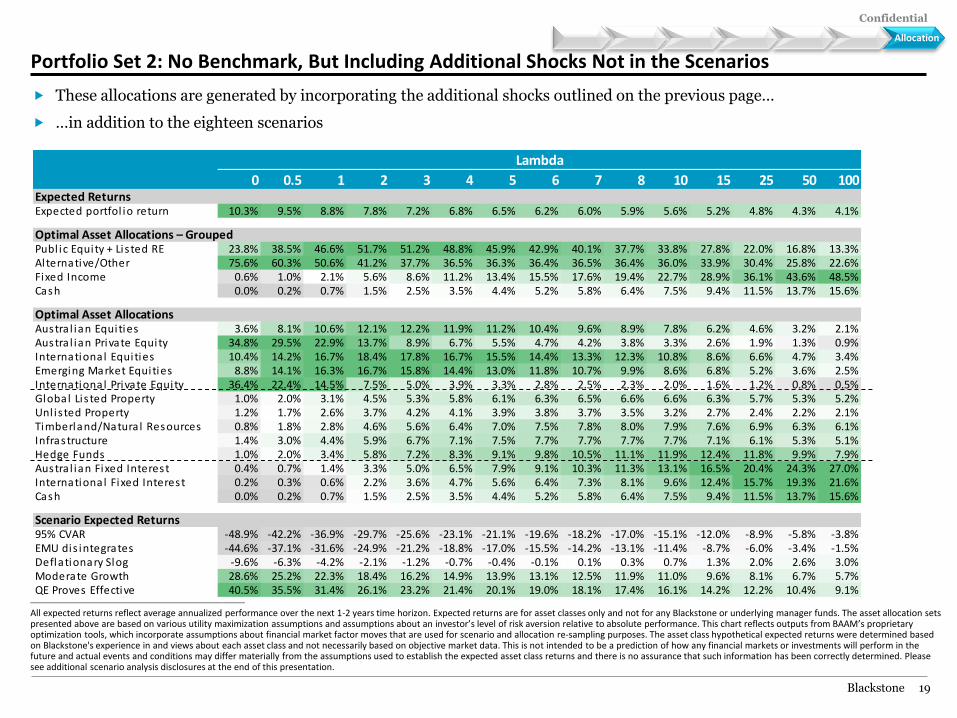
0 0.5 1 2 3 4 5 6 7 8 10 15 25 50 100Expected ReturnsExpected portfol io return 10.3% 9.5% 8.8% 7.8% 7.2% 6.8% 6.5% 6.2% 6.0% 5.9% 5.6% 5.2% 4.8% 4.3% 4.1%
Optimal Asset Allocations – GroupedPubl ic Equity + Lis ted RE 23.8% 38.5% 46.6% 51.7% 51.2% 48.8% 45.9% 42.9% 40.1% 37.7% 33.8% 27.8% 22.0% 16.8% 13.3%Alternative/Other 75.6% 60.3% 50.6% 41.2% 37.7% 36.5% 36.3% 36.4% 36.5% 36.4% 36.0% 33.9% 30.4% 25.8% 22.6%Fixed Income 0.6% 1.0% 2.1% 5.6% 8.6% 11.2% 13.4% 15.5% 17.6% 19.4% 22.7% 28.9% 36.1% 43.6% 48.5%Cash 0.0% 0.2% 0.7% 1.5% 2.5% 3.5% 4.4% 5.2% 5.8% 6.4% 7.5% 9.4% 11.5% 13.7% 15.6%
Optimal Asset AllocationsAustra l ian Equities 3.6% 8.1% 10.6% 12.1% 12.2% 11.9% 11.2% 10.4% 9.6% 8.9% 7.8% 6.2% 4.6% 3.2% 2.1%Austra l ian Private Equity 34.8% 29.5% 22.9% 13.7% 8.9% 6.7% 5.5% 4.7% 4.2% 3.8% 3.3% 2.6% 1.9% 1.3% 0.9%International Equities 10.4% 14.2% 16.7% 18.4% 17.8% 16.7% 15.5% 14.4% 13.3% 12.3% 10.8% 8.6% 6.6% 4.7% 3.4%Emerging Market Equities 8.8% 14.1% 16.3% 16.7% 15.8% 14.4% 13.0% 11.8% 10.7% 9.9% 8.6% 6.8% 5.2% 3.6% 2.5%International Private Equity 36.4% 22.4% 14.5% 7.5% 5.0% 3.9% 3.3% 2.8% 2.5% 2.3% 2.0% 1.6% 1.2% 0.8% 0.5%Global Lis ted Property 1.0% 2.0% 3.1% 4.5% 5.3% 5.8% 6.1% 6.3% 6.5% 6.6% 6.6% 6.3% 5.7% 5.3% 5.2%Unl is ted Property 1.2% 1.7% 2.6% 3.7% 4.2% 4.1% 3.9% 3.8% 3.7% 3.5% 3.2% 2.7% 2.4% 2.2% 2.1%Timberland/Natura l Resources 0.8% 1.8% 2.8% 4.6% 5.6% 6.4% 7.0% 7.5% 7.8% 8.0% 7.9% 7.6% 6.9% 6.3% 6.1%Infrastructure 1.4% 3.0% 4.4% 5.9% 6.7% 7.1% 7.5% 7.7% 7.7% 7.7% 7.7% 7.1% 6.1% 5.3% 5.1%Hedge Funds 1.0% 2.0% 3.4% 5.8% 7.2% 8.3% 9.1% 9.8% 10.5% 11.1% 11.9% 12.4% 11.8% 9.9% 7.9%Austra l ian Fixed Interest 0.4% 0.7% 1.4% 3.3% 5.0% 6.5% 7.9% 9.1% 10.3% 11.3% 13.1% 16.5% 20.4% 24.3% 27.0%International Fixed Interest 0.2% 0.3% 0.6% 2.2% 3.6% 4.7% 5.6% 6.4% 7.3% 8.1% 9.6% 12.4% 15.7% 19.3% 21.6%Cash 0.0% 0.2% 0.7% 1.5% 2.5% 3.5% 4.4% 5.2% 5.8% 6.4% 7.5% 9.4% 11.5% 13.7% 15.6%
Scenario Expected Returns95% CVAR -48.9% -42.2% -36.9% -29.7% -25.6% -23.1% -21.1% -19.6% -18.2% -17.0% -15.1% -12.0% -8.9% -5.8% -3.8%EMU dis integrates -44.6% -37.1% -31.6% -24.9% -21.2% -18.8% -17.0% -15.5% -14.2% -13.1% -11.4% -8.7% -6.0% -3.4% -1.5%Deflationary Slog -9.6% -6.3% -4.2% -2.1% -1.2% -0.7% -0.4% -0.1% 0.1% 0.3% 0.7% 1.3% 2.0% 2.6% 3.0%Moderate Growth 28.6% 25.2% 22.3% 18.4% 16.2% 14.9% 13.9% 13.1% 12.5% 11.9% 11.0% 9.6% 8.1% 6.7% 5.7%QE Proves Effective 40.5% 35.5% 31.4% 26.1% 23.2% 21.4% 20.1% 19.0% 18.1% 17.4% 16.1% 14.2% 12.2% 10.4% 9.1%
Portfolio Set 2: No Benchmark, But Including Additional Shocks Not in the Scenarios
These allocations are generated by incorporating the additional shocks outlined on the previous page…
…in addition to the eighteen scenarios
Allocation
________________________________________________
All expected returns reflect average annualized performance over the next 1-2 years time horizon. Expected returns are for asset classes only and not for any Blackstone or underlying manager funds. The asset allocation sets presented above are based on various utility maximization assumptions and assumptions about an investor’s level of risk aversion relative to absolute performance. This chart reflects outputs from BAAM’s proprietary optimization tools, which incorporate assumptions about financial market factor moves that are used for scenario and allocation re-sampling purposes. The asset class hypothetical expected returns were determined based on Blackstone's experience in and views about each asset class and not necessarily based on objective market data. This is not intended to be a prediction of how any financial markets or investments will perform in the future and actual events and conditions may differ materially from the assumptions used to establish the expected asset class returns and there is no assurance that such information has been correctly determined. Please see additional scenario analysis disclosures at the end of this presentation.
Confidential
Blackstone 20
184 0 92 102 0 70 0 152 195 99 206 202 201 221 3 0 103 120 0 115 99 0 171 146
Lambda
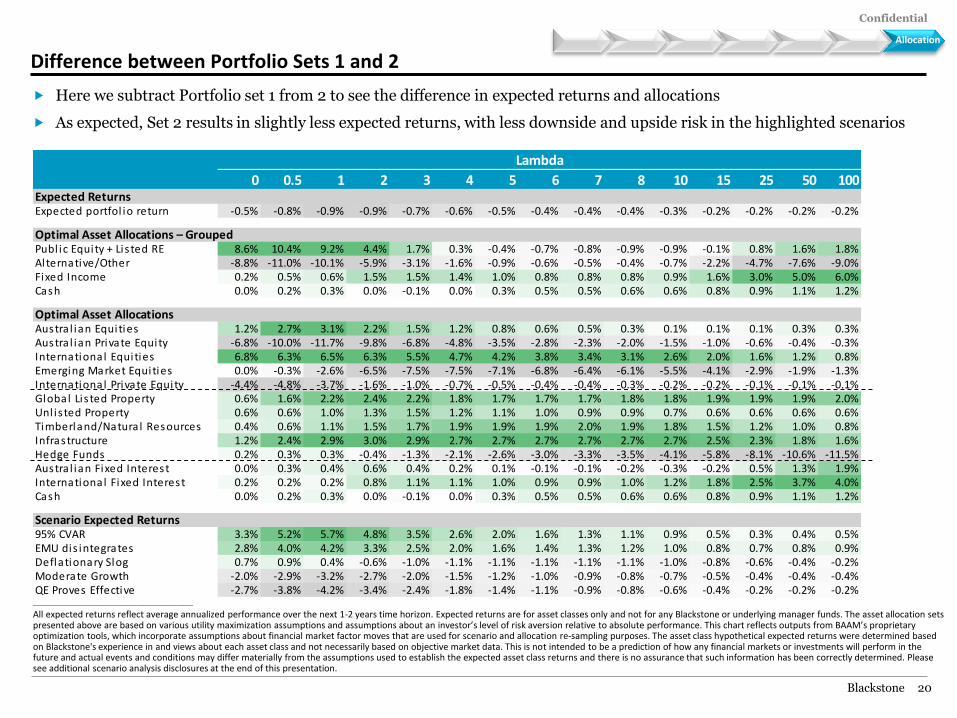
0 0.5 1 2 3 4 5 6 7 8 10 15 25 50 100Expected ReturnsExpected portfol io return -0.5% -0.8% -0.9% -0.9% -0.7% -0.6% -0.5% -0.4% -0.4% -0.4% -0.3% -0.2% -0.2% -0.2% -0.2%
Optimal Asset Allocations – GroupedPubl ic Equity + Lis ted RE 8.6% 10.4% 9.2% 4.4% 1.7% 0.3% -0.4% -0.7% -0.8% -0.9% -0.9% -0.1% 0.8% 1.6% 1.8%Alternative/Other -8.8% -11.0% -10.1% -5.9% -3.1% -1.6% -0.9% -0.6% -0.5% -0.4% -0.7% -2.2% -4.7% -7.6% -9.0%Fixed Income 0.2% 0.5% 0.6% 1.5% 1.5% 1.4% 1.0% 0.8% 0.8% 0.8% 0.9% 1.6% 3.0% 5.0% 6.0%Cash 0.0% 0.2% 0.3% 0.0% -0.1% 0.0% 0.3% 0.5% 0.5% 0.6% 0.6% 0.8% 0.9% 1.1% 1.2%
Optimal Asset AllocationsAustra l ian Equities 1.2% 2.7% 3.1% 2.2% 1.5% 1.2% 0.8% 0.6% 0.5% 0.3% 0.1% 0.1% 0.1% 0.3% 0.3%Austra l ian Private Equity -6.8% -10.0% -11.7% -9.8% -6.8% -4.8% -3.5% -2.8% -2.3% -2.0% -1.5% -1.0% -0.6% -0.4% -0.3%International Equities 6.8% 6.3% 6.5% 6.3% 5.5% 4.7% 4.2% 3.8% 3.4% 3.1% 2.6% 2.0% 1.6% 1.2% 0.8%Emerging Market Equities 0.0% -0.3% -2.6% -6.5% -7.5% -7.5% -7.1% -6.8% -6.4% -6.1% -5.5% -4.1% -2.9% -1.9% -1.3%International Private Equity -4.4% -4.8% -3.7% -1.6% -1.0% -0.7% -0.5% -0.4% -0.4% -0.3% -0.2% -0.2% -0.1% -0.1% -0.1%Global Lis ted Property 0.6% 1.6% 2.2% 2.4% 2.2% 1.8% 1.7% 1.7% 1.7% 1.8% 1.8% 1.9% 1.9% 1.9% 2.0%Unl is ted Property 0.6% 0.6% 1.0% 1.3% 1.5% 1.2% 1.1% 1.0% 0.9% 0.9% 0.7% 0.6% 0.6% 0.6% 0.6%Timberland/Natura l Resources 0.4% 0.6% 1.1% 1.5% 1.7% 1.9% 1.9% 1.9% 2.0% 1.9% 1.8% 1.5% 1.2% 1.0% 0.8%Infrastructure 1.2% 2.4% 2.9% 3.0% 2.9% 2.7% 2.7% 2.7% 2.7% 2.7% 2.7% 2.5% 2.3% 1.8% 1.6%Hedge Funds 0.2% 0.3% 0.3% -0.4% -1.3% -2.1% -2.6% -3.0% -3.3% -3.5% -4.1% -5.8% -8.1% -10.6% -11.5%Austra l ian Fixed Interest 0.0% 0.3% 0.4% 0.6% 0.4% 0.2% 0.1% -0.1% -0.1% -0.2% -0.3% -0.2% 0.5% 1.3% 1.9%International Fixed Interest 0.2% 0.2% 0.2% 0.8% 1.1% 1.1% 1.0% 0.9% 0.9% 1.0% 1.2% 1.8% 2.5% 3.7% 4.0%Cash 0.0% 0.2% 0.3% 0.0% -0.1% 0.0% 0.3% 0.5% 0.5% 0.6% 0.6% 0.8% 0.9% 1.1% 1.2%
Scenario Expected Returns95% CVAR 3.3% 5.2% 5.7% 4.8% 3.5% 2.6% 2.0% 1.6% 1.3% 1.1% 0.9% 0.5% 0.3% 0.4% 0.5%EMU dis integrates 2.8% 4.0% 4.2% 3.3% 2.5% 2.0% 1.6% 1.4% 1.3% 1.2% 1.0% 0.8% 0.7% 0.8% 0.9%Deflationary Slog 0.7% 0.9% 0.4% -0.6% -1.0% -1.1% -1.1% -1.1% -1.1% -1.1% -1.0% -0.8% -0.6% -0.4% -0.2%Moderate Growth -2.0% -2.9% -3.2% -2.7% -2.0% -1.5% -1.2% -1.0% -0.9% -0.8% -0.7% -0.5% -0.4% -0.4% -0.4%QE Proves Effective -2.7% -3.8% -4.2% -3.4% -2.4% -1.8% -1.4% -1.1% -0.9% -0.8% -0.6% -0.4% -0.2% -0.2% -0.2%
Difference between Portfolio Sets 1 and 2
Here we subtract Portfolio set 1 from 2 to see the difference in expected returns and allocations
As expected, Set 2 results in slightly less expected returns, with less downside and upside risk in the highlighted scenarios
Allocation
________________________________________________
All expected returns reflect average annualized performance over the next 1-2 years time horizon. Expected returns are for asset classes only and not for any Blackstone or underlying manager funds. The asset allocation sets presented above are based on various utility maximization assumptions and assumptions about an investor’s level of risk aversion relative to absolute performance. This chart reflects outputs from BAAM’s proprietary optimization tools, which incorporate assumptions about financial market factor moves that are used for scenario and allocation re-sampling purposes. The asset class hypothetical expected returns were determined based on Blackstone's experience in and views about each asset class and not necessarily based on objective market data. This is not intended to be a prediction of how any financial markets or investments will perform in the future and actual events and conditions may differ materially from the assumptions used to establish the expected asset class returns and there is no assurance that such information has been correctly determined. Please see additional scenario analysis disclosures at the end of this presentation.
Confidential
Blackstone 21
184 0 92 102 0 70 0 152 195 99 206 202 201 221 3 0 103 120 0 115 99 0 171 146
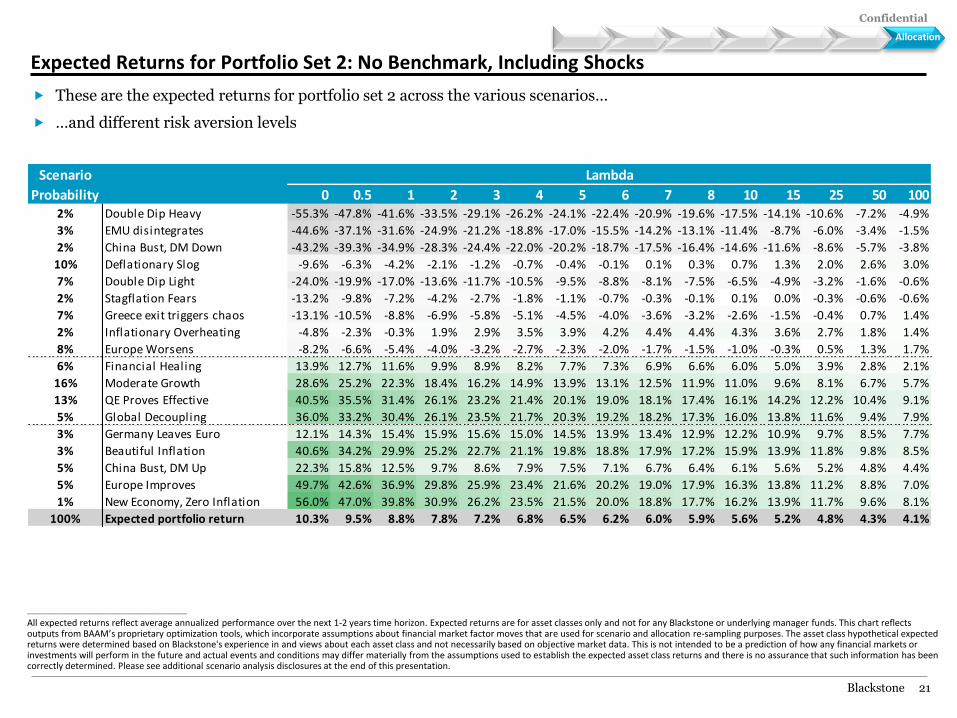
Scenario Lambda
Probability 0 0.5 1 2 3 4 5 6 7 8 10 15 25 50 1002% Double Dip Heavy -55.3% -47.8% -41.6% -33.5% -29.1% -26.2% -24.1% -22.4% -20.9% -19.6% -17.5% -14.1% -10.6% -7.2% -4.9%
3% EMU disintegrates -44.6% -37.1% -31.6% -24.9% -21.2% -18.8% -17.0% -15.5% -14.2% -13.1% -11.4% -8.7% -6.0% -3.4% -1.5%
2% China Bust, DM Down -43.2% -39.3% -34.9% -28.3% -24.4% -22.0% -20.2% -18.7% -17.5% -16.4% -14.6% -11.6% -8.6% -5.7% -3.8%
10% Deflationary Slog -9.6% -6.3% -4.2% -2.1% -1.2% -0.7% -0.4% -0.1% 0.1% 0.3% 0.7% 1.3% 2.0% 2.6% 3.0%
7% Double Dip Light -24.0% -19.9% -17.0% -13.6% -11.7% -10.5% -9.5% -8.8% -8.1% -7.5% -6.5% -4.9% -3.2% -1.6% -0.6%
2% Stagflation Fears -13.2% -9.8% -7.2% -4.2% -2.7% -1.8% -1.1% -0.7% -0.3% -0.1% 0.1% 0.0% -0.3% -0.6% -0.6%
7% Greece exit triggers chaos -13.1% -10.5% -8.8% -6.9% -5.8% -5.1% -4.5% -4.0% -3.6% -3.2% -2.6% -1.5% -0.4% 0.7% 1.4%
2% Inflationary Overheating -4.8% -2.3% -0.3% 1.9% 2.9% 3.5% 3.9% 4.2% 4.4% 4.4% 4.3% 3.6% 2.7% 1.8% 1.4%
8% Europe Worsens -8.2% -6.6% -5.4% -4.0% -3.2% -2.7% -2.3% -2.0% -1.7% -1.5% -1.0% -0.3% 0.5% 1.3% 1.7%
6% Financial Healing 13.9% 12.7% 11.6% 9.9% 8.9% 8.2% 7.7% 7.3% 6.9% 6.6% 6.0% 5.0% 3.9% 2.8% 2.1%
16% Moderate Growth 28.6% 25.2% 22.3% 18.4% 16.2% 14.9% 13.9% 13.1% 12.5% 11.9% 11.0% 9.6% 8.1% 6.7% 5.7%
13% QE Proves Effective 40.5% 35.5% 31.4% 26.1% 23.2% 21.4% 20.1% 19.0% 18.1% 17.4% 16.1% 14.2% 12.2% 10.4% 9.1%
5% Global Decoupling 36.0% 33.2% 30.4% 26.1% 23.5% 21.7% 20.3% 19.2% 18.2% 17.3% 16.0% 13.8% 11.6% 9.4% 7.9%
3% Germany Leaves Euro 12.1% 14.3% 15.4% 15.9% 15.6% 15.0% 14.5% 13.9% 13.4% 12.9% 12.2% 10.9% 9.7% 8.5% 7.7%
3% Beautiful Inflation 40.6% 34.2% 29.9% 25.2% 22.7% 21.1% 19.8% 18.8% 17.9% 17.2% 15.9% 13.9% 11.8% 9.8% 8.5%
5% China Bust, DM Up 22.3% 15.8% 12.5% 9.7% 8.6% 7.9% 7.5% 7.1% 6.7% 6.4% 6.1% 5.6% 5.2% 4.8% 4.4%
5% Europe Improves 49.7% 42.6% 36.9% 29.8% 25.9% 23.4% 21.6% 20.2% 19.0% 17.9% 16.3% 13.8% 11.2% 8.8% 7.0%
1% New Economy, Zero Inflation 56.0% 47.0% 39.8% 30.9% 26.2% 23.5% 21.5% 20.0% 18.8% 17.7% 16.2% 13.9% 11.7% 9.6% 8.1%
100% Expected portfolio return 10.3% 9.5% 8.8% 7.8% 7.2% 6.8% 6.5% 6.2% 6.0% 5.9% 5.6% 5.2% 4.8% 4.3% 4.1%
Expected Returns for Portfolio Set 2: No Benchmark, Including Shocks
These are the expected returns for portfolio set 2 across the various scenarios…
…and different risk aversion levels
Allocation
________________________________________________
All expected returns reflect average annualized performance over the next 1-2 years time horizon. Expected returns are for asset classes only and not for any Blackstone or underlying manager funds. This chart reflects outputs from BAAM’s proprietary optimization tools, which incorporate assumptions about financial market factor moves that are used for scenario and allocation re-sampling purposes. The asset class hypothetical expected returns were determined based on Blackstone's experience in and views about each asset class and not necessarily based on objective market data. This is not intended to be a prediction of how any financial markets or investments will perform in the future and actual events and conditions may differ materially from the assumptions used to establish the expected asset class returns and there is no assurance that such information has been correctly determined. Please see additional scenario analysis disclosures at the end of this presentation.
Confidential
Blackstone 22
184 0 92 102 0 70 0 152 195 99 206 202 201 221 3 0 103 120 0 115 99 0 171 146
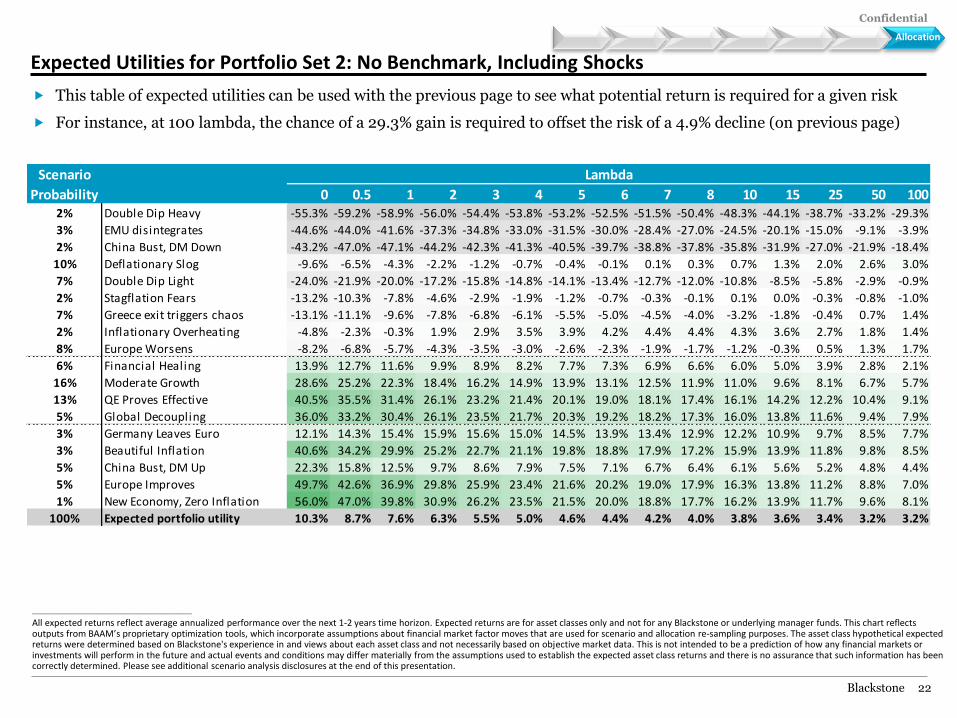
Scenario Lambda
Probability 0 0.5 1 2 3 4 5 6 7 8 10 15 25 50 1002% Double Dip Heavy -55.3% -59.2% -58.9% -56.0% -54.4% -53.8% -53.2% -52.5% -51.5% -50.4% -48.3% -44.1% -38.7% -33.2% -29.3%
3% EMU disintegrates -44.6% -44.0% -41.6% -37.3% -34.8% -33.0% -31.5% -30.0% -28.4% -27.0% -24.5% -20.1% -15.0% -9.1% -3.9%
2% China Bust, DM Down -43.2% -47.0% -47.1% -44.2% -42.3% -41.3% -40.5% -39.7% -38.8% -37.8% -35.8% -31.9% -27.0% -21.9% -18.4%
10% Deflationary Slog -9.6% -6.5% -4.3% -2.2% -1.2% -0.7% -0.4% -0.1% 0.1% 0.3% 0.7% 1.3% 2.0% 2.6% 3.0%
7% Double Dip Light -24.0% -21.9% -20.0% -17.2% -15.8% -14.8% -14.1% -13.4% -12.7% -12.0% -10.8% -8.5% -5.8% -2.9% -0.9%
2% Stagflation Fears -13.2% -10.3% -7.8% -4.6% -2.9% -1.9% -1.2% -0.7% -0.3% -0.1% 0.1% 0.0% -0.3% -0.8% -1.0%
7% Greece exit triggers chaos -13.1% -11.1% -9.6% -7.8% -6.8% -6.1% -5.5% -5.0% -4.5% -4.0% -3.2% -1.8% -0.4% 0.7% 1.4%
2% Inflationary Overheating -4.8% -2.3% -0.3% 1.9% 2.9% 3.5% 3.9% 4.2% 4.4% 4.4% 4.3% 3.6% 2.7% 1.8% 1.4%
8% Europe Worsens -8.2% -6.8% -5.7% -4.3% -3.5% -3.0% -2.6% -2.3% -1.9% -1.7% -1.2% -0.3% 0.5% 1.3% 1.7%
6% Financial Healing 13.9% 12.7% 11.6% 9.9% 8.9% 8.2% 7.7% 7.3% 6.9% 6.6% 6.0% 5.0% 3.9% 2.8% 2.1%
16% Moderate Growth 28.6% 25.2% 22.3% 18.4% 16.2% 14.9% 13.9% 13.1% 12.5% 11.9% 11.0% 9.6% 8.1% 6.7% 5.7%
13% QE Proves Effective 40.5% 35.5% 31.4% 26.1% 23.2% 21.4% 20.1% 19.0% 18.1% 17.4% 16.1% 14.2% 12.2% 10.4% 9.1%
5% Global Decoupling 36.0% 33.2% 30.4% 26.1% 23.5% 21.7% 20.3% 19.2% 18.2% 17.3% 16.0% 13.8% 11.6% 9.4% 7.9%
3% Germany Leaves Euro 12.1% 14.3% 15.4% 15.9% 15.6% 15.0% 14.5% 13.9% 13.4% 12.9% 12.2% 10.9% 9.7% 8.5% 7.7%
3% Beautiful Inflation 40.6% 34.2% 29.9% 25.2% 22.7% 21.1% 19.8% 18.8% 17.9% 17.2% 15.9% 13.9% 11.8% 9.8% 8.5%
5% China Bust, DM Up 22.3% 15.8% 12.5% 9.7% 8.6% 7.9% 7.5% 7.1% 6.7% 6.4% 6.1% 5.6% 5.2% 4.8% 4.4%
5% Europe Improves 49.7% 42.6% 36.9% 29.8% 25.9% 23.4% 21.6% 20.2% 19.0% 17.9% 16.3% 13.8% 11.2% 8.8% 7.0%
1% New Economy, Zero Inflation 56.0% 47.0% 39.8% 30.9% 26.2% 23.5% 21.5% 20.0% 18.8% 17.7% 16.2% 13.9% 11.7% 9.6% 8.1%
100% Expected portfolio utility 10.3% 8.7% 7.6% 6.3% 5.5% 5.0% 4.6% 4.4% 4.2% 4.0% 3.8% 3.6% 3.4% 3.2% 3.2%
Expected Utilities for Portfolio Set 2: No Benchmark, Including Shocks
This table of expected utilities can be used with the previous page to see what potential return is required for a given risk
For instance, at 100 lambda, the chance of a 29.3% gain is required to offset the risk of a 4.9% decline (on previous page)
Allocation
________________________________________________
All expected returns reflect average annualized performance over the next 1-2 years time horizon. Expected returns are for asset classes only and not for any Blackstone or underlying manager funds. This chart reflects outputs from BAAM’s proprietary optimization tools, which incorporate assumptions about financial market factor moves that are used for scenario and allocation re-sampling purposes. The asset class hypothetical expected returns were determined based on Blackstone's experience in and views about each asset class and not necessarily based on objective market data. This is not intended to be a prediction of how any financial markets or investments will perform in the future and actual events and conditions may differ materially from the assumptions used to establish the expected asset class returns and there is no assurance that such information has been correctly determined. Please see additional scenario analysis disclosures at the end of this presentation.
Confidential
Blackstone 23
184 0 92 102 0 70 0 152 195 99 206 202 201 221 3 0 103 120 0 115 99 0 171 146
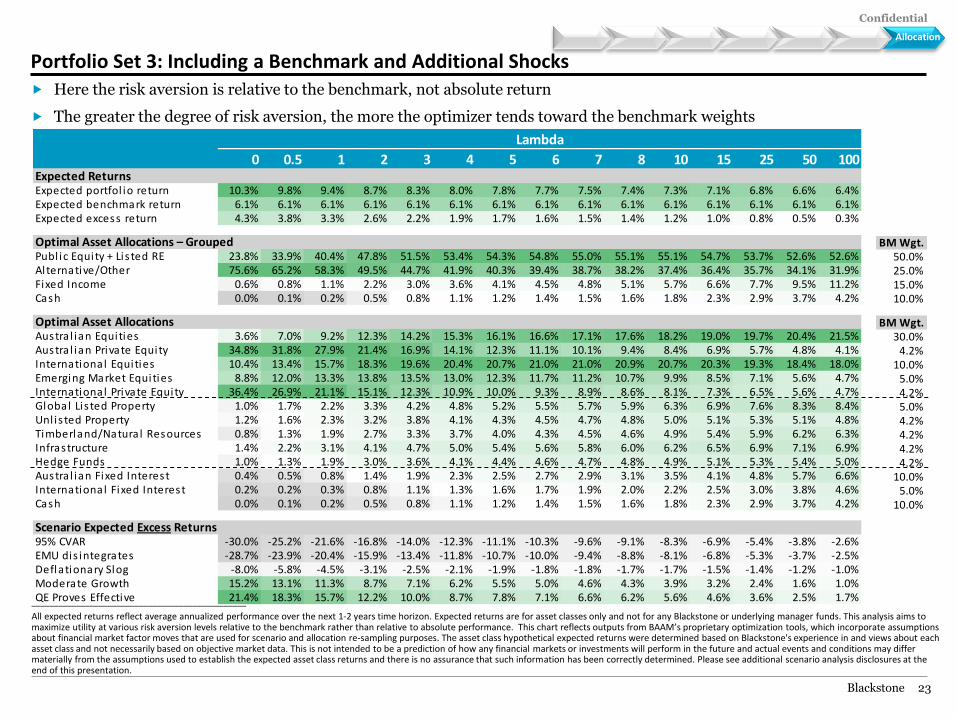
Lambda
0 0.5 1 2 3 4 5 6 7 8 10 15 25 50 100Expected ReturnsExpected portfol io return 10.3% 9.8% 9.4% 8.7% 8.3% 8.0% 7.8% 7.7% 7.5% 7.4% 7.3% 7.1% 6.8% 6.6% 6.4%Expected benchmark return 6.1% 6.1% 6.1% 6.1% 6.1% 6.1% 6.1% 6.1% 6.1% 6.1% 6.1% 6.1% 6.1% 6.1% 6.1%Expected excess return 4.3% 3.8% 3.3% 2.6% 2.2% 1.9% 1.7% 1.6% 1.5% 1.4% 1.2% 1.0% 0.8% 0.5% 0.3%
Optimal Asset Allocations – GroupedPubl ic Equity + Lis ted RE 23.8% 33.9% 40.4% 47.8% 51.5% 53.4% 54.3% 54.8% 55.0% 55.1% 55.1% 54.7% 53.7% 52.6% 52.6%Alternative/Other 75.6% 65.2% 58.3% 49.5% 44.7% 41.9% 40.3% 39.4% 38.7% 38.2% 37.4% 36.4% 35.7% 34.1% 31.9%Fixed Income 0.6% 0.8% 1.1% 2.2% 3.0% 3.6% 4.1% 4.5% 4.8% 5.1% 5.7% 6.6% 7.7% 9.5% 11.2%Cash 0.0% 0.1% 0.2% 0.5% 0.8% 1.1% 1.2% 1.4% 1.5% 1.6% 1.8% 2.3% 2.9% 3.7% 4.2%
Optimal Asset AllocationsAustra l ian Equities 3.6% 7.0% 9.2% 12.3% 14.2% 15.3% 16.1% 16.6% 17.1% 17.6% 18.2% 19.0% 19.7% 20.4% 21.5%Austra l ian Private Equity 34.8% 31.8% 27.9% 21.4% 16.9% 14.1% 12.3% 11.1% 10.1% 9.4% 8.4% 6.9% 5.7% 4.8% 4.1%International Equities 10.4% 13.4% 15.7% 18.3% 19.6% 20.4% 20.7% 21.0% 21.0% 20.9% 20.7% 20.3% 19.3% 18.4% 18.0%Emerging Market Equities 8.8% 12.0% 13.3% 13.8% 13.5% 13.0% 12.3% 11.7% 11.2% 10.7% 9.9% 8.5% 7.1% 5.6% 4.7%International Private Equity 36.4% 26.9% 21.1% 15.1% 12.3% 10.9% 10.0% 9.3% 8.9% 8.6% 8.1% 7.3% 6.5% 5.6% 4.7%Global Lis ted Property 1.0% 1.7% 2.2% 3.3% 4.2% 4.8% 5.2% 5.5% 5.7% 5.9% 6.3% 6.9% 7.6% 8.3% 8.4%Unl is ted Property 1.2% 1.6% 2.3% 3.2% 3.8% 4.1% 4.3% 4.5% 4.7% 4.8% 5.0% 5.1% 5.3% 5.1% 4.8%Timberland/Natura l Resources 0.8% 1.3% 1.9% 2.7% 3.3% 3.7% 4.0% 4.3% 4.5% 4.6% 4.9% 5.4% 5.9% 6.2% 6.3%Infrastructure 1.4% 2.2% 3.1% 4.1% 4.7% 5.0% 5.4% 5.6% 5.8% 6.0% 6.2% 6.5% 6.9% 7.1% 6.9%Hedge Funds 1.0% 1.3% 1.9% 3.0% 3.6% 4.1% 4.4% 4.6% 4.7% 4.8% 4.9% 5.1% 5.3% 5.4% 5.0%Austra l ian Fixed Interest 0.4% 0.5% 0.8% 1.4% 1.9% 2.3% 2.5% 2.7% 2.9% 3.1% 3.5% 4.1% 4.8% 5.7% 6.6%International Fixed Interest 0.2% 0.2% 0.3% 0.8% 1.1% 1.3% 1.6% 1.7% 1.9% 2.0% 2.2% 2.5% 3.0% 3.8% 4.6%Cash 0.0% 0.1% 0.2% 0.5% 0.8% 1.1% 1.2% 1.4% 1.5% 1.6% 1.8% 2.3% 2.9% 3.7% 4.2%
Scenario Expected Excess Returns95% CVAR -30.0% -25.2% -21.6% -16.8% -14.0% -12.3% -11.1% -10.3% -9.6% -9.1% -8.3% -6.9% -5.4% -3.8% -2.6%EMU dis integrates -28.7% -23.9% -20.4% -15.9% -13.4% -11.8% -10.7% -10.0% -9.4% -8.8% -8.1% -6.8% -5.3% -3.7% -2.5%Deflationary Slog -8.0% -5.8% -4.5% -3.1% -2.5% -2.1% -1.9% -1.8% -1.8% -1.7% -1.7% -1.5% -1.4% -1.2% -1.0%Moderate Growth 15.2% 13.1% 11.3% 8.7% 7.1% 6.2% 5.5% 5.0% 4.6% 4.3% 3.9% 3.2% 2.4% 1.6% 1.0%QE Proves Effective 21.4% 18.3% 15.7% 12.2% 10.0% 8.7% 7.8% 7.1% 6.6% 6.2% 5.6% 4.6% 3.6% 2.5% 1.7%
Portfolio Set 3: Including a Benchmark and Additional Shocks
Here the risk aversion is relative to the benchmark, not absolute return
The greater the degree of risk aversion, the more the optimizer tends toward the benchmark weights
Evaluation Allocation
BM Wgt.50.0%25.0%15.0%10.0%
BM Wgt.30.0%
4.2%10.0%
5.0%4.2%5.0%4.2%4.2%4.2%4.2%
10.0%5.0%
10.0%
________________________________________________
All expected returns reflect average annualized performance over the next 1-2 years time horizon. Expected returns are for asset classes only and not for any Blackstone or underlying manager funds. This analysis aims to maximize utility at various risk aversion levels relative to the benchmark rather than relative to absolute performance. This chart reflects outputs from BAAM’s proprietary optimization tools, which incorporate assumptions about financial market factor moves that are used for scenario and allocation re-sampling purposes. The asset class hypothetical expected returns were determined based on Blackstone's experience in and views about each asset class and not necessarily based on objective market data. This is not intended to be a prediction of how any financial markets or investments will perform in the future and actual events and conditions may differ materially from the assumptions used to establish the expected asset class returns and there is no assurance that such information has been correctly determined. Please see additional scenario analysis disclosures at the end of this presentation.
Confidential
Blackstone 24
184 0 92 102 0 70 0 152 195 99 206 202 201 221 3 0 103 120 0 115 99 0 171 146
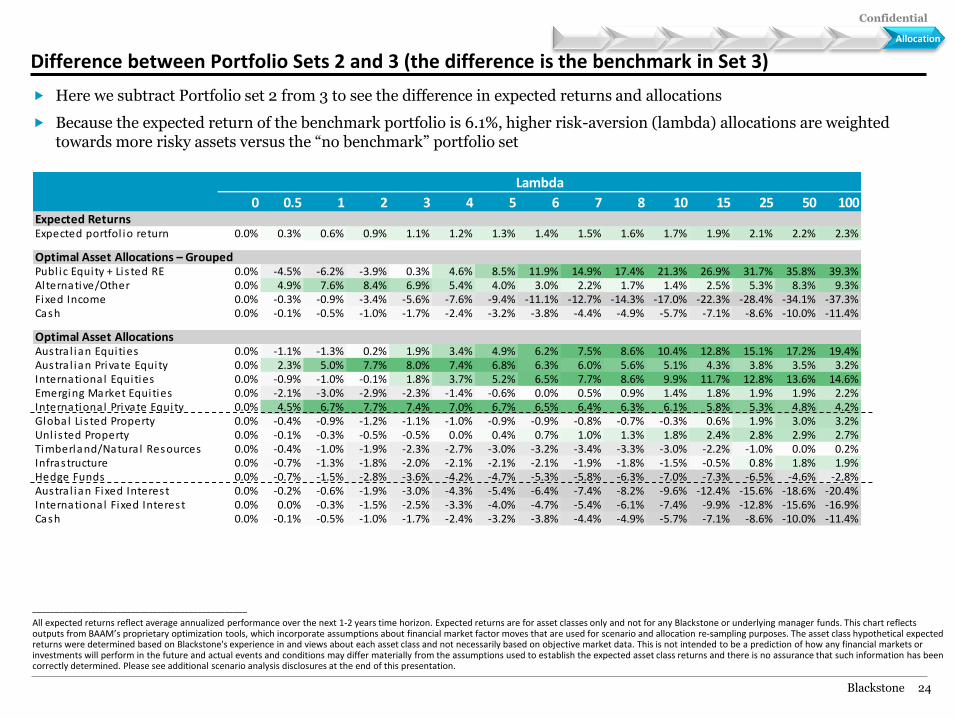
Lambda
0 0.5 1 2 3 4 5 6 7 8 10 15 25 50 100Expected ReturnsExpected portfol io return 0.0% 0.3% 0.6% 0.9% 1.1% 1.2% 1.3% 1.4% 1.5% 1.6% 1.7% 1.9% 2.1% 2.2% 2.3%
Optimal Asset Allocations – GroupedPubl ic Equity + Lis ted RE 0.0% -4.5% -6.2% -3.9% 0.3% 4.6% 8.5% 11.9% 14.9% 17.4% 21.3% 26.9% 31.7% 35.8% 39.3%Alternative/Other 0.0% 4.9% 7.6% 8.4% 6.9% 5.4% 4.0% 3.0% 2.2% 1.7% 1.4% 2.5% 5.3% 8.3% 9.3%Fixed Income 0.0% -0.3% -0.9% -3.4% -5.6% -7.6% -9.4% -11.1% -12.7% -14.3% -17.0% -22.3% -28.4% -34.1% -37.3%Cash 0.0% -0.1% -0.5% -1.0% -1.7% -2.4% -3.2% -3.8% -4.4% -4.9% -5.7% -7.1% -8.6% -10.0% -11.4%
Optimal Asset AllocationsAustra l ian Equities 0.0% -1.1% -1.3% 0.2% 1.9% 3.4% 4.9% 6.2% 7.5% 8.6% 10.4% 12.8% 15.1% 17.2% 19.4%Austra l ian Private Equity 0.0% 2.3% 5.0% 7.7% 8.0% 7.4% 6.8% 6.3% 6.0% 5.6% 5.1% 4.3% 3.8% 3.5% 3.2%International Equities 0.0% -0.9% -1.0% -0.1% 1.8% 3.7% 5.2% 6.5% 7.7% 8.6% 9.9% 11.7% 12.8% 13.6% 14.6%Emerging Market Equities 0.0% -2.1% -3.0% -2.9% -2.3% -1.4% -0.6% 0.0% 0.5% 0.9% 1.4% 1.8% 1.9% 1.9% 2.2%International Private Equity 0.0% 4.5% 6.7% 7.7% 7.4% 7.0% 6.7% 6.5% 6.4% 6.3% 6.1% 5.8% 5.3% 4.8% 4.2%Global Lis ted Property 0.0% -0.4% -0.9% -1.2% -1.1% -1.0% -0.9% -0.9% -0.8% -0.7% -0.3% 0.6% 1.9% 3.0% 3.2%Unl is ted Property 0.0% -0.1% -0.3% -0.5% -0.5% 0.0% 0.4% 0.7% 1.0% 1.3% 1.8% 2.4% 2.8% 2.9% 2.7%Timberland/Natura l Resources 0.0% -0.4% -1.0% -1.9% -2.3% -2.7% -3.0% -3.2% -3.4% -3.3% -3.0% -2.2% -1.0% 0.0% 0.2%Infrastructure 0.0% -0.7% -1.3% -1.8% -2.0% -2.1% -2.1% -2.1% -1.9% -1.8% -1.5% -0.5% 0.8% 1.8% 1.9%Hedge Funds 0.0% -0.7% -1.5% -2.8% -3.6% -4.2% -4.7% -5.3% -5.8% -6.3% -7.0% -7.3% -6.5% -4.6% -2.8%Austra l ian Fixed Interest 0.0% -0.2% -0.6% -1.9% -3.0% -4.3% -5.4% -6.4% -7.4% -8.2% -9.6% -12.4% -15.6% -18.6% -20.4%International Fixed Interest 0.0% 0.0% -0.3% -1.5% -2.5% -3.3% -4.0% -4.7% -5.4% -6.1% -7.4% -9.9% -12.8% -15.6% -16.9%Cash 0.0% -0.1% -0.5% -1.0% -1.7% -2.4% -3.2% -3.8% -4.4% -4.9% -5.7% -7.1% -8.6% -10.0% -11.4%
Difference between Portfolio Sets 2 and 3 (the difference is the benchmark in Set 3)
Here we subtract Portfolio set 2 from 3 to see the difference in expected returns and allocations
Because the expected return of the benchmark portfolio is 6.1%, higher risk-aversion (lambda) allocations are weighted towards more risky assets versus the “no benchmark” portfolio set
Evaluation Allocation
________________________________________________
All expected returns reflect average annualized performance over the next 1-2 years time horizon. Expected returns are for asset classes only and not for any Blackstone or underlying manager funds. This chart reflects outputs from BAAM’s proprietary optimization tools, which incorporate assumptions about financial market factor moves that are used for scenario and allocation re-sampling purposes. The asset class hypothetical expected returns were determined based on Blackstone's experience in and views about each asset class and not necessarily based on objective market data. This is not intended to be a prediction of how any financial markets or investments will perform in the future and actual events and conditions may differ materially from the assumptions used to establish the expected asset class returns and there is no assurance that such information has been correctly determined. Please see additional scenario analysis disclosures at the end of this presentation.
Confidential
Blackstone 25
184 0 92 102 0 70 0 152 195 99 206 202 201 221 3 0 103 120 0 115 99 0 171 146
Lambda
0 0.5 1 2 3 4 5 6 7 8 10 15 25 50 100Expected ReturnsExpected portfol io return 11.3% 10.7% 10.3% 9.8% 9.5% 9.3% 9.1% 9.0% 8.9% 8.9% 8.7% 8.5% 8.2% 7.9% 7.7%Expected benchmark return 6.5% 6.5% 6.5% 6.5% 6.5% 6.5% 6.5% 6.5% 6.5% 6.5% 6.5% 6.5% 6.5% 6.5% 6.5%Expected excess return 4.7% 4.2% 3.7% 3.2% 2.9% 2.7% 2.6% 2.5% 2.4% 2.3% 2.2% 2.0% 1.7% 1.4% 1.1%
Optimal Asset Allocations – GroupedPubl ic Equity + Lis ted RE 28.2% 39.3% 46.5% 54.9% 58.9% 60.6% 61.5% 61.9% 62.2% 62.4% 62.6% 62.5% 61.8% 60.7% 60.0%Alternative/Other 71.2% 60.0% 52.6% 43.8% 39.5% 37.4% 36.1% 35.4% 34.9% 34.5% 34.0% 33.5% 33.3% 32.7% 31.7%Fixed Income 0.6% 0.7% 0.8% 1.2% 1.5% 1.8% 2.1% 2.3% 2.5% 2.6% 2.9% 3.3% 3.9% 4.9% 6.0%Cash 0.0% 0.0% 0.1% 0.1% 0.1% 0.2% 0.3% 0.3% 0.4% 0.5% 0.5% 0.8% 1.1% 1.7% 2.3%
Optimal Asset AllocationsAustra l ian Equities 2.2% 4.0% 5.4% 6.9% 7.8% 8.3% 8.6% 8.9% 9.2% 9.4% 9.8% 10.6% 11.6% 13.0% 14.9%Austra l ian Private Equity 23.0% 20.8% 18.2% 14.3% 12.2% 11.1% 10.4% 9.8% 9.4% 9.1% 8.5% 7.6% 6.7% 5.8% 5.1%International Equities 16.6% 21.7% 24.8% 28.3% 29.6% 30.0% 30.0% 29.9% 29.7% 29.5% 29.1% 27.8% 25.8% 23.4% 21.6%Emerging Market Equities 8.0% 10.8% 12.1% 13.2% 13.4% 13.2% 12.9% 12.6% 12.3% 12.0% 11.4% 10.5% 9.4% 8.5% 8.0%International Private Equity 45.0% 33.3% 26.1% 18.3% 14.4% 12.4% 11.1% 10.3% 9.7% 9.2% 8.4% 7.3% 6.2% 5.0% 4.1%Global Lis ted Property 1.4% 2.8% 4.3% 6.5% 8.1% 9.1% 9.9% 10.5% 11.0% 11.5% 12.3% 13.6% 14.9% 15.7% 15.5%Unl is ted Property 0.4% 1.0% 1.4% 1.7% 1.9% 2.0% 2.1% 2.2% 2.3% 2.4% 2.6% 2.9% 3.3% 3.6% 3.8%Timberland/Natura l Resources 0.4% 0.8% 1.3% 1.9% 2.3% 2.5% 2.7% 2.8% 3.0% 3.1% 3.3% 3.8% 4.6% 5.2% 5.6%Infrastructure 0.8% 1.5% 2.1% 2.8% 3.1% 3.3% 3.5% 3.6% 3.8% 3.9% 4.2% 4.8% 5.4% 6.1% 6.4%Hedge Funds 1.6% 2.5% 3.6% 4.8% 5.5% 6.0% 6.3% 6.6% 6.7% 6.8% 6.9% 7.0% 7.1% 7.0% 6.8%Austra l ian Fixed Interest 0.4% 0.5% 0.6% 0.9% 1.1% 1.3% 1.6% 1.7% 1.8% 1.9% 2.1% 2.3% 2.7% 3.4% 4.0%International Fixed Interest 0.2% 0.2% 0.2% 0.3% 0.4% 0.5% 0.6% 0.6% 0.7% 0.7% 0.8% 0.9% 1.1% 1.5% 2.0%Cash 0.0% 0.0% 0.1% 0.1% 0.1% 0.2% 0.3% 0.3% 0.4% 0.5% 0.5% 0.8% 1.1% 1.7% 2.3%
Scenario Expected Excess Returns95% CVAR -28.6% -22.5% -18.1% -12.8% -10.0% -8.7% -7.9% -7.3% -6.8% -6.4% -5.8% -4.8% -3.8% -3.0% -2.4%EMU dis integrates -29.3% -23.4% -19.1% -14.1% -11.5% -9.9% -8.9% -8.2% -7.6% -7.1% -6.4% -5.2% -3.9% -2.4% -1.5%Deflationary Slog -11.2% -8.9% -7.4% -5.8% -5.1% -4.7% -4.4% -4.2% -4.1% -4.0% -3.9% -3.6% -3.2% -2.7% -2.3%Moderate Growth 13.5% 11.2% 9.5% 7.3% 6.1% 5.4% 4.9% 4.6% 4.3% 4.1% 3.8% 3.2% 2.5% 1.9% 1.4%QE Proves Effective 22.1% 18.5% 15.8% 12.5% 10.8% 9.8% 9.1% 8.6% 8.2% 7.8% 7.3% 6.4% 5.4% 4.3% 3.4%
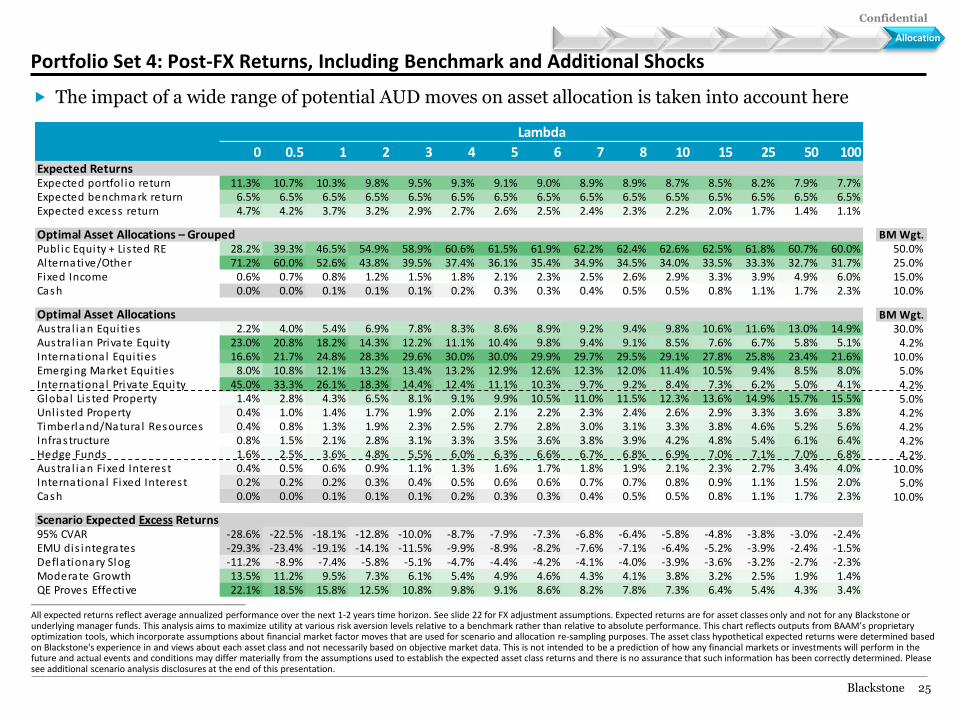
Portfolio Set 4: Post-FX Returns, Including Benchmark and Additional Shocks
The impact of a wide range of potential AUD moves on asset allocation is taken into account here
Allocation
BM Wgt.50.0%25.0%15.0%10.0%
BM Wgt.30.0%
4.2%10.0%
5.0%4.2%5.0%4.2%4.2%4.2%4.2%
10.0%5.0%
10.0%
________________________________________________
All expected returns reflect average annualized performance over the next 1-2 years time horizon. See slide 22 for FX adjustment assumptions. Expected returns are for asset classes only and not for any Blackstone or underlying manager funds. This analysis aims to maximize utility at various risk aversion levels relative to a benchmark rather than relative to absolute performance. This chart reflects outputs from BAAM’s proprietary optimization tools, which incorporate assumptions about financial market factor moves that are used for scenario and allocation re-sampling purposes. The asset class hypothetical expected returns were determined based on Blackstone's experience in and views about each asset class and not necessarily based on objective market data. This is not intended to be a prediction of how any financial markets or investments will perform in the future and actual events and conditions may differ materially from the assumptions used to establish the expected asset class returns and there is no assurance that such information has been correctly determined. Please see additional scenario analysis disclosures at the end of this presentation.
Confidential
Blackstone 26
184 0 92 102 0 70 0 152 195 99 206 202 201 221 3 0 103 120 0 115 99 0 171 146
Lambda
0 0.5 1 2 3 4 5 6 7 8 10 15 25 50 100Expected ReturnsExpected portfol io return 0.9% 0.9% 0.9% 1.1% 1.2% 1.3% 1.3% 1.4% 1.4% 1.4% 1.4% 1.4% 1.4% 1.4% 1.3%Expected benchmark return 0.5% 0.5% 0.5% 0.5% 0.5% 0.5% 0.5% 0.5% 0.5% 0.5% 0.5% 0.5% 0.5% 0.5% 0.5%Expected excess return 0.4% 0.4% 0.4% 0.6% 0.7% 0.8% 0.9% 0.9% 0.9% 0.9% 1.0% 1.0% 0.9% 0.9% 0.8%
Optimal Asset Allocations – GroupedPubl ic Equity + Lis ted RE 4.4% 5.4% 6.1% 7.1% 7.4% 7.2% 7.1% 7.2% 7.2% 7.3% 7.5% 7.8% 8.1% 8.1% 7.4%Alternative/Other -4.4% -5.3% -5.7% -5.7% -5.2% -4.6% -4.2% -4.0% -3.8% -3.7% -3.4% -2.9% -2.4% -1.4% -0.2%Fixed Income 0.0% -0.1% -0.3% -1.0% -1.5% -1.8% -1.9% -2.1% -2.3% -2.5% -2.8% -3.3% -3.9% -4.6% -5.2%Cash 0.0% 0.0% -0.1% -0.4% -0.7% -0.9% -1.0% -1.0% -1.1% -1.1% -1.3% -1.5% -1.8% -2.0% -2.0%
Optimal Asset AllocationsAustra l ian Equities -1.4% -2.9% -3.9% -5.4% -6.4% -7.0% -7.5% -7.7% -7.9% -8.1% -8.3% -8.4% -8.0% -7.3% -6.6%Austra l ian Private Equity -11.8% -11.0% -9.7% -7.1% -4.7% -3.0% -1.9% -1.2% -0.7% -0.4% 0.1% 0.7% 1.0% 1.0% 1.0%International Equities 6.2% 8.3% 9.1% 10.0% 10.0% 9.7% 9.3% 8.9% 8.7% 8.6% 8.3% 7.6% 6.5% 5.0% 3.6%Emerging Market Equities -0.8% -1.2% -1.2% -0.6% -0.1% 0.2% 0.6% 0.9% 1.1% 1.3% 1.5% 1.9% 2.4% 3.0% 3.4%International Private Equity 8.6% 6.4% 4.9% 3.1% 2.1% 1.5% 1.2% 0.9% 0.8% 0.6% 0.3% 0.0% -0.3% -0.5% -0.6%Global Lis ted Property 0.4% 1.2% 2.1% 3.1% 3.9% 4.3% 4.7% 5.0% 5.3% 5.5% 6.0% 6.7% 7.3% 7.4% 7.1%Unl is ted Property -0.8% -0.6% -0.9% -1.5% -1.9% -2.1% -2.2% -2.3% -2.4% -2.4% -2.4% -2.2% -2.0% -1.6% -1.1%Timberland/Natura l Resources -0.4% -0.5% -0.6% -0.8% -1.0% -1.2% -1.3% -1.4% -1.5% -1.5% -1.6% -1.5% -1.3% -1.0% -0.7%Infrastructure -0.6% -0.7% -1.0% -1.3% -1.6% -1.7% -1.9% -2.0% -2.0% -2.0% -1.9% -1.8% -1.5% -0.9% -0.6%Hedge Funds 0.6% 1.1% 1.7% 1.8% 1.9% 1.9% 1.9% 2.0% 2.0% 2.0% 2.0% 1.9% 1.8% 1.7% 1.7%Austra l ian Fixed Interest 0.0% -0.1% -0.2% -0.5% -0.8% -0.9% -1.0% -1.0% -1.1% -1.2% -1.4% -1.8% -2.0% -2.3% -2.6%International Fixed Interest 0.0% 0.0% -0.1% -0.4% -0.7% -0.8% -1.0% -1.1% -1.2% -1.3% -1.4% -1.6% -1.8% -2.3% -2.7%Cash 0.0% 0.0% -0.1% -0.4% -0.7% -0.9% -1.0% -1.0% -1.1% -1.1% -1.3% -1.5% -1.8% -2.0% -2.0%
Scenario Expected Excess Returns95% CVAR 1.4% 2.7% 3.5% 4.0% 4.0% 3.6% 3.2% 3.0% 2.8% 2.7% 2.5% 2.1% 1.6% 0.8% 0.2%EMU dis integrates -0.6% 0.6% 1.3% 1.8% 1.9% 1.9% 1.8% 1.8% 1.7% 1.7% 1.7% 1.6% 1.4% 1.3% 1.1%Deflationary Slog -3.3% -3.0% -2.9% -2.7% -2.6% -2.6% -2.5% -2.4% -2.3% -2.3% -2.2% -2.1% -1.8% -1.6% -1.3%Moderate Growth -1.7% -1.9% -1.8% -1.5% -1.1% -0.8% -0.6% -0.4% -0.3% -0.2% -0.1% 0.0% 0.1% 0.3% 0.4%QE Proves Effective 0.7% 0.2% 0.0% 0.4% 0.8% 1.1% 1.3% 1.4% 1.5% 1.6% 1.7% 1.8% 1.8% 1.8% 1.7%
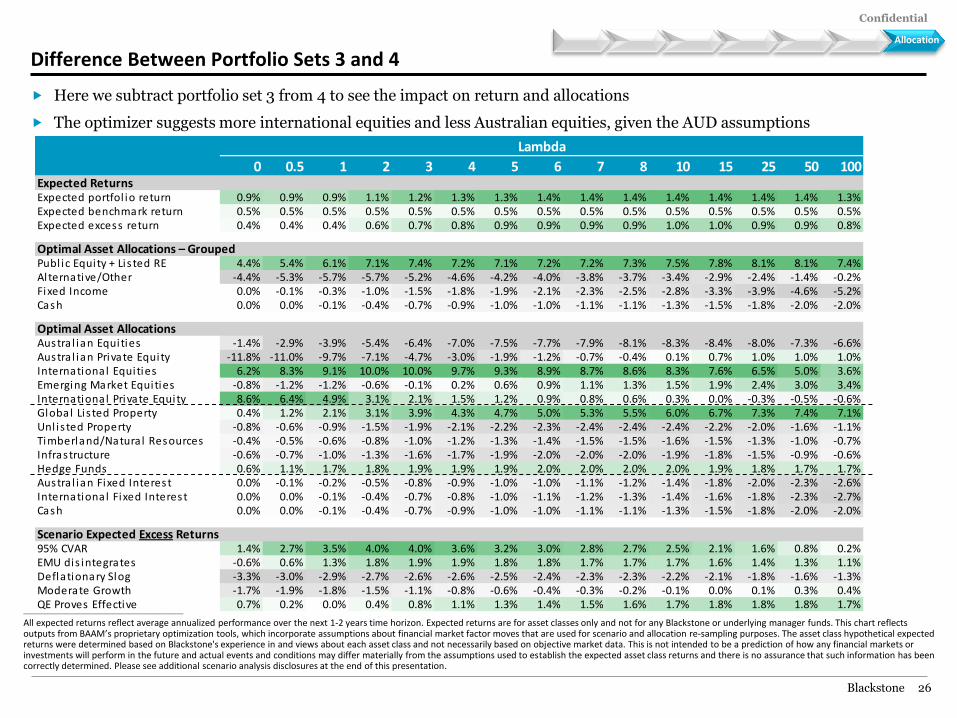
Difference Between Portfolio Sets 3 and 4
Here we subtract portfolio set 3 from 4 to see the impact on return and allocations
The optimizer suggests more international equities and less Australian equities, given the AUD assumptions
Evaluation Allocation
________________________________________________
All expected returns reflect average annualized performance over the next 1-2 years time horizon. Expected returns are for asset classes only and not for any Blackstone or underlying manager funds. This chart reflects outputs from BAAM’s proprietary optimization tools, which incorporate assumptions about financial market factor moves that are used for scenario and allocation re-sampling purposes. The asset class hypothetical expected returns were determined based on Blackstone's experience in and views about each asset class and not necessarily based on objective market data. This is not intended to be a prediction of how any financial markets or investments will perform in the future and actual events and conditions may differ materially from the assumptions used to establish the expected asset class returns and there is no assurance that such information has been correctly determined. Please see additional scenario analysis disclosures at the end of this presentation.
Confidential
Blackstone 27
184 0 92 102 0 70 0 152 195 99 206 202 201 221 3 0 103 120 0 115 99 0 171 146
________________________________________________
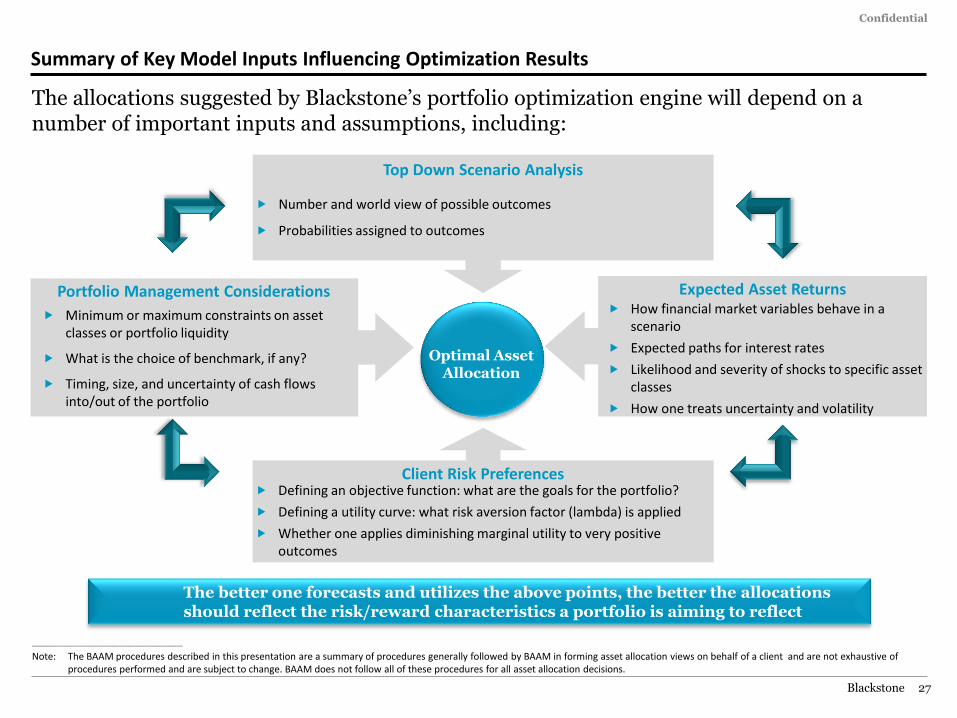
Note: The BAAM procedures described in this presentation are a summary of procedures generally followed by BAAM in forming asset allocation views on behalf of a client and are not exhaustive of procedures performed and are subject to change. BAAM does not follow all of these procedures for all asset allocation decisions.
The better one forecasts and utilizes the above points, the better the allocations should reflect the risk/reward characteristics a portfolio is aiming to reflect
Optimal Asset
Allocation
Number and world view of possible outcomes
Probabilities assigned to outcomes
Minimum or maximum constraints on asset classes or portfolio liquidity
What is the choice of benchmark, if any?
Timing, size, and uncertainty of cash flows into/out of the portfolio
How financial market variables behave in a scenario
Expected paths for interest rates
Likelihood and severity of shocks to specific asset classes
How one treats uncertainty and volatility
Defining an objective function: what are the goals for the portfolio?
Defining a utility curve: what risk aversion factor (lambda) is applied
Whether one applies diminishing marginal utility to very positive outcomes
Top Down Scenario Analysis
Portfolio Management Considerations Expected Asset Returns
Client Risk Preferences
The allocations suggested by Blackstone’s portfolio optimization engine will depend on a number of important inputs and assumptions, including:
Summary of Key Model Inputs Influencing Optimization Results

III. Appendix 1
Confidential
Blackstone 29
184 0 92 102 0 70 0 152 195 99 206 202 201 221 3 0 103 120 0 115 99 0 171 146
Process and Methodology Summary
I. Economic & asset class scenarios are developed and maintained using BAAM’s in-house research and insights
a) For tactical asset allocation, BAAM currently maintains 18 economic scenarios that encompass a wide variety of possible outcomes for the next 1-2 years
b) For strategic asset allocation, BAAM developed nine economic scenarios including a base case and combinations of higher and lower GDP growth, inflation, and real interest rates
c) BAAM created asset class return and interest rate assumptions for each year and scenario
d) BAAM has the ability to customize optimization model as appropriate to account for funding and expense information, portfolio mandate (ex. absolute return vs. lower volatility profile), and client specific risk preferences
II. BAAM uses Monte Carlo simulation and optimization to generate asset allocations for each portfolio objective
a) Monte Carlo simulation is employed to generate 250,000 paths in which the next ten years could play out, resampling from the scenarios with uncertainty and volatility. This includes asset class returns and key variables for specific mandate requirements as applicable (asset value, funding status, contributions, spending) and as a function of asset class weights
b) BAAM’s optimization engine identifies asset class weights that are optimal for each objective for a range of subjective risk aversions (“lambdas”)
c) The resulting optimal asset allocations are simulated a final time over ten years to determine percentiles for each variable’s expected distribution
d) We have short and long-term optimization tools with separate scenarios to derive tactical and strategic asset allocations, respectively
________________________________________________
Note: BAAM determines the scenario results and optimization allocations in its sole discretion based on its views and not necessarily based on objective market data. This is not intended to be a prediction of how any financial markets or asset classes will perform in the future.
Confidential
Blackstone 30
184 0 92 102 0 70 0 152 195 99 206 202 201 221 3 0 103 120 0 115 99 0 171 146
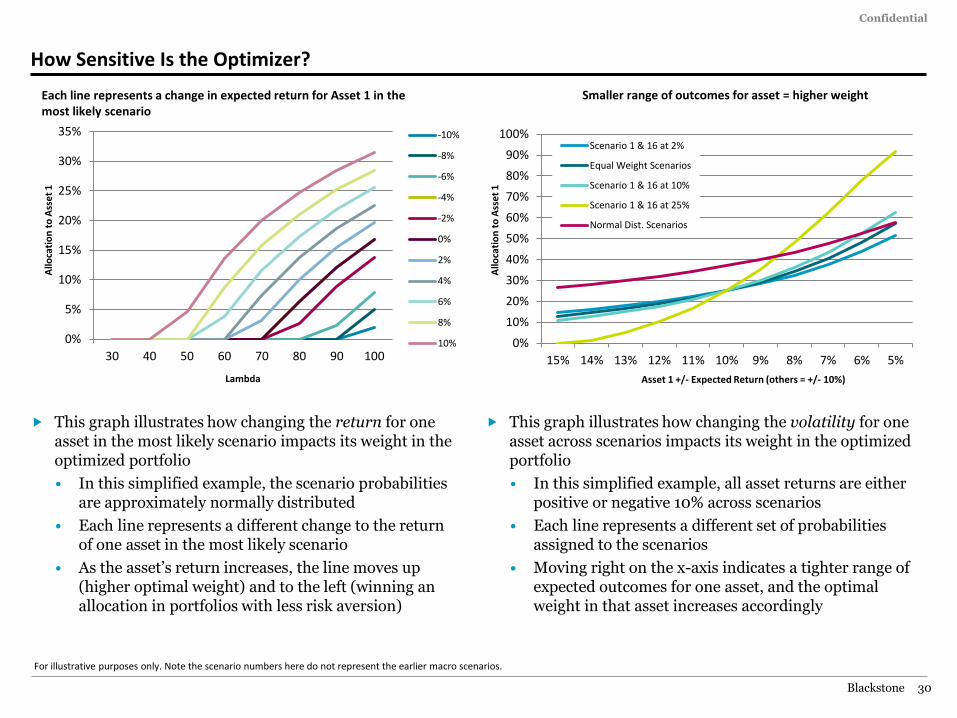
How Sensitive Is the Optimizer?
This graph illustrates how changing the return for one asset in the most likely scenario impacts its weight in the optimized portfolio
• In this simplified example, the scenario probabilities are approximately normally distributed
• Each line represents a different change to the return of one asset in the most likely scenario
• As the asset’s return increases, the line moves up (higher optimal weight) and to the left (winning an allocation in portfolios with less risk aversion)
This graph illustrates how changing the volatility for one asset across scenarios impacts its weight in the optimized portfolio
• In this simplified example, all asset returns are either positive or negative 10% across scenarios
• Each line represents a different set of probabilities assigned to the scenarios
• Moving right on the x-axis indicates a tighter range of expected outcomes for one asset, and the optimal weight in that asset increases accordingly
0%
5%
10%
15%
20%
25%
30%
35%
30 40 50 60 70 80 90 100
-10%
-8%
-6%
-4%
-2%
0%
2%
4%
6%
8%
10%
Each line represents a change in expected return for Asset 1 in the most likely scenario
Lambda
Allo
cati
on
to
Ass
et
1
Asset 1 +/- Expected Return (others = +/- 10%)
Allo
cati
on
to
Ass
et
1
0%
10%
20%
30%
40%
50%
60%
70%
80%
90%
100%
15% 14% 13% 12% 11% 10% 9% 8% 7% 6% 5%
Scenario 1 & 16 at 2%
Equal Weight Scenarios
Scenario 1 & 16 at 10%
Scenario 1 & 16 at 25%
Normal Dist. Scenarios
Smaller range of outcomes for asset = higher weight
For illustrative purposes only. Note the scenario numbers here do not represent the earlier macro scenarios.
Confidential
Blackstone 31
184 0 92 102 0 70 0 152 195 99 206 202 201 221 3 0 103 120 0 115 99 0 171 146
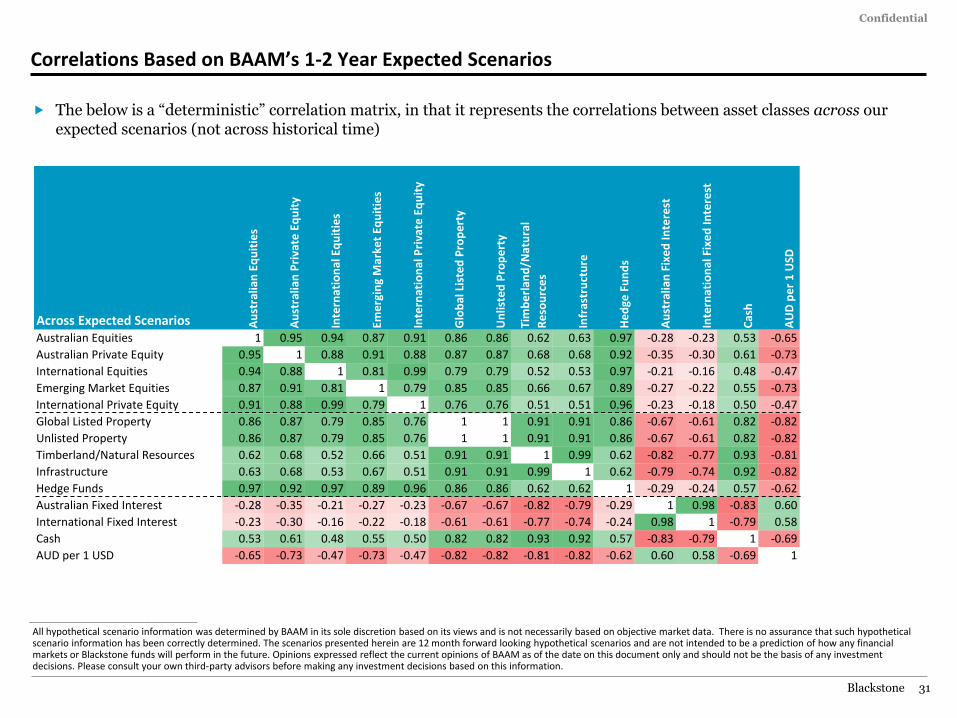
Correlations Based on BAAM’s 1-2 Year Expected Scenarios
________________________________________________
All hypothetical scenario information was determined by BAAM in its sole discretion based on its views and is not necessarily based on objective market data. There is no assurance that such hypothetical scenario information has been correctly determined. The scenarios presented herein are 12 month forward looking hypothetical scenarios and are not intended to be a prediction of how any financial markets or Blackstone funds will perform in the future. Opinions expressed reflect the current opinions of BAAM as of the date on this document only and should not be the basis of any investment decisions. Please consult your own third-party advisors before making any investment decisions based on this information.
The below is a “deterministic” correlation matrix, in that it represents the correlations between asset classes across our expected scenarios (not across historical time)
Across Expected Scenarios Au
stra
lian
Eq
uit
ies
Au
stra
lian
Pri
vate
Eq
uit
y
Inte
rnat
ion
al E
qu
itie
s
Eme
rgin
g M
arke
t Eq
uit
ies
Inte
rnat
ion
al P
riva
te E
qu
ity
Glo
bal
Lis
ted
Pro
pe
rty
Un
liste
d P
rop
ert
y
Tim
be
rlan
d/N
atu
ral
Re
sou
rce
s
Infr
astr
uct
ure
He
dge
Fu
nd
s
Au
stra
lian
Fix
ed
Inte
rest
Inte
rnat
ion
al F
ixe
d In
tere
st
Cas
h
AU
D p
er
1 U
SD
Australian Equities 1 0.95 0.94 0.87 0.91 0.86 0.86 0.62 0.63 0.97 -0.28 -0.23 0.53 -0.65
Australian Private Equity 0.95 1 0.88 0.91 0.88 0.87 0.87 0.68 0.68 0.92 -0.35 -0.30 0.61 -0.73
International Equities 0.94 0.88 1 0.81 0.99 0.79 0.79 0.52 0.53 0.97 -0.21 -0.16 0.48 -0.47
Emerging Market Equities 0.87 0.91 0.81 1 0.79 0.85 0.85 0.66 0.67 0.89 -0.27 -0.22 0.55 -0.73
International Private Equity 0.91 0.88 0.99 0.79 1 0.76 0.76 0.51 0.51 0.96 -0.23 -0.18 0.50 -0.47
Global Listed Property 0.86 0.87 0.79 0.85 0.76 1 1 0.91 0.91 0.86 -0.67 -0.61 0.82 -0.82
Unlisted Property 0.86 0.87 0.79 0.85 0.76 1 1 0.91 0.91 0.86 -0.67 -0.61 0.82 -0.82
Timberland/Natural Resources 0.62 0.68 0.52 0.66 0.51 0.91 0.91 1 0.99 0.62 -0.82 -0.77 0.93 -0.81
Infrastructure 0.63 0.68 0.53 0.67 0.51 0.91 0.91 0.99 1 0.62 -0.79 -0.74 0.92 -0.82
Hedge Funds 0.97 0.92 0.97 0.89 0.96 0.86 0.86 0.62 0.62 1 -0.29 -0.24 0.57 -0.62
Australian Fixed Interest -0.28 -0.35 -0.21 -0.27 -0.23 -0.67 -0.67 -0.82 -0.79 -0.29 1 0.98 -0.83 0.60
International Fixed Interest -0.23 -0.30 -0.16 -0.22 -0.18 -0.61 -0.61 -0.77 -0.74 -0.24 0.98 1 -0.79 0.58
Cash 0.53 0.61 0.48 0.55 0.50 0.82 0.82 0.93 0.92 0.57 -0.83 -0.79 1 -0.69
AUD per 1 USD -0.65 -0.73 -0.47 -0.73 -0.47 -0.82 -0.82 -0.81 -0.82 -0.62 0.60 0.58 -0.69 1
Confidential
Blackstone 32
184 0 92 102 0 70 0 152 195 99 206 202 201 221 3 0 103 120 0 115 99 0 171 146
Historical Characteristics of Key Asset Classes
The below is a table of annualized historical return, volatility, and correlation estimates for the asset classes in our analysis
The period is 40 quarterly observations ending Q3 2011
10 Years Quarterly
Ending Q3 2011 An
nu
aliz
ed
Re
turn
s
(AU
D)
Vo
lati
lity
Au
stra
lian
Eq
uit
ies
Au
stra
lian
Pri
vate
Equ
ity
Inte
rnat
ion
al
Equ
itie
s
Eme
rgin
g M
arke
t
Equ
itie
s
Inte
rnat
ion
al P
riva
te
Equ
ity
Glo
bal
Lis
ted
Pro
pe
rty
Un
liste
d P
rop
ert
y
Tim
be
rlan
d
Infr
astr
uct
ure
HFR
I He
dge
Fu
nd
Ind
ex
loca
l
Au
stra
lian
Fix
ed
Inte
rest
Inte
rnat
ion
al F
ixe
d
Inte
rest
loca
l
Cas
h
Australian Equities 7.2% 16.1% 1.00 0.46 0.66 0.79 0.39 0.65 0.16 -0.08 0.49 0.83 -0.61 -0.57 -0.20
Australian Private Equity 16.6% 11.8% 0.46 1.00 0.17 0.20 0.35 0.47 0.47 0.16 0.21 0.53 -0.33 -0.25 0.10
International Equities -3.2% 15.5% 0.66 0.17 1.00 0.81 0.31 0.45 0.11 0.02 0.40 0.36 -0.23 -0.37 -0.10
Emerging Market Equities 8.4% 22.1% 0.79 0.20 0.81 1.00 0.43 0.43 0.11 -0.02 0.26 0.63 -0.48 -0.40 -0.20
International Private Equity 5.0% 15.2% 0.39 0.35 0.31 0.43 1.00 0.15 0.16 0.29 0.29 0.43 -0.31 -0.25 0.00
Global Listed Property 2.5% 18.2% 0.65 0.47 0.45 0.43 0.15 1.00 0.08 0.00 0.54 0.44 -0.19 -0.27 -0.09
Unlisted Property 8.8% 4.6% 0.16 0.47 0.11 0.11 0.16 0.08 1.00 0.39 0.15 0.32 -0.21 -0.02 0.60
Timberland 6.8% 6.2% -0.08 0.16 0.02 -0.02 0.29 0.00 0.39 1.00 -0.10 0.05 0.07 0.19 0.50
Infrastructure 6.4% 19.9% 0.49 0.21 0.40 0.26 0.29 0.54 0.15 -0.10 1.00 0.25 -0.03 -0.16 -0.13
HFRI Hedge Fund Index local 3.6% 6.9% 0.83 0.53 0.36 0.63 0.43 0.44 0.32 0.05 0.25 1.00 -0.73 -0.56 -0.11
Australian Fixed Interest 6.2% 3.3% -0.61 -0.33 -0.23 -0.48 -0.31 -0.19 -0.21 0.07 -0.03 -0.73 1.00 0.81 0.02
International Fixed Interest local 5.5% 5.6% -0.57 -0.25 -0.37 -0.40 -0.25 -0.27 -0.02 0.19 -0.16 -0.56 0.81 1.00 0.09
Cash 5.4% 2.2% -0.20 0.10 -0.10 -0.20 0.00 -0.09 0.60 0.50 -0.13 -0.11 0.02 0.09 1.00
See slide 16 for a list of the indices used as proxies for the above asset classes. Sources of data include: Macrobond, Bloomberg, Cambridge, Mercer and UBS.
Confidential
Blackstone 33
184 0 92 102 0 70 0 152 195 99 206 202 201 221 3 0 103 120 0 115 99 0 171 146
Public and Private Equities
Global public and private equities have exhibited strong positive correlation
The bottom graph illustrates outperformance of PE versus a benchmark of public equities + 5% per annum
Confidential
Blackstone 34
184 0 92 102 0 70 0 152 195 99 206 202 201 221 3 0 103 120 0 115 99 0 171 146
Unlisted and Listed Property
Unlisted property time series have exhibited lower measured volatility than listed property series, but much of this is due to the lower frequency of appraisals/valuations in the private market
Confidential
Blackstone 35
184 0 92 102 0 70 0 152 195 99 206 202 201 221 3 0 103 120 0 115 99 0 171 146
Timberland, Infrastructure, Fixed Income and Cash
Data on Timberland/Natural Resources and Infrastructure are less available than many other asset classes
Total returns for Australian and hedged U.S. Fixed Income appear to be fairly strongly correlated
Confidential
Blackstone 36
184 0 92 102 0 70 0 152 195 99 206 202 201 221 3 0 103 120 0 115 99 0 171 146
Model Inputs and Diagnostics: Example – Portfolio Set 2
________________________________________________
Note: The asset allocation sets presented above are based on various utility maximization assumptions and assumptions about an investor’s level of risk aversion relative to absolute performance. This chart reflects outputs from BAAM’s proprietary optimization tools, which incorporate assumptions about financial market factor moves that are used for scenario and allocation re-sampling purposes. The asset allocation summary presented is for illustrative purposes only and should not be relied for portfolio construction purposes. All hypothetical scenario information utilized for this analysis was determined by BAAM in its sole discretion based on its views and is not necessarily based on objective market data. The results of the analysis are hypothetical. There is no assurance that such hypothetical scenario information has been correctly determined and BAAM’s hypothetical scenarios are not intended to be a prediction of how any financial markets or portfolios will perform in the future. Please consult your own third-party advisors before making any investment decisions based on this information.
Simulation Parameters Min
Max
Un
cert
ain
ty In
Un
cert
ain
ty
Ou
t
Pro
bab
ility
of
Sho
ck
Ret
urn
Giv
en
Sho
ck
Ben
chm
ark
Wei
ght
Australian Equities 0% 100% 3% 3% 0% 0% 0%
Australian Private Equity 0% 100% 3% 3% 3% -33% 0%
International Equities 0% 100% 3% 3% 0% 0% 0%
Emerging Market Equities 0% 100% 3% 3% 3% -25% 0%
International Private Equity 0% 100% 3% 3% 3% -33% 0%
Global Listed Property 0% 100% 3% 3% 0% 0% 0%
Unlisted Property 0% 100% 3% 3% 0% 0% 0%
Timberland/Natural Resources 0% 100% 3% 3% 0% 0% 0%
Infrastructure 0% 100% 3% 3% 0% 0% 0%
Hedge Funds 0% 100% 3% 3% 3% -15% 0%
Australian Fixed Interest 0% 100% 3% 3% 0% 0% 0%
International Fixed Interest 0% 100% 3% 3% 0% 0% 0%
Cash 0% 100% 3% 3% 0% 0% 0%
Inner resamples = 10000
Outer resamples = 500
Utility threshold = 0
Shape parameter = 10000
No benchmark
Probabilities = different by scenario with identifier 0.0842
Factor input identifier 12.5018493510773
Beta Returns = Non-zero
Alpha Returns = Zero
Run start: 9/26/12 6:09:58 PM
Run completion: 9/26/12 8:45:19 PM
Run time: 02:35:21

IV. Appendix 2
Confidential
Blackstone 38
184 0 92 102 0 70 0 152 195 99 206 202 201 221 3 0 103 120 0 115 99 0 171 146
Dedicated Team Integration with Blackstone(1) Manager Relationships
Insights on the economy through BX ownership of portfolio companies
Perspective on capital markets through BX’s buying, selling and refinancing activities
Allocation Strategy Team focused solely on formulating top down views
Led by Ian Morris, an economist with over 15 years experience
Differentiated relationships with hedge fund managers
• Invested with some of the most talented & experienced managers in the business
• Market color from a broad array of managers across different strategies
BAAM’s Proprietary Optimization Model
1. Subject to The Blackstone Group’s Internal Information Wall Policy.
BAAM’s edge in formulating a top-down view stems from:
Short-term model provides tactical asset allocation insight
(1-year)
Long-term model provides strategic asset allocation insight
(10-year)
Top Down View Formation
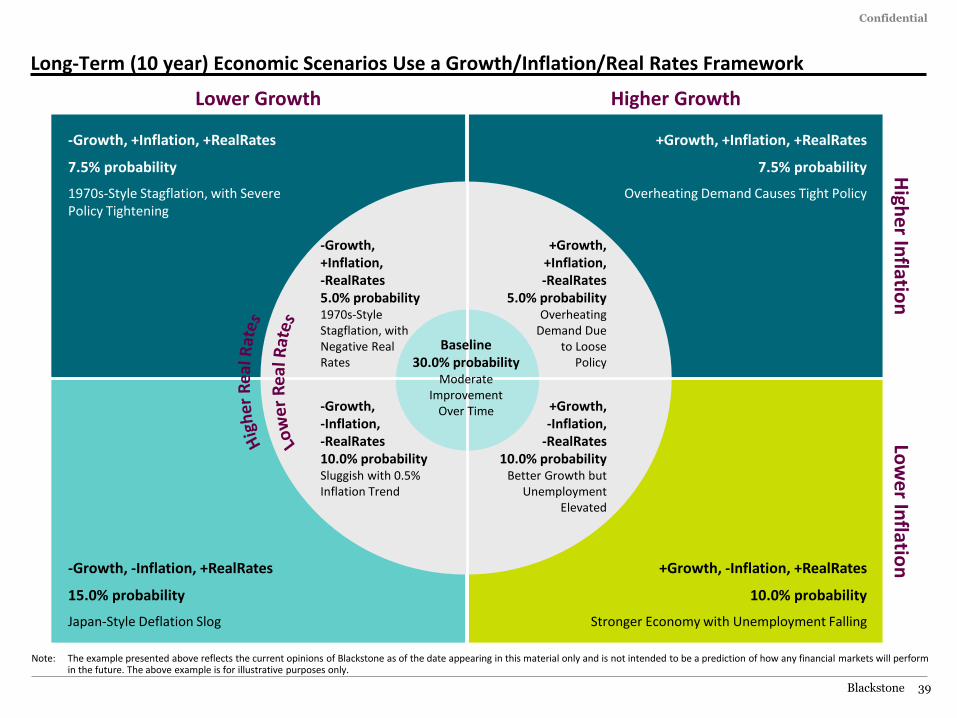
Confidential
Blackstone 39
184 0 92 102 0 70 0 152 195 99 206 202 201 221 3 0 103 120 0 115 99 0 171 146
Long-Term (10 year) Economic Scenarios Use a Growth/Inflation/Real Rates Framework
Lower Growth
High
er In
flation
+Growth, +Inflation, +RealRates
7.5% probability
Overheating Demand Causes Tight Policy
+Growth, +Inflation, -RealRates
5.0% probability Overheating
Demand Due to Loose
Policy
+Growth, -Inflation, +RealRates
10.0% probability
Stronger Economy with Unemployment Falling
+Growth, -Inflation,
-RealRates 10.0% probability
Better Growth but Unemployment
Elevated
-Growth, -Inflation, -RealRates 10.0% probability Sluggish with 0.5% Inflation Trend
-Growth, +Inflation, +RealRates
7.5% probability
1970s-Style Stagflation, with Severe Policy Tightening
-Growth, -Inflation, +RealRates
15.0% probability
Japan-Style Deflation Slog
Baseline 30.0% probability
Moderate Improvement
Over Time
-Growth, +Inflation, -RealRates 5.0% probability 1970s-Style Stagflation, with Negative Real Rates
Higher Growth
Low
er In
flation
Note: The example presented above reflects the current opinions of Blackstone as of the date appearing in this material only and is not intended to be a prediction of how any financial markets will perform in the future. The above example is for illustrative purposes only.
Confidential
Blackstone 40
184 0 92 102 0 70 0 152 195 99 206 202 201 221 3 0 103 120 0 115 99 0 171 146
Strategy Roadmap: Stylized Economic and Market Cycle
________________________________________________
Note: The above example is for illustrative purposes only. 1. Typically flattens once unemployment rate peaks and begins to decline.
Phase: 1 2 3 4
Macro Factors:
Economy: Expansion Slowdown Recession Recovery
Inflation: Up Up Down Down
Fed funds: Tighten Tighten / Hold Ease Ease / On Hold
Yield Curve: Bear Flattening Flattening / Inversion Bull Steepening Steepening / Flattening (1)
Market Factors:
Volatility: Low Low High High / Falling
Correlation: Low Low High High / Falling
Dispersion: High High Low Low / Rising
Liquidity: More Most Least Improving
Traditional Asset Allocation:
Equities
Cash
Bonds
Cash
Bonds
Equities
Bonds
Cash
Equities
Equities
Bonds
Cash
Themes:
Stronger Economy Weaker Economy Weaker Economy Stronger Economy
Higher Inflation Higher Inflation Lower Inflation Lower Inflation
Macro Factors
Market Factors
Themes
Phase 1 2 3 4
Every cycle is different, but some patterns remain and are worth monitoring as an anchor
Confidential
Blackstone 41
184 0 92 102 0 70 0 152 195 99 206 202 201 221 3 0 103 120 0 115 99 0 171 146
Strategy Roadmap: Stylized Hedge Fund Strategy Cycle
Equity Quant L/S Credit Distressed Multistrategy Macro Thematic Comm Directional EM Trading
Equity Fundamental Equity Trading Structured Credit Event Multistrategy Fixed Income
Equity Fundamental Credit Mortgages Credit Opp Event Multistrategy Macro Thematic
Equity Fundamental Credit Opportunistic Event Macro Thematic Comm Directional
Equity Trading Equity Quant L/S Credit Rel Value Comm Directional Comm Trading
Equity Trading Credit Rel Value Fixed Income CTAs Comm Trading
Credit Mortgages Credit Opportunistic Credit Distressed Macro Thematic EM Trading
Credit Mortgages Structured Credit Credit Distressed Multistrategy Fixed Income EM Trading
Equity Trading Equity Quant L/S Credit Rel Value CTAs Comm Trading
Structured Credit Credit Distressed Fixed Income CTAs EM Trading
Equity Fundamental Credit Mortgages Credit Opportunistic Structured Credit Event
Equity Quant L/S Credit Rel Value CTAs Comm Directional Comm Trading
High GDP Low Unemp
Trend GDP Full Emp
Low GDP High Unemp
Key: Overweight Neutral Underweight
Trading
Trading
________________________________________________
Note: The above example is for illustrative purposes only.
Analysing potential overweight, neutral and underweight strategies in a stylized cycle
Phase 1 2 3 4
Confidential
Blackstone 42
184 0 92 102 0 70 0 152 195 99 206 202 201 221 3 0 103 120 0 115 99 0 171 146
Additional Disclosures
Expected Asset Class Portfolio Scenario Analysis Disclosures: Blackstone selects the inputs which largely determine the results of the Scenario Analysis. Such inputs are selected by Blackstone in its sole discretion
based on its views and experience in each asset class and are not necessarily based on objective market data. There is no assurance that such inputs have been correctly selected or that they will result in an accurate depiction of the performance of the asset classes presented. Actual events and conditions may differ materially from the assumptions used to establish the expected asset class returns. In addition, there is no assurance that the inputs selected will accurately measure the risk inherent in the asset classes. Further, the results of the Scenario Analysis are not intended to be a prediction of how the asset classes or any financial markets will perform in the future, but rather to be used as data points for evaluating the asset classes' potential underlying level of risk, managing expectations of performance in various market environments, and as insight into the asset classes' potential behavior during various types of stressed markets.
These analyses are provided for illustrative purposes only and should not be relied upon for portfolio construction purposes. The results of the Scenario
Analysis are hypothetical. Hypothetical results have many inherent limitations and no representation is being made that any investor will, or is likely to, achieve results similar to those shown. Accordingly, none of the Scenario Analysis results contained herein should be considered to be an indication of any future performance of the asset classes or financial markets. Please consult your own third party advisors before making any investment decisions based on this information.