a room with a cue: personality judgments based on offices ... · a room with a cue: personality...
TRANSCRIPT

PERSONALITY PROCESSES AND INDIVIDUAL DIFFERENCES
A Room With a Cue:Personality Judgments Based on Offices and Bedrooms
Samuel D. Gosling and Sei Jin KoUniversity of Texas at Austin
Thomas MannarelliINSEAD
Margaret E. MorrisSapient
The authors articulate a model specifying links between (a) individuals and the physical environmentsthey occupy and (b) the environments and observers’ impressions of the occupants. Two studiesexamined the basic phenomena underlying this model: Interobserver consensus, observer accuracy, cueutilization, and cue validity. Observer ratings based purely on offices or bedrooms were compared withself- and peer ratings of occupants and with physical features of the environments. Findings, which variedslightly across contexts and traits, suggest that (a) personal environments elicit similar impressions fromindependent observers, (b) observer impressions show some accuracy, (c) observers rely on valid cues inthe rooms to form impressions of occupants, and (d) sex and race stereotypes partially mediate observerconsensus and accuracy. Consensus and accuracy correlations were generally stronger than those foundin zero-acquaintance research.
An animal resting or passing by leaves crushed grass, footprints, andperhaps droppings, but a human occupying a room for one night printshis character, his biography, his recent history, and sometimes hisfuture plans and hopes. I further believe that personality seeps into
walls and is slowly released. . . . As I sat in this unmade room,Lonesome Harry began to take shape and dimension. I could feel thatrecently departed guest in the bits and pieces of himself he had leftbehind.
—John Steinbeck, Travels With Charlie
Steinbeck’s observation draws on an intuition that much can belearned about individuals from the spaces they inhabit. Purely onthe basis of some laundry receipts, an unfinished letter in thewastebasket, an empty bottle of bourbon, and other assorted clues,Steinbeck pieced together a portrait of Lonesome Harry. It wouldseem that the environments that people craft around themselves arerich with information about their personalities, values, andlifestyles.
Interactionist theories (Buss, 1987; Snyder & Ickes, 1985;Swann, 1987) suggest that individuals select and create their socialenvironments (e.g., friendships, social activities) to match andreinforce their dispositions, preferences, attitudes, and self-views;extraverts choose friends, colleagues, and relationship partnerswho enable them to express their extraverted nature. Consistentwith Steinbeck’s intuition, we hypothesize that individuals alsoselect and craft physical environments that reflect and reinforcewho they are. Furthermore, we propose that observers use theinformation available in everyday environments to form impres-sions of what the occupants of those environments are like.
The links between occupants and their personal environmentsand between personal environments and observers’ perceptions ofthe occupants can be conceptualized in terms of Brunswik’s (1956)
Samuel D. Gosling and Sei Jin Ko, Department of Psychology, Univer-sity of Texas at Austin; Thomas Mannarelli, Organisational BehaviourArea, INSEAD, Singapore; Margaret E. Morris, Sapient, San Francisco,California.
Preparation of this article was supported by research grants from theUniversity of Texas College of Liberal Arts, INSEAD, and the Peter WallInstitute for Advanced Studies. We thank Kenneth H. Craik, Oliver P.John, David M. Marx, Bernadette Park, Delroy L. Paulhus, Karen M.Ruggiero, Richard W. Robins, and Jack Soll for their helpful comments ondrafts of this article. We are grateful to Lauren Altman, Patricia Baker,Allison Bonburg, Jenni Brelsford, Keren Brooks, Alice Chuang, EricaDolor, Garin Ekmekjian, Manjit Gill, Dorothea Ho, Linda Huang, LaneJohnson, Beth Jones, Cohav Kimmel, Adam Klinger, Lawrence Lee,Monica Lee, Peter Lwin, Kevin Murray, Sun No, Susan Orgera, MichellePryor, Rachelle Robles, Jenny Vuong, Alex Wang, Elisa Wong, Mei-LingWoo, and Marisa Yee for their help in collecting the data reported here. Weare also grateful to Anthony Maxwell of the Federal Bureau of Investiga-tion for his advice in the design of the room-assessment procedures; to PaulBarese of Studios Architecture for his consultation in the study of officespaces; and to Charles Judd, Gary McClelland, Pat Randall, and MelodySadler for their statistical advice.
Correspondence concerning this article should be addressed to SamuelD. Gosling, Department of Psychology, Mezes Hall 330, University ofTexas, Austin, Texas 78712. E-mail: [email protected]
Journal of Personality and Social Psychology, 2002, Vol. 82, No. 3, 379–398Copyright 2002 by the American Psychological Association, Inc. 0022-3514/02/$5.00 DOI: 10.1037//0022-3514.82.3.379
379
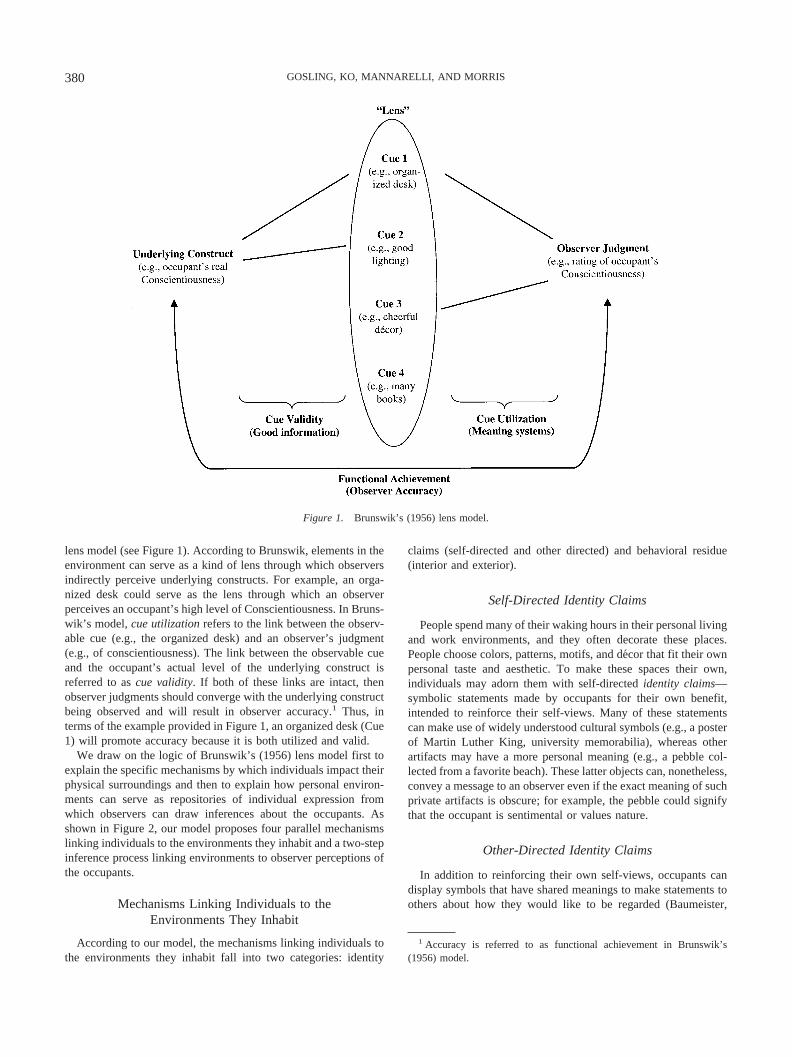
lens model (see Figure 1). According to Brunswik, elements in theenvironment can serve as a kind of lens through which observersindirectly perceive underlying constructs. For example, an orga-nized desk could serve as the lens through which an observerperceives an occupant’s high level of Conscientiousness. In Bruns-wik’s model, cue utilization refers to the link between the observ-able cue (e.g., the organized desk) and an observer’s judgment(e.g., of conscientiousness). The link between the observable cueand the occupant’s actual level of the underlying construct isreferred to as cue validity. If both of these links are intact, thenobserver judgments should converge with the underlying constructbeing observed and will result in observer accuracy.1 Thus, interms of the example provided in Figure 1, an organized desk (Cue1) will promote accuracy because it is both utilized and valid.
We draw on the logic of Brunswik’s (1956) lens model first toexplain the specific mechanisms by which individuals impact theirphysical surroundings and then to explain how personal environ-ments can serve as repositories of individual expression fromwhich observers can draw inferences about the occupants. Asshown in Figure 2, our model proposes four parallel mechanismslinking individuals to the environments they inhabit and a two-stepinference process linking environments to observer perceptions ofthe occupants.
Mechanisms Linking Individuals to theEnvironments They Inhabit
According to our model, the mechanisms linking individuals tothe environments they inhabit fall into two categories: identity
claims (self-directed and other directed) and behavioral residue(interior and exterior).
Self-Directed Identity Claims
People spend many of their waking hours in their personal livingand work environments, and they often decorate these places.People choose colors, patterns, motifs, and decor that fit their ownpersonal taste and aesthetic. To make these spaces their own,individuals may adorn them with self-directed identity claims—symbolic statements made by occupants for their own benefit,intended to reinforce their self-views. Many of these statementscan make use of widely understood cultural symbols (e.g., a posterof Martin Luther King, university memorabilia), whereas otherartifacts may have a more personal meaning (e.g., a pebble col-lected from a favorite beach). These latter objects can, nonetheless,convey a message to an observer even if the exact meaning of suchprivate artifacts is obscure; for example, the pebble could signifythat the occupant is sentimental or values nature.
Other-Directed Identity Claims
In addition to reinforcing their own self-views, occupants candisplay symbols that have shared meanings to make statements toothers about how they would like to be regarded (Baumeister,
1 Accuracy is referred to as functional achievement in Brunswik’s(1956) model.
Figure 1. Brunswik’s (1956) lens model.
380 GOSLING, KO, MANNARELLI, AND MORRIS

1982; Goffman, 1959; Swann, 1987; Swann, Rentfrow, & Guinn,in press). By displaying such symbols (e.g., a poster of MartinLuther King, university memorabilia), occupants may be intention-ally communicating their attitudes and values to others. Thesestatements might be sincere and intended to convey truthful mes-sages about what the individual is really like, but they may also bestrategic, even deceptive statements intended to portray the indi-vidual in a certain light. For example, the occupant of an officewho has frequent client visits may be motivated to decorate thespace in ways that suggest to others a conscientious, hard-working,and honest disposition. Similarly, the occupant of a dorm roommay be motivated to decorate his or her space with posters of rockstars and hip movies to be seen as cool by potential visitors.
We note that self-directed and other-directed identity claimsmay often result in similar environmental manifestations; for ex-ample, displaying a poster of Martin Luther King may serve bothto reinforce one’s self-view and also to communicate one’s valuesto others. Our goal here is to note that although the outcomes ofself-directed and other-directed identity claims may often overlap,they nonetheless reflect conceptually distinct motivations.
Interior Behavioral Residue
The act frequency approach to personality (Buss & Craik, 1983)defines personality traits in terms of behavioral conduct; hence, aperson who is high on a particular trait would perform more actsthat are prototypical of that trait than would a person who is lowon the trait. Personal environments are places where individualsspend a great deal of time, and certain behaviors are performedrepeatedly in these environments. Many of these behaviors leavebehind discernible residue (Webb, Campbell, Schwartz, &
Sechrest, 1966). For example, the prototypically conscientious actof organizing one’s space may leave an alphabetized CD collectionas its residue, whereas the creative act of drawing may leave a setof the occupant’s charcoal sketches lying on the floor as itsresidue. We use the term behavioral residue to refer to the physicaltraces of activities conducted in the environment. Although mostcues will reflect past behaviors, there may also be some clues toanticipated behaviors; for example, an unopened bottle of wine anda set of beanbag chairs arranged in a circle on the floor mayindicate a social occupant who is planning to entertain guests. Wepropose that personal environments such as offices and bedroomsare good receptacles of such interior behavioral residue.
Exterior Behavioral Residue
Just as personal environments may contain residue of behaviorsconducted within that space (i.e., Mechanism 3 in Figure 2), theymay also contain residue of behaviors performed by the individualentirely outside of those immediate surroundings. Remnants ofpast activities and material preparations for planned activities to beundertaken outside of the physical environment can also providebehavioral information about individuals. For example, a sensationseeker’s space might contain a snowboard and a ski pass orperhaps even some parachuting equipment. A program from arecent opera and a plane ticket could suggest that the occupantenjoys the arts and likes to travel. The distinction between interiorand exterior behavioral residue is important because it emphasizesthe breadth of information that is potentially available in a personalspace, extending to behavior occurring well beyond the limits of itsfour walls.
Figure 2. Mechanisms by which individuals impact their personal environments and processes by whichobservers infer personality.
381ROOM WITH A CUE

Again, we emphasize that these four mechanisms are not mu-tually exclusive, and it may not always be clear to observers whichmechanisms are responsible for which cues. For example, thesnowboard may indeed reflect exterior behaviors, but the occu-pant’s decision to display the snowboard (rather than stow it in acloset) may also reflect a desire to make identity claims. None-theless, we propose that these are four distinct, albeit interlinked,mechanisms by which individuals impact their environments inways that can guide observers to form impressions of personality.
Processes Linking Observer Judgmentsto Environmental Cues
Each of the four mechanisms above could provide informationabout an occupant’s personality. As we show in the lower sectionof Figure 2, we propose that observers form impressions aboutoccupants using a two-step inference process, with the possibilitythat stereotypes could intervene at either step. According to ourmodel, if stereotypes do not intervene, observers first infer thebehaviors that created the physical evidence (Step 1a), then inferthe dispositions that underlie the behaviors (Step 2a). For example,they may infer from the organized workspace that the occupantorganizes his or her belongings, and the observers may associatesuch behaviors with high levels of Conscientiousness. However,stereotypes might be activated by residue in the environment(Step 1b) or by inferred behaviors (Step 2b). In such cases,judgments about an occupant could be impacted by a stereotypethat is associated with a whole set of traits, some of which mayhave no direct link to evidence in the environment. For example,an observer might notice some Asian books on the shelves, whichmight activate stereotypes about Asians. This may result in theobserver inferring a suite of traits stereotypically associated withAsians, such as being socially responsible, conscientious, andintroverted. When multiple observers hold similar stereotypes, asthey might for common stereotypes such as sex and race, consen-sus among observers could be boosted. And when there is sometruth to these stereotypes, accuracy could be boosted (Lee, Jussim,& McCauley, 1995). Note that stereotype-based inferences(Steps 1b and 2b) differ from Steps 1a and 2a in that observersusing stereotypes may draw conclusions about traits for which theyhave no direct evidence.
Regardless of whether stereotypes intervene in the inferenceprocess, if observers make similar inferences, then consensusamong observers’ impressions should result. And if observersmake correct inferences, then those impressions should also beaccurate. However, observers may form inaccurate impressions byincorrectly matching evidence to the behaviors that caused them orby incorrectly matching the behaviors to the underlying disposi-tions. Observers’ use of invalid stereotypes would also diminishaccuracy.
Research Questions
Before we can test the specific processes hypothesized in ourmodel, it is first necessary to document the broader basic phenom-ena that underlie it. The purpose of the present article is to achievethis initial goal. Thus, our primary aim was to document evidencein personal environments for observer accuracy, links betweenoccupants and the physical features of their personal environments
(i.e., cue validity), and links between physical features of personalenvironments and observers’ impressions of occupants (i.e., cueutilization). To examine the accuracy of observer judgments basedon personal environments, we needed to test whether observers’judgments corresponded to what the individual was really like.Answering this question entailed first establishing whether observ-ers’ judgments corresponded with each other. Thus, we started byexamining interobserver agreement. We could then move on toexamine accuracy—testing whether observer impressions werecorrect. Third, we examined the links between observer impres-sions and features of the personal environments on which theimpressions were based (i.e., cue utilization) and between theenvironments and what the occupants were really like (i.e., cuevalidity). Finally, as a preliminary step to understanding the infer-ence processes in our model, we examined the role of stereotypeuse in accounting for interobserver agreement and observeraccuracy.
We addressed these issues in two settings in which people spenda lot of their time: offices and bedrooms. As we describe below,these settings provide two diverse and potentially rich contexts inwhich to examine environment-based perceptions and the pro-cesses that link persons to the spaces they inhabit. We nextdescribe the four questions that guided our research.
Question 1. Consensus: Do Observers Agree AboutIndividuals’ Personalities on the Basis
of Their Personal Environments?
Past research on social perception has examined impressions ofcompetence, ability, and personality formed on the basis of mo-mentary impressions (Ambady & Rosenthal, 1992; Blackman &Funder, 1998; Borkenau & Liebler, 1992; Chaplin, Phillips,Brown, Clanton, & Stein, 2000; Paulhus & Bruce, 1992), photo-graphs (Berry & Finch-Wero, 1993; Robins, Gosling, & Donahue,1997), and attire (Burroughs, Drews, & Hallman, 1991; R. D.Gosling & Standen, 1998). One consistent finding to emerge fromthis research is that observers can agree on some aspects of whata target individual is like even when they base their judgments onminimal information. In a meta-analysis of nine of these so-called“zero-acquaintance” studies, the consensus correlations amongobservers averaged .12 (ranging from .03 to .27) across the Five-Factor Model (FFM) personality dimensions (Kenny, 1994;Kenny, Albright, Malloy, & Kashy, 1994).2
Where do observations based on personal environments fit withthe previous zero-acquaintance research? In some sense, judg-ments based purely on personal environments are made underconditions of even less acquaintance than are judgments used intypical zero-acquaintance studies, because personal environmentsprovide absolutely no direct exposure to the targets. However, wepropose that personal environments may contain an abundance ofpotentially informative cues about an individual and thereforeprovide richer information to observers than is found in most
2 Consistent with common usage in the literature (e.g., Kenny, 1994), weuse the term zero-acquaintance to refer to studies examining impressionsbased on minimal exposure to the targets. However, it should be noted thatthe term is somewhat of a misnomer, because the judges in such studieshave at least some information on the targets.
382 GOSLING, KO, MANNARELLI, AND MORRIS

zero-acquaintance studies. Therefore, we expected to find signif-icant consensus among observer judgments based on the physicalcharacteristics of occupants’ personal environments. To test thisexpectation, we examined the degree to which observers formedsimilar impressions on the basis of work and living spaces.
According to past zero-acquaintance studies, observer consen-sus is not equally strong for all traits judged (Paulhus & Bruce,1992). Kenny’s (1994) meta-analysis showed that, by far, thestrongest consensus was obtained for Extraversion, with Consci-entiousness a distant second, and the least consensus found forAgreeableness. These findings suggest that photos, short videoclips, and brief interactions provide observers with more informa-tion about some traits than about others. Perhaps observers judgeExtraversion on the basis of the target’s facial expressions (e.g., asmile) and posture (e.g., an erect stance) and judge Conscientious-ness from the target’s level of grooming (e.g., well-combed hair).However, the informational base of previous zero-acquaintanceresearch differs substantially from the informational base of thepresent research, so we did not expect to replicate the exact patternof consensus correlations. Instead, we expected physical spaces tohold more cues to an occupant’s level of organization (e.g., fromalphabetized books and compact discs), tidiness (e.g., a neat vs.messy space), values (e.g., a poster supporting the legalization ofmarijuana), and recreational pursuits (e.g., tickets to the opera).The availability of such cues should promote relatively strongconsensus for observers’ judgments of Conscientiousness andOpenness to Experience. More generally, we expected that phys-ical spaces would provide observers with more information aboutsome traits than about others, with the result that consensus wouldvary across the traits judged.
Question 2. Accuracy:Are Observers’ Impressions Correct?
Zero-acquaintance studies have shown that even judgmentsbased on minimal information show some accuracy (e.g., Black-man & Funder, 1998; Paulhus & Bruce, 1992). Kenny’s (1994)meta-analysis of 10 zero-acquaintance studies showed that acrossthe FFM dimensions, observer judgments correlated .25 with cri-terion measures (self-reports).3 Again, we propose that personalenvironments are richer in information than are zero-acquaintancecontexts because environments probably hold many legitimatecues to what an occupant is like. Therefore, we expected signifi-cant accuracy correlations for observer judgments. To test thisidea, we compared the observers’ ratings with criterion ratings thatwere derived from self- and peer reports of the target occupants.
The zero-acquaintance research has shown that observer accu-racy is not equally strong for all traits judged. In terms of thedimensions of the FFM, the greatest accuracy has generally beenfound for Extraversion and Conscientiousness and the least accu-racy found for Openness and Agreeableness (Borkenau & Liebler,1992; Funder & Dobroth, 1987; Kenny, 1994; Paulhus & Bruce,1992). As noted above, the information available in personalenvironments differs from the information available in brief inter-actions, so we did not expect our findings to mirror the exactpattern found in zero-acquaintance research. However, we didexpect variation in the levels of accuracy across the traits judged.
Question 3. Cue Utilization and Cue Validity: WhichCues in Personal Environments Do Observers Use toForm Their Impressions, and Which Cues Are Valid?
What judgment processes might explain why observers unac-quainted with the occupants show consensus and accuracy in theirimpressions? Kenny’s (1994) Weighted-Average Model (WAM)of consensus proposes nine parameters to explain the extent towhich observers agree about a target individual. One of theseWAM parameters, similar meaning systems, refers to the degree towhich observers agree on the meaning of information (Kenny,1994). For example, do observers agree that a poster of MartinLuther King and neatly stacked papers indicate that an occupanthas liberal values and is conscientious? If observers notice theposter and the stacked papers, agree on the behavioral implicationsof this physical evidence, and agree on what the behaviors sayabout the occupant, then interobserver consensus should be strong(Hayes & Dunning, 1997). To determine which aspects of personalenvironments observers might have used to make inferences aboutthe occupants, we correlated the observer judgments with codedfeatures of the environments.
Funder’s (1995, 1999) Realistic Accuracy Model (RAM) pro-poses that observer accuracy will be promoted when observers usegood information. That is, accurate judgments should result whenobservers base their judgments on information that is actuallyrelated to the criterion. If underlying dispositions are actuallyrelated to the physical evidence in the personal environment(through manifest behavior; see Figure 2), then this evidenceprovides good information about the occupant. To determinewhich aspects of personal environments furnish good information,we correlated the criterion measures that tell us what the occupantis really like with coded features of the environments.
The WAM concept of meaning systems and the RAM conceptof good information can be brought together by interpreting theconcepts as the two halves of Brunswik’s (1956) lens model (seeFigure 1). Recall that cue utilization refers to the relation betweenjudgments and observable information in the environment and thatcue validity refers to the relation between the criterion and observ-able information in the environment. Thus, cue utilization is sim-ilar to the WAM parameter of meaning systems, and cue validityis similar to the RAM parameter of good information.
The lens model can represent all combinations of cue utilizationand cue validity, revealing sources of good and bad judgments(Funder & Sneed, 1993; Gifford, 1994). Good judgment is pro-moted when observers use valid cues (represented by Cue 1 inFigure 1) and when they ignore invalid cues (Cue 4). Poor judg-ments occur when observers ignore valid cues (Cue 2) or useinvalid cues (Cue 3). Thus, we hypothesized that accuracy wouldbe promoted when observers use good cues and disregard badones. We tested this hypothesis by comparing the pattern ofcue-utilization correlations with the pattern of cue-validity corre-lations for each trait.
3 Note that Kenny (1994) made a distinction between self–other agree-ment and accuracy. Although Kenny’s preferred criterion for accuracy wasbehavior, he acknowledged there are many cases in which behavioralobservations are not practical and in which self-reports should be used.
383ROOM WITH A CUE

Question 4. Stereotype Use: How Do Stereotypes Used byObservers Affect Consensus and Accuracy?
Kenny’s (1994) WAM also places substantial emphasis on therole stereotypes play in observer judgments, with three of theWAM parameters focusing on stereotype use. According to WAM,consensus among observers will increase to the extent that observ-ers hold similar stereotypes and use them in their judgments.Suppose that observers share the stereotype that women are moreagreeable than men; if the observers believe Personal EnvironmentA belongs to a female occupant and Personal Environment Bbelongs to a male occupant (using Steps 1b or 2b in Figure 2), theninterobserver consensus may increase, because the observers willtend to rate the occupant they believe to be female as moreagreeable than the occupant they believe to be male. To test theeffects of sex and race stereotypes on observers’ judgment, weexamined the extent to which observers rated occupants theybelieved to belong to a given social category (e.g., female, White)differently from occupants they believed did not belong to thatcategory.
Sex and race stereotypes might also account for some of theaccuracy of judgments based on personal environments. TheWAM parameter validity of stereotypes suggests that when ob-servers use a stereotype with a kernel of truth, accuracy will bepromoted (also see Lee et al., 1995). For example, if observershold the stereotype that women are more agreeable than men andif there is some truth to this stereotype, then observers using thisstereotype should show improved accuracy. To determine whetherthe sex and race stereotypes have a kernel of truth, we testedwhether perceived sex and race differences for a given traitmatched actual sex and race differences. To the extent that actualdifferences for each trait correspond to the perceived differences,accuracy should result. Thus, on the basis of the WAM, wepredicted that observer accuracy would be mediated by the ob-servers’ use of accurate stereotypes. However, we anticipated thataccurate stereotypes would only partially mediate observer accu-racy because personal environments may contain valid, individu-ating information about what the occupant is like (through Steps 1aand 2a in Figure 2) beyond the accuracy associated with the use ofvalid sex and race stereotypes.
Design of the Studies
We examined the above four questions in offices and bed-rooms, settings that may facilitate the accumulation of behav-ioral residue and permit other forms of self-expression. InStudy 1, we examined perceptions of occupants based on theiroffice spaces. Particular activities are consistently performed inoffices, permitting the accumulation of residue for work-relatedtraits. In Study 2, we examined perceptions based on personalliving spaces such as apartment rooms and dorm rooms. Thesecontexts permit a broader range of activities and self-expressionthan are permitted in offices. In both studies we collected foursources of data.
Observer Judgments
A team of observers made personality ratings of occupantsbased solely on an examination of occupants’ personal environ-
ments. The observers were undergraduate students working on theproject as research apprentices. The observers were unacquaintedwith the participants and did not discuss their ratings with oneanother. We obtained consensus estimates by computing the meancorrelation among the observers’ ratings.
Accuracy Criteria
To derive a criterion measure against which the accuracy of theobserver reports could be gauged, we obtained self-ratings fromoccupants and peer ratings from the occupants’ close acquaintan-ces. We obtained accuracy estimates by correlating the observers’ratings with the combined self- and peer ratings.
Environmental Cues
A separate team of coders examined and recorded the features ofeach room. We obtained cue-utilization estimates by correlatingthese codings with the observer judgments. We obtained cue-validity estimates by correlating the codings with the accuracycriteria. Finally, we computed vector correlations between thecue-utilization correlations and the cue-validity correlations. Thesevector correlations provide evidence as to whether the cues ob-servers used to make their judgments correspond to the cues thatare actually related to the occupants’ traits.
Sex and Race of Occupants
Observer estimates of the sex and race of occupants were usedto assess the mediational role of sex and race stereotypes oninterobserver consensus. Self-reported sex and race were used toexamine the extent to which sex and race stereotypes mediatedobserver accuracy.
Study 1: Offices
Method
Research Setting
Five office locations in a large U.S. city were chosen. These locationswere a commercial real estate agency, an advertising agency, a businessschool, an architectural firm, and a retail bank.
Occupants
With the consent of management, employees at each company weregiven an opportunity to participate in this research. In exchange for theirparticipation, occupants received feedback based on observers’ impres-sions of their offices. Ninety-four office occupants participated in thisstudy. Of the occupants who provided the relevant information, 41 (59%)were women and 28 (41%) were men, and the average age was 37.0 years(SD � 10.1). The occupants’ ethnicities were not sufficiently diverse toanalyze race effects in this sample (of those who indicated their race, 3[5%] were Asian, 57 [85%] were White, and 7 [10%] were of otherethnicity).
384 GOSLING, KO, MANNARELLI, AND MORRIS

Observer Ratings
Eight observers examined the participants’ personal workspaces andcompleted a set of ratings about each occupant.4 We wanted to learn abouteveryday impressions made by ordinary people (rather than impressionsformed by trained experts), so observers were given no instructions re-garding what information they should use to make their ratings. Theobservers had no contact with the participants and made their judgmentsindependently after entering the offices, using whatever information theythought was relevant. The number of observers in an office at any timeranged between 1 and 5, depending on the size of the office. The observersdid not communicate with one another. All photos of occupants andreferences to occupants’ names were covered before the observers enteredthe rooms.
Accuracy Criteria
The best method for assessing a psychological construct is to search forconverging evidence across assessment methods (Wiggins, 1973). Forexample, an approach that uses a combination of self- and peer reports canovercome some of the biases of either method used alone (John & Benet-Martinez, 2000; McCrae, Stone, Fagan, & Costa, 1998). Thus, we obtainedself- and peer reports on all of the dimensions examined in this study.Specifically, after providing self-ratings, occupants were asked to nominatetwo people who knew them well and could complete the peer ratings. Thepeers were sent the rating scales, which they completed confidentially andmailed back to us in return addressed, postage-paid envelopes. We wereable to obtain 69 self-reports and ratings by one or two peers for 60 of theoccupants (average acquaintance with occupant � 8.3 years, SD � 9.7).Averaged across the five dimensions examined in this study, the self-ratings correlated .40 with the peer ratings; this value is comparable to thatreported in previous research (e.g., Funder, 1980; John & Robins, 1993;McCrae et al., 1998). Although these agreement correlations were far fromperfect, the self- and peer reports each provide valuable information aboutthe occupants and were combined to form an accuracy criterion.5 Reliabil-ity of the criterion measures was computed for the composite of theself-report and two peer reports; alphas averaged .61 across the fivedimensions examined.
Sex of Occupants
Observers estimated the sex of the occupants. The actual sex of theoccupants was obtained from the occupants’ self-reports.
Environmental Features
Access to the office spaces was granted for quite limited periods of time.To minimize the time taken to code the environmental features, we usedtwo teams of two coders each. Once a team finished coding an office, itmoved on to the next office. One team of coders coded 49 offices, and theother team coded 45. For each office, both coders independently coded thespace in terms of 43 environmental features (e.g., ratings of neatness andorganization) that had been consensually selected to represent a broadrange of environmental attributes. The 43 items were selected using ex-tensive item-generation and selection procedures, the details of which canbe obtained from the first author. To control for differences in scale use bythe two teams of coders, we standardized their codings within each teambefore combining and aggregating them into composites. The codings werereasonably reliable, with a mean coefficient alpha of .63 across the 43features.
Instruments
Observer, self-, and peer reports of personality were based on the FFM(McCrae & Costa, 1999). The FFM is a hierarchical model with five broad
factors that represent personality at the broadest level of abstraction. Eachbipolar factor (e.g., Extraversion vs. Introversion) summarizes severalmore specific facets (e.g., Sociability), which, in turn, subsume a largenumber of even more specific traits (e.g., talkative, outgoing).
The FFM dimensions were assessed using the 44-item Big Five Inven-tory (BFI; John & Srivastava, 1999). The self-report version of the BFIshows high convergent validity with other self-report scales and with peerratings of the FFM. The BFI items were rated on a 7-point Likert scaleranging from 1 (disagree strongly) to 7 (agree strongly). In the presentsample, alpha reliabilities for Extraversion, Agreeableness, Conscientious-ness, Emotional Stability, and Openness to Experience averaged .88, .86,.85, .78, and .92, respectively, across the eight observers; averaged .85, .84,.86, .83, and .83, respectively, across the two peers; and were .84, .76, .75,.79, and .81, respectively, for the self-reports. These values are typical ofthose reported for the BFI (John & Srivastava, 1999).
Results and Discussion
Question 1: Consensus
Based on past zero-acquaintance research, we predicted thatobservers would agree about the occupants’ personalities solely onthe basis of the occupants’ workspaces. To test this prediction, wecomputed an index of interobserver consensus by taking the meanof all 28 possible pairwise correlations among the eight observers.Across the traits, the mean of the 28 pairwise correlations waspositive and significant (r � .34), supporting our prediction.
We further predicted that interobserver consensus would varyacross traits. To test this hypothesis, we computed interobserverconsensus separately for the five dimensions. The mean pairwiseconsensus correlations for each trait are shown in the first datacolumn of Table 1. As can be seen, interobserver consensus variedsubstantially across the traits. Of the FFM dimensions, Opennessshowed the strongest consensus, followed by Conscientiousnessand Extraversion. Agreeableness also showed some consensus,with the least consensus found for Emotional Stability.
The pattern of consensus correlations found here is differentfrom that found in previous zero-acquaintance research, suggestingthat the cues available from photographs or short interactionsdiffer from those available from workspaces. Whereas zero-acquaintance research using the FFM has found the strongestconsensus for Extraversion and Conscientiousness (e.g., Kenny,1994; Kenny et al., 1994; Kenny, Horner, Kashy, & Chu, 1992;Park & Judd, 1989), we found the strongest consensus for Open-ness, although we still found strong consensus for Conscientious-ness and Extraversion.
Question 2: Accuracy
We obtained an index of accuracy by correlating the aggregatedobserver ratings with the composite criterion ratings. The aggre-gate of observer ratings is independent of the idiosyncrasies of any
4 In some cases only seven observers were present because of schedulingdifficulties.
5 An alternative way of gauging accuracy is to use the self- and peerreports as separate criteria rather than combining them. However, thebiases of each of these sources of information could skew the accuracyfindings. For example, the self-reports are probably saturated with other-directed identity claims, whereas peer reports partly reflect observations ofbehaviors that leave residues in the rooms.
385ROOM WITH A CUE

single observer and thus provides the most reliable measure of howmuch strangers learn about an occupant by observing the occu-pant’s personal workspace (Block, 1961). The accuracy findingsare presented in the second data column of Table 1. Consistentwith our hypothesis, the accuracy correlations were positive andsignificant—indeed, considering that the observers had absolutelyno direct contact with the occupants, they were quite substantial—averaging .22 across the five dimensions examined.
Also consistent with our predictions, the level of accuracyvaried across traits. Accuracy was highest for Openness, followedby Extraversion, Conscientiousness, and Emotional Stability.Judgments of Agreeableness were not accurate. Again, the patternof findings differed from the general pattern of findings in zero-acquaintance research, in which Extraversion usually yields thehighest accuracy, followed by Conscientiousness, with little or noaccuracy for Emotional Stability and Openness (Kenny, 1994;Watson, 1989).
Question 3: Cues
Drawing on the logic of Brunswik’s (1956) lens model, weconducted a series of analyses to test (a) the extent to whichobservers used physical characteristics of the rooms to makeinferences about occupants’ personalities, and (b) the extent towhich the physical characteristics of the rooms were related towhat the occupants were really like.
Cue utilization. The cue-utilization correlations in the right-hand section of Table 2 reflect the relationships between theaggregated observers’ ratings and the coded physical features ofthe offices. These cue-utilization correlations show which cuesmay have acted as Brunswikian lenses through which the observ-ers perceived characteristics of the occupants. It is not surprisingthat the personality dimensions that achieved the strongest con-sensus also yielded the most associations with specific cues in thework environment. Thus, Openness and Conscientiousness had thelargest number of significant cue-utilization correlations.
Which particular cues might we expect observers to use? Withinthe FFM framework, Conscientiousness is associated with order,
efficiency, and self-discipline. Therefore, it would be reasonablefor observers to expect the office of a conscientious person to beorganized, efficiently arranged, clean, and uncluttered. The cue-utilization correlations suggest that the observers indeed used thesetypes of cues, with their judgments of Conscientiousness correlat-ing .56, .44, .73, and �.55 with good use of space, clean, orga-nized, and cluttered, respectively. As shown in Table 2, the ob-servers drew on a wide range of cues to infer the occupants’ levelsof Conscientiousness, most of which are consistent with the FFMdefinition of what it means to be conscientious (e.g., organized andtidy).
Individuals who are high in Openness tend to be curious, imag-inative, and unconventional and to have wide interests. Thus, itmakes sense that observers appeared to base their judgments ofOpenness on cues that reflect these traits, such as the distinctive-ness of the spaces (.60), the level of decoration (.49), the quantityof magazines (.34), and the quantity and variety of books (.28 and.44) and compact discs (.32 and .61).
Extraversion is associated with sociability, enthusiasm, talk-ativeness, and assertiveness. It is difficult to imagine which con-crete elements of physical environments might reflect these traits.As Table 2 shows, offices that were, among other things, decorated(.48), cheerful (.47), colorful (.46), cluttered (.24), inviting (.35),and unconventional (.41) were believed to belong to extravertedoccupants. Few of the coded cues were related to observers’ratings of Agreeableness or Emotional Stability.
As has been noted by Funder and Sneed (1993), such correla-tional analyses must be interpreted cautiously until future experi-mental research can address two limitations. First, although thecorrelations showed that observers’ judgments were associatedwith the presence of certain cues, the correlations did not show thatthe observers actually used these cues to make their judgments.Second, the present analyses did not have the power to assess (e.g.,by multiple regression) the degree to which the environmental cuesoverlapped or were used independently by the observers.
Cue validity. The correlations in the left-hand section of Ta-ble 2 reflect the relationship between the accuracy criterion and the
Table 1Judgments Based on Offices: Consensus, Accuracy, and Column–Vector Correlations
FFM personality dimensions
Question 1:Interobserver consensus
(Mean n � 76)a
Question 2:Observer accuracy
(n � 70)
Question 3:Vector correlations
(n � 43)
Extraversion .39** .24* .36*Agreeableness .23* �.04 �.08Conscientiousness .42** .24* .80**Emotional Stability .14 .19 .09Openness to Experience .51** .46** .60**
Note. Interobserver consensus is the mean of the 28 correlations derived from all possible pairwise combina-tions of eight observers. Observer accuracy is the correlation between the aggregated observer ratings and thecomposite criterion ratings. The vector correlations reflect the convergence between the cue-utilization corre-lations and the cue-validity correlations. FFM � Five-Factor Model.a Significance of consensus correlations was based on sample size of 76, the average number of cases acrosswhich the correlations were computed. When consensus was determined from intraclass correlations using thesubset of rooms for which there was no missing data, the pattern of findings was almost identical, with all fiveconsensus correlations reaching significance at the .01 level.* p � .05, one-tailed. ** p � .01, one-tailed.
386 GOSLING, KO, MANNARELLI, AND MORRIS

coded physical features of the offices. These cue-validity correla-tions show which office cues were actually related to characteris-tics of the occupants.
As discussed in the previous section, the cue-utilization corre-lations shown in Table 2 suggest that observers relied on intu-itively sensible cues to judge occupants’ Conscientiousness, suchas the degree to which the offices were well-organized, neat, anduncluttered. The cue-validity correlations shown in Table 2 sug-gest that these intuitions had some merit; the rooms of conscien-tious individuals were well organized (.35), neat (.30), and unclut-tered (.29), but conscientious persons’ offices did not makeparticularly good use of the space.
The Openness cue-validity correlations also support the observ-ers’ intuitions that people who were high in Openness occupieddistinctive (.30) and unconventional (.24) offices. Compared withintroverts, extraverts’ offices appeared to be crafted to encourageinteraction; they were relatively warm (.26), decorated (.27), andinviting (.29). However, very few of the coded cues related to theoccupants’ levels of Agreeableness and Emotional Stability in anintuitively compelling way.
Intercorrelations of column vectors. To test more formally theextent to which observers’ cue-utilization patterns matched thepatterns of cue-validity correlations, we computed intercorrela-tions among the column vectors in Table 2 (see Funder & Sneed,
Table 2A Brunswik (1956) Lens Model Analysis of Judgments Based on Offices: Cue-Validity and Cue-Utilization Correlations
Cue-validity correlations Cue-utilization correlations
Extra. Agree. Cons. Em. St. Open. Environmental cues (“lens”) Extra. Agree. Cons. Em. St. Open.
.11 �.03 �.02 .03 .12 Strong (vs. weak) odor .12 �.21* �.04 �.11 .01
.21 �.05 �.09 �.02 .15 Noisy (vs. quiet) .14 .14 �.16 �.03 .21*�.04 .00 .07 �.04 �.10 Well lit (vs. dark) �.03 �.12 .02 .00 �.08
.10 .00 .09 .14 .14 Drafty (vs. stuffy) �.03 �.06 �.02 .02 �.03
.10 �.04 .00 .11 .24* Fresh (vs. stale) .03 .00 �.08 �.04 .06
.26* �.09 �.04 �.16 .01 Hot (vs. cold) .12 .06 �.01 �.05 .21*
.02 .11 .25* �.01 .05 Good (vs. poor) condition .01 �.01 .57** .20 .01
.27* �.05 �.06 �.26* .04 Decorated (vs. undecorated) .48** .09 �.12 .13 .49**
.22 .03 .05 �.22 .17 Cheerful (vs. gloomy) .47** .19 �.03 .09 .44**
.15 .06 .03 �.15 .16 Colorful (vs. drab) .46** .16 .02 .07 .45**
.01 .22 .24* .16 �.08 Clean (vs. dirty) .00 .09 .44** .11 �.13
.14 .14 .35** .07 �.02 Organized (vs. disorganized) �.09 .08 .73** .15 �.14
.17 .12 .30* .09 �.07 Neat (vs. messy) �.13 .10 .73** .15 �.19�.19 .00 �.29* �.07 �.04 Cluttered (vs. uncluttered) .24* �.03 �.55** �.07 .23*�.14 .14 �.18 �.09 �.03 Full (vs. empty) .33** .03 �.47** �.10 .30**
.13 �.08 .14 �.04 .08 Roomy (vs. cramped) �.06 �.05 .42** .06 .07�.01 .09 .20 .01 .14 Expensive (vs. cheap) .07 �.03 .28** .02 .25*
.21 .04 .15 �.07 .15 Comfortable (vs. uncomfortable) .15 .07 .44** .16 .28**
.29* �.08 .07 �.18 .15 Inviting (vs. repelling) .35** .27** .33** .29** .38**�.11 �.03 �.08 �.11 .12 Large (vs. small) .01 �.10 .33** .06 .28**
.11 �.04 �.03 �.24* .30* Distinctive (vs. ordinary) .42** �.01 �.24* �.02 .60**
.14 .06 .12 �.12 .26* Stylish (vs. unstylish) .34** .05 .14 .10 .51**
.03 .21 .07 .21 .02 Modern (vs. old fashioned) .23* �.11 .01 .00 .22*
.03 .14 .09 �.02 .00 New (vs. old) �.03 �.14 .15 �.02 .05
.03 .03 �.05 �.06 .05 Multiple (vs. single) purpose .21* �.05 �.08 �.09 .24*�.11 .16 .01 .17 �.12 Public (vs. private)a .02 .05 �.18 �.05 �.36**
.09 .03 .18 .27* �.14 Formal (vs. informal)a �.10 �.06 .47** .11 �.14�.08 �.11 .01 .08 �.24* Conventional (vs. unconventional)a �.41** .00 .29** .00 �.53**
.04 .13 �.03 �.03 .00 Centrally (vs. peripherally) locateda �.04 .12 .12 .11 �.24*
.03 .25* .02 .14 �.06 High (vs. low) traffic areaa .05 .15 �.03 .03 �.24*
.06 .10 .13 .03 �.05 Good (vs. poor) use of spacea .12 �.01 .56** .18 �.01�.15 .22 .09 .01 �.10 Matched (vs. mismatched) contentsa .08 .02 .33** .10 .03�.07 �.06 �.12 �.19 .06 Many (vs. few) books �.05 �.01 .02 .03 .28**�.15 �.08 .10 �.14 �.14 Organized (vs. disorganized) books �.11 .02 .32* .13 �.09
.03 �.01 �.32* �.23 .30 Varied (vs. homogenous) books .26* �.05 �.27* �.12 .44**
.01 .11 �.01 .07 .16 Many (vs. few) magazines .23* �.02 �.17 .05 .34**�.43* �.14 .12 .14 �.04 Organized (vs. disorganized) magazines �.18 .09 .32 .03 .13
.00 .33 �.14 �.07 .18 Varied (vs. homogenous) magazines .26 �.01 �.42** �.15 .17
.12 �.04 �.03 �.18 .22 Many (vs. few) CDs .23* .15 �.19 .03 .32**
.07 .08 .04 �.14 .28 Organized (vs. disorganized) CDs �.25 .00 .11 �.30 �.01�.06 .22 �.62* �.26 �.14 Varied (vs. homogenous) CDs .50* �.17 �.47 �.08 .61**
.04 �.02 .02 .09 .04 Many (vs. few) items of stationery .07 .06 �.04 �.15 �.04�.28 .27 .12 .11 �.28 Organized (vs. disorganized) stationery �.04 .05 .53** .12 �.13
Note. Extra. � Extraversion; Agree. � Agreeableness; Cons. � Conscientiousness; Em. St. � Emotional Stability; Open. � Openness.a Cue was assessed in Study 1 but not in Study 2.* p � .05, two-tailed. ** p � .01, two-tailed.
387ROOM WITH A CUE
1993). Specifically, we first transformed the cue-utilization andcue-validity correlations using Fisher’s r-to-z formula and then, foreach trait, correlated the transformed correlations across the cues.The vector correlations thus obtained (shown in the last datacolumn of Table 1) are useful because they permit one to gauge theoverall congruence between the cue-utilization and cue-validitypatterns.
If the physical features of the rooms accounted for observers’accuracy, then the vector correlations should be highest for theaccurately judged traits. The two most accurately judged traits—Openness and Conscientiousness—were indeed characterized bysubstantial vector correlations. Similarly, the least accuratelyjudged traits—Agreeableness and Emotional Stability—were char-acterized by weak vector correlations. However, the magnitude ofaccuracy correlations was not universally matched by the magni-tude of vector correlations. If direct inferences based on cues donot account for the accuracy (i.e., Steps 1a and 2a in Figure 2),perhaps accuracy can be explained by the use of stereotypes (i.e.,Steps 1b and 2b in Figure 2). We next examine the role of sexstereotypes in promoting consensus and accuracy.
Question 4: Stereotype Use
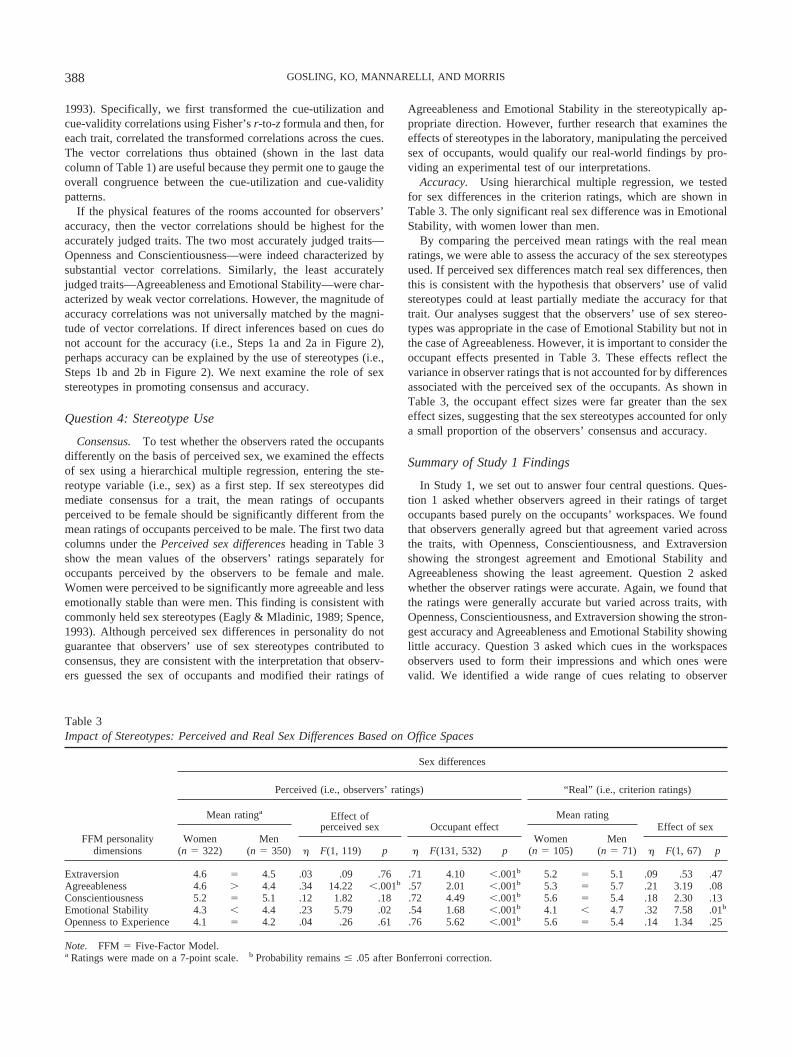
Consensus. To test whether the observers rated the occupantsdifferently on the basis of perceived sex, we examined the effectsof sex using a hierarchical multiple regression, entering the ste-reotype variable (i.e., sex) as a first step. If sex stereotypes didmediate consensus for a trait, the mean ratings of occupantsperceived to be female should be significantly different from themean ratings of occupants perceived to be male. The first two datacolumns under the Perceived sex differences heading in Table 3show the mean values of the observers’ ratings separately foroccupants perceived by the observers to be female and male.Women were perceived to be significantly more agreeable and lessemotionally stable than were men. This finding is consistent withcommonly held sex stereotypes (Eagly & Mladinic, 1989; Spence,1993). Although perceived sex differences in personality do notguarantee that observers’ use of sex stereotypes contributed toconsensus, they are consistent with the interpretation that observ-ers guessed the sex of occupants and modified their ratings of
Agreeableness and Emotional Stability in the stereotypically ap-propriate direction. However, further research that examines theeffects of stereotypes in the laboratory, manipulating the perceivedsex of occupants, would qualify our real-world findings by pro-viding an experimental test of our interpretations.
Accuracy. Using hierarchical multiple regression, we testedfor sex differences in the criterion ratings, which are shown inTable 3. The only significant real sex difference was in EmotionalStability, with women lower than men.
By comparing the perceived mean ratings with the real meanratings, we were able to assess the accuracy of the sex stereotypesused. If perceived sex differences match real sex differences, thenthis is consistent with the hypothesis that observers’ use of validstereotypes could at least partially mediate the accuracy for thattrait. Our analyses suggest that the observers’ use of sex stereo-types was appropriate in the case of Emotional Stability but not inthe case of Agreeableness. However, it is important to consider theoccupant effects presented in Table 3. These effects reflect thevariance in observer ratings that is not accounted for by differencesassociated with the perceived sex of the occupants. As shown inTable 3, the occupant effect sizes were far greater than the sexeffect sizes, suggesting that the sex stereotypes accounted for onlya small proportion of the observers’ consensus and accuracy.
Summary of Study 1 Findings
In Study 1, we set out to answer four central questions. Ques-tion 1 asked whether observers agreed in their ratings of targetoccupants based purely on the occupants’ workspaces. We foundthat observers generally agreed but that agreement varied acrossthe traits, with Openness, Conscientiousness, and Extraversionshowing the strongest agreement and Emotional Stability andAgreeableness showing the least agreement. Question 2 askedwhether the observer ratings were accurate. Again, we found thatthe ratings were generally accurate but varied across traits, withOpenness, Conscientiousness, and Extraversion showing the stron-gest accuracy and Agreeableness and Emotional Stability showinglittle accuracy. Question 3 asked which cues in the workspacesobservers used to form their impressions and which ones werevalid. We identified a wide range of cues relating to observer
Table 3Impact of Stereotypes: Perceived and Real Sex Differences Based on Office Spaces
FFM personalitydimensions
Sex differences
Perceived (i.e., observers’ ratings) “Real” (i.e., criterion ratings)
Mean ratinga Effect ofperceived sex Occupant effect
Mean ratingEffect of sex
Women(n � 322)
Men(n � 350) � F(1, 119) p � F(131, 532) p
Women(n � 105)
Men(n � 71) � F(1, 67) p
Extraversion 4.6 � 4.5 .03 .09 .76 .71 4.10 �.001b 5.2 � 5.1 .09 .53 .47Agreeableness 4.6 � 4.4 .34 14.22 �.001b .57 2.01 �.001b 5.3 � 5.7 .21 3.19 .08Conscientiousness 5.2 � 5.1 .12 1.82 .18 .72 4.49 �.001b 5.6 � 5.4 .18 2.30 .13Emotional Stability 4.3 � 4.4 .23 5.79 .02 .54 1.68 �.001b 4.1 � 4.7 .32 7.58 .01b
Openness to Experience 4.1 � 4.2 .04 .26 .61 .76 5.62 �.001b 5.6 � 5.4 .14 1.34 .25
Note. FFM � Five-Factor Model.a Ratings were made on a 7-point scale. b Probability remains � .05 after Bonferroni correction.
388 GOSLING, KO, MANNARELLI, AND MORRIS

ratings of Conscientiousness and Openness. We also identified anumber of cues relating to what the occupants were really like,especially for Conscientiousness and Openness. Of the cues weassessed, observers seemed to use valid cues to judge Conscien-tiousness, Openness, and, to a lesser extent, Extraversion but not tojudge Agreeableness and Emotional Stability. Question 4 askedwhether observers’ use of sex stereotypes could account for inter-observer consensus and observer accuracy. Consensus and accu-racy were only partially mediated by sex stereotypes, with sexstereotypes potentially accounting for some of the consensus aboutoccupants’ Agreeableness and Emotional Stability and for some ofthe accuracy of observer ratings of occupants’ Emotional Stability.
It is interesting that observers seemed to rely on stereotypes forthose traits for which the office environment provided the fewestclues (see the cue-utilization correlations in Table 2). This isconsistent with research that suggests that the more individuatinginformation observers have about a target, the less likely they areto use sex stereotypes in their judgments (Locksley, Borgida,Brekke, & Hepburn, 1980).
Study 2: Bedrooms
The results of Study 1 were promising but raised the question ofhow well the findings generalize to other personal environments.Although office spaces clearly contain behavioral residue andexpressions of identity, they may provide a window into only asubset of traits because of the limited scope of activities and formsof self-expression that occur in office environments. It is possible,for example, that the corporate setting promotes the expression ofwork-related traits (e.g., Conscientiousness) but stifles the expres-sion of non-work-related traits (e.g., Agreeableness).
Thus, in Study 2 our goal was to focus on an ecologically richerenvironment that may facilitate a broader range of individualexpression and serve as the repository for a wider range of behav-ioral residue. For this purpose, we needed to examine spaces inwhich occupants spend much of their time and that are used for avariety of purposes, not just for working. Given these require-ments, we examined student accommodations; these spaces aremultipurpose, often serving as places to entertain friends, relax,sleep, eat, and study. In Study 2, our sample was from a largepublic West Coast university with an ethnically diverse studentbody, permitting us to broaden our analyses to examine both sexand race stereotypes.
Method
The methods and procedure for this study essentially duplicate thoseused in Study 1, with seven observers independently rating 83 occupantssolely on the basis of their personal living spaces.
Research Setting
The personal living spaces were rooms in private houses, apartments,dormitories, co-ops, and Greek-system housing situated in an urban settingclose to a large West Coast public university. Most of the rooms we studiedhad single occupants, but we did examine shared rooms in which theoccupants’ section of the room could be clearly demarcated.
Occupants
Eighty-three college students or recent graduates with an average ageof 21.9 (SD � 2.8) years participated in this study. Of those who indicated
their gender and ethnicity, 54 (69%) were women, 24 (31%) were men, 32(42%) were Asian, 27 (36%) were White, and 17 (22%) were of otherethnicities. In exchange for their participation, occupants received feed-back based on the observers’ impressions of their rooms.
Observer Ratings
Seven observers examined the participants’ personal living spaces andcompleted a set of ratings about each occupant.6 As in Study 1, observerswere given no instructions regarding what information they should use tomake their ratings. The observers had no contact with the participants andmade their judgments independently after entering the rooms, using what-ever information they thought was relevant. The number of observers in aroom at any time ranged between 1 and 6, depending on the size of theroom. The observers did not communicate with one another. All photos andreferences to occupants’ names were covered before the observers enteredthe rooms.
Accuracy Criteria
We obtained self-ratings from 78 of the occupants as well as peer ratingsby one or two friends for 77 of the occupants (average acquaintance withoccupant � 3.4 years, SD � 3.5). Agreement between self- and peerratings of personality was strong; across the five dimensions examined inthis research, the self- and peer ratings correlated .53. We again combinedthe self- and peer reports to form a composite accuracy criterion index.Reliability of the criterion measures was computed for the composite of theself- and two peer reports; alphas averaged .78 across the five dimensionsexamined.
Sex and Race of Occupants
Observers estimated the sex and race of the occupants. The actual sexand race of the occupants were obtained from the occupants’ self-reports.
Environmental Features
A team of 3 coders independently coded each room in terms of 42environmental features (e.g., ratings of neatness and organization). Thecue-rating instrument (S. D. Gosling, Martin, Craik, & Pryor, 2001) wastailored for use in personal living spaces and therefore differed slightlyfrom the cue instrument used in Study 1. For example, two items referringto the amount of clothing in the room were added, and seven variablesthought to be primarily relevant to office spaces (e.g., private vs. public)were omitted.
Coder ratings were aggregated into composites. These composite cod-ings showed reasonable levels of reliability, with a mean coefficient alphaof .72 across the 42 features. The composite codings were more reliablethan the codings of Study 1, reflecting the fact that the study of livingspaces used 1 more coder than did the study of workspaces.
Instruments
Observer, self-, and peer reports of personality were made in terms of theFFM using the BFI. The BFI items were rated on a 5-point Likert scaleranging from 1 (disagree strongly) to 5 (agree strongly). In the presentsample, alpha reliabilities for Extraversion, Agreeableness, Conscientious-ness, Emotional Stability, and Openness to Experience averaged .91, .87,.92, .75, and .94, respectively, across the 7 observers; averaged .92, .86,.88, .87, and .87, respectively, across the two peers; and were .90, .72, .79,
6 In some cases only six observers were present because of schedulingdifficulties.
389ROOM WITH A CUE

.86, and .84, respectively, for the self-reports. These values are typical ofthose reported for the BFI (John & Srivastava, 1999).
Results and Discussion
Question 1: Consensus
We computed an index of interobserver consensus by taking themean of all 21 possible pairwise correlations among the sevenobservers. The mean pairwise consensus correlations for each traitare shown in the first data column of Table 4. Across the traits, themean of the 21 pairwise correlations was positive and significant(r � .34).
As in Study 1, there was substantial variation across traits ininterobserver consensus. Furthermore, the variation in consensuscorrelations for the FFM dimensions had a remarkable resem-blance to the pattern of correlations in Study 1; the strongestconsensus was found for Openness and Conscientiousness, fol-lowed by Extraversion and Agreeableness, and little consensuswas found for Emotional Stability.
Question 2: Accuracy
We again derived an index of accuracy by correlating theaggregated composite observers’ scores with the composite crite-rion scores. The accuracy findings are presented in the second datacolumn of Table 4. The correlations averaged .37 across the fivedimensions examined, suggesting that greater overall accuracy wasobtained from bedrooms than from offices (for which the meancorrelation was .22). To put the magnitude of these accuracycorrelations in perspective, one should recall that observers hadabsolutely no direct contact with the occupants.
As in the study of office spaces, the variation in accuracy acrossthe FFM dimensions differed from that reported in past zero-acquaintance research. As in Study 1, accuracy was strongest forOpenness, followed by Conscientiousness and Emotional Stability.Accuracy was significant but weaker for Extraversion andAgreeableness.
Question 3: Cues
We again examined the role of physical cues in the judgmentprocess.
Cue utilization. The cue-utilization correlations in Table 5reflect the relationship between the aggregated observers’ ratingsand the coded physical features of the bedrooms. As with theoffices, the cue-utilization correlations suggest that the bedroomobservers used intuitively sensible cues to judge Conscientious-ness, with their judgments of Conscientiousness correlating .61,.70, and �.56 with clean, organized, and cluttered, respectively.As in Study 1, the results shown in Table 5 suggest that theobservers drew on a wide range of intuitively compelling cuesrelated to cleanliness and organization to infer the occupants’levels of Conscientiousness. In addition, they rated the occupantsof rooms that were comfortable and inviting as conscientious,perhaps reflecting a belief that a consistent and concerted effort isrequired to make a place pleasant.
The patterns of cue utilization for judgments of Openness alsomade sense, with observers apparently basing their judgments ofOpenness on the distinctiveness of the rooms (.35), the level ofdecoration (.35), and the quantity or variety of books, magazines,and compact discs.
Agreeableness is associated with interpersonal warmth, sympa-thy, modesty, and trust. Unlike offices, bedrooms contained manycues that were associated with observer judgments of Agreeable-ness. The correlations in Table 5 show that rooms that werecheerful (.66), colorful (.51), clean (.37), organized (.26), neat(.33), comfortable (.43), and inviting (.52) and did not have clothesstrewn about (�.39) were believed to be occupied by agreeableindividuals. It is difficult to imagine how all of these elementsmight relate to Agreeableness, but one possible explanation is thatthe observers could have based their ratings on a folk belief thatlike goes with like (Gilovich & Savitsky, 1996), perhaps conclud-ing that pleasant people occupy pleasant rooms. Another possibil-ity is that observers associate Agreeableness with an occupant’sconcern for the aesthetic comfort of visitors.
Table 4Judgments Based on Bedrooms: Consensus, Accuracy, and Column–Vector Correlations
FFM personality dimensions
Question 1:Interobserver consensus
(Mean n � 68)a
Question 2:Observer accuracy
(n � 79)
Question 3:Vector correlations
(n � 42)
Extraversion .31* .22* .24Agreeableness .20 .20* �.23Conscientiousness .47** .33** .79**Emotional Stability .08 .36** .16Openness to Experience .58** .65** .80**
Note. Interobserver consensus is the mean of the 21 correlations derived from all possible pairwise combina-tions of seven observers. Observer accuracy is the correlation between the aggregated observer ratings and thecomposite criterion ratings. The vector correlations reflect the convergence between the cue-utilization corre-lations and the cue-validity correlations. FFM � Five-Factor Model.a Significance of consensus correlations were based on sample size of 68, the average number of cases acrosswhich the correlations were computed. When consensus was determined from intraclass correlations using thesubset of rooms for which there were no missing data, the pattern of findings was almost identical, with alldimensions except Emotional Stability reaching significance at the .01 level.* p � .05, one-tailed. ** p � .01, one-tailed.
390 GOSLING, KO, MANNARELLI, AND MORRIS

In contrast to judgments made in offices, bedroom-based judg-ments of Extraversion did not reliably correlate with features of thepersonal living spaces, with the few exceptions including decora-tion (.41) and clutter (.24). Few of the coded cues were related toobservers’ ratings of Emotional Stability, although it is interestingthat cues related to certain ambient factors (e.g., lighting, airquality) showed modest correlations.
Cue validity. The cue-validity correlations in Table 5 reflectthe relationship between the accuracy criterion and the codedphysical features of the bedrooms. These correlations show whichcues in the rooms were actually related to characteristics of theoccupants.
As in the case of offices, the correlations in Table 5 suggest thatobservers’ intuitions about Conscientiousness cues were largely
valid; the rooms of conscientious individuals were indeed well-organized (.29), neat (.27), and uncluttered (�.32).
Again, the Openness cue-validity correlations provide somevalidation of the observers’ intuitions, such that the distinctivenessof the rooms (.35) and the variety of books (.44) and magazines(.51) were valid cues to an occupant’s Openness. Note that it is thevariety, not the quantity, of books and magazines that served as thecrucial cue to an individual’s Openness.
Very few of the coded cues were related to the occupants’ levelsof Extraversion, Agreeableness, and Emotional Stability, with thefew significant correlations quite possibly having arisen by chance.
Intercorrelations of column vectors. The patterns of cue-utilization and cue-validity correlations for bedrooms reveal arange of success in judgments. For traits such as Conscientious-
Table 5A Brunswik (1956) Lens Model Analysis of Judgments Based on Bedrooms: Cue-Validity and Cue-Utilization Correlations
Cue-validity correlations Cue-utilization correlations
Extra. Agree. Cons. Em. St. Open. Environmental cues (“lens”) Extra. Agree. Cons. Em. St. Open.
�.05 �.04 �.15 �.08 �.09 Strong (vs. weak) odor �.15 �.15 �.05 �.19 .01.13 �.11 .00 �.05 .05 Noisy (vs. quiet) in room .05 �.07 �.03 �.09 .02.25* .00 .06 .10 .06 Noise (vs. quiet) in housea .21 .06 �.04 .01 .04.03 �.13 .16 .19 �.16 Noise (vs. quiet) outsidea .12 .10 .05 .17 �.19
�.14 �.05 .26* .18 �.05 Well lit (vs. dark) [overall] �.02 .04 .07 .23* �.01�.13 �.01 .24* .20 �.18 Well lit (vs. dark) [natural light]a .04 .06 .22* .22* .00�.17 �.15 .04 �.01 �.17 Well lit (vs. dark) [artificial light]a .07 .20 .08 .17 �.10
.08 �.16 .09 .07 .01 Drafty (vs. stuffy) .06 .20 .15 .17 .02�.04 �.11 .17 �.16 �.02 Fresh (vs. stale) .20 .20 .13 .24* .06
.00 .17 .13 .01 �.03 Hot (vs. cold) �.06 �.14 .05 �.06 �.18
.03 �.09 .15 �.09 �.02 Good (vs. poor) condition .03 .37** .57** .02 �.03
.06 �.11 �.10 �.15 .21 Decorated (vs. undecorated) .41** .20 .04 .11 .35**
.02 �.05 .07 �.03 .00 Cheerful (vs. gloomy) .16 .66* .46* .12 .00
.07 �.16 .05 �.08 .12 Colorful (vs. drab) .21 .51** .42** .15 .11
.08 �.06 .17 �.08 .02 Clean (vs. dirty) �.02 .37** .61** �.06 �.11
.13 �.12 .29** .08 �.01 Organized (vs. disorganized) .01 .26* .70** �.02 �.02
.13 �.09 .27* .04 .04 Neat (vs. messy) �.05 .33** .75** �.06 �.08�.06 �.01 �.32** �.14 .14 Cluttered (vs. uncluttered) .24* �.15 �.56** .05 .26*�.01 �.04 �.11 .07 .03 Clothing everywhere (vs. none visible)a .13 �.39** �.57** .12 .17�.01 .01 �.24 �.18 �.22 Clothing strewn around (vs. organized)a �.04 �.23 �.28* .02 �.06�.04 �.01 �.26* �.16 .15 Full (vs. empty) .19 �.05 �.35** .02 .22*�.03 �.03 .17 .12 �.02 Roomy (vs. cramped) �.01 .12 .34** �.07 �.05�.02 �.08 .04 �.07 �.09 Expensive (vs. cheap) .11 .21 .31** .13 .04
.01 .03 .24* �.05 .03 Comfortable (vs. uncomfortable) �.07 .43** .62** �.15 .03
.06 .00 .19 �.07 .05 Inviting (vs. repelling) �.01 .52** .64** �.03 �.01
.08 .01 .03 .13 .16 Large (vs. small) �.02 .04 .20 �.07 .10
.19 �.03 �.06 .04 .35** Distinctive (vs. ordinary) .20 .01 .12 �.04 .35**
.01 .01 .14 .04 .07 Stylish (vs. unstylish) .15 .33** .34** .20 .11�.04 �.10 .24* .06 �.09 Modern (vs. old fashioned) .05 .27* .23* .18 �.03�.08 �.20 .14 �.09 �.03 New (vs. old) .11 .38** .29** .18 �.01
.02 �.12 .04 �.02 .13 Multiple (vs. single) purpose .14 .03 .05 .15 .23*�.09 �.08 �.01 .03 .16 Many (vs. few) books �.13 �.17 .00 �.20 .37**�.03 �.13 .24* .07 �.02 Organized (vs. disorganized) books �.16 .10 .50** �.05 .08
.14 �.13 .06 �.02 .44** Varied (vs. homogenous) books �.07 �.01 .01 �.07 .50**
.01 �.01 .11 �.02 .18 Many (vs. few) magazines .05 �.21 �.07 .07 .16
.29 �.38** .22 .00 .14 Organized (vs. disorganized) magazines .36* .23 .27 .12 .01
.15 �.03 �.14 �.11 .51** Varied (vs. homogenous) magazines �.05 �.23 �.17 �.19 .33*�.03 �.14 �.01 �.02 .17 Many (vs. few) CDs .11 �.10 �.03 .10 .32**
.08 �.15 .27* .06 �.06 Organized (vs. disorganized) CDs .04 .26* .47** �.01 .02�.02 �.26* .01 �.19 .22 Varied (vs. homogenous) CDs .01 .03 .15 �.08 .09�.18 .17 �.17 .02 .13 Many (vs. few) items of stationery �.01 �.07 �.29** �.06 .19
.26* �.03 .21 .04 .06 Organized (vs. disorganized) stationery .00 .41** .59** �.12 �.13
Note. Extra. � Extraversion; Agree. � Agreeableness; Cons. � Conscientiousness; Em. St. � Emotional Stability; Open. � Openness.a Cue was assessed in Study 2 but not in Study 1.* p � .05, two-tailed. ** p � .01, two-tailed.
391ROOM WITH A CUE

ness, the observers appear to have done a good job, making use ofthe valid cues and ignoring the invalid cues. Again, we formallytested the extent to which observers’ cue-utilization patternsmatched the patterns of cue-validity correlations by computing aseries of correlations between the column vectors for each trait.The vector correlations thus obtained are shown in the last datacolumn of Table 4.
As in the study of offices, we generally found that in bedroomsthe vector correlations were highest for the accurately judgedtraits. Two of the most accurately judged traits—Openness andConscientiousness—were characterized by substantial vector cor-relations. Similarly, the least accurately judged traits—Extra-version and Agreeableness—were characterized by weak vectorcorrelations. However, the magnitude of accuracy correlations wasnot uniformly matched by the magnitude of vector correlations; forexample, Emotional Stability had a substantial accuracy correla-tion but a weak vector correlation. Thus, it again seems possiblethat observers’ use of cues (i.e., Steps 1a and 2a in Figure 2) is notthe whole story and that observers’ use of stereotypes (i.e.,Steps 1b and 2b in Figure 2) may account for at least some of theiraccuracy.
Question 4: Stereotype Use
Consensus. As in Study 1, we used a hierarchical multipleregression to examine the effects of sex and race, entering thestereotype variables (i.e., sex or race) as the first step. Theseanalyses tested whether observers rated the occupants differentlyon the basis of perceived sex and race. We limited our raceanalyses to comparisons between Asians and Whites, the twogroups sufficiently represented in this sample. Any significantdifferences between women and men and between Asians andWhites for those traits would be consistent with the hypothesis thatsex and race stereotypes mediate consensus for judgments of thosetraits. The first two data columns under the Perceived headingunder Sex differences of Table 6 and the first two data columnsunder the Race differences of Table 6 show the observers’ meanratings.
There were only a few perceived sex differences overall. Wefound significant sex differences for perceptions of Agreeableness
and Emotional Stability, the same traits that showed perceived sexdifferences in the study of office spaces. Thus, the directions of thesignificant sex differences were again consistent with commonlyheld stereotypes (Eagly & Mladinic, 1989; Spence, 1993). How-ever, our earlier analyses of consensus suggest that there was noconsensus for these sex stereotypes to mediate—interobserveragreement for Agreeableness and Emotional Stability was notsignificant (see Table 4). Although the consensus correlations forAgreeableness failed to reach conventional levels of statisticalsignificance, the direction and magnitude replicate that found inStudy 1, suggesting there was some consensus for this trait. On thebasis of the findings reported in Table 6, stereotype use couldprovide one partial explanation for the (weak) levels of consensusassociated with Agreeableness; that is, observers adjusted theirratings on the basis of the assumed sex of the occupants.
Observers perceived many more race differences than sex dif-ferences. In keeping with widely held cultural stereotypes (e.g.,Madon et al., 2001; Miller, 1999; Zhang, Lee, Liu, & McCauley,1999), Whites were perceived to be significantly more extravertedand open and significantly less agreeable than were Asians. Inaddition, Whites were perceived to be more emotionally stablethan Asians. Although Conscientiousness failed to reach signifi-cance, the race difference was in the stereotypically consistentdirection, with Asians perceived as more conscientious thanWhites. On the basis of the perceived race findings reported inTable 6, one partial explanation for the interobserver agreementassociated with Extraversion, Openness, and, to a marginal extent,Conscientiousness could be that observers adjusted their ratings onthe basis of the assumed race of the occupants.
Accuracy. Just as in Study 1, we tested for real sex and racedifferences using hierarchical multiple regression. As shown inTable 6, the only significant real sex differences were found inEmotional Stability; women were less emotionally stable thanmen. The only significant real race differences were found inOpenness, with Whites more open than Asians.
Next we compared the perceived mean ratings with the realmean ratings to assess the accuracy of the sex and race stereotypesused. A comparison of the perceived sex differences with the realsex differences reported in Table 6 shows that only the observers’
Table 6Impact of Stereotypes: Perceived and Real Sex Differences and Race Differences Based on Bedrooms
FFM personalitydimensions
Sex differences
Perceived (i.e., observers’ ratings) “Real” (i.e., criterion ratings)
Mean ratinga Effect ofperceived sex Occupant effect
Mean ratingEffect of sex
Women(n � 350)
Men(n � 179) � F(1, 86) p � F(89, 432) p
Women(n � 162)
Men(n � 70) � F(1, 76) p
Extraversion 3.3 � 3.1 .15 2.07 .15 .64 3.47 �.001b 3.4 � 3.3 .04 .15 .70Agreeableness 3.7 � 3.5 .26 5.92 .02 .55 2.13 �.001b 3.8 � 3.8 .03 .04 .84Conscientiousness 3.5 � 3.3 .17 2.67 .11 .74 5.88 �.001b 3.6 � 3.7 .09 .70 .40Emotional Stability 3.2 � 3.4 .39 14.16 �.001b .45 1.26 .07 3.0 � 3.6 .40 14.12 �.001b
Openness to Experience 3.3 � 3.1 .13 1.39 .24 .80 8.79 �.001b 3.8 � 3.6 .07 .38 .54
Note. W � Whites; A � Asians; FFM � Five-Factor Model.a Ratings were made on a 5-point scale. b Probability remains � .05 after Bonferroni correction.
392 GOSLING, KO, MANNARELLI, AND MORRIS

use of sex stereotypes to rate the occupants on Emotional Stabilitywas warranted. For race, only stereotypes used to rate occupantson Openness were warranted. These data are consistent with theidea that observers use sex and race stereotypes, some of whichhelp judgments but most of which hinder them. One should recallthat the occupant effects reflect the variance in observer ratingsthat is not accounted for by differences associated with the per-ceived sex and race of the occupants. As in Study 1, even thesignificant perceived sex and race effects were generally muchsmaller than the occupant effects. This suggests that the use of sexand race stereotypes only partially explains observer consensusand accuracy.
Summary of Study 2 Findings
In Study 2, we set out to determine whether the effects weobtained in workspaces would replicate in a different context(living spaces). Question 1 asked whether observers agreed in theirratings of target occupants based purely on the occupants’ personalliving spaces. We found that observers generally agreed but thatagreement varied across the traits. As in Study 1, we found thatOpenness, Conscientiousness, and Extraversion showed the stron-gest agreement and Emotional Stability and Agreeableness showedthe least agreement. Question 2 asked whether the observer ratingswere accurate. We found that the accuracy correlations weresignificant for all five FFM domains, with Openness, EmotionalStability, and Conscientiousness showing the most accuracy andAgreeableness and Extraversion showing less accuracy. Ques-tion 3 asked which cues in the rooms were used by observers toform impressions and which cues were valid. We identified a widerange of cues relating to observer ratings of Conscientiousness,Agreeableness, and Openness. We also identified a number of cuesrelating to what the occupants were really like, especially forConscientiousness. Of the cues we assessed, observers seemed touse valid cues to judge Conscientiousness and Openness. Ques-tion 4 asked whether observers’ use of sex and race stereotypescould account for interobserver consensus and observer accuracy.Consensus and accuracy were only partially mediated by sex andrace stereotypes. Sex stereotypes may have contributed to consen-sus for Agreeableness, and race stereotypes may have contributed
to consensus for Extraversion, Openness, and, to a lesser extent,Conscientiousness. Our results also suggest that observers’ use ofsex stereotypes was warranted for judgments of Emotional Stabil-ity and that observers’ use of race stereotypes was warranted forjudgments of Openness.
General Discussion
Overview of the Results
Overall, there are striking similarities between the findings ofthe office and bedroom studies. It is important to note that with theexception of a single person who served as an observer in bothstudies, the two studies were entirely independent, with no overlapin observers, occupants, or coders. Our findings suggest that anobserver who has briefly examined an individual’s living or work-ing environment will form impressions that are remarkably con-sistent with other observers’ impressions. Furthermore, these im-pressions are often accurate.
Moreover, the remarkable similarity in the patterns of FFMcorrelations across the two studies suggests that personal environ-ments consistently yield more cues for certain traits than for others.Specifically, the highest accuracy was found for Openness and theleast accuracy was found for Agreeableness in both the studies.However, all the accuracy correlations in the study of bedrooms(Study 2) were consistently stronger than those in the study ofoffices (Study 1). There are five possible explanations for whystudents’ personal living spaces may have provided an unusuallygood view of their occupants. First, college is a time when indi-viduals are negotiating identity issues, so students may be partic-ularly prone to self-expression. Second, people generally have thefreedom to decorate their personal living spaces as they please, butoffice decor is often restricted by company guidelines. Third,individuals in offices, both voluntarily and because of extrinsicpressure and norms, are typically concerned about the positive andprofessional image they project. As a result, they may be pressuredto arrange and decorate their offices in ways that are contrary totheir actual preferences and personalities. Fourth, the observers inboth studies were students themselves and perhaps were relativelywell versed in the cultural meaning of the possessions and icons
Race differences
Perceived (i.e., observers’ ratings) “Real” (i.e., criterion ratings)
Mean ratinga Effect ofperceived race Occupant effect
Mean ratingEffect of race
W(n � 257)
A(n � 185) � F(1, 88) p � F(101, 333) p
W(n � 81)
A(n � 96) � F(1, 57) p
3.4 � 3.1 .26 6.46 .01b .67 2.75 �.001b 3.4 � 3.2 .13 .95 .333.5 � 3.7 .25 5.57 .02 .58 1.66 �.001b 3.8 � 3.7 .12 .85 .363.4 � 3.6 .16 2.54 .11 .76 4.57 �.001b 3.7 � 3.5 .10 .60 .443.3 � 3.2 .27 5.93 .02 .53 1.30 .04 3.2 � 3.1 .04 .12 .733.6 � 2.7 .50 32.30 �.001b .79 5.48 �.001b 3.9 � 3.5 .33 7.03 .01b
393ROOM WITH A CUE

found in student living spaces but less so in the meanings of cuesin office spaces. Fifth, the rooms in our study of bedrooms wereoften multipurpose spaces where the occupants spent a great dealof their time, using them for a variety of activities such as working,sleeping, relaxing, and entertaining. In college dwellings, individ-uals often invite guests into their living spaces, which become thecontext for a broad variety of social interactions ranging fromTV-watching gatherings and Bible-study sessions to raucous par-ties and intimate romantic encounters. Thus, the personal livingspaces in the study of bedrooms may have been ecologically richerenvironments than were the office spaces.
Where we were able to make cross-study comparisons in ste-reotype use, we found interesting similarities. For instance, recallthe sex stereotypes for the FFM dimensions; in both studiesobservers held the stereotypes that men were less agreeable butmore emotionally stable than women. The results suggest thatobservers did rely on stereotypes to form impressions. However,stereotype use probably accounted for only a small portion of theconsensus and accuracy findings in both studies. In the two stud-ies, the occupant effects were all significant, with the exception ofthe Emotional Stability dimension in the bedroom study, whichjust failed to reach significance. The implication of these findingsis that even though the observers in both studies used stereotypesto form impressions, they did not base their judgments solely onstereotypes but may have drawn more heavily on the physical cuesin the rooms. When we link these findings back to the model wepropose in Figure 2, it seems that stereotype use (Steps 1b and 2b)played a relatively minor role in the judgment process.
The column–vector correlations shown in the last column ofTables 1 and 4 suggest that in both offices and bedrooms, observ-ers were consistently better at judging some traits than others. Bybetter, we mean that observers tended to use cues in their judg-ments that were actually related to the traits they were trying tojudge (cf. Cue 1 in Figure 1) and ignored cues that were unrelatedto the traits (cf. Cue 4 in Figure 1). Across studies, judges seemedto make particularly good use of the environmental information tojudge Conscientiousness and Openness. In light of these findings,the question arises as to whether the same cues were diagnostic oftraits across contexts. For example, are some cues diagnostic ofConscientiousness across contexts, or are the cues that are diag-nostic of Conscientiousness in offices different from those that arediagnostic of Conscientiousness in bedrooms?
To answer this question, one must compare the correlations inTables 2 and 5. Therefore, we computed a new set of column–vector correlations comparing the cue-utilization correlations fromStudy 1 with the cue-utilization correlations from Study 2 andcomparing the cue-validity correlations from Study 1 with thecue-validity correlations from Study 2. These column–vector cor-relations were computed across the 36 environmental cues thatwere common to both studies. The resulting correlations are shownin Table 7. These correlations suggest that observers tended to usesimilar patterns of cues across office and bedroom contexts whenjudging occupants’ Extraversion, Agreeableness, Conscientious-ness, and Openness. However, the correlations suggest that theactual relationships between occupants and their environmentswere less consistent across the office and bedroom contexts; cue-validity correlations were similar across studies only for Consci-entiousness. It seems, then, that personality attributes are mani-fested somewhat differently across these contexts.
Comparisons With Previous Research
Recall that we questioned whether personal environments pro-vide less or more information than that provided by zero-acquaintance studies. In past zero-acquaintance studies, observerswere exposed to limited information in the form of brief interac-tions, short videotapes of the targets, or photographs. We predictedthat personal environments would provide more information thantypical zero-acquaintance contexts and would therefore result inrelatively strong consensus and accuracy correlations. To test thisprediction, we next compare our findings with findings fromprevious zero-acquaintance research.
Consensus and Accuracy
Figure 3 summarizes consensus correlations from the studies ofoffices and bedrooms reported here along with findings from ameta-analysis of zero-acquaintance and long-term acquaintance(e.g., year-long friendships) studies (Kenny, 1994; Kenny et al.,1994). All the consensus correlations based on environments arelarger, in many cases substantially so, than the zero-acquaintancecorrelations. For Conscientiousness and Openness, the environ-ment-based consensus was substantially stronger than that foundeven in past studies of long-term interactions. Even for Extraver-sion and Agreeableness, environment-based consensus was stron-ger or comparable to consensus obtained after long-term acquain-tance. Thus, it seems that personal environments contain richersources of information from which to form impressions than arecontained in zero-acquaintance contexts.
Figure 4 summarizes the accuracy correlations from studies ofoffices and bedrooms reported here along with findings from ameta-analyses of zero-acquaintance and long-term acquaintancestudies (Kenny, 1994). For Emotional Stability and Openness,environment-based accuracy was substantially stronger than wasaccuracy found in zero-acquaintance research. However, Extraver-sion was slightly more accurately judged in zero-acquaintance
Table 7Column–Vector Correlations: How Similar Are the Cue-Utilization and Cue-Validity Correlations Across theOffice and Bedroom Studies?
FFM personalitydimension
Cross-study similarity in pattern
Cue-utilizationcorrelationsa
Cue-validitycorrelationsb
Extraversion .37* �.18Agreeableness .44** �.04Conscientiousness .86** .58**Emotional Stability .05 .17Openness to Experience .54** .27
Note. Column–vector correlations were computed across the environ-mental cues that were common to both studies. N � 36 cues. FFM �Five-Factor Model.a Office cue-utilization correlations (from Table 2) are compared with thebedroom cue-utilization correlations (from Table 5). b Office cue-validitycorrelations (from Table 2) are compared with the bedroom cue-validitycorrelations (from Table 5).* p � .05, one-tailed. ** p � .01 one-tailed.
394 GOSLING, KO, MANNARELLI, AND MORRIS

contexts than in the context of personal environments, with neitherof the contexts consistently providing more information than theother for Agreeableness and Conscientiousness. Figure 4 againsupports the idea that physical environments elicit accurate im-pressions of personality, even when compared with studies oflong-term acquaintance. One clear exception is for Extraversion,where accuracy is strongest in long-term acquaintance studies.More generally, different contexts afford different informationabout targets; for example, if you want to learn about someone’sExtraversion you should meet him or her but if you want to learnabout a person’s Openness, an examination of his or her bedroomwould be more useful.
Although both contexts provide important and perhaps distinctinformation, it is not surprising that personal environments containricher sources of behavioral information than do zero-acquaintancecontexts. Information accumulated in personal environments isoften the result of repeated behaviors. For example, to have anorganized office it is not sufficient to organize the office just once;instead, the occupant must continually engage in organizing be-haviors—returning the phone directory to the bookshelf after use,throwing away used paper cups, and placing documents in neatstacks. Multiple acts are more likely to have an impact on theenvironment than are single acts. Because environmental cues tendto reflect repeated acts, they may offer more reliable evidence thanthe few acts that observers witness in many zero-acquaintancecontexts.
Cue Use
How do the vector correlations shown in Tables 1 and 4 com-pare with previous findings? Funder and Sneed (1993; Sneed,McCrae, & Funder, 1998) examined a similar issue, but instead ofbehavioral residue they focused on behavior itself, relating 62actual behaviors to the FFM dimensions. Their index of cueutilization was the correlation between observers’ ratings of targetindividuals portrayed in a 5-min videotaped interaction and behav-iors coded from the videotapes. Their index of cue validity was thecorrelation between ratings of the targets made by well-acquaintedinformants and the coded behaviors. Thus, the structure of ourstudy is remarkably similar to theirs.
A comparison of Funder and Sneed’s (1993) findings with oursreveals a number of interesting differences between the value ofinformation in behavioral and environmental contexts. Recall thatwe found that observers made best use of environmental cues forOpenness and Conscientiousness. Funder and Sneed (1993) didfind that observers made good use of behavioral cues for Consci-entiousness. However, observers did not make good use of behav-ioral cues for Openness. Instead, in stark contrast to our findingsfor environmental cues, observers made relatively good use ofbehavioral cues in their judgments of Extraversion, Agreeableness,and, to a lesser extent, Emotional Stability. Thus, although observ-ers might have a hard time identifying the behavioral manifesta-tions of Openness (Sneed et al., 1998), they appear to be rathersuccessful at identifying the environmental manifestations of this
Figure 3. Observer consensus as a function of informational base: office environments (Study 1), livingenvironments (Study 2), zero-acquaintance contexts, and long-term acquaintance contexts. Zero-acquaintanceand long-term acquaintance data are from Kenny (1994). To provide a linear representation of the correlationson the y-axis, we report the correlation coefficients in terms of Fisher’s z metric. To make the comparisons withKenny’s data parallel, the office and living environment correlations have been corrected for unreliability.
395ROOM WITH A CUE

dimension. Together, these studies support our expectation that themanifestation and judgment of personality traits would vary acrossdomains.
Potential Limitations
We next turn to a number of potential limitations of the researchreported here. The first two limitations relate to alterations occu-pants may have made to their personal environments. The first ofthese concerns is that occupants may have tidied or altered theirrooms before the assessment team arrived. The occupants knewthat an assessment team would be going through their room tolearn about their personality, and they knew when the team wouldbe there. However, there are several reasons to think that the roomswere not tidied or altered. First, we believe that occupants com-plied with our specific request not to tidy or alter their roomsbecause the rooms were assessed under conditions of completeanonymity and confidentiality. Second, the main incentive for theoccupants to take part in this research was to receive feedback onthe impressions formed on the basis of their personal environ-ments. We reminded participants that meaningful feedback de-pended on observers seeing the environments in their unalteredstate. Third, the occupants’ peers indicated in their confidentialratings how much they thought the rooms had been altered for theassessment; in Study 1 the mean rating was 1.5 on a scale ranging
from 1 (very little) to 7 (very much), and in Study 2 the mean ratingwas 1.4 on a scale ranging from 1 (very little) to 5 (very much),both indicating the rooms had not been substantially altered.
The second potential limitation regards more permanent manip-ulation of the environment, not just alterations for our assessments.Occupants may craft their environments to project specific impres-sions that they deem desirable. For example, they may displaysocially desirable symbols (e.g., an award for public service), theymay fabricate behavioral residue (e.g., a made-up bed), or theymay deceivingly display anticipated behavior cues they have nointention of using. The present design did not permit us to examinethe extent to which self-presentational concerns drove the occu-pants to actively manipulate their personal environments to portraythemselves in a positive light, and this is an area that would benefitfrom experimental and field research.
A third potential limitation of the present design is that ouranalyses of cues were limited to the set of cues we measured.Although we strove to assess a broad range of cues, we cannot becertain that our inventory was comprehensive. We may haveoversampled cues that were relevant to some dimensions (e.g.,Conscientiousness) and undersampled cues that were relevant toothers (e.g., Emotional Stability). In addition, the analyses reportedhere focus on broad cues and do not include specific cues (e.g., aposter of Martin Luther King) that may have conveyed a lot of
Figure 4. Observer accuracy as a function of informational base: office environments (Study 1), livingenvironments (Study 2), zero-acquaintance contexts, and long-term acquaintance contexts. Zero-acquaintanceand long-term acquaintance data are from Kenny (1994), who used the term self–other agreement to refer tothese correlations. To provide a linear representation of the correlations on the y-axis, we report the correlationcoefficients in terms of Fisher’s z metric. To make the comparisons with Kenny’s data parallel, the office andliving environment correlations have been corrected for unreliability.
396 GOSLING, KO, MANNARELLI, AND MORRIS

information to observers. Moreover, we did not have the statisticalpower to search for configurations of cues (e.g., the combination oforganized and dark). It seems quite likely that many judgments aremade on the basis of such configural patterns. The findings re-ported here are limited to the extent that the codings neglectedsuch information. However, there is some evidence to suggest thatour codings did not miss too much information. If the codings hadneglected information that judges used to make judgments, thenthe pattern of accuracy correlations would not mirror the pattern ofvector correlations. But inspection of Tables 1 and 4 shows that theaccuracy correlations generally do mirror the vector correlations,suggesting that we did capture most of the relevant cues.
Future Directions
The present research sought to document the basic links be-tween occupants and their personal environments and betweenpersonal environments and observers’ perceptions of the occu-pants. We conceptualized these links in terms of processes speci-fied by Brunswik’s (1956) lens model: accuracy, cue utilization,and cue validity. We found evidence for each of these processes,demonstrating clear links between individuals and the physicalspaces in which they live or work. Thus, the studies presented herelay a strong foundation of basic findings on which future researchcan build. Research can now directly examine the specific mech-anisms and processes hypothesized to account for these basicphenomena. Models such as the one depicted in Figure 2 should beused to guide researchers as they embark on this vital second phasein understanding the complex relations between individuals andthe places they inhabit.
Conclusion
This research takes a first look at what one can and cannot learnabout people by examining the environments in which they liveand work. Although this line of empirical research is relativelynew, the practice of assessing individuals by examining theirenvironments is not. In fact, one formal application was put inplace by the U.S. government shortly after entering the SecondWorld War. In May 1942, the Office of Strategic Services begana program of assessments designed to identify candidates suitablefor work behind enemy lines. One of the selection tests was theBelongings Test, in which candidates were required to describeindividuals solely on the basis of what they had left in theirbedrooms—items included clothing, a time table, and a ticketreceipt (MacKinnon, 1977). Our research provides strong supportfor the assumption underlying this test—much can be learnedabout persons from the spaces in which they dwell.
References
Ambady, N., & Rosenthal, R. (1992). Thin slices of expressive behavior aspredictors of interpersonal consequences: A meta-analysis. Psychologi-cal Bulletin, 111, 256–274.
Baumeister, R. F. (1982). A self-presentational view of social phenomena.Psychological Bulletin, 91, 3–26.
Berry, D. S., & Finch-Wero, J. L. (1993). Accuracy in face perception: Aview from ecological psychology. Journal of Personality, 61, 497–520.
Blackman, M. C., & Funder, D. C. (1998). The effect of information on
consensus and accuracy in personality judgment. Journal of Experimen-tal Social Psychology, 34, 164–181.
Block, J. (1961). The Q-sort method in personality assessment and psy-chiatric research. Springfield, IL: Charles C Thomas.
Borkenau, P., & Liebler, A. (1992). Trait inferences: Sources of validity atzero acquaintance. Journal of Personality and Social Psychology, 62,645–657.
Brunswik, E. (1956). Perception and the representative design of psycho-logical experiments. Berkeley: University of California Press.
Burroughs, J. W., Drews, D. R., & Hallman, W. K. (1991). Predictingpersonality from personal possessions: A self-presentational analysis.Journal of Social Behavior and Personality, 6, 147–163.
Buss, D. M. (1987). Selection, evocation, and manipulation. Journal ofPersonality and Social Psychology, 53, 1214–1221.
Buss, D. M., & Craik, K. H. (1983). The act frequency approach topersonality. Psychological Review, 90, 105–126.
Chaplin, W. F., Phillips, J. B., Brown, J. D., Clanton, N. R., & Stein, J. L.(2000). Handshaking, gender, personality, and first impressions. Journalof Personality and Social Psychology, 79, 110–117.
Eagly, A. H., & Mladinic, A. (1989). Gender stereotypes and attitudestoward women and men. Personality and Social Psychology Bulletin, 15,543–558.
Funder, D. C. (1980). On seeing ourselves as others see us: Self–otheragreement and discrepancy in personality ratings. Journal of Personal-ity, 48, 473–493.
Funder, D. C. (1995). On the accuracy of personality judgment: A realisticapproach. Psychological Review, 102, 652–670.
Funder, D. C. (1999). Personality judgment: A realistic approach to personperception. San Diego, CA: Academic Press.
Funder, D. C., & Dobroth, K. M. (1987). Differences between traits:Properties associated with interjudge agreement. Journal of Personalityand Social Psychology, 52, 409–418.
Funder, D. C., & Sneed, C. D. (1993). Behavioral manifestations ofpersonality: An ecological approach to judgmental accuracy. Journal ofPersonality and Social Psychology, 64, 479–490.
Gifford, R. (1994). A lens-mapping framework for understanding theencoding and decoding of interpersonal dispositions in nonverbal be-havior. Journal of Personality and Social Psychology, 66, 398–412.
Gilovich, T., & Savitsky, K. (1996, March/April). Like goes with like: Therole of representativeness in erroneous and pseudoscientific beliefs.Skeptical Inquirer, 20, 34–40.
Goffman, E. (1959). The presentation of self in everyday life. Garden City,NY: Doubleday Anchor.
Gosling, R. D., & Standen, R. (1998). Doctor’s dress. British Journal ofPsychiatry, 172, 188–189.
Gosling, S. D., Martin, N. R., Craik, K. H., & Pryor, M. R. (2001).Personal living spaces: Development and analysis of a cue inventory.Manuscript submitted for publication.
Hayes, A. F., & Dunning, D. (1997). Construal processes and trait ambi-guity: Implications for self–peer agreement in personality judgment.Journal of Personality and Social Psychology, 72, 664–677.
John, O. P., & Benet-Martinez, V. (2000). Measurement, scale construc-tion, and reliability. In H. T. Reis & C. M. Judd (Eds.), Handbook ofresearch methods in social psychology (pp. 339–369). Cambridge,England: Cambridge University Press.
John, O. P., & Robins, R. W. (1993). Determinants of interjudge agreementon personality traits: The Big Five domains, observability, evaluative-ness, and the unique perspective of the self. Journal of Personality, 61,521–551.
John, O. P., & Srivastava, S. (1999). The Big Five trait taxonomy: History,measurement, and theoretical perspectives. In L. A. Pervin & O. P. John(Eds.), Handbook of personality theory and research (pp. 102–138).New York: Guilford Press.
397ROOM WITH A CUE

Kenny, D. A. (1994). Interpersonal perception: A social relations analysis.New York: Guilford Press.
Kenny, D. A., Albright, L., Malloy, T. E., & Kashy, D. A. (1994).Consensus in interpersonal perception: Acquaintance and the Big Five.Psychological Bulletin, 116, 245–258.
Kenny, D. A., Horner, C., Kashy, D. A., & Chu, L. (1992). Consensus atzero acquaintance: Replication, behavioral cues, and stability. Journal ofPersonality and Social Psychology, 62, 88–97.
Lee, Y., Jussim, L. J., & McCauley, C. R. (1995). Stereotype accuracy:Toward appreciating group differences. Washington, DC: AmericanPsychological Association.
Locksley, A., Borgida, E., Brekke, N., & Hepburn, C. (1980). Sex stereo-types and social judgment. Journal of Personality and Social Psychol-ogy, 39, 821–831.
MacKinnon, D. W. (1977). From selecting spies to selecting managers:The OSS Assessment program. In J. L. Moses & W. C. Byham (Eds.),Applying the assessment center method (pp. 13–30). New York:Pergamon.
Madon, S., Guyll, M., Aboufadel, K., Montiel, E., Smith, A., Palumbo, P.,& Jussim, L. (2001). Ethnic and national stereotypes: The Princetontrilogy revisited and revised. Personality and Social Psychology Bulle-tin, 27, 996–1010.
McCrae, R. R., & Costa, P. T. Jr. (1999). A five-factor theory of person-ality. In L. A. Pervin & O. P. John (Eds.), Handbook of personalitytheory and research (pp. 139–153). New York: Guilford Press.
McCrae, R. R., Stone, S. V., Fagan, P. J., & Costa, P. T., Jr. (1998).Identifying causes of disagreement between self-reports and spouseratings of personality. Journal of Personality, 66, 285–313.
Miller, L. (1999). Stereotype legacy: Culture and person on Japanese/American interactions. In Y. Lee, C. R. McCauley, & J. G. Draguns(Eds.), Personality and person perception across cultures. Mahwah, NJ:Erlbaum.
Park, B., & Judd, C. M. (1989). Agreement on initial impressions: Differ-ences due to perceivers, trait dimensions, and target behaviors. Journalof Personality and Social Psychology, 56, 493–505.
Paulhus, D. L., & Bruce, M. N. (1992). The effect of acquaintanceship on
the validity of personality impressions: A longitudinal study. Journal ofPersonality and Social Psychology, 63, 816–824.
Robins, R. W., Gosling, S. D., & Donahue, E. M. (1997). Are personalityjudgments based on physical appearance consensual and accurate? In J.Bermudez, B. de Raad, J. de Vries, A. M. Perez-Garcıa, A. Sanchez-Elvira, & G. L. van Heck (Eds.), Personality psychology in Europe(Vol. 6, pp. 70–75). Tilburg, the Netherlands: Tilburg University Press.
Sneed, C. D., McCrae, R. R, & Funder, D. C. (1998). Lay conceptions ofthe five-factor model and its indicators. Personality and Social Psychol-ogy Bulletin, 24, 115–126.
Snyder, M., & Ickes, W. (1985). Personality and social behavior. In G.Lindzey & E. Aronson (Eds.), Handbook of social psychology (Vol. 2,pp. 883–947). New York: Random House.
Spence, J. T. (1993). Gender-related traits and gender ideology: Evidencefor a multifactorial theory. Journal of Personality and Social Psychol-ogy, 64, 624–635.
Swann, W. B., Jr. (1987). Identity negotiation: Where two roads meet.Journal of Personality and Social Psychology, 53, 1038–1051.
Swann, W. B., Jr., Rentfrow, P. J., & Guinn, J. S. (in press). Self-verification: The search for coherence. In M. Leary & J. Tangney (Eds.),Handbook of self and identity. New York: Guilford Press.
Watson, D. (1989). Strangers’ ratings of the five robust personality factors:Evidence of a surprising convergence with self-report. Journal of Per-sonality and Social Psychology, 57, 120–128.
Webb, E. J., Campbell, D. T., Schwartz, R. D., & Sechrest, L. (1966).Unobtrusive measures: Nonreactive research in the social sciences.Chicago: Rand McNally.
Wiggins, J. S. (1973). Personality and prediction: Principles of personalityassessment. Reading, MA: Addison-Wesley.
Zhang, K., Lee, Y., Liu, Y., & McCauley, C. R. (1999). Chinese–Americandifferences: A Chinese view. In Y. Lee, C. R. McCauley, & J. G.Draguns (Eds.), Personality and person perception across cultures.Mahwah, NJ: Erlbaum.
Received May 15, 2001Revision received September 6, 2001
Accepted September 10, 2001 �
398 GOSLING, KO, MANNARELLI, AND MORRIS