a role for antizyme inhibitor in cell proliferation. silva...
TRANSCRIPT

LUND UNIVERSITY
PO Box 117221 00 Lund+46 46-222 00 00
A role for antizyme inhibitor in cell proliferation.
Silva, Tania; Cirenajwis, Helena; Wallace, Heather M; Oredsson, Stina; Persson, Lo
Published in:Amino Acids
DOI:10.1007/s00726-015-1957-6
Published: 2015-01-01
Link to publication
Citation for published version (APA):Silva, T., Cirenajwis, H., Wallace, H. M., Oredsson, S., & Persson, L. (2015). A role for antizyme inhibitor in cellproliferation. Amino Acids, 47(7), 1341-1352. DOI: 10.1007/s00726-015-1957-6
General rightsCopyright and moral rights for the publications made accessible in the public portal are retained by the authorsand/or other copyright owners and it is a condition of accessing publications that users recognise and abide by thelegal requirements associated with these rights.
• Users may download and print one copy of any publication from the public portal for the purpose of privatestudy or research. • You may not further distribute the material or use it for any profit-making activity or commercial gain • You may freely distribute the URL identifying the publication in the public portalTake down policyIf you believe that this document breaches copyright please contact us providing details, and we will removeaccess to the work immediately and investigate your claim.
1
A role for antizyme inhibitor in cell proliferation
Tania M Silva 1*, Helena Cirenajwis 1+, Heather M Wallace 1,2, Stina Oredsson 1, Lo Persson3
1 Department of Biology, Lund University, Lund, Sweden
2 Division of Applied Medicine, University of Aberdeen, Polwarth Building, Foresterhill, Aberdeen, UK
3Department of Experimental Medical Science, Lund University, Lund, Sweden
* Current address: Laboratory of Microbiology and Immunology of Infection, Institute for Molecular and
Cell Biology, Porto University, Porto, Portugal
+ Current address: Division of Oncology and Pathology, Department of Clinical Sciences, Lund
University, Lund, Sweden
Tania M Silva and Helena Cirenajwis have equally contributed to this work.
Email: [email protected]
Telephone: 46-46-2227746

2
Abstract
The polyamines are important for a variety of cellular functions, including cell growth. Their intracellular
concentrations are controlled by a complex network of regulatory mechanisms, in which antizyme (Az)
has a key role. Az reduces the cellular polyamine content by down-regulating both the enzyme catalysing
polyamine biosynthesis, ornithine decarboxylase (ODC), and the uptake of polyamines. The activity of
Az is repressed by the binding of a protein, named Az inhibitor (AzI), which is an enzymatically inactive
homologue of ODC. Two forms of AzI have been described: AzI1, which is ubiquitous and AzI2, which
is expressed in brain and testis. In the present study, we have investigated the role of AzI1 in polyamine
homeostasis and cell proliferation in breast cancer cells. The results obtained showed that the cellular
content of AzI increased transiently after induction of cell proliferation by diluting cells in fresh medium.
Inhibition of polyamine biosynthesis induced an even larger increase in the cellular AzI content, which
remained significantly elevated during the 7-day experimental period. However, this increase was not a
consequence of changes in cell cycle progression, as demonstrated by flow cytometry. Instead, the
increase appeared to correlate with the cellular depletion of polyamines. Moreover, induced
overexpression of AzI resulted in an increased cell proliferation with a concomitant increase in ODC
activity and putrescine content. During mitosis AzI1 was localised in a pattern that resembled that of the
two centrosomes, confirming earlier observations. Taken together, the results indicate that AzI fulfils an
essential regulatory function in polyamine homeostasis and cell proliferation.
3
Keywords: Antizyme inhibitor 1 – Polyamines – Ornithine decarboxylase - Cell proliferation – Breast
cancer
Abbreviations
AG Aminoguanidine
Az Antizyme
AzI Antizyme inhibitor
BrdUrd Bromodeoxyuridine
DFMO Difluoromethylornithine
ECL Enhanced chemiluminescence
FITC Fluorescein isothiocyanate
LI Labelling index
ODC Ornithine decarboxylase
PBS Phosphate-buffered saline
PI Propidium iodide
RMzero Relative movement zero
uCC Upstream conserved coding region
4
Introduction
Polyamines are recognised as necessary growth factors in all cells, including cancer cells (Wallace et al.
2003; Gerner and Meyskens 2004; Nowotarski et al. 2013). Perturbation of intracellular polyamine
content in mammalian cells has dramatic effects on cell proliferation and cell death/apoptosis. Thus, a
complex of elaborate mechanisms, affecting synthesis, degradation as well as membrane transport, has
evolved for the control of polyamine homeostasis (Persson 2009; Pegg and Casero 2011). Ornithine
decarboxylase (ODC) is a key regulatory protein catalysing the first and rate-limiting step in polyamine
biosynthesis. This enzyme is strictly regulated by antizyme (Az), which binds to ODC with a high affinity
at the monomeric level, inhibiting the formation of the active ODC homodimer and targeting it for
ubiquitin-independent degradation by the 26S proteasome (Kahana 2009; Murai et al. 2011).
In addition, Az inhibits the cellular uptake of extracellular polyamines (Mitchell et al. 1994; Suzuki et al.
1994). The cellular content of Az is partly regulated by polyamines, which stimulate its synthesis by a
unique mechanism involving ribosomal frame-shifting (Rom and Kahana 1994; Matsufuji et al. 1985). At
least 3 different mammalian isoforms of Az (Az1 – Az3) have been identified, of which Az1 and Az2 are
ubiquitously expressed, whereas Az3 is testis-specific (Kahana 2009). All three Az isoforms are capable
of inhibiting ODC activity and polyamine uptake, but only Az1 and Az2 can target ODC for degradation
(Kahana 2009).
In addition to Az, cells contain another protein with a putative role in polyamine homeostasis. This
protein was first discovered in rat liver by the potential to reactivate Az-inhibited ODC and was thus
given the name of Az inhibitor (AzI) (Fujita et al. 1982). AzI, which is an enzymatically inactive
homologue of ODC, binds to Az with higher affinity than does ODC and consequently releases ODC
from its inactive ODC-Az complex (Fujita et al. 1982). By binding to Az, AzI also prevents the effects of
Az on ODC degradation and cellular uptake of polyamines (Kahana 2009; Murai et al. 2011). Keren-Paz
et al. (2006) demonstrated that NIH3T3 cells overexpressing AzI had increased ODC activity and
polyamine uptake, and exhibited improved cell proliferation. Moreover, these cells gave rise to tumours
when injected into nude mice (Keren-Paz et al. 2006), whereas knockdown of AzI using siRNA or
shRNA decreased cell proliferation both in vitro and in vivo (Choi et al. 2005; Keren-Paz et al. 2006;
Olsen et al. 2012). Mutant mice with both AzI alleles disrupted died close to birth and displayed abnormal
liver morphology and perturbed polyamine homeostasis (Tang et al. 2009). Interestingly, AzI has also
been shown to be up-regulated in a number of human cancers (Jung et al. 2000; Schaner et al. 2003; van
Duin et al. 2005; Chin et al. 2007; Olsen and Zetter 2011).
In spite of its putative role in polyamine homeostasis and its cell proliferation-promoting effects,
information on the regulation and cellular function of AzI is relatively sparse. Nevertheless, a close
correlation between cell proliferation, ODC and AzI has been demonstrated (Murakami et al. 1989;
Nilsson et al. 2000; Murakami et al. 2009). Results indicate that AzI may have other functions besides
being involved in polyamine homeostasis. Zetter and colleagues reported that AzI reduced the turnover of
cyclin D, as well as induced centrosome overduplication (Kim et al. 2006; Mangold et al. 2008). A co-
localisation of Az1 and AzI to the centrosome during mitosis was confirmed by Murakami et al. (2009).
5
In addition to the ubiquitously present AzI, a closely related protein, termed AzI2, is expressed in brain
and testis (Pitkanen et al. 2001; Lopez-Contreras et al. 2006). Thus, the first AzI discovered is sometimes
referred to as AzI1. Similar to AzI1, AzI2 neutralises the effects of Az on ODC and on the cellular uptake
of polyamines (Lopez-Contreras et al. 2008; Snapir et al. 2008). In addition, Kanerva et al. (2010)
presented results indicating that AzI2 is involved in the regulation of vesicular transport within the cell.
In the present study, we investigated the role of AzI1 (referred to as AzI) in polyamine homeostasis and
cell proliferation in breast cancer cells. The results showed that AzI expression varied in relation to cell
proliferation and polyamine content. Moreover, induced over-expression of AzI resulted in an increased
cell proliferation with a concomitant increase in ODC activity and putrescine content. AzI was shown to
be localised in a centrosomal pattern during mitosis, confirming earlier observations of a co-localisation
of AzI with centrosomes (Mangold et al. 2008; Murakami et al. 2009).
Materials and Methods
Cell culture medium components were purchased from Biochrom, Berlin, Germany. Tissue culture
plastics were acquired from Nunc, Roskilde, Denmark. Phosphate-buffered saline (PBS: 8g/L NaCl, 0.2
g/L KCl, 1.15 g/L Na2HPO4, 0.2 g/L KH2PO4, pH 7.3) was purchased from Oxoid Ltd., Basingstoke,
Hampshire, UK. Nonidet P-40 was purchased from VWR, Lund, Sweden. Insulin and propidium iodide
(PI) were obtained from Sigma, Stockholm, Sweden. Dimethyl sulphoxide (DMSO) was acquired from
Merck KGaA, Darmstadt, Germany. L-[1-14C] Ornithine (1.9 GBq/mmol) was purchased from New
England Nuclear Du Pont, Scandinavia AB, Stockholm, Sweden. Bromodeoxyuridine (BrdUrd) and the
primary monoclonal antibody against BrdUrd (Clone: Bu20a), as well as the secondary fluorescein
isothiocyanate (FITC) antibody and the horseradish peroxidase-conjugated goat anti-mouse IgG
secondary antibody, were all purchased from DAKO, Glostrup, Denmark. Hybond enhanced
chemiluminescence (ECL) nitrocellulose membrane and ECL™ Advance Blotting Detection Kit
(Amersham Biosciences) were purchased from GE Healthcare, Uppsala, Sweden. Geneticin and all
components of the NuPAGE Novex Pre-Cast Gel System used for Western blot were obtained from
Invitrogen Corporation, Carlsbad, CA, USA. The antibody against β-actin was purchased from Abcam,
Cambridge, UK. The monoclonal antibody against rat AzI1 was kindly provided by Dr. Senya Matsufuji
and Dr. Yasuku Murakami, Tokyo, Japan. Gene Pulser Cyvettes (0.4 cm and 0.1 cm) were purchased
from Bio-Rad, Hercules, CA, USA. The mammalian expression vector pCl-neo was purchased from
Promega Corporation, Madison, WI, USA. The Nucleo Spin Extract Kit was obtained from Clonetech
Laboratories, Inc., Mountainview, CA, USA. The agarose gel was obtained from Bio-Rad Laboratories,
Hercules, CA, USA. The Genelute HP plasmid midi-prep kit was purchased from Sigma-Aldrich Sweden
AB, Stockholm, Sweden. Restriction enzymes and T4 DNA ligase were purchased from Fermentas
GMBH, Helsingborg, Sweden. The oligos for PCR were obtained from TAG, Copenhagen, Denmark.
Difluoromethylornithine (DFMO) was purchased from Ilex-Oncology, San Antonio, Texas, USA.
SAM486A was a kind gift from Novartis, Basel, Switzerland.
6
Drug stock solutions
Stock solutions of SAM486A (2 mM), aminoguanidine (AG, 50 mM), putrescine (50 mM) and
spermidine (50 mM) were made in PBS. DFMO was dissolved in Millipore water to obtain a
concentration of 0.5 M after adjusting pH to 7.2. All solutions were sterile-filtered and used in the
experiments at final concentrations of: SAM486A (20 M), AG (1 mM), putrescine (100 M),
spermidine (50 M) and DFMO (1 mM).
Cell culture
The human breast carcinoma cell line JIMT-1 (ACC589) was purchased from the German Collection of
Microorganisms and Cell Cultures, DSMZ (Braunschweig, Germany) and was cultured in DMEM/Ham’s
F12 medium supplemented with 10% foetal bovine serum, non-essential amino acids (1 mM), insulin (10
µg/ml), penicillin (100 U/ml) and streptomycin (100 µg/ml). The human breast carcinoma cell line MCF-
7 (HTB22) was obtained from the American Type Culture Collection (Manassas, VA, USA) and was
cultured in RPMI 1640 medium supplemented with 10% foetal bovine serum, non-essential amino acids
(1 mM), insulin (10 µg/ml), penicillin (100 U/ml) and streptomycin (100 µg/ml). Both cell lines were
cultured as monolayers at 37°C in a humidified incubator with 5% CO2 in air. The JIMT-1 cell line,
having a doubling time of approximately 24 hours, was sub-cultured twice a week, while the MCF-7 cell
line, with a doubling time of approximately 34 hours, was sub-cultured once a week. In all experiments,
plateau phase cells were reseeded to a lower cell density (30 000 cells/cm2). The cells were seeded in the
absence or presence of DFMO, SAM486A, DFMO/putrescine or DFMO/spermidine. In some
experiments AG was added to inhibit any activity of polyamine oxidase present in the bovine serum. The
cells were harvested by trypsinisation and the cell number was determined by counting in a
hemocytometer at the times indicated in the figures. The cells were pelleted and stored at -80°C until
further analysis.
ODC activity assay
The cells were sonicated in ice-cold 0.1 M Tris-HCl (pH 7.5) containing 0.1 mM EDTA and 2.5 mM
dithiothreitol. The ODC activity was determined by measuring the release of [14C] CO2 from carboxyl-
labelled L-ornithine, in the presence of saturating levels of pyridoxal 5-phosphate (0.1 mM) and L-
ornithine (0.2 mM) (Jänne and Williams-Ashman 1971).
Polyamine analysis
Chromatographic separation and quantitative determination of the polyamines in cell extracts in 0.2 M
perchloric acid were carried out using a HPLC (Hewlett Packard 1100) with θ-phthaldialdehyde as the
reagent essentially as previously described (Seiler and Knödgen 1980).
7
Cell cycle progression analysis
Cells were seeded in the absence or presence of DFMO and harvested by trypsinisation every second hour
for up to 24 hours after seeding. Thirty minutes before harvesting, BrdUrd (5 µM) was added to the
medium of the cells. The cells were collected and fixed in ice-cold 70% ethanol and stored at -20°C until
further analysis. At the time of analysis, BrdUrd incorporated into DNA was labelled with primary
BrdUrd antibodies followed by secondary FITC-conjugated antibodies, and DNA was stained with PI, as
recently described (Silva et al. 2013). The labelled cells were analysed by flow cytometry using an Ortho
Cytoron Absolute flow cytometer (Ortho Diagnostic Systems, Raritan, NJ, USA). The MultiCycle®
software program (Phoenix Flow Systems, CA, USA) was used for evaluation of the data with respect to
DNA and BrdUrd contents. Cell cycle progression during the 24 hours after seeding was monitored by
following changes in relative movement zero (RMzero) and labelling index (LI) (Fredlund et al. 1996).
Western blot analysis of AzI
The cells were diluted in sample buffer (62.5 mM Tris-HCl, pH 6.8, 20% glycerol, 2% SDS, 5% β-
mercaptoethanol and 0.5% bromophenol blue) and sonicated, followed by immediate boiling for 6
minutes. The samples were stored at -20°C until analysis. Aliquots containing 50 000 or 100 000 cells
were loaded and separated on 4–12% acrylamide Bis-Tris gels (Invitrogen) using the NuPAGES Xcell
Sure Lock™ Mini-Cell system (Invitrogen). The separated proteins were transferred to nitrocellulose
membranes using the iBlot™ Dry Blotting System (Invitrogen). Thereafter, the membranes were blocked
in 5% non-fat dry milk in PBS-T (PBS containing 0.05% Tween 20) and incubated overnight with the
primary antibody against rat AzI (1:50 000) at 4ºC. Following washing in PBS-T, the membranes were
incubated with the secondary horseradish peroxidase-conjugated goat anti-mouse IgG antibody (1:20 000)
in PBS-T for 1 hour at room temperature. The bands were detected with the ECL™ Advance Blotting
Detection Kit. The ChemiDoc XRS system and the Quantity One software (both from Bio-Rad
Laboratories Inc., Hercules, CA, USA) were used for imaging and data analysis. Actin was used as a
loading control.
Stable transfection of AzI
The coding region of human AzI1 was subcloned from pcDNA3.1-AzI (kindly provided by Leif
Andersson, Helsinki) into the mammalian expression vector pCI-neo. Exponentially growing JIMT-1 and
MCF-7 cells were transfected with the pCI-neo/AzI construct or the pCI-neo empty vector using a Gene
Pulser® II (Bio-Rad, CA, USA). Stable transfectants were selected by addition of geneticin (0.5 mg/ml)
to the cell culture medium.
Immunofluorescence microscopy
Cells were cultured on sterile poly-L-lysine-coated glass slides for 48 hours. After fixation in 3.7%
paraformaldehyde (in PBS) for 15 minutes at room temperature and subsequent washing in PBS, the
slides were blocked in 5% non-fat dry milk in PBS-T for 1 hour at room temperature. The cells were
8
incubated with the primary AzI antibody diluted 1:10 000 in PBS-T overnight at 4°C. After washing, the
cells were incubated for 1 hour with the Alexa Fluor 488 Goat Anti-mouse antibody (Invitrogen) (diluted
1:500 in PBS-T), at room temperature. Slides were counterstained with bisbenzimide and finally washed
in PBS before mounting. Fluorescence-labelled cells were photographed using an Olympus/Nikon
epifluorescence microscope (Olympus Optical Co. Ltd., Japan) equipped with a digital camera (Nikon
Imaging Japan Inc., Japan). The final images shown were obtained by overlaying AzI and bisbenzimide
stained pictures using Adobe Photoshop 8.0.1 (Adobe Systems Incorporated, San Jose, California, USA).
Statistical analysis
Values are expressed as mean ± S.E.M. Students’ t-test was used for statistical evaluation and p < 0.05
was considered as significant.
Results
Effects of DFMO on polyamine homeostasis
Initially, we analysed the effects of DFMO on JIMT-1 breast cancer cells. Treatment with DFMO
significantly reduced the proliferation of JIMT-1 cells seeded in fresh medium (Fig. 1a). The late effect of
DFMO on cell proliferation was preceded by changes in the polyamine metabolism, seen already after 24
hours of treatment (Fig. 1). ODC activity (which was transiently increased after reseeding) and
intracellular polyamine content were decreased markedly by treatment with DFMO (Fig. 1b, e). In
contrast to putrescine, which was depleted entirely after 24 hours of DFMO treatment, the spermidine
concentration continued to decrease to about 10% of the control value at 48 hours of treatment, whereas
spermine was not affected significantly by DFMO treatment (Fig. 1e). Interestingly, the cellular content
of AzI increased transiently after reseeding the cells in fresh medium (Fig. 1c, d). In parallel with the
early changes in polyamine metabolism, the AzI level had increased dramatically after 24 hours of
DFMO treatment and remained elevated during the entire treatment cycle of 168 hours, although a 50%
reduction was observed from day 5 (Fig. 1c, d).
Effects of DFMO on cell cycle progression
The AzI content has been shown to vary during the cell cycle, with peaks in the G1 and G2/M phases
(Murakami et al. 2009). Since the AzI content was increased significantly in JIMT-1 cells as early as 24
hours of DFMO treatment, we decided to investigate whether this increase was a consequence of DFMO
affecting the cell cycle progression. The cells used for seeding were partly synchronised and
approximately 80% (results not shown) were in G0/G1 phase (plateau phase cells). Small treatment-
induced effects on the partially synchronised cell cycle progression may result in large changes in levels
of proteins that vary during the cell cycle, like AzI. Thus, we determined whether DFMO provoked any
9
changes in the cell cycle progression during the first 24 hours of treatment. Cell cycle progression was
followed by analyses of RMzero and LI after labelling DNA with BrdUrd (Fig. 2a, b).
RMzero is a measure of the distribution of BrdUrd-labelled cells in S phase (Begg et al. 1985; Fredlund
and Oredsson 1996). When BrdUrd-labelled cells are distributed uniformly in S phase, RMzero is 0.5.
RMzero is below 0.5 when the BrdUrd-labelled cells are in early S phase and above 0.5 when the cells are
in late S phase. LI is a measure of the number of cells that have incorporated BrdUrd in proportion to the
total number of cells examined. Figure 2a shows changes in RMzero after seeding. RMzerowas above 0.5 at
the first sampling time (i.e. 2 hours after seeding) and then it increased to a maximum at 8 hours after
seeding. During this time the LI was 10% (Fig. 2b). Taken together, these data imply that the 10% of cells
in S phase were located mainly at the end of S phase at the time of seeding. The rapid drop in RMzero
between 8 and 16 hours after seeding is caused by the massive inflow of cells from G1 phase into S phase,
due to the partially synchronous proliferation of the cells (Fig. 2a). This is reflected in a large increase in
LI during the same time period (Fig. 2b). DFMO treatment had no effect on this early cell cycle
progression (Fig. 2a, b). Thus, the increased AzI level found after 24 hours of treatment (Fig. 1c, d) was
not caused by a DFMO-induced effect on early cell cycle progression. Instead, it is conceivable that the
induction of AzI after treatment with DFMO was related to the decrease in cellular putrescine and/or
spermidine content.
Feedback control of AzI
An extensive analysis of AzI expression during the first 24 hours of DFMO treatment showed that the AzI
level was significantly increased after 22 hours of treatment (Fig 2c, d), whereas the putrescine and
spermidine levels were decreased at 14 and 20 hours, respectively, after seeding in the presence of
DFMO (Fig. 2e). In order to determine whether the induced increase in the cellular AzI level was due to
the decrease in cellular putrescine and/or spermidine content caused by DFMO treatment, we examined if
addition of putrescine or spermidine reversed the effect of the inhibitor on the AzI level seen after 24
hours of treatment. As expected, addition of putrescine or spermidine to the cells treated with DFMO
restored the cellular content of putrescine and/or spermidine to control or above control values (Fig. 3d).
Moreover, the addition of putrescine or spermidine prevented the DFMO-induced increase in cellular AzI
content, (Fig. 3a, b). AG, which was added to the growth medium to prevent extracellular oxidation of
spermidine by serum amine oxidases, had no effect on AzI expression, ODC activity or polyamine
content per se (Fig 3). The effect of SAM486A on the cellular AzI level was also analysed. SAM486A is
an inhibitor of S-adenosylmethionine decarboxylase, which together with ODC catalyses the key steps in
the biosynthesis of polyamines (Pegg 2009). Treatment with SAM486A for 24 hours resulted in an
increased cellular level of AzI, which was similar to that observed after treatment with DFMO (Fig. 3a,
b). The cellular putrescine content was also markedly increased, whereas the spermidine and particularly
the spermine content were decreased (Fig. 3d). Thus, the cellular expression of AzI appeared to be at least
partly regulated by the polyamine pools. A decrease in the polyamine content thus resulted in an increase
in AzI, which presumably caused an increase in the activity of ODC (due to the interaction of AzI with
10
Az). Consequently, AzI is an important regulatory protein in the feedback control of polyamine
homeostasis.
Effects of AzI overexpression
We next investigated the effect of perturbed AzI expression on polyamine homeostasis and cell
proliferation. Two breast cancer cell lines, JIMT-1 and MCF-7, were transfected with an expression
vector containing the coding region of human AzI1 and stable transfectants were isolated. As shown in
Fig. 4a, both cell lines transfected with the AzI-containing vector exhibited a marked increase in the
expression of AzI compared to the cells transfected with the empty vector. Interestingly, both cell lines
expressing a high level of AzI also exhibited an increased cell proliferation over 96 hours in culture, as
compared to the control cells (Fig. 4c). Increased AzI expression was also associated with an increase in
ODC activity in the transfected cells 48 hours after seeding (Fig. 4d). This was seen clearly in the AzI-
expressing MCF-7 cells, where a more than 4-fold increase in ODC activity was observed compared to
the control cells 48 hours after seeding (Fig. 4d). The cellular content of putrescine increased markedly,
whereas that of spermine decreased in the cells expressing high levels of AzI compared to the control
cells (Fig. 4e). Expression of AzI did not affect cellular spermidine content (Fig. 4e).
Cellular localisation of AzI
It has previously been reported that cellular localisation of AzI varies during the cell cycle, with a
cytoplasmic localisation during interphase and a centrosomal localisation during mitosis, thereby
indicating a role for AzI in the mitotic process (Mangold et al. 2008; Murakami et al. 2009). In the
present study, we determined the intracellular localisation of AzI in JIMT-1 cells 48 hours after seeding,
using immunofluorescence microscopy (Fig. 5). In early mitosis, before chromosomal alignment and
centrosomal separation, AzI was found in the cytoplasm and in the central part of the nuclear area (Fig.
5a). In metaphase/anaphase, AzI was localised in a pattern that resembled that of two centrosomes having
the chromosomes in between (Fig. 5b).
Discussion
As shown in the present study, the cellular level of AzI increased during the exponential growth of JIMT-
1 cells. The increase probably reflects a rapid induction of AzI transcription after reseeding the cells in
fresh medium. Nilsson et al. (2000) have demonstrated a rapid increase in AzI mRNA in mouse
fibroblasts after growth stimulation by serum. Since binding of ODC to Az inhibits ODC activity, as well
as stimulates its degradation, it is highly likely that the early increase in ODC activity seen in the JIMT-1
cells after seeding in fresh medium can be partly explained by a stabilisation/reactivation of the ODC
protein caused by the sequestering of Az to AzI (Murakami et al. 1989; Nilsson et al. 2000). ODC activity
started to decrease after 24 h, whereas the AzI level remained elevated for 96 h, after reseeding the cells
in fresh medium. The ODC level (and activity) is dependent on a variety of factors which affect synthesis

11
and degradation (e.g. ODC synthesis rate, levels of Az and AzI) and thus the ODC activity may decrease
even though the level of AzI remains elevated.
We also demonstrate that DFMO inhibits the polyamine biosynthesis pathway, while simultaneously
increasing the AzI level in exponentially growing breast cancer cells, indicating a feedback control of AzI
by the polyamines. Since the AzI level has been reported to fluctuate within the cell cycle with peaks
during early G1 and G2/M phases (Murakami et al. 2009), the observed increase in AzI level after DFMO
treatment could also be due to an accumulation of cells in a specific phase (e.g. G1) of the cell cycle
caused by the ODC inhibitor. However, it was clear that the cell cycle progression was not affected by
DFMO during the first 24 hours of treatment, whereas the induction of AzI was observed as early as 16
hours after start of treatment. Instead, the increase in AzI caused by DFMO appeared to correlate with a
decrease in putrescine and/or spermidine levels in the cells. This was further supported by the reversible
effect of putrescine and spermidine on DFMO-induced increase of AzI. Moreover, treatment with
SAM486A resulted in a similar increase in cellular AzI content as that observed after DFMO treatment.
However, the effects of the two inhibitors on cellular polyamine content differed. DFMO reduced
putrescine and spermidine levels, whereas SAM486A reduced spermidine and spermine levels along with
an increase in putrescine content. Thus, it would appear that the negative control of AzI is not exerted by
a single polyamine. Instead all of the three polyamines may have the capability to down-regulate AzI,
although with different potencies. Murakami et al. (2009) have previously shown that the expression of
AzI is negatively regulated by any of the polyamines in HTC cells.
Ivanov et al. (2008) demonstrated that all available sequences of vertebrate AzI mRNAs contain an
upstream conserved coding region (uCC) of about 50 codons. The uCC lacks an in-frame AUG codon,
but contains a conserved AUU near the 5’ end, which might serve as an initiation codon for the uCC.
Using a luciferase reporter assay Ivanov et al. (2008) were able to show that the uCC of mouse AzI
mRNA mediates polyamine-induced repression of the downstream main open reading frame. In
spermidine-supplemented cells, the expression of the main open reading frame was repressed 6.5-fold
compared with that of polyamine-depleted (DFMO-treated) cells. However, this repression was
essentially lost when the putative initiation codon of the uCC was mutated from AUU to a non-initiating
UUU codon. Moreover, mutating the last 10 sense codons of the uCC gave similar results, eliminating
polyamine-induced repression of main open reading frame translation. The results obtained in the present
study together with those of Murakami et al. (2009) confirm that the expression of AzI in mammalian
cells is regulated by polyamines. It is highly likely that this regulation occurs, at least partly, at the
translational level by the mechanism suggested by Ivanov et al. (2008). AzI is reported to have a short
half-life (Bercovich and Kahana 2004) and thus any change in the synthesis rate will result rapidly in a
change in the level of the AzI protein. Murakami et al. (2009) was able to show that putrescine down-
regulated AzI mainly at the translation level in HTC cells. Murakami et al. (2014) recently demonstrated
that polyamines may also regulate AzI expression by affecting the transcription as well as the splicing
pattern of the mRNA. They showed that polyamines, besides reducing the transcription of full-length
AzI1 mRNA, actually increased the level of a splice variant with a premature termination codon (coding
12
for an AzI lacking almost two-thirds of the C-terminal region). In addition, polyamine depletion achieved
after treatment with DFMO gave the opposite effect.
Increased levels of ODC and polyamines are distinctive features of rapid cell proliferation and of
numerous forms of cancer (Wallace et al. 2003; Pegg 2006). ODC may be considered as a possible
oncogene and over-expression of this enzyme has been demonstrated to induce cellular transformation in
a variety of systems (Wallace et al. 2003; Pegg 2006; Shantz and Levin 2007). Thus, polyamine
homeostasis is highly regulated and AzI appears to play an important role in this regulation. As shown in
the present study, over-expression of AzI resulted in an increased cell proliferation, along with elevated
levels of ODC and putrescine. Interestingly, the marked increase in ODC activity seen in the AzI-
transfected cells during exponential growth (48 hours after seeding) was not correlated with any major
changes in polyamine levels, indicating that polyamine homeostasis is dependent on a variety of factors
other than ODC activity (e.g. substrates for synthesis, other enzymes in the polyamine pathway (synthetic
or degradative), cellular uptake or efflux of polyamines). The increase in ODC activity was most likely
related to a stabilisation of the enzyme due to the binding of Az to AzI. Keren-Paz et al. (2006)
demonstrated that NIH3T3 mouse fibroblasts overexpressing AzI had elevated ODC and polyamine
levels, and proliferated faster than control cells. Similar findings were obtained by Kim et al. (2006) using
NIH3T3 cells and AT2.1 rat prostate carcinoma cells overproducing AzI. Keren-Paz et al. (2006) also
demonstrated that AzI-overexpressing cells grew in the presence of low concentrations of serum, formed
colonies in soft agar and gave rise to tumours when injected into nude mice, which all are attributes of
transformed cells. In addition, AzI has been found to be up-regulated in a large number of cancers and
thus may be regarded as a putative oncogene (Jung et al. 2000; Schaner et al. 2003; van Duin et al. 2005;
Chin et al. 2007; Olsen and Zetter 2011). Conversely, silencing of AzI expression has been shown to
reduce cell proliferation in vitro (Choi et al. 2005; Keren-Paz et al. 2006; Kim et al. 2006; Olsen et al.
2012), as well as repress tumour growth in vivo (Olsen et al. 2012). The effects of AzI most likely occur
through the binding to Az and suppression of its functions. In addition to affecting the turnover of ODC,
Az has been reported to stimulate the degradation of proteins important for cell cycling as well as
centrosome duplication (Newman et al. 2004; Kasbek et al. 2010; Dulloo et al. 2010).
The results of the present study support the interesting observation of a centrosomal localisation of AzI
during mitosis previously reported by Mangold et al. (2008) and Murakami et al. (2009). Also Az has
been shown to be co-localised with the centrosome during mitosis (Mangold et al. 2008; Murakami et al.
2009). Interestingly, alterations in the AzI/Az ratio caused abnormalities in the numbers of centrosomes
in the cell, which further indicates a role for Az (and AzI) in centrosomal duplication (Mangold et al.
2008). It is conceivable that Az regulates the turnover of an essential centrosomal component. In fact, Az
has been reported to stimulate the degradation of Aurora-A, which is a key protein in centrosome
amplification (Lim and Gopalan 2007). However, more work is needed to identify the exact functions of
Az and AzI in mitosis.
In conclusion, our findings indicate strongly that AzI plays essential roles in polyamine homeostasis and
cell proliferation.

13
Acknowledgements
We thank Ewa Dahlberg and Lena Thiman for expert technical help with cell culturing and HPLC,
respectively. The authors acknowledge financial support from the Portuguese Foundation for Science and
Technology—SFRH/BD/46364/2008 (PhD fellowship to T.M.S.), the Gunnar Nilssons Cancer
Foundation, the Mrs Berta Kamprads Foundation and the Per-Eric and Ulla Schybergs Foundation.
Heather Wallace was supported by a visiting scholarship from Lund University. We are grateful for the
generous supply of AzI antibody and pcDNA3.1-AzI from Dr. Senya Matsufuji and Dr. Yasuku
Murakami (Tokyo, Japan), and Dr. Leif Andersson (Helsinki, Finland), respectively.
Conflict of interest
The authors declare that they have no conflict of interest.
References
Begg AC, McNally NJ, Shrieve DC, Karcher H (1985) A method to measure the duration of DNA
synthesis and the potential doubling time from a single sample. Cytometry 6:620-626.
doi:10.1002/cyto.990060618
Bercovich Z, Kahana C (2004) Degradation of antizyme inhibitor, an ornithine decarboxylase
homologous protein, is ubiquitin-dependent and is inhibited by antizyme. The Journal of
biological chemistry 279:54097-54102. doi:10.1074/jbc.M410234200
Chin SF et al. (2007) High-resolution aCGH and expression profiling identifies a novel genomic subtype
of ER negative breast cancer. Genome Biol 8:R215. doi:10.1186/gb-2007-8-10-r215
Choi KS, Suh YH, Kim WH, Lee TH, Jung MH (2005) Stable siRNA-mediated silencing of antizyme
inhibitor: regulation of ornithine decarboxylase activity. Biochemical and Biophysical Research
Communications 328:206-212. doi:10.1016/j.bbrc.2004.11.172
Dulloo I, Gopalan G, Melino G, Sabapathy K (2010) The antiapoptotic DeltaNp73 is degraded in a c-Jun-
dependent manner upon genotoxic stress through the antizyme-mediated pathway. Proceedings
of the National Academy of Sciences of the United States of America 107:4902-4907. doi:
10.1073/pnas.0906782107
Fredlund JO, Oredsson SM (1996) Impairment of DNA replication within one cell cycle in cells seeded in
the presence of a polyamine biosynthesis inhibitor. Eur J Biochem 237:539-544.
Fujita K, Murakami Y, Hayashi S (1982) A macromolecular inhibitor of the antizyme to ornithine
decarboxylase. The Biochemical journal 204:647-652.
Gerner EW, Meyskens FL, Jr. (2004) Polyamines and cancer: old molecules, new understanding. Nat Rev
Cancer 4:781-792. doi:10.1038/nrc1454
Ivanov IP, Loughran G, Atkins JF (2008) uORFs with unusual translational start codons autoregulate
expression of eukaryotic ornithine decarboxylase homologs. Proceedings of the National
Academy of Sciences of the United States of America 105:10079-10084.
doi:10.1073/pnas.0801590105
Jänne J, Williams-Ashman HG (1971) On the purification of L-ornithine decarboxylase from rat prostate
and effects of thiol compounds on the enzyme. The Journal of biological chemistry 246:1725-
1732

14
Jung MH et al. (2000) Identification of differentially expressed genes in normal and tumor human gastric
tissue. Genomics 69:281-286. doi:10.1006/geno.2000.6338
Kahana C (2009) Antizyme and antizyme inhibitor, a regulatory tango. Cellular and molecular life
sciences : CMLS 66:2479-2488. doi:10.1007/s00018-009-0033-3
Kanerva K, Makitie LT, Back N, Andersson LC (2010) Ornithine decarboxylase antizyme inhibitor 2
regulates intracellular vesicle trafficking. Exp Cell Res 316:1896-1906.
doi:10.1016/j.yexcr.2010.02.021
Kasbek C, Yang CH, Fisk HA (2010) Antizyme restrains centrosome amplification by regulating the
accumulation of Mps1 at centrosomes. Mol Biol Cell 21:3878-89. doi: 10.1091/mbc.E10-04-
0281
Keren-Paz A, Bercovich Z, Porat Z, Erez O, Brener O, Kahana C (2006) Overexpression of antizyme-
inhibitor in NIH3T3 fibroblasts provides growth advantage through neutralization of antizyme
functions. Oncogene 25:5163-5172. doi:10.1038/sj.onc.1209521
Kim SW, Mangold U, Waghorne C, Mobascher A, Shantz L, Banyard J, Zetter BR (2006) Regulation of
cell proliferation by the antizyme inhibitor: evidence for an antizyme-independent mechanism. J
Cell Sci 119:2583-2591. doi:10.1242/jcs.02966
Lim SK, Gopalan G (2007) Antizyme1 mediates AURKAIP1-dependent degradation of Aurora-A.
Oncogene 26:6593-6603. doi:10.1038/sj.onc.1210482
Lopez-Contreras AJ, Lopez-Garcia C, Jimenez-Cervantes C, Cremades A, Penafiel R (2006) Mouse
ornithine decarboxylase-like gene encodes an antizyme inhibitor devoid of ornithine and
arginine decarboxylating activity. The Journal of biological chemistry 281:30896-30906.
doi:10.1074/jbc.M602840200
Lopez-Contreras AJ, Ramos-Molina B, Cremades A, Penafiel R (2008) Antizyme inhibitor 2
(AZIN2/ODCp) stimulates polyamine uptake in mammalian cells. The Journal of biological
chemistry 283:20761-20769. doi:10.1074/jbc.M801024200
Mangold U, Hayakawa H, Coughlin M, Munger K, Zetter BR (2008) Antizyme, a mediator of ubiquitin-
independent proteasomal degradation and its inhibitor localize to centrosomes and modulate
centriole amplification. Oncogene 27:604-613. doi:10.1038/sj.onc.1210685
Matsufuji S, Matsufuji T, Miyazaki Y, Murakami Y, Atkins JF, Gesteland RF, Hayashi S (1995)
Autoregulatory frameshifting in decoding mammalian ornithine decarboxylase antizyme. Cell
80:51-60
Mitchell JL, Judd GG, Bareyal-Leyser A, Ling SY (1994) Feedback repression of polyamine transport is
mediated by antizyme in mammalian tissue-culture cells. The Biochemical journal 299:19-22
Murai N, Murakami Y, Matsufuji S (2011) Protocols for studying antizyme expression and function.
Methods Mol Biol 720:237-267. doi:10.1007/978-1-61779-034-8_15
Murakami Y et al. (2009) The change of antizyme inhibitor expression and its possible role during
mammalian cell cycle. Exp Cell Res 315:2301-2311. doi:10.1016/j.yexcr.2009.04.024
Murakami Y, Matsufuji S, Nishiyama M, Hayashi S (1989) Properties and fluctuations in vivo of rat liver
antizyme inhibitor. The Biochemical journal 259:839-845
Murakami Y, Ohkido M, Takizawa H, Murai N, Matsufuji S (2014) Multiple forms of mouse antizyme
inhibitor 1 mRNA differentially regulated by polyamines. Amino acids 46:575-583.
doi:10.1007/s00726-013-1598-6
Newman RM, Mobascher A, Mangold U, Koike C, Diah S, Schmidt M, Finley D, Zetter BR (2004)
Antizyme targets cyclin D1 for degradation. A novel mechanism for cell growth repression. The
Journal of biological chemistry 279:41504-41511.
Nilsson J, Grahn B, Heby O (2000) Antizyme inhibitor is rapidly induced in growth-stimulated mouse
fibroblasts and releases ornithine decarboxylase from antizyme suppression. The Biochemical
journal 346:699-704
Nowotarski SL, Woster PM, Casero RA, Jr. (2013) Polyamines and cancer: implications for
chemotherapy and chemoprevention. Expert Rev Mol Med 15:e3. doi:10.1017/erm.2013.3
Olsen RR, Chung I, Zetter BR (2012) Knockdown of antizyme inhibitor decreases prostate tumor growth
in vivo. Amino acids 42:549-558. doi:10.1007/s00726-011-1032-x
Olsen RR, Zetter BR (2011) Evidence of a role for antizyme and antizyme inhibitor as regulators of
human cancer. Mol Cancer Res 9:1285-1293. doi:10.1158/1541-7786.MCR-11-0178
Rom E, Kahana C (1994) Polyamines regulate the expression of ornithine decarboxylase antizyme in
vitro by inducing ribosomal frame-shifting. Proceedings of the National Academy of Sciences of
the United States of America 91:3959-3963
Pegg AE (2006) Regulation of ornithine decarboxylase. The Journal of biological chemistry 281:14529-
14532. doi:10.1074/jbc.R500031200

15
Pegg AE (2009) S-Adenosylmethionine decarboxylase. Essays in biochemistry 46:25-45.
doi:10.1042/bse0460003
Pegg AE, Casero RA, Jr. (2011) Current status of the polyamine research field. Methods Mol Biol 720:3-
35. doi:10.1007/978-1-61779-034-8_1
Persson L (2009) Polyamine homoeostasis Essays in biochemistry 46:11-24. doi:10.1042/bse0460002
Pitkanen LT, Heiskala M, Andersson LC (2001) Expression of a novel human ornithine decarboxylase-
like protein in the central nervous system and testes. Biochemical and biophysical research
communications 287:1051-1057. doi:10.1006/bbrc.2001.5703
Schaner ME et al. (2003) Gene expression patterns in ovarian carcinomas. Mol Biol Cell 14:4376-4386.
doi:10.1091/mbc.E03-05-0279
Seiler N, Knödgen B (1980) High-performance liquid chromatographic procedure for the simultaneous
determination of the natural polyamines and their monoacetyl derivatives. J Chromatogr
221:227-235
Shantz LM, Levin VA (2007) Regulation of ornithine decarboxylase during oncogenic transformation:
mechanisms and therapeutic potential. Amino acids 33:213-223. doi:10.1007/s00726-007-0531-
2
Silva T, Andersson S, Sukumaran S, Marques M, Persson L, Oredsson S (2013) Norspermidine and
Novel Pd(II) and Pt(II) Polynuclear Complexes of Norspermidine as Potential Antineoplastic
Agents Against Breast Cancer. PloS One "in press"
Snapir Z, Keren-Paz A, Bercovich Z, Kahana C (2008) ODCp, a brain- and testis-specific ornithine
decarboxylase paralogue, functions as an antizyme inhibitor, although less efficiently than AzI1.
The Biochemical journal 410:613-619. doi:10.1042/BJ20071423
Suzuki T, He Y, Kashiwagi K, Murakami Y, Hayashi S, Igarashi K (1994) Antizyme protects against
abnormal accumulation and toxicity of polyamines in ornithine decarboxylase-overproducing
cells. Proceedings of the National Academy of Sciences of the United States of America
91:8930-8934
Tang H, Ariki K, Ohkido M, Murakami Y, Matsufuji S, Li Z, Yamamura K (2009) Role of ornithine
decarboxylase antizyme inhibitor in vivo. Genes Cells 14:79-87. doi:10.1111/j.1365-
2443.2008.01249.x
van Duin M et al. (2005) High-resolution array comparative genomic hybridization of chromosome arm
8q: evaluation of genetic progression markers for prostate cancer. Genes Chromosomes Cancer
44:438-449. doi:10.1002/gcc.20259
Wallace HM, Fraser AV, Hughes A (2003) A perspective of polyamine metabolism. The Biochemical
journal 376:1-14. doi:10.1042/BJ20031327
16
Legends to Figures
Fig 1
Long-term effects of DFMO on cell proliferation, ODC activity, AzI level and polyamine content in
JIMT-1 cells. Cells were seeded in the absence or presence of 1 mM DFMO (DF). (a) The cells were
harvested for analyses every 24 hours for 168 hours by trypsinisation and the cell number was determined
by using a hemocytometer. Cell pellets were prepared and used for various analyses. (b) ODC activity
was determined by a radiometric assay. (c and d) AzI was determined and quantified by Western blot (d)
and the data from three experiments were densitometrically scanned and presented as relative AzI
expression (c). (e) Putrescine, spermidine and spermine contents were determined by HPLC. Values are
mean ± SEM (n = 3-7). When not visible, the SEM bars are covered by the symbols. *p < 0.05;
**p < 0.01; ***p < 0.001 (compared to controls).
Fig 2
Short-term effects of DFMO on cell proliferation, AzI level and polyamine content in JIMT-1 cells. Cells
were seeded in the absence or presence of 1 mM DFMO and sampled for various analyses every other
hour for the first 24 hours after seeding. A DNA – bromodeoxyuridine (BrdUrd) method was used to
follow cell cycle progression after seeding. Thirty minutes prior to sampling, 5 µM BrdUrd was added to
the medium of the cells. The cells were harvested and fixed in 70% ethanol. After labelling DNA with PI
and the incorporated BrdUrd with antibodies, the cells were analysed by flow cytometry. Cell cycle
progression was monitored by following changes in RMzero (a) and LI (b). AzI was determined by
Western blot (d) and the data from three experiments were densitometrically scanned and presented as
relative AzI expression (c). Putrescine, spermidine and spermine levels were determined by HPLC (e).
Values are mean ± SEM (n = 4-5). When not visible, the SEM bars are covered by the symbols.
*p < 0.05; **p < 0.01 (compared to controls).
Fig 3
Regulation of AzI by polyamines in JIMT-1 cells. Cells were seeded in the absence of compound
(control) or in the presence of 1 mM DFMO, 20 M SAM486A, 1 mM aminoguanidine (AG), or 1 mM
DFMO (DF) and 100 M putrescine (Put), or 1 mM DFMO and 50 M spermidine (Spd) and sampled at
24 hours after seeding. AzI was determined by Western blot (a) and the data from three experiments were
scanned using densitometry and presented as relative AzI expression (b). ODC activity was determined
by a radiometric assay (c) and putrescine, spermidine and spermine contents (d) were determined by
HPLC. Values are mean ± SEM (n = 3-6). When not visible, the SEM bars are covered by the symbols.
*p < 0.05; **p < 0.01; ***p < 0.001 (compared to controls).

17
Fig 4
Effect of stable transfection with AzI in MCF-7 and JIMT-1 cells. MCF-7 and JIMT-1 breast cancer cells
were stably transfected with empty vector (pCl-neo) or vector containing AzI (pCl-neo + AzI). AzI was
determined by Western blot (a) and the data from three experiments were scanned using densitometry and
presented as relative AzI expression (b). Proliferation of the cells was compared in growth curve
experiments where the cell number was determined by counting in a hemocytometer (c). ODC activity
was determined by a radiometric assay (d) and putrescine, spermidine and spermine contents (e) were
determined by HPLC. Values are mean ± SEM (n = 3-6). When not visible, the SEM bars are covered by
the symbols. *p < 0.05; **p < 0.01; ***p < 0.001 (compared to controls).
Fig 5
Localisation of AzI during mitosis in JIMT-1 cells. Cells were seeded on poly-L-lysine-coated glass
slides and fixed in paraformaldehyde. They were then stained with primary AzI antibodies and secondary
Alexa Fluor 488 antibodies (green fluorescence) and DNA was stained with bisbenzimide (blue
fluorescence). (a) Early mitosis. (b) Metaphase/anaphase. Size of bar in fluorescence microscopy images:
20 µm.
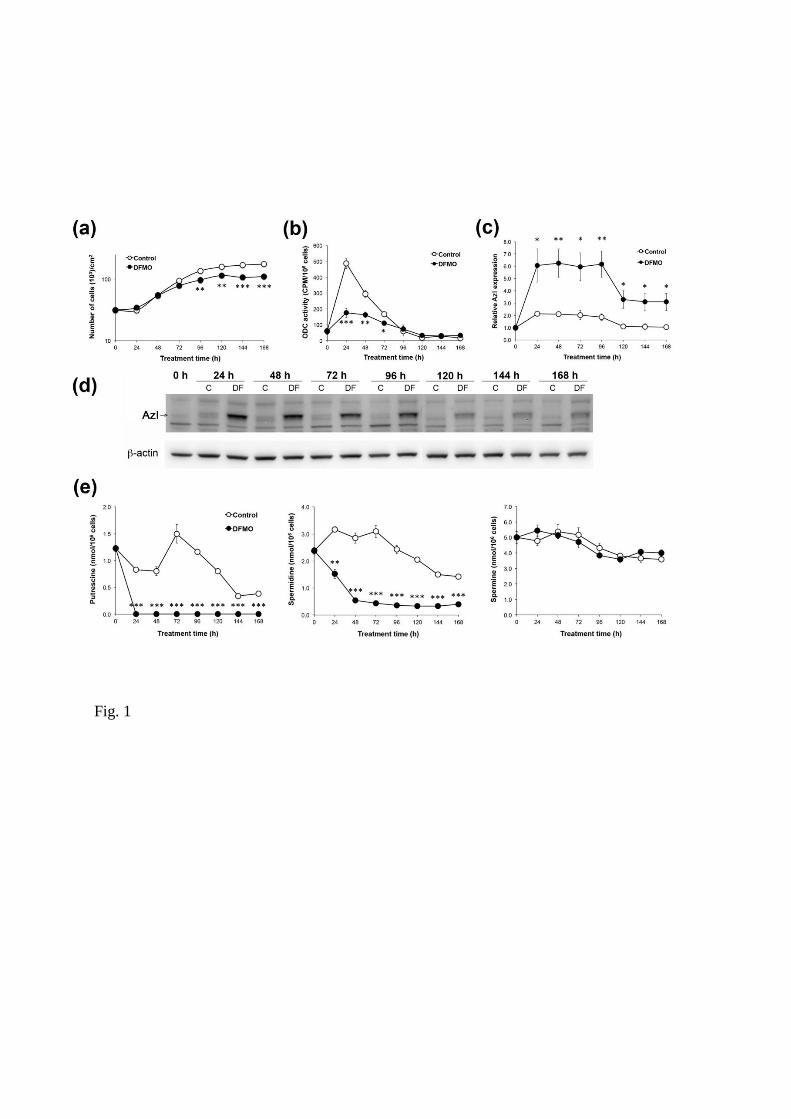
Fig. 1
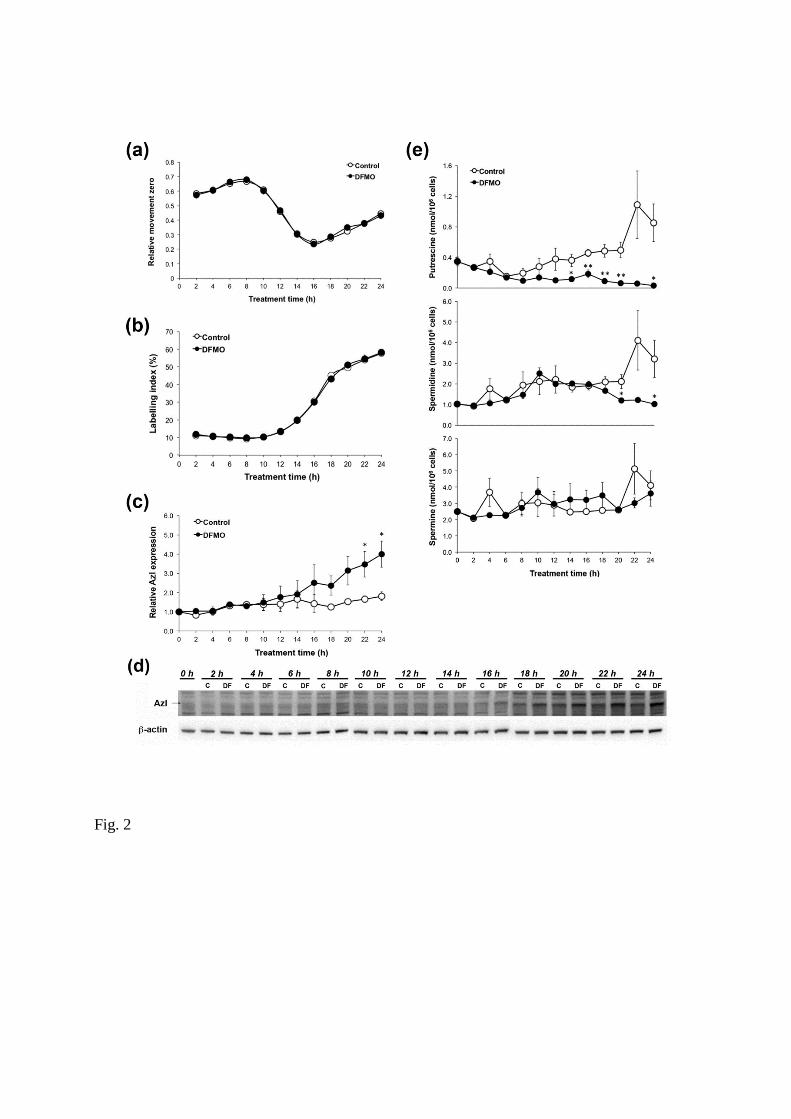
Fig. 2

Fig. 3
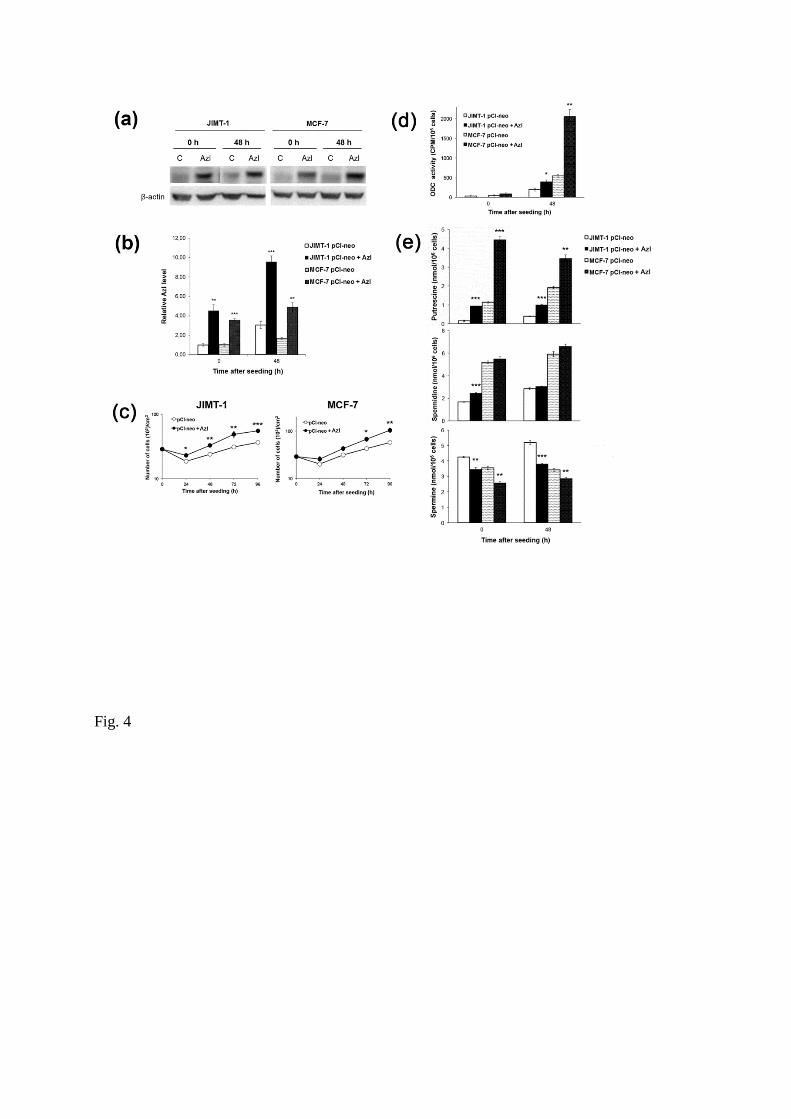
Fig. 4

Fig. 5