a robust model to measure governance in african...
TRANSCRIPT
EUR 23773 EN 2009
A robust model to measure
governance in African countries
Michaela Saisana, Paola Annoni and Michela Nardo
Created with novaPDF Printer (www.novaPDF.com). Please register to remove this message.

The mission of the JRC-IPSC is to provide research results and to support EU policy-makers in their effort towards global security and towards protection of European citizens from accidents, deliberate attacks, fraud and illegal actions against EU policies. European Commission Joint Research Centre Institute for the Protection and Security of the Citizen Contact information Address: Michaela Saisana, European Commission, JRC, Enrico Fermi 2749, TP361, 21027, Italy. E-mail: [email protected] Tel.: +39-0332-786572 Fax: +39-0332-785733 http://ipsc.jrc.ec.europa.eu/ http://www.jrc.ec.europa.eu/ Composite Indicators website: http://composite-indicators.jrc.ec.europa.eu/ Legal Notice Neither the European Commission nor any person acting on behalf of the Commission is responsible for the use which might be made of this publication.
Europe Direct is a service to help you find answers to your questions about the European Union
Freephone number (*):
00 800 6 7 8 9 10 11
(*) Certain mobile telephone operators do not allow access to 00 800 numbers or these calls may be billed.
A great deal of additional information on the European Union is available on the Internet. It can be accessed through the Europa server http://europa.eu/ JRC 50643 EUR 23773 EN ISBN 978-92-79-11604-9 ISSN 1018-5593 DOI 10.2788/82544 Luxembourg: Office for Official Publications of the European Communities © European Communities, 2009 Reproduction is authorised provided the source is acknowledged Printed in Italy
Created with novaPDF Printer (www.novaPDF.com). Please register to remove this message.

3
A robust model to measure governance in African countries
Michaela Saisana, Paola Annoni and Michela Nardo
Executive Summary
Levels of performance in government do matter in determining the quality of civil
society. As the UNDP (United Nations Development Program) Administrator Kemal
Derviş recently stated, “Institutions, rules and political processes play a major role in
determining whether economies grow, whether children go to school, and whether
development goes forward…..”
National governance assessments are generally carried out in order to investigate and
strengthen the relationship between governance and the type of any intervention and
assistance given. In African countries, the need to evaluate the quality of governance
is even more pronounced. For example, the African Governance Forum
(www.undp.org/africa/agf/) is a governance programme of the UNDP in Africa which
has been held regularly since 1997. It provides a platform for African leaders and
other major players to come together for policy dialogue, mutual learning and
exchange of experience on how to meet governance challenges on the continent.
The Ibrahim Index of African Governance developed by the Harvard Kennedy School
(Rotberg and Gisselquist, 2008) shows how governance can be measured. The Index
assesses governance issues over time (2000, 2002, 2005, 2006) for 48 African
countries south of the Sahara, according to a five-pillar conceptual structure:
(a) Safety and Security,
(b) Rule of Law, Transparency, and Corruption,
(c) Participation and Human Rights,
(d) Sustainable Economic Opportunity, and
(e) Human Development.
Together these five categories of political goods are considered to encapsulate the
performance of any government. The five major pillars are described by fourteen sub-
pillars composed in total of fifty-seven indicators (in a mixture of qualitative and
quantitative measures). The main approach for the setting-up of the final Index of
Created with novaPDF Printer (www.novaPDF.com). Please register to remove this message.
4
African Governance is quite straightforward: a simple average at all levels of
aggregation (sub-pillar, pillar, overall Index).
This report aims to validate and critically assess the methodological approach to the
2006 Index of African Governance, by addressing two key questions:
1. Is the Index of African Governance internally sound and consistent,
from a statistical and conceptual point of view?
2. What scenarios could have been used to build the Index and how do
the results of these scenarios compare to the original results?
Regarding the first objective, the analysis of statistical quality and robustness of the
Index is carried out at two different levels. At the first level, each of the five pillars is
analysed by applying statistical techniques adequate to both qualitative and
quantitative data to the original indicators included in the Index. The aim is to
assess from a purely statistical perspective the internal validity and consistency of
each pillar. At the second level, validity and consistency are assessed by applying
statistical techniques at the sub-pillar and pillar level.
In line with the second objective, an ex post analysis is performed to evaluate the
robustness of the 2006 Index ranking against alternative scenarios in which different
sources of uncertainty are activated simultaneously. In these more sophisticated
scenarios we deviate from the classic approach of building the Index through a simple
weighted summation of indicators normalised using a Min-Max scaling. These
scenarios differ from one another in the inclusion/exclusion of a sub-pillar, the
weighting scheme and the aggregation rule. Such a multi-modelling approach and the
presentation of the results under uncertainty, rather than as single country ranks, helps
to avert the criticism frequently raised against composite measures and rankings,
namely that they are generally presented as if they had been calculated under
conditions of certainty, while this is in fact rarely the case.
The overall assessment of the 2006 Index by means of multivariate analysis and
uncertainty and sensitivity analyses reveals no particular shortcomings in the
conceptual structure. In brief, the analyses demonstrate that the 2006 Index of African
Governance:
is internally consistent, from a conceptual and statistical point of view,
is not double-counting indicators due to correlation among them,
Created with novaPDF Printer (www.novaPDF.com). Please register to remove this message.

5
has a well-balanced structure (not dominated by a single sub-pillar or pillar),
is not strongly affected by compensability (at the sub-pillar level), and
is a summary measure of a plurality of alternative methodological scenarios
(including inter alia multi-criteria analysis and cross-efficiency data
envelopment analysis).
These conclusions support the conceptual framework and methodological approach of
the 2006 Index, which additionally has a simple form (arithmetic average of scaled
indicators) that is easy to communicate to the wider public.
Data-driven narratives on governance issues in Africa are also offered in this report in
order to draw attention to messages and debates that may stem from an index-based
analysis of governance.
Overall, the Index of African Governance can reliably be used to identify weaknesses
and possible remedial actions, to make easy spatial and temporal comparisons
(benchmarking), to prioritize African countries with relatively low levels of
governance, and ultimately to monitor and evaluate policy effectiveness.
Created with novaPDF Printer (www.novaPDF.com). Please register to remove this message.

6
Table of Contents 1. Introduction.................................................................................................................9 2. Conceptual framework and methodological approach to measuring governance in Africa ............................................................................................................................ 12 3. Brief considerations on the imputation of missing data .............................................. 15 4. Internal consistency of the 2006 Index....................................................................... 17 4.1. Statistical dimensionality of the framework ............................................................ 18 4.2. Associations between the Index and its components ............................................... 22 4.3. Impact assessment of the sub-pillars on the Index results ........................................ 26 5. Cluster analysis ......................................................................................................... 29 5.1 Cluster analysis: as diagnostic tool........................................................................... 29 5.2 Cluster analysis: setting short-term targets ............................................................... 31 6. Uncertainty and sensitivity analysis ........................................................................... 33 6.1 Multi-modelling approach ....................................................................................... 34 6.2 Uncertainty analysis results ..................................................................................... 36 6.3 Sensitivity analysis results ....................................................................................... 39 7. Policy implications .................................................................................................... 43 7.1 Exceptional behaviour of some African countries .................................................... 44 7.2. African Governance – what it is and is not about .................................................... 47 7.3 Index of African Governance and population size .................................................... 54 7.4. Index of African Governance & variability ............................................................. 55 8. Conclusions............................................................................................................... 57 ANNEX: Methodological boxes and additional information .......................................... 61 ANNEX: Statistical dimensionality of the framework.................................................... 73 References..................................................................................................................... 88
Created with novaPDF Printer (www.novaPDF.com). Please register to remove this message.

7
List of Tables Table 1. Conceptual framework for the 2006 Index of African Governance ............. 14 Table 2. Missing data imputed with hot deck method (Manhattan distance) ............. 16 Table 3. Pearson’s correlation coefficients for the CLI and its four pillars ............... 23 Table 4. Pearson’s correlation coefficients between the Index and its sub-pillars ..... 23 Table 5. Pearson’s correlation coefficients between the Index/pillars and the
underlying indicators ................................................................................ 25 Table 6. Nominal and effective weights of the sub-pillars and pillars in the African
Governance framework............................................................................. 27 Table 7. Impact of the elimination of one sub-pillar at a time on the Index country
ranks......................................................................................................... 28 Table 8. Cluster means across the 14 sub-pillars of African Governance.................. 30 Table 9. Short-term and long-term targets for the sub-pillars of Governance............ 32 Table 10. Frequency matrix of a country’s rank in the Index of African Governance 37 Table 11. Sensitivity analysis: impact of the assumptions on the Index ranking (most
and least influential scenarios, in a total of 150) ........................................ 40 Table 12. Sensitivity analysis: impact of the assumptions on the Index ranking
(scenarios based on the full framework) .................................................... 41 Table 13. Comparison of the Index ranks versus the five pillar ranks (top/bottom
quartiles)................................................................................................... 46
List of Figures Figure 1. Map of Africa ........................................................................................... 13 Figure 2. Clusters of countries (alphabetical order) based on the 14 sub-pillars of
African Governance .................................................................................. 30 Figure 3. Average values per cluster group: pillars and overall Index ...................... 31 Figure 4. Simulated median and its 99% confidence interval (across 150 models) for
the Index ranks.......................................................................................... 39 Figure 5. Impact of selected scenarios on the Index ranking..................................... 42 Figure 6. 2006 Index and pillar scores (and ranks) ................................................... 44 Figure 7. Index of African Governance vs. GDP per capita...................................... 47 Figure 8. Index of African Governance vs. Judicial Independence ........................... 48 Figure 9. Index of African Governance vs. Public Sector Corruption....................... 49 Figure 10. Index of African Governance vs. Respect for Civil Rights ...................... 49 Figure 11. Index of African Governance vs. Child Mortality ................................... 50 Figure 12. Index of African Governance vs. Access to drinking water ..................... 51 Figure 13. Index of African Governance vs. Primary School Completion Rate ........ 52 Figure 14. Index of African Governance vs. GDP Growth....................................... 53 Figure 15. Index of African Governance vs. Inflation .............................................. 53 Figure 16. Index of African Governance vs. Gini Index........................................... 54 Figure 17. Index of African Governance vs. HIV Prevalence ................................... 54 Figure 18. Index of African Governance vs. Population Size ................................... 55 Figure 19. The scissor diagram of the Index of African Governance and Variability 56
Created with novaPDF Printer (www.novaPDF.com). Please register to remove this message.

8
List of Boxes Box 1. PCA, FA and Reliability Item Analysis and their role in the study of the Index
of African Governance................................................................................. 62 Box 2. Cluster Analysis and its role in the analysis of the Index of African
Governance.................................................................................................. 65 Box 3. Multi-criteria Analysis and its role in the robustness analysis of the Index of
African Governance ..................................................................................... 66 Box 4. Data Envelopment Analysis and its role in the robustness analysis of the Index
of African Governance................................................................................. 67
Created with novaPDF Printer (www.novaPDF.com). Please register to remove this message.

9
1. Introduction
The Ibrahim Index of African Governance (henceforth Index of African Governance,
IAG), developed by the Harvard Kennedy School (Rotberg and Gisselquist, 20081),
aims to measure the quality of political goods provided by African states to their
citizens. The Index assesses governance issues over time (2000, 2002, 2005, 2006) for
48 African countries south of the Sahara, according to a five-pillar conceptual
structure: (a) Safety and Security, (b) Rule of Law, Transparency, and Corruption, (c)
Participation and Human Rights, (d) Sustainable Economic Opportunity, and (e)
Human Development. The five major pillars are described by fourteen sub-pillars
composed in total of fifty-seven indicators (in a mixture of qualitative and quantitative
measurement scales). The main approach to the realisation of the final Index is quite
straightforward: a simple average at all levels of aggregation (sub-pillar, pillar, overall
Index).
Governance quality is clearly an abstract concept that cannot be measured directly.
The underlying hypothesis of this kind of analysis is that the phenomenon to be
measured represents a latent factor that may be observed only indirectly by several
variables describing different features/aspects of the latent dimension2. Choosing
different aspects and indicators is equivalent to choosing the ‘framework’ of the
index. This framework may be seen as the ‘measurement instrument’ of the latent
phenomenon.
According to the conceptual framework, which should be developed on the basis of
general reasoning, expert opinion and/or practitioners’ advice, data are usually
collected for the set of units under investigation (i.e. countries, in the case of the
African Governance phenomenon). Once data have been collected, various statistical
methods can be used to:
1 The analysis is based on the 2008 Index data set described in Robert I. Rotberg and Rachel M. Gisselquist, Strengthening African Governance – Ibrahim Index of African Governance: Results and Rankings 2008 (Cambridge, MA: Mo Ibrahim Foundation; Kennedy School of Government, Harvard University; and World Peace Foundation, October 2008), and provided by Rotberg and Gisselquist. The 2008 Index was supported by the Mo Ibrahim Foundation and is also available on the Mo Ibrahim Foundation website at http://www.moibrahimfoundation.org/index-2008/index.asp (last accessed 7 April 2009). As of 2009, this Index will be known as the Harvard Kennedy School (HKS) Index of African Governance and its 2009 release will be available on the HKS website at http://belfercenter.ksg.harvard.edu/project/52/intrastate_conflict_program.html?page_id=223. 2 Note that in this report the terms ‘indicator’ and variable’ are used as synonymous and that, in the tradition of statistical literature (see for example Gifi, 1990), the term category is used to address the attribute that a qualitative variable can assume. Differently from original IAG terminology (Rotberg and Gisselquist, 2008), the terms ‘category’, ‘sub-category’ and ‘sub-sub-category’ are here translated as ‘pillar’, sub-pillar’ and ‘indicator’ respectively.
Created with novaPDF Printer (www.novaPDF.com). Please register to remove this message.

10
assess the validity of the conceptual framework;
set up the final measure of the phenomenon;
assess the robustness of the index with respect to different choices regarding
either the framework or the computational method of the index (statistical
methods, aggregation schemes, etc.).
This report aims to validate and critically assess the methodological approach taken
by the Harvard Kennedy School to build the Index of African Governance, by
addressing two key questions:
1. Is the Index of African Governance internally sound and consistent,
from a statistical and conceptual point of view?
2. What scenarios could have been used to build the Index and how do
the results of these scenarios compare to the original results?
Both questions are addressed by analysing the 2008 Index of African Governance
based on a dataset from 2006.
Section 2 describes the conceptual framework and the methodological approach
chosen by the Kennedy School to build the Index of African Governance.
Section 3 provides suggestions on the imputation method for estimating missing data,
in particular in the Sustainable Economic Opportunity pillar.
Section 4 studies whether the Index of African Governance is internally sound and
consistent from a statistical and conceptual point of view. We would like to stress that
the statistical analysis has not the purpose of proposing an alternative framework for
the Index of African Governance, but rather to support the IAG by fine tuning it and
by identifying possible shortcomings. Recommendations for the optimization of data
collection are also provided, such as merging categories for some qualitative variables
or reducing the number of indicators.
Section 5 offers suggestions from the application of cluster analysis on how to set
short-term targets for the sub-pillars of governance. In Section 6, we carry out an
uncertainty and sensitivity analysis of the Index. We aim to examine to which extent
the Index ranking depends on the statistical methodology chosen. The analysis
involves the simultaneous activation of various sources of uncertainty (e.g. triggering
the exclusion of a sub-pillar, the weighting and the aggregation rule). Section 7
discusses data-driven narratives based on the Index of African Governance and some
Created with novaPDF Printer (www.novaPDF.com). Please register to remove this message.

11
policy implications: it touches on what drives governance in Africa and what does
not, it identifies countries with exceptional behaviour, and it studies the association
between governance and population or surface size in African countries. Section 8
summarizes the aims, the main findings and the recommendations of the study.
Created with novaPDF Printer (www.novaPDF.com). Please register to remove this message.

12
2. Conceptual framework and methodological approach to measuring governance in Africa
Attempting to summarize a complex system such as governance in a single metric
creates a number of empirical challenges, e.g. data quality, indicator selection,
indicator importance. However, if done well, the exercise could yield a powerful
comparative assessment tool capable of capturing the societal conditions that drive
governance efforts. It could allow for comparisons across space and time by providing
the technical ability to monitor change, identify problems and contribute to priority-
setting and policy formulation. Thus, an index of governance in African countries
could reveal new knowledge which otherwise would remain invisible.
The Index of African Governance developed by the Harvard Kennedy School
(Rotberg and Gisselquist, 2008) shows how governance can be measured. As
aforementioned, the Index assesses governance issues over time for 48 African
countries south of the Sahara (Figure 1). The conceptual framework of the Index is
based on 57 indicators which are organised into 14 sub-pillars, then grouped into five
pillars and finally aggregated to an overall Index. The five pillars represent distinct
aspects of governance, i.e.:
Safety and Security,
Rule of Law, Transparency, and Corruption,
Participation and Human Rights,
Sustainable Economic Opportunity, and
Human Development.
The dataset combines a mixture of qualitative and quantitative indicators. Table 1
presents the full conceptual framework for the Index. These indicators reflect a wide
range of governance issues ranging from freedom and the chance to prosper, to access
to decent schools, well-run hospitals, and well-maintained roads. Together these five
dimensions of political goods are considered to encapsulate the performance of any
government.
The main approach to the realisation of the final Index is quite straightforward: a
simple average at all levels of aggregation (from the underlying indicators to the sub-
pillars, from the sub-pillars to the pillars, from the pillars to the overall Index). Each
underlying indicator is treated as a scalar variable, regardless of its measurement
level. Raw data values are then normalized by a min-max approach: all indicators are
Created with novaPDF Printer (www.novaPDF.com). Please register to remove this message.

13
rescaled such that the worst across all available years of the Index (2000, 2002, 2005
and 2006) receives a score of “0”, and the best value across all years of the Index, a
score of “100”. A sub-pillar score is computed as the simple arithmetic average of the
underlying indicators. Pillar scores are further calculated as the simple arithmetic
averages of the sub-pillars. The only exception to the equal weighting scheme is the
case of the pillar “Safety and Security”, where the “National Security” sub-pillar
receives a weight of 2/3 and the “Public safety” pillar receives a weight of 1/3.
Figure 1. Map of Africa
Countries included in the Index
Created with novaPDF Printer (www.novaPDF.com). Please register to remove this message.

14
Table 1. Conceptual framework for the 2006 Index of African Governance Pillar Sub-pillar Indicator Range
Government Involvement in Armed Conflicts 0 (best) to 6 (worst) Number of Battle-Deaths 0 (best) to 3184 (worst) Number of Civilian Deaths 0 (best) to 1109 (worst) Refugees and Asylum Seekers 0.2 (best) to 10,298.4 (worst) Internally-Displaced People 0 (best) to 18,660.3 (worst)
National Security (2/3)
Ease of Access to Small Arms and Light Weapons 1 (best) to 5 (worst)
Safety and Security (1/5)
Public Safety (1/3) Violent Crime (Homicides) 1 (best) to 5 (worst) Ratification of Core International Human Rights 0 (worst) to 7 (best) International Sanctions 0=no (best); 1=yes (worst)
Ratification of Critical Legal Norms (1/3)
Property Rights Index 0 (worst) to 100 (best) Judicial Independence 0 (worst) to 14 (best) Efficiency of the Courts 0% (best) to 100% (worst)
Judicial Independence and Efficiency (1/3)
Number of Days to Settle a Contract Dispute 270 (best) to 1280 (worst)
Rule of Law, Transparency, and Corruption (1/5)
Corruption (1/3) Public Sector Corruption 1.0 (worst) to 6.0 (best) Free and Fair Executive Elections 0 (worst) to 2 (best) Opposition Participation in Executive Elections 0=no (worst); 1=yes (best) Free and Fair Legislative Elections 0 (worst) to 2 (best)
Participation in Elections (1/2)
Opposition Participation in Legislative Elections 0=no (worst); 1=yes (best) Respect for Physical Integrity Rights 0 (worst) to 8 (best) Respect for Civil Rights 0 (worst) to 12 (best) Press Freedom 5.5 (best) to 99.8 (worst)
Participation and Human Rights (1/5)
Respect for Civil and Political Rights (1/2)
Women's Rights 0 (worst) to 9 (best) GDP per capita based on PPP $244.3 (worst) to $28,536.2 (best) Wealth Creation (1/4) GDP per capita growth -16.2% (worst) to 21.7% (best) Inflation 0.1% (best) to 1,016.7% (worst) Deficits/ Surplus as a % of GDP -41.7% (worst) to 41.6% (best) Reliability of Financial Institutions 0.19 (worst) to 0.97 (best)
Macroeconomic Stability and Financial Integrity (1/4)
Business Environment 14 (best) to 233 (worst) Density of paved road network per 1,000 people (km) 0.03 (worst) to 5.77 (best) Electricity Installed Capacity per Capita (kW) 0.0029 (worst) to 1.1460(best) Phone Subscribers per 100 Inhabitants 0.05 (worst) to 111.96 (best) Computer Usage per 100 Inhabitants 0.02 (worst) to 20.91 (best)
Arteries of Commerce (1/4)
Internet Usage per 100 Inhabitants 0.01 (worst) to 35.67 (best)
Sustainable Economic Opportunity (1/5)
Environmental Sensitivity (1/4)
Environmental Performance Index 39.1 (worst) to 78.1 (best)
Poverty Rate at $1 per person per day 1.0% (best) to 76.2% (worst) Poverty Rate at National Poverty Line 8.0% (best) to 76.8% (worst)
Poverty (1/3)
Inequality (GINI Index) 0 (best) to 100 (worst) Life Expectancy at Birth (years) 39.1(worst) to 73.2 (best) Child Mortality per 1,000 13.3 (best) to 263.8 (worst) Maternal Mortality (per 100,000 live births) 15 (best) to 2,100 (worst) Under-nourishment (% of population) 2.5% (best) to 75% (worst) Immunization, measles (% of children, 12-23 months) 0% (worst) to 100% (best) Immunization, DPT (% of children, 12-23 months) 0% (worst) to 100% (best) HIV Prevalence 0.1% (best) to 33.4% (worst) Incidence of Tuberculosis (per 100,000 people) 22.7 (best) to 1,155.3 (worst) Physicians per 100,000 People 2.1 (worst) to 146.7 (best) Nursing and Midwifery Personnel per 100,000 People 17.8 (worst) to 768.5 (best)
Health and Sanitation (1/3)
Access to Drinking Water (% of overall population) 22% (worst) to 100% (best) Adult Literacy Rate 17.1% (worst) to 91.8% (best) Adult Literacy Rate, Female 9.4% (worst) to 92.3% (best Primary School Completion Rate 16.1% (worst) to over 100% (best) Primary Completion Rate, Female 12.5% (worst) to over 100% (best) Pupil-Teacher Ratio, Primary 13.7 (best) to 82.8 (worst) Progression to Secondary School (%) 18.8% (worst) to 99.7% (best)
Human Development (1/5)
Education (1/3)
Ratio Girls/Boys in Primary and Secondary Education (%)
55.0 (worst) to 107.2 (best) Notes: Numbers in parenthesis indicate the weights assigned to the pillars and the sub-pillars by the developers.
Created with novaPDF Printer (www.novaPDF.com). Please register to remove this message.

15
3. Brief considerations on the imputation of missing data
In the Index of African Governance, missing values are present for specific indicators
and specific countries. For almost all cases, the Kennedy School included specific
estimates for missing value. When even rough estimates were unavailable, the IAG
developers calculated sub-pillar, pillar and overall Index scores omitting the missing
data points, i.e. averaging on all other available data for that indicator, or filling the
missing cells with the mean of the same indicator for all other observed countries (as
in the case of the Environmental Performance Index for the Sustainable Economic
Opportunity pillar). This procedure is known as mean substitution (Rotberg and
Gisselquist, 2008).
Although being a good starting point, mean substitution will artificially diminish the
variance of the variable by imputing the same number for each missing value. A
reduced variance can either attenuate correlation or, if the same cases are missing for
two variables, can inflate it. Furthermore, with mean substitution no additional
information offered by other variables is used. For the pillar Sustainable Economic
Opportunity (the most affected by missing values) we propose a specific method for
missing imputation.
The pattern of missing values for this pillar can be summarized as follows:
Cape Verde, Comoros, Equatorial Guinea, Gambia, Lesotho, Liberia, Sao
Tome and Principe, Seychelles and Somalia do not have observations or
estimates for the Environmental Sensitivity indicator (EPI) (nine out of 48
countries).
Somalia lacks data for seven out of twelve indicators included in this pillar.
Liberia lacks data for two indicators.
We would recommend using the hot-deck method (single imputation), in which
recorded units in the sample are used to substitute missing values (Little and Rubin,
2002). It involves substituting individual values drawn from “similar” observed units,
“similarity” being defined as a certain distance. The distance between two countries
i and j was calculated using the Manhattan distance:
Created with novaPDF Printer (www.novaPDF.com). Please register to remove this message.

16
k
jkikij xxd (1)
where ik x is the value of indicator k observed for country i and k varies only across
those indicators which are observed for both countries. Manhattan is used instead of
classical Euclidean distance since the latter over-weights high differences (Little &
Rubin, 2002).
Pairs of “most similar” countries are shown in Table 2, where squared cells indicate
the estimates for missing values based on the hot-deck method. For example, the
performance of Comoros in the twelve underlying indicators of the Sustainable
Economic Opportunity pillar resembles most the performance of Benin (i.e. Benin is
the “nearest neighbour” of Comoros in terms of performance). Therefore, the
estimated EPI value for Comoros is 43.6 (equal to that of Benin). Burkina Faso is the
country most similar to Sierra Leone and Somalia and therefore the missing values for
the latter two countries are estimated based on those of Burkina Faso.
Table 2. Missing data imputed with hot deck method (Manhattan distance)
Sustainable Economic Opportunity Pillar
Wealth Creation Financial Integrity Arteries of Commence Environmental
Sensitivity
GDP
per c
apita
GDP
per c
apita
gro
wth
Inflat
ion
Defic
its/ S
urplu
s as a
% o
f GDP
Relia
bility
of F
inanc
ial In
stitut
ions
(Con
tract
Inten
sive
Mone
y)
Busin
ess E
nviro
nmen
t (Nu
mbe
r of
Days
to S
tart
a Bus
iness
)
Dens
ity of
pav
ed ro
ad n
etwo
rk
per 1
,000
peop
le
Elec
tricity
Insta
lled
Capa
city p
er
Capit
a (kil
owat
ts)
Phon
e Su
bscr
ibers
per 1
00
Inhab
itant
s
Comp
uter
Usa
ge
Inter
net U
sage
Envir
onme
ntal
Perfo
rman
ce
Index
Benin 3.5 45.1 99.6 49.6 59.4 92.2 3.1 1.0 11.6 2.7 4.0 43.6
Comoros 3.1 38.4 99.7 46.9 54.0 95.9 18.7 0.5 6.1 3.2 7.2 43.6
Burkina Faso 3.0 51.3 99.8 43.8 74.7 90.9 4.2 0.9 7.2 3.1 1.6 13.5
Sierra Leone 1.3 54.4 99.1 46.8 63.9 94.5 2.7 1.6 2.1 3.1 0.8 2.5
Somalia 3.0 51.3 99.8 43.8 74.7 90.9 4.9 0.6 6.8 4.3 3.1 13.5
Cameroon 6.3 46.9 99.5 56.1 83.6 86.3 3.8 4.2 17.5 5.8 6.2 63.4
Lesotho 4.1 59.6 99.4 66.1 92.6 73.1 11.3 3.1 20.5 0.3 8.0 63.4
Swaziland 15.1 46.6 99.5 50.7 96.5 78.5 16.9 11.1 25.5 19.4 11.4 57.1
Cape Verde 8.4 52.4 99.5 44.5 92.4 82.6 34.1 13.2 31.0 57.2 17.8 57.1
Created with novaPDF Printer (www.novaPDF.com). Please register to remove this message.

17
Gabon 47.8 41.8 99.9 61.1 75.3 79.9 12.0 27.8 50.9 15.9 16.1 97.9
Equatorial Guinea 92.2 22.3 99.6 81.5 76.6 44.3 24.2 2.1 26.0 8.5 4.3 97.9
Senegal 4.6 42.0 99.8 42.7 70.8 79.9 6.1 2.0 24.4 10.2 15.3 60.9
Gambia 3.0 47.0 99.8 42.5 72.0 94.1 7.1 1.3 25.8 9.6 14.8 60.9
Malawi 1.5 55.1 98.6 49.8 72.5 89.5 8.5 1.8 5.6 0.9 1.2 53.4
Liberia 0.3 52.4 99.3 55.1 64.5 61.2 3.1 4.5 4.1 0.9 0.8 53.4
Mozambique 1.7 57.8 98.7 48.4 86.2 54.8 4.8 9.7 10.6 6.8 2.5 38.1
Sao Tome and Principe 4.4 56.6 97.7 34.9 89.4 40.6 33.4 4.9 14.5 18.3 38.5 38.1
Mauritius 35.3 49.8 99.5 43.7 95.8 85.4 27.6 45.8 80.3 83.8 71.4 100.0
Seychelles 51.2 51.1 99.9 41.5 94.0 89.0 98.8 100.0 100.0 100.0 100.0 100.0
Various versions of the hot-deck imputation method exist, using for example different
distance measures. Any of these approaches are preferred over the simple mean
substitution, which was originally selected for the missing values in the indicators of
this pillar.
Hot-deck imputation could also be used for the missing data in the Human
Development Pillar.
4. Internal consistency of the 2006 Index
A clear understanding of the methodology used to build the Index is crucial, as this
makes it possible to assess the feasibility and reliability of the Index. In other words,
can the scores and ranks of the 2006 Index of African Governance be reproduced by
other parties, given the data and information provided to the public? The answer is
“yes”. The relevant 2008 report (Rotberg and Gisselquist, 2008) provides enough
information for the public to reproduce the results. No specialist statistical knowledge
is required.
Indisputably, the “making of Index of African Governance” demands a sensitive
balance between simplifying governance issues and still providing sufficient detail to
detect characteristic differences. Such conflicting demands could finish by producing
a complex measure that is almost impossible to verify, particularly since governance
cannot be measured directly. It is therefore taken for granted that the Index cannot be
tested on the basis of ground truth.
Created with novaPDF Printer (www.novaPDF.com). Please register to remove this message.

18
Yet, in order to enable informed policy-making and to be useful as policy and
analytical assessment tool, the Index needs to be assessed with regard to its validity
and potential biases. The first question to be answered is:
Is the Index of African Governance internally sound and consistent,
from a conceptual and statistical point of view?
4.1. Statistical dimensionality of the framework
The major goal of this ex-ante analysis is to let the data speak: that is, to assess
whether the African Governance framework is supported by the collected data. First,
we assess whether the statistical dimensions within each pillar coincide with the
number of sub-pillars conceptualised. Second, we repeat this analysis at the sub-pillar
level and assess whether the 14 sub-pillars are consistently described by the selected
indicators.
For the first part of the analysis, we employ classical Principal Component Analysis
(PCA) for quantitative indicators and non-linear PCA for qualitative (or a mixed set
of) indicators. A brief methodological description of these techniques and their role in
assessing the Index of African Governance is given in the Annex (Box 1). The main
results are offered next. For statistical details see the Annex.
Created with novaPDF Printer (www.novaPDF.com). Please register to remove this message.

19
Safety and Security (two sub-pillars, seven indicators)
The presence of two sub-pillars is confirmed by the analysis (two Principal
Components have eigenvalues >1.0 and together account for more than 60% of
total variance). Yet the non-linear PCA would have assigned different weights
to the seven indicators than those assigned by the developers. This is usually
the case given that Principal Components Analysis is essentially based on the
correlation between indicators. Using weights and countries’ scores calculated
by the non-linear PCA it is possible to calculate an index sub-score for each
sub-pillar and an overall score for the pillar. The final check consists in
assessing the correspondence between the PCA based ranking and the original
Safety and Security ranking. They result to be very similar. Spearman rank
correlation coefficient is quite high at 0.93. The median impact is a two-
position change and only one country shifts ten positions or more (Eritrea: max
shift = 12).
In the qualitative variable “Ease of access to small arms and light weapons”
(scale: 1-best to 5-worst), no African country scores “1” or “2”. This is also
noted by Rotberg and Gisselquist (2008, p.56).
___________________________________________________________________
Rule of Law, Transparency, and Corruption (three sub-pillars, seven indicators)
The presence of three sub-pillars is confirmed by the analysis: three Principal
Components have eigenvalues>1.0 and all three account for more than 60% of
total variance. The non-linear PCA would have assigned different weights to
the seven indicators than those selected by the developers. Following the same
approach as for the previous pillar, the ranking based on weights and scores
retrieved from non-linear PCA appears to be similar to the original Rule of
Law, Transparency and Corruption ranking but with a caveat. The Spearman
rank correlation coefficient between the two is 0.77. The median impact is a
five-position change and ten countries shift ten positions or more (Central
Africa, Equatorial Guinea, Ethiopia, Gabon, Madagascar, Mali, Rwanda, San
Tome and Principe, Sierra Leone, Swaziland and Somalia: max shift 31
positions). These results suggest that a PCA-based ranking has a more
significant impact on the results of this pillar, as compared to the previous
pillar.
In the qualitative variable “Ratification of core international human rights
Created with novaPDF Printer (www.novaPDF.com). Please register to remove this message.

20
conventions” (scale: 0-worst to 7-best), no African country scored “0” or “1”.
Non-linear PCA also suggests that there is a scale redundancy in two
qualitative variables:
In the “Ratification of core international human rights conventions”
(scale: 0-worst to 7-best), scores 4 and 5 could be merged, also scores 6
and 7.
In the “Property Rights Index” (scale: 0-worst to 100-best, scores 50
and 70 could be merged).
___________________________________________________________________
Participation and Human Rights (two sub-pillars, eight indicators)
The presence of two sub-pillars is confirmed by the analysis, yet the non-linear
PCA would have assigned different weights to the eight indicators. The
Spearman rank correlation coefficient between the ranking obtained using non-
linear PCA and the original Participation and Human Rights ranking is 0.96.
The median impact is a two-position change and only two countries shift ten
positions or more (max shift = 13 for both Seychelles and Mali).
The non-linear PCA also suggests that there is a scale redundancy in two
qualitative variables.
In the “Respect for Physical Integrity Rights” (scale: 0-worst to 8-best),
scores 1, 2, 3, 4 could be merged, also scores 6, 7, 8.
In the “Respect for Civil Rights” (scale: 0-worst to 12-best), scores 4, 5,
6 could be merged, also 8 and 9, and 10 and 11.
___________________________________________________________________
Sustainable Economic Opportunity (four sub-pillars, twelve quantitative
indicators)
This pillar is particularly difficult to handle due to missing data. Missing values
were imputed using the hot-deck imputation method as detailed in Section 3.
With imputed missing data the approach followed for the other pillars is
meaningless since there missing data are assumed rare and sparse. With a
relevant percentage of missing data the statistical ranks for this pillar are
different from IAG baseline ranks, due to a combined effect of the imputation
method and the application of the dimensionality reduction techniques. The
Spearman rank correlation coefficient between the ranking obtained, after
estimating 17 missing values by hot-deck imputation, and the original
Sustainable Economic Opportunity ranking is 0.98. The median impact is a
Created with novaPDF Printer (www.novaPDF.com). Please register to remove this message.

21
one-position change and only one country shifts ten positions or more (Gambia:
max shift = eleven positions).
___________________________________________________________________
Human Development (three sub-pillars, 21 indicators)
Strictly according to Kaiser’s rule for dimension extraction, six dimensions turn
out to be relevant in the PCA (all indicators are quantitative). However,
dimensions 4, 5 and 6 account for less than 7.4% of total variance each, while
the first three dimensions cumulatively explain more than 60% of the total
variance. Thus, the three sub-pillar structure is confirmed. The Spearman rank
correlation coefficient between the ranking obtained using PCA and the
original Human Development ranking is 0.94. The median impact is a three-
position change and only three countries shift ten positions or more (Comoros,
Congo, Eritrea: max shift = 13).
___________________________________________________________________
Index of African Governance (five pillars, 14 sub-pillars)
Unlike the previous analyses at the indicator level, this analysis is conducted at
the sub-pillar level. Based on the most common rule-of-thumb, the Kaiser
criterion, there are four statistical dimensions in the set of 14 sub-pillars, which
account for about 73% of the variance of the original set. According to a more
conservative rule, the Joliffe criterion, the number of statistical dimensions is
five (explaining about 78% of the total variance), as was originally
conceptualized. These results confirm that the 14 sub-pillars are statistically
grouped into four or five dimensions and this supports the original choice of the
developers to distribute the 14 sub-pillars between five main pillars of the
governance framework.
Although the presence of five (or four) main pillars is confirmed by the
analysis, PCA would have assigned different weights to the 14 sub-pillars than
those assigned by the developers. The Spearman rank correlation coefficient
between the ranking obtained using PCA and the original Index ranking is 0.97.
The median impact is a mere one-position change and only one country shifts
more than ten positions (Swaziland: max shift = 11 positions).
The analysis detailed so far for each pillar and for the overall Index is not intended to
present an alternative computational method for the development of the Index. In fact,
it is evident that the developers wanted to keep the Index of African Governance as
simple and transparent as possible, with particular focus on the “[…] ease with which
Created with novaPDF Printer (www.novaPDF.com). Please register to remove this message.

22
the results could be understood by non-statisticians” (Rotberg and Gisselquist, 2008,
p. 21). While more sophisticated techniques may be statistically sounder, they may
also be too complex and lacking in transparency for end-users of the Index.
The aim of the statistical analysis was rather to confirm the conceptual framework and
identify eventual pitfalls. In fact, some recommendations were derived on the merging
of certain categorical values in four qualitative indicators: Ratification of Core
International Human Rights Conventions, Property Rights Index, Respect for Physical
Integrity Rights and Respect for Civil Rights. It was also confirmed that the PCA
results and the conceptual framework were consistent regarding the number of main
pillars and sub-pillars within each pillar.
The impact of choosing an equal weighting within each pillar versus a (linear or non-
linear) PCA weighting to estimate the pillar ranking was also estimated. In the case of
four of the five pillars, the impact was not particularly important. Thus, despite its
computational simplicity, the original method of calculating the Index of African
Governance is supported by more complex statistical analysis. Only the pillar on
Sustainable Economic Opportunity needs to be treated with caution due to missing
data, in particular on the Environmental Sensitivity Index. As aforementioned
(Section. 3), the approach taken by the developers to estimate the missing data by
mean substitution is not particularly recommended and more sophisticated missing
data treatment is discusses and applied.
In the following sections, the analysis is carried out with the values imputed by the
developers, unless otherwise indicated.
4.2. Associations between the Index and its components
The simplest way to study internal consistency in the framework of the Index of
African Governance is to perform simple correlation analysis between the Index and
its components. We will discuss next the association between the Index scores and the
scores obtained at all three levels (pillars, sub-pillars and indicators) of the
framework.
A simple correlation between the 2006 Index scores and the pillar scores reveals
positive and strong associations, i.e. greater than 0.69 (Table 3). The Index scores
have the highest association with the Rule of Law, Transparency, and Corruption
scores ( 89.0r ), followed by Participation and Human Rights and Human
Created with novaPDF Printer (www.novaPDF.com). Please register to remove this message.

23
Development ( 80.0r ). Relationships among the pillars themselves vary. The most
closely associated are the Sustainable Economic Opportunity and Human
Development pillars ( 83.0r ). The least associated pillars are “Safety and Security”
and “Sustainable Economic Opportunity”, whose association appears to be random.
These results imply that the five pillars may account for different, yet partially
overlapping and not entirely separable, aspects of African governance. The fact that
all correlation coefficients are positive shows that all five pillars and the overall Index
point in the same direction, which is generally desirable when designing a composite
indicator, unless there is a theoretical justification for the presence of trade-offs
between the main pillars of a composite indicator.
Table 3. Pearson’s correlation coefficients for the CLI and its four pillars
Sa
fety
and
Se
curit
y
Rule
of L
aw,
Tran
spar
ency
, an
d C
orru
ptio
n
Parti
cipa
tion
and
Hum
an
Righ
ts
Susta
inab
le
Econ
omic
O
ppor
tuni
ty
Hum
an
Dev
elop
men
t
Index of African Governance 0.69 0.89 0.80 0.73 0.81 Rule of Law, Transparency and Corruption 0.52 Participation and Human Rights 0.50 0.59 Sustainable Economic Opportunity 0.24* 0.69 0.36 Human Development 0.39 0.75 0.42 0.83
*Coefficient not significant at 5% level ( 48n ).
Table 4. Pearson’s correlation coefficients between the Index and its sub-pillars Safety and Security Rule of Law, Transparency, and
Corruption
National Security 0.75 Legal Norms 0.70 Public Safety 0.49 Judicial Independence 0.73 Corruption 0.83
Participation and Human Rights
Sustainable Economic Opportunity
Participation 0.71 Wealth Creation 0.35 Civil and Political Rights 0.80 Financial Integrity 0.34 Arteries of Commerce 0.62
Environmental Sensitivity (EPI) 0.48 Human Development
Poverty 0.47 Health and Sanitation 0.75 Education 0.68 All coefficients are significant (p < 0.01, n = 48).
Correlation analysis between the Index and its 14 sub-pillars reveals that all
correlations are positive and significant at the 0.01 level (Table 4). The Index scores
Created with novaPDF Printer (www.novaPDF.com). Please register to remove this message.

24
have high associations with the majority of the sub-pillars (>0.70). Fair to moderate
associations are found between the Index and Public Safety, Wealth Creation,
Financial Integrity, Environmental Sensitivity, and Poverty. The pair-wise
correlations among the sub-pillars are on average low ( 36.0r ), other than for the
two sub-pillars Arteries of Commerce and Health Sanitation ( 75.0r ), which belong
to two different pillars, namely Sustainable Economic Opportunity and Human
development, respectively.
Correlation analysis between the Index and its 57 underlying indicators reveals that all
correlation coefficients have the expected sign (Table 5). The same holds for the
associations between the main pillars and their respective indicators. This is a
desirable feature of a composite indicator, and is not easily obtained. The Index scores
are strongly associated ( 70.0r ) with Judicial Independence using Freedom House's
"Rule of Law", Public Sector Corruption, Respect for Civil Rights, and Property
Rights Index. Of the 57 indicators included in the framework, there are nine indicators
in three of the five pillars that appear to be randomly associated with either the overall
Index and/or with the pillar they belong to. These indicators are:
Number of Days to Settle a Contract Dispute in the Rule of Law, Transparency and
Corruption pillar;
GDP per capita growth, Inflation, Deficits/Surplus as a % of GDP, and Business
Environment in the Sustainable Economic Opportunity pillar;
Inequality (Gini Index), HIV Prevalence, Incidence of Tuberculosis, and
Progression to Secondary School in the Human Development pillar.
The random association between the Index scores (or pillar scores) and these nine
indicators should not be taken to mean that these indicators do not describe important
governance issues. For example, the Gini index is often considered to be a key
governmental objective, particularly in developing countries. However, these random
associations imply that even if some African countries improve their Gini index
scores, this improvement will not lead to an overall improvement in their Human
Development score (the pillar to which Gini index belongs) or in their overall Index
score. Some authors (e.g. Booysen, 2002) recommend that a weak correlation
between a sub-component and an index should result in the exclusion of the
respective component from the framework. An eventual revision of the framework
could take this result into consideration and eventually streamline the 57 indicators to
48, without any significant impact on the performance assessment of the countries
under study.
Created with novaPDF Printer (www.novaPDF.com). Please register to remove this message.

25
Table 5. Pearson’s correlation coefficients between the Index/pillars and the underlying indicators
Pillar Sub-pillar Indicator Desired direction
Correlation with Index
Correlation with Pillar
Government Involvement in Armed Conflicts - -0.381 -0.485 Number of Battle-Deaths - -0.520 -0.601 Number of Civilian Deaths - -0.305 -0.510 Refugees and Asylum Seekers - -0.515 -0.501 Internally-Displaced People - -0.460 -0.628
National Security
Ease of Access to Small Arms and Light Weapons - -0.653 -0.626
Safe
ty an
d Se
curit
y Public Safety Violent Crime (Homicides) - -0.485 -0.903
Ratification of Core International Human Rights Conventions + 0.210 0.343 International Sanctions - -0.495 -0.600
Ratification of Critical Legal Norms
Property Rights Index + 0.721 0.811 Judicial Independence + 0.849 0.766 Efficiency of the Courts - -0.340 -0.488
Judicial Independence and Efficiency Number of Days to Settle a Contract Dispute - -0.079* -0.265*
Rule
of La
w,
Tran
spar
ency
, and
Co
rrupti
on
Corruption Public Sector Corruption + 0.834 0.879 Free and Fair Executive Elections + 0.681 0.886 Opposition Participation in Executive Elections + 0.629 0.808 Free and Fair Legislative Elections + 0.604 0.849
Participation in Elections
Opposition Participation in Legislative Elections + 0.551 0.778 Respect for Physical Integrity Rights + 0.662 0.658 Respect for Civil Rights + 0.720 0.824 Press Freedom - -0.518 -0.687
Partic
ipatio
n and
Hu
man R
ights
Respect for Civil and Political Rights
Women's Rights + 0.634 0.553 GDP per capita based on PPP + 0.341 0.640 Wealth Creation GDP per capita growth (annual %) + 0.021* -0.018* Inflation - -0.089* -0.049* Deficits/ Surplus as a % of GDP + -0.097* -0.104* Reliability of Financial Institutions (Contract Intensive Money) + 0.528 0.626
Macroeconomic Stability and Financial Integrity
Business Environment (Number of Days to Start a Business) - -0.147* -0.159* Density of paved road network per 1,000 people (km) + 0.586 0.662 Electricity Installed Capacity per Capita (kW) + 0.508 0.708 Phone Subscribers per 100 Inhabitants + 0.628 0.864 Computer Usage per 100 Inhabitants + 0.492 0.713
Arteries of Commerce
Internet Usage per 100 Inhabitants + 0.572 0.708
Susta
inable
Eco
nomi
c Opp
ortu
nity
(1/5)
Environ. Sensitivity Environmental Performance Index + 0.593 0.862 Poverty Rate at $1 per person per day - -0.445 -0.681 Poverty Rate at National Poverty Line - -0.598 -0.812
Poverty
Inequality (GINI Index) - 0.077* -0.171* Life Expectancy at Birth (years) + 0.510 0.612 Child Mortality per 1,000 - -0.620 -0.802 Maternal Mortality (per 100,000 live births) - -0.523 -0.729 Under-nourishment (% of population) - -0.510 -0.579 Immunization, measles (% of children ages 12-23 months) + 0.526 0.573 Immunization, DPT (% of children ages 12-23 months) + 0.508 0.600 HIV Prevalence - 0.251* 0.192* Incidence of Tuberculosis (per 100,000 people) - -0.032* -0.046* Physicians per 100,000 People + 0.574 0.688 Nursing and Midwifery Personnel per 100,000 People + 0.488 0.594
Health and Sanitation
Access to Drinking Water (% of overall population) + 0.657 0.671 Adult Literacy Rate + 0.516 0.580 Adult Literacy Rate, Female + 0.502 0.570 Primary School Completion Rate (% of relevant age group) + 0.628 0.658 Primary Completion Rate, Female (% of relevant age group) + 0.681 0.688 Pupil-Teacher Ratio, Primary - -0.394 -0.488 Progression to Secondary School (%) + 0.225* 0.470
Hum
an D
evelo
pmen
t (1
/5)
Education
Ratio of Girls to Boys in Primary and Second-ary Educ-ation (%)
+ 0.682 0.645 Coefficient not significant (p > 0.05, n = 48).
Created with novaPDF Printer (www.novaPDF.com). Please register to remove this message.

26
4.3. Impact assessment of the sub-pillars on the Index results
Internal consistency in the African Governance framework can also be studied by analysing the
contribution of each of the 14 sub-pillars (or the five pillars) to the variance of the Index scores.
The contribution of each of the 14 sub-pillars )14,...,1( iiX to the variance of the Index scores
follows directly from the formula for the variance of a sum. If the sub-pillar scores are
multiplied by the corresponding set of weights )14,...,1( iwi , and 2i is the variance
associated with each sub-pillar iX , then the variance of the Index is given by
),(cov14
,1
14
1
14
1
222ki
kii kki
iii XXwww
(2)
While the iw ’s in Eq. (2) constitute the ‘nominal weights’, the ‘effective weight’ of each
indicator, according to Stanley and Wang (1968), is given by the ratio
2
14
,1
22 ),cov(
iki
kikiii XXwww
(3)
In other words, the effective weight of each sub-pillar represents that part of the variance of the
Index scores that can be attributed to the relevant sub-pillar. Eq. (3) shows that although the
nominal weights do influence the effective weights, they are generally not proportional to them.
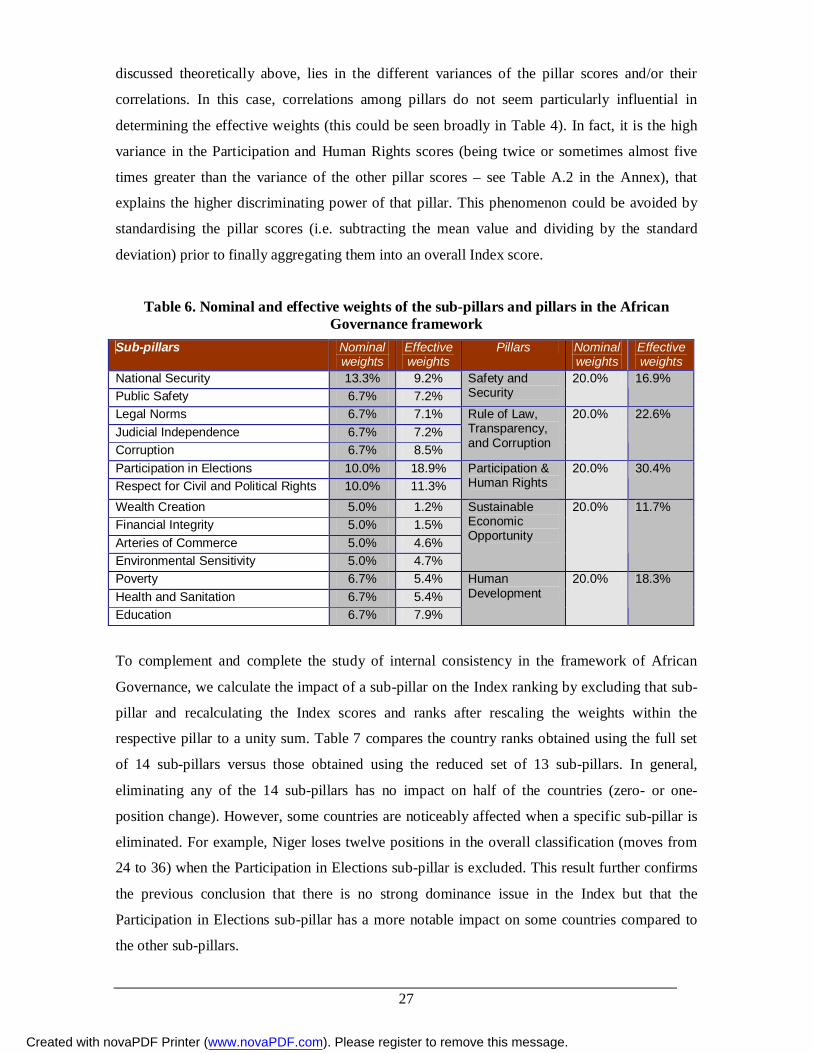
Table 6 presents the nominal and the effective weights for the 14 sub-pillars and five pillars
underlying the framework. Overall, there is no dominance issue, neither at the sub-pillar nor at
the pillar level, and the effective weights are consistent with the nominal weights assigned to
them. Some exceptions are noted: the Participation in Elections sub-pillar weighs 10%, but
accounts for about 18% of the variation of the Index scores; that is, it has a relatively high
discriminating power in the performance of the countries under study. On the other hand, the
Wealth Creation and Financial Integrity sub-pillars each weigh 5% in the overall Index, but their
effective weights are much lower (less than 1.5%), implying a relatively low discriminating
power. At the pillar level, Participation and Human Rights has a much higher effective weight
(30.4%) compared to the 20% nominal weight, while the opposite is true for the pillar on
Sustainable Economic Opportunity (effective weight = 11.7%, nominal weight = 20%). This
result suggests that the Participation and Human Rights pillar has a higher discriminating power
than the other four pillars, despite the equal weights assigned to the five. The explanation, as
Created with novaPDF Printer (www.novaPDF.com). Please register to remove this message.
27
discussed theoretically above, lies in the different variances of the pillar scores and/or their
correlations. In this case, correlations among pillars do not seem particularly influential in
determining the effective weights (this could be seen broadly in Table 4). In fact, it is the high
variance in the Participation and Human Rights scores (being twice or sometimes almost five
times greater than the variance of the other pillar scores – see Table A.2 in the Annex), that
explains the higher discriminating power of that pillar. This phenomenon could be avoided by
standardising the pillar scores (i.e. subtracting the mean value and dividing by the standard
deviation) prior to finally aggregating them into an overall Index score.
Table 6. Nominal and effective weights of the sub-pillars and pillars in the African Governance framework
Sub-pillars Nominal weights
Effective weights
Pillars Nominal weights
Effective weights
National Security 13.3% 9.2% Public Safety 6.7% 7.2%
Safety and Security
20.0% 16.9%
Legal Norms 6.7% 7.1% Judicial Independence 6.7% 7.2% Corruption 6.7% 8.5%
Rule of Law, Transparency, and Corruption
20.0% 22.6%
Participation in Elections 10.0% 18.9% Respect for Civil and Political Rights 10.0% 11.3%
Participation & Human Rights
20.0% 30.4%
Wealth Creation 5.0% 1.2% Financial Integrity 5.0% 1.5% Arteries of Commerce 5.0% 4.6% Environmental Sensitivity 5.0% 4.7%
Sustainable Economic Opportunity
20.0% 11.7%
Poverty 6.7% 5.4% Health and Sanitation 6.7% 5.4% Education 6.7% 7.9%
Human Development
20.0% 18.3%
To complement and complete the study of internal consistency in the framework of African
Governance, we calculate the impact of a sub-pillar on the Index ranking by excluding that sub-
pillar and recalculating the Index scores and ranks after rescaling the weights within the
respective pillar to a unity sum. Table 7 compares the country ranks obtained using the full set
of 14 sub-pillars versus those obtained using the reduced set of 13 sub-pillars. In general,
eliminating any of the 14 sub-pillars has no impact on half of the countries (zero- or one-
position change). However, some countries are noticeably affected when a specific sub-pillar is
eliminated. For example, Niger loses twelve positions in the overall classification (moves from
24 to 36) when the Participation in Elections sub-pillar is excluded. This result further confirms
the previous conclusion that there is no strong dominance issue in the Index but that the
Participation in Elections sub-pillar has a more notable impact on some countries compared to
the other sub-pillars.
Created with novaPDF Printer (www.novaPDF.com). Please register to remove this message.

28
Table 7. Impact of the elimination of one sub-pillar at a time on the Index country ranks Rank shift (across 48 countries)
Pillar
Excluded sub-pillar Median
Max (positive: improvement in the overall rank or negative)
National Security 0 5 Burundi Safety and Security Public Safety 1 6 Ethiopia (-) Legal Norms 1 6 Sierra Leone Judicial Independence 1 6 Liberia Rule of Law, Transp.
& Corruption Corruption 0 4 Swaziland (-) Participation 1 12 Niger (-) Participation and
Human Rights Civil and Political Rights 1 8 Guinea Bissau Wealth Creation 0 4 Equatorial Guinea (-) Financial Integrity 0 2 Gambia, Guinea Bissau, Niger (-), Zimbabwe Arteries of Commerce 0 2 Burundi, Ghana
Sustainable Economic Opportunity
Environmental Sensitivity 1 5 Kenya (-), Sierra Leone Poverty 1 8 Ethiopia (-) Health and Sanitation 0 2 Mauritania (-), Swaziland, Zambia Human Development Education 1 6 Kenya (-)
Created with novaPDF Printer (www.novaPDF.com). Please register to remove this message.
29
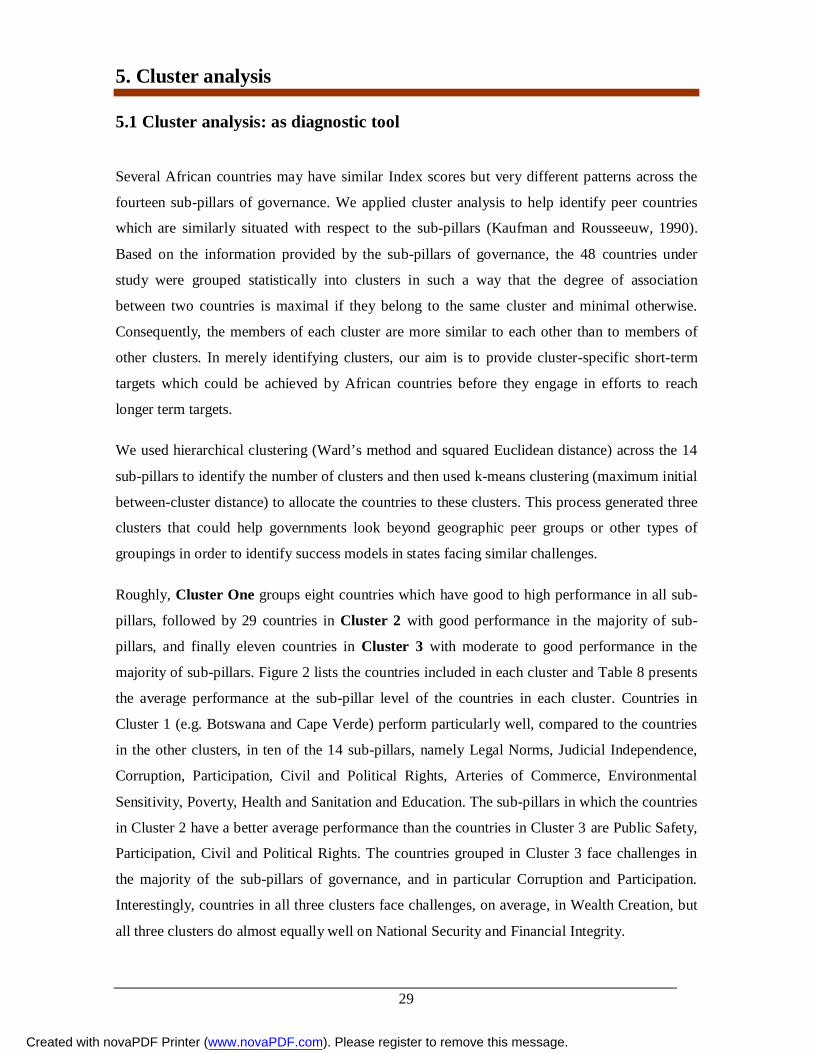
5. Cluster analysis
5.1 Cluster analysis: as diagnostic tool
Several African countries may have similar Index scores but very different patterns across the
fourteen sub-pillars of governance. We applied cluster analysis to help identify peer countries
which are similarly situated with respect to the sub-pillars (Kaufman and Rousseeuw, 1990).
Based on the information provided by the sub-pillars of governance, the 48 countries under
study were grouped statistically into clusters in such a way that the degree of association
between two countries is maximal if they belong to the same cluster and minimal otherwise.
Consequently, the members of each cluster are more similar to each other than to members of
other clusters. In merely identifying clusters, our aim is to provide cluster-specific short-term
targets which could be achieved by African countries before they engage in efforts to reach
longer term targets.
We used hierarchical clustering (Ward’s method and squared Euclidean distance) across the 14
sub-pillars to identify the number of clusters and then used k-means clustering (maximum initial
between-cluster distance) to allocate the countries to these clusters. This process generated three
clusters that could help governments look beyond geographic peer groups or other types of
groupings in order to identify success models in states facing similar challenges.
Roughly, Cluster One groups eight countries which have good to high performance in all sub-
pillars, followed by 29 countries in Cluster 2 with good performance in the majority of sub-
pillars, and finally eleven countries in Cluster 3 with moderate to good performance in the
majority of sub-pillars. Figure 2 lists the countries included in each cluster and Table 8 presents
the average performance at the sub-pillar level of the countries in each cluster. Countries in
Cluster 1 (e.g. Botswana and Cape Verde) perform particularly well, compared to the countries
in the other clusters, in ten of the 14 sub-pillars, namely Legal Norms, Judicial Independence,
Corruption, Participation, Civil and Political Rights, Arteries of Commerce, Environmental
Sensitivity, Poverty, Health and Sanitation and Education. The sub-pillars in which the countries
in Cluster 2 have a better average performance than the countries in Cluster 3 are Public Safety,
Participation, Civil and Political Rights. The countries grouped in Cluster 3 face challenges in
the majority of the sub-pillars of governance, and in particular Corruption and Participation.
Interestingly, countries in all three clusters face challenges, on average, in Wealth Creation, but
all three clusters do almost equally well on National Security and Financial Integrity.
Created with novaPDF Printer (www.novaPDF.com). Please register to remove this message.

30
Figure 2. Clusters of countries (alphabetical order) based on the 14 sub-pillars of African Governance
Cluster 1
(n=8)
Cluster 2
(n=29)
Cluster 3
(n=11)
Botswana Cape Verde Gabon Ghana Mauritius Namibia Seychelles South Africa
Benin Burkina Faso Burundi Cameroon Central Africa Comoros Congo Djibouti Ethiopia Gambia Guinea-Bissau Kenya Lesotho Liberia Madagascar
Malawi Mali Mozambique Niger Nigeria Rwanda Sao Tome and Principe Senegal Sierra Leone Tanzania Togo Uganda Zambia Zimbabwe
Angola Chad Congo, Dem. Rep. Cote d'Ivoire Equatorial Guinea Eritrea Guinea Mauritania Somalia Sudan Swaziland
Table 8. Cluster means across the 14 sub-pillars of African Governance
We next calculated the average pillar score and the average Index score across the members of
each cluster (Figure 3). Countries in Cluster 1 have, on average, the highest scores in the five
pillars of Governance and in the overall Index. The countries in Cluster 2 follow, with average
scores slightly lower than those of Cluster 1. Lower scores, on average, are achieved by the
countries in Cluster 3. An interesting feature of Figure 3 is the clear splitting of the average
scores per cluster group of the African countries under study across the five pillars of
Governance and the overall Index, even though this type of (aggregated) information did not
enter the cluster analysis. Recall that cluster analysis was carried out based on the 14 sub-pillars
0
20
40
60
80
100
Nat
iona
lSe
curit
y
Publ
ic S
afet
y
Lega
l Nor
ms
Judi
cial
Inde
pend
ence
Cor
rupt
ion
Parti
cipa
tion
Civ
il and
Politi
cal R
ight
s W
ealth
Cre
atio
n Fi
nanc
ial
Inte
grity
Ar
terie
s of
Com
mer
ce
Envi
ronm
enta
lSe
nsitiv
ity
Pove
rty
Hea
lth a
ndSa
nita
tion
Educ
atio
n
Cluster 2 Cluster 3 Cluster 1
Created with novaPDF Printer (www.novaPDF.com). Please register to remove this message.

31
of Governance, without any further assumption on the pillar structure, weighting or aggregation
method. This outcome reveals that the 14 sub-pillars of Governance are able to distinguish
between the performance of African countries on the five main aspects of governance (Safety
and Security; Rule of Law, Transparency, and Corruption; Participation and Human Rights;
Sustainable Economic Opportunity; Human Development) and that the overall Index reflects,
without distortion, the information content in the dataset.
Figure 3. Average values per cluster group: pillars and overall Index
0102030405060708090
Saf
ety
and
Sec
urity
Rul
e of
Law
,Tr
ansp
aren
cy,
and
Cor
rupt
ion
Par
ticip
atio
nan
d H
uman
Rig
hts
Sus
tain
able
Eco
nom
icO
ppor
tuni
ty
Hum
anD
evel
opm
ent
Inde
x of
Gov
erna
nce
Cluster 2 Cluster 3 Cluster 1
5.2 Cluster analysis: setting short-term targets It can further be concluded that, given the diverse aspects of governance in African countries, it
is unlikely that all countries could reach the targets for the sub-pillars of governance. With this
in mind, the results of the cluster analysis could be used to set short-term targets for immediate
pursuit (Table 9). To give an example, countries that belong to Cluster 3 should first attempt to
reach a Public Safety score of around 75.0, which is the best score achieved among them
(=short-term target) and gradually increase efforts to reach the long-term target of 100.0
Created with novaPDF Printer (www.novaPDF.com). Please register to remove this message.

32
Table 9. Short-term and long-term targets for the sub-pillars of Governance
Short-term targets for each cluster group of countries (max value in the cluster)
Long-term targets
(max value in the
dataset) Cluster 1
(leaders) Cluster 2 (middle)
Cluster 3 (laggards)
Entire dataset
8n 29n 11n 48n National Security 100.0 100.0 98.0 100.0 Safety and Security Public Safety 100.0 100.0 75.0 100.0 Legal Norms 100.0 88.9 83.3 100.0 Judicial Independence 88.0 74.6 72.3 88.0 Rule of Law, Transp.
& Corruption Corruption 88.0 52.0 46.0 88.0 Participation 100.0 100.0 25.0 100.0 Participation and
Human Rights Civil and Political Rights 84.3 79.4 61.7 84.3 Wealth Creation 51.2 32.3 57.2 57.2 Financial Integrity 84.7 89.9 86.8 89.9 Arteries of Commerce 99.8 21.9 16.9 99.8
Sustainable Economic Opportunity
Environmental Sensitivity 100.0 78.5 67.0 100.0 Poverty 91.0 72.7 64.4 91.0 Health and Sanitation 96.5 69.7 61.4 96.5 Human Development Education 97.3 81.7 75.1 97.3
Created with novaPDF Printer (www.novaPDF.com). Please register to remove this message.

33
6. Uncertainty and sensitivity analysis
The creativity evident in the work of composite indicator developers is not only a response to
the multiple demands of the user/stakeholder community but also the result of disagreement
within the research community on which indicators influence a particular phenomenon, and by
how much (Cutter et al., 2003). Notwithstanding recent attempts to establish best practice in
composite indicator construction (OECD, 2008), ”there is no recipe for building composite
indicators that is at the same time universally applicable and sufficiently detailed” (Cherchye et
al., 2008). This may be due in part to the ambivalent role of composite indicators in both
analysis and advocacy (Saltelli, 2007). As the boundaries between the two functions are often
blurred, controversy may be unavoidable when discussing these measures.
When building an index to capture governance in Africa, it is necessary to take stock of existing
methodologies in order to avoid eventual skewness in the assessment and decision-making. By
acknowledging the variety of methodological assumptions involved in the development of an
index, one can determine whether the main results change substantially when the main
assumptions are varied over a reasonable range of possibilities (Saisana et al., 2005; Saisana and
Tarantola, 2002; Saltelli et al., 2000; Saltelli et al., 2008). The advantages offered by
considering different scenarios to build the Index could be: to gauge the robustness of the Index
scores and ranks, to increase its transparency, to identify those countries whose performance
improves or deteriorates under certain assumptions, and to help frame the debate on the use of
the results for policy making.
The main question to be addressed here is:
What scenarios could have been used to build the Index of African Governance and how
do the results of these scenarios compare to the 2006 results?
We show below how uncertainty analysis (UA) can contribute to such a reflection. UA involves
assessing the impact of alternative models on the country ranks. Each model is a different
composite indicator in which the choice of weights and aggregation method have been varied
within a plausible range. This approach helps to avert the criticism frequently dealt to composite
measures or rankings, namely that they are presented as if they had been calculated under
conditions of certainty (while this is rarely the case) and then taken at face value by end-users
(Saisana et al., 2005; Saisana and Saltelli, 2008). The objective of UA is not to establish the
truth or to verify whether the Index of African Governance is a legitimate model to measure
governance in Africa, but rather to test whether the ranking itself and/or its associated inferences
Created with novaPDF Printer (www.novaPDF.com). Please register to remove this message.

34
are robust or volatile with respect to changes in the methodological assumptions within a
plausible and legitimate range. Uncertainty (or robustness) analysis as described by the OECD
(2008) has been already used for the assessment of several composite indicators, such as the
Composite Learning Index (Saisana, 2008), the Environmental Performance Index (Saisana and
Saltelli, 2008), the Alcohol Policy Index (Brand et al., 2007), the Knowledge Economy Index
(Saisana and Munda, 2008) and the University Ranking Systems (Saisana and D’Hombres,
2008).
6.1 Multi-modelling approach
A multi-modelling approach was applied in the present work for the purpose of robustness
analysis. It consists of exploring, via a saturated sampling, plausible combinations (150
simulations in total) of three main assumptions needed to build the index:
(a) the weights attached to the indicators;
(b) the aggregation rule;
(c) the number of sub-pillars included.
(a) Assumption on the weighting scheme: In the Index of African Governance an equal
weighting scheme was used within and across the five pillars. Although this is a legitimate
choice, it is not unique and it is hard to find a theoretical justification for it. We tested three
alternative and legitimate weighting schemes: factor analysis derived weights (upon factor
rotation and squaring of the factor loadings, as described in Nicoletti et al., 2000) across all 14
sub-pillars; equal weighting across all 14 sub-pillars; and “country-specific weighting”. The last
alternative, also known as Data Envelopment Analysis, involves choosing the set of weights for
each country that maximizes that country’s performance in the overall Index relative to all other
countries. We employed the cross-efficiency DEA, first developed by Sexton et al. (1986), who
introduced the concept of ranking to DEA. The cross-efficiency method simply calculates the
efficiency score of each country n times (= number of countries), using the optimal weights for
all countries. The average efficiency score is usually then used to rank countries. Practitioners
use this approach to discourage stakeholders from rejecting a ranking on the grounds that a
given weighting scheme does not reflect their priorities (Cherchye et al., 2008).
(b) Assumption on the aggregation rule: The Index rankings are built using a weighted
arithmetic average (a linear aggregation rule) of the 14 sub-pillars (Eq. (4)). Decision theory
practitioners have challenged aggregations based on additive models because of inherent
Created with novaPDF Printer (www.novaPDF.com). Please register to remove this message.

35
theoretical inconsistencies (Munda, 2008) and the fully compensatory nature of linear
aggregation, in which an x% increase in one indicator can offset an x% decrease in another. We
applied two alternative approaches for the aggregation function: a geometric weighted average
(Eq. (5)) and a multi-criteria method. In the case of the geometric averaging, we linearly
transformed the sub-pillar scores into a 1-100 scale to allow for the proper use of the geometric
aggregation. The multi-criteria literature offers a plethora of methods (Kemeny, 1959; Munda,
2008; Young, 1978). We selected a method suggested by Brand et al. (2007) (Eq. (6)) for two
main reasons: first, it can deal with a large number of countries, unlike the other currently
available Condorcet–type methods (Condorcet, 1785); and second, it can deal with ties in
indicator scores and also incorporate information on weights, unlike the Borda method (Borda,
1784).
Weighted Arithmetic Average score:
n
iijij xwy
1
(4)
Weighted Geometric Average score:
n
i
wijj
ixy1
(5)
Borda adjusted score: i
n
i
ijijj w
kmy
)2
(1
(6)
jy : composite indicator score for country j , iw : weight attached to sub-pillar i , ijx : sub-pillar
score for country j on sub-pillar i , ijm : number of countries that have weaker performance than
country j relative to sub-pillar i ; ijk : number of countries with equivalent performance to
country j relative to sub-pillar i .
(c) Assumption on the sub-pillars: We have either kept all 14 sub-pillars or in some cases
excluded one at a time. This statistical procedure is a tool to test the robustness of inference and
should not be seen as a disturbance of the framework. In fact it makes it possible to assess the
impact of assigning a zero weight to a sub-pillar, combined with the other assumptions on the
weighting method and aggregation rule. Eliminating a sub-pillar from the framework can also be
seen as “tuning” the ranking in favour of countries which have a comparative disadvantage on
that sub-pillar (Grupp and Mogee, 2004). The assumption discussed so far should be seen as a
minimal analysis of robustness, as suggested in econometrics by Kennedy (2007) and Leamer
Created with novaPDF Printer (www.novaPDF.com). Please register to remove this message.

36
(1990). We contend that an actual multi-stakeholder debate on the construction of this kind of
measure would result in a plurality of alternative assumptions far exceeding those adopted here.
6.2 Uncertainty analysis results
The results shown in Table 10 are the frequencies of a country’s Index rank calculated across all
150 scenarios. Such a frequency matrix synthesizes the ranking while making the uncertainty
explicit. It is beyond doubt that Mauritius and Seychelles are the top two countries. In general
the Index results are very stable up to Benin, after which the impact of the assumptions becomes
more evident. For example, Rwanda could be ranked between the 11th and 28th position with
almost equal probability. However, we acknowledge that we have considered quite diverse
scenarios and a more prudent approach would be to assess whether on average the 2006 Index
rank is similar to the median rank across all 150 simulated scenarios.
Created with novaPDF Printer (www.novaPDF.com). Please register to remove this message.
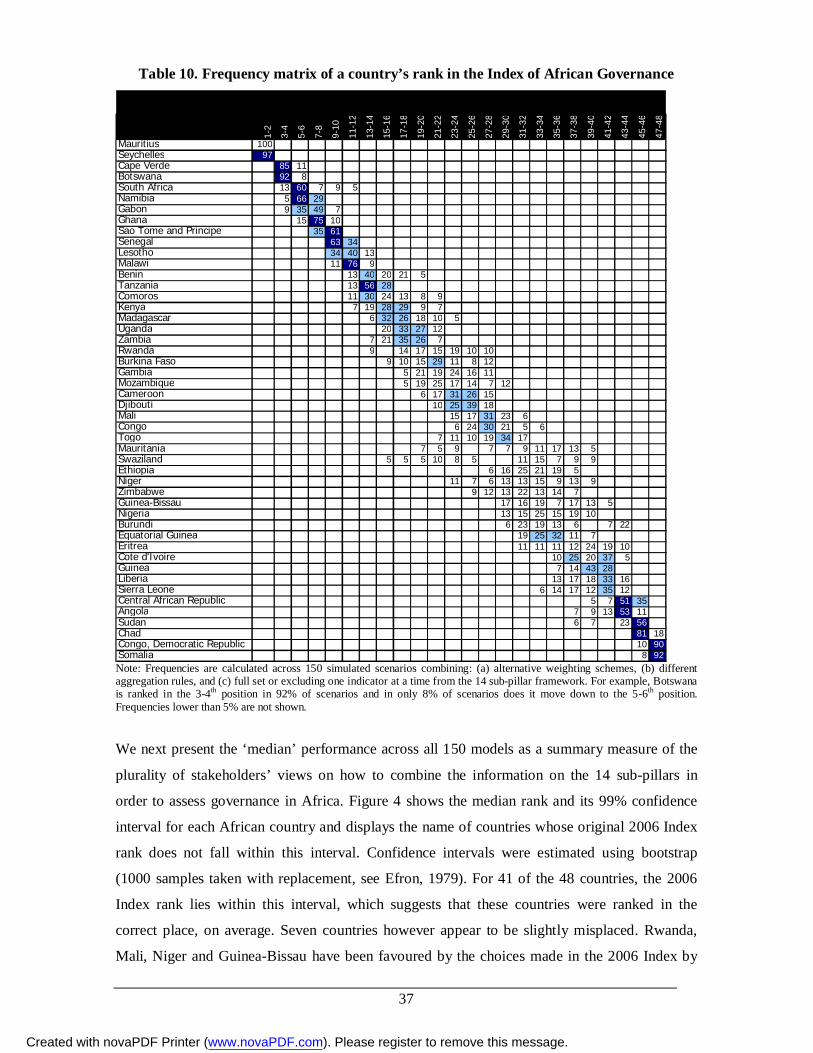
37
Table 10. Frequency matrix of a country’s rank in the Index of African Governance
1-2
3-4
5-6
7-8
9-10
11-1
2
13-1
4
15-1
6
17-1
8
19-2
0
21-2
2
23-2
4
25-2
6
27-2
8
29-3
0
31-3
2
33-3
4
35-3
6
37-3
8
39-4
0
41-4
2
43-4
4
45-4
6
47-4
8
Mauritius 100 0 0 0 0 0 0 0 0 0 0 0 0 0 0 0 0 0 0 0 0 0 0 0Seychelles 97 3 0 0 0 0 0 0 0 0 0 0 0 0 0 0 0 0 0 0 0 0 0 0Cape Verde 4 85 11 0 0 0 0 0 0 0 0 0 0 0 0 0 0 0 0 0 0 0 0 0Botswana 0 92 8 0 0 0 0 0 0 0 0 0 0 0 0 0 0 0 0 0 0 0 0 0South Africa 0 13 60 7 9 5 2 1 1 1 0 0 0 0 0 0 0 0 0 0 0 0 0 0Namibia 0 5 66 29 0 0 0 0 0 0 0 0 0 0 0 0 0 0 0 0 0 0 0 0Gabon 0 9 35 49 7 0 0 0 0 0 0 0 0 0 0 0 0 0 0 0 0 0 0 0Ghana 0 1 15 75 10 0 0 0 0 0 0 0 0 0 0 0 0 0 0 0 0 0 0 0Sao Tome and Principe 0 0 3 35 61 1 0 0 0 0 0 0 0 0 0 0 0 0 0 0 0 0 0 0Senegal 0 0 0 1 63 34 2 0 0 0 0 0 0 0 0 0 0 0 0 0 0 0 0 0Lesotho 0 0 0 2 34 40 13 3 4 2 2 0 0 0 0 0 0 0 0 0 0 0 0 0Malawi 0 0 0 0 11 76 9 3 1 0 0 0 0 0 0 0 0 0 0 0 0 0 0 0Benin 0 0 0 0 1 13 40 20 21 5 1 0 0 0 0 0 0 0 0 0 0 0 0 0Tanzania 0 0 0 0 0 13 56 28 3 0 0 0 0 0 0 0 0 0 0 0 0 0 0 0Comoros 0 0 0 0 0 11 30 24 13 8 9 4 1 0 0 0 0 0 0 0 0 0 0 0Kenya 0 0 0 0 0 7 19 28 29 9 7 2 0 0 0 0 0 0 0 0 0 0 0 0Madagascar 0 0 0 0 0 0 6 32 26 18 10 5 3 1 0 0 0 0 0 0 0 0 0 0Uganda 0 0 0 0 0 0 3 20 33 27 12 4 0 0 0 0 0 0 0 0 0 0 0 0Zambia 0 0 0 0 0 3 7 21 35 26 7 1 0 0 0 0 0 0 0 0 0 0 0 0Rwanda 0 0 0 0 0 0 9 3 14 17 15 19 10 10 3 0 0 0 0 0 0 0 0 0Burkina Faso 0 0 0 0 0 0 1 9 10 15 29 11 8 12 4 1 0 0 0 0 0 0 0 0Gambia 0 0 0 0 0 0 1 1 5 21 19 24 16 11 3 0 0 0 0 0 0 0 0 0Mozambique 0 0 0 0 0 0 0 1 5 19 25 17 14 7 12 1 0 0 0 0 0 0 0 0Cameroon 0 0 0 0 0 0 0 0 1 6 17 31 26 15 4 0 0 0 0 0 0 0 0 0Djibouti 0 0 0 0 0 0 0 0 1 3 10 25 39 18 3 0 0 0 0 0 0 0 0 0Mali 0 0 0 0 0 0 0 0 0 0 4 15 17 31 23 6 2 2 0 0 0 0 0 0Congo 0 0 0 0 0 0 0 0 0 1 4 6 24 30 21 5 6 2 0 0 0 0 0 0Togo 0 0 0 0 0 0 0 0 0 1 7 11 10 19 34 17 1 0 0 0 0 0 0 0Mauritania 0 0 0 0 0 0 2 1 4 7 5 9 4 7 7 9 11 17 13 5 0 0 0 0Swaziland 0 0 0 0 0 1 1 5 5 5 10 8 5 3 3 11 15 7 9 9 2 0 0 0Ethiopia 0 0 0 0 0 0 0 0 0 0 0 1 3 6 16 25 21 19 5 4 0 0 0 0Niger 0 0 0 0 0 0 0 1 0 1 2 11 7 6 13 13 15 9 13 9 1 0 0 0Zimbabwe 0 0 0 0 0 0 0 0 0 1 2 1 9 12 13 22 13 14 7 4 2 1 0 0Guinea-Bissau 0 0 0 0 0 0 0 0 0 0 0 0 1 3 17 16 19 7 17 13 5 1 0 0Nigeria 0 0 0 0 0 0 0 0 0 0 0 0 1 3 13 15 25 15 19 10 0 0 0 0Burundi 0 0 0 0 0 0 0 0 0 0 0 0 0 1 6 23 19 13 6 4 7 22 0 0Equatorial Guinea 0 0 0 0 0 0 0 0 0 0 1 1 1 1 2 19 25 32 11 7 0 0 0 0Eritrea 0 0 0 0 0 0 0 0 0 0 0 0 0 0 1 11 11 11 12 24 19 10 0 0Cote d'Ivoire 0 0 0 0 0 0 0 0 0 0 0 0 0 0 1 1 0 10 25 20 37 5 0 0Guinea 0 0 0 0 0 0 0 0 0 0 0 0 0 0 0 3 1 7 14 43 28 4 0 0Liberia 0 0 0 0 0 0 0 0 0 0 0 0 0 1 0 2 1 13 17 18 33 16 0 0Sierra Leone 0 0 0 0 0 0 0 0 0 0 0 0 0 0 1 3 6 14 17 12 35 12 0 0Central African Republic 0 0 0 0 0 0 0 0 0 0 0 0 0 0 0 0 1 1 1 5 7 51 35 0Angola 0 0 0 0 0 0 0 0 0 0 0 0 0 0 0 0 3 4 7 9 13 53 11 0Sudan 0 0 0 0 0 0 0 0 0 0 0 0 0 0 0 0 1 3 6 7 4 23 56 0Chad 0 0 0 0 0 0 0 0 0 0 0 0 0 0 0 0 0 0 0 0 1 1 81 18Congo, Democratic Republic 0 0 0 0 0 0 0 0 0 0 0 0 0 0 0 0 0 0 0 0 0 0 10 90Somalia 0 0 0 0 0 0 0 0 0 0 0 0 0 0 0 0 0 0 0 0 0 0 8 92
IAG (150 scenarios)
Note: Frequencies are calculated across 150 simulated scenarios combining: (a) alternative weighting schemes, (b) different aggregation rules, and (c) full set or excluding one indicator at a time from the 14 sub-pillar framework. For example, Botswana is ranked in the 3-4th position in 92% of scenarios and in only 8% of scenarios does it move down to the 5-6th position. Frequencies lower than 5% are not shown.
We next present the ‘median’ performance across all 150 models as a summary measure of the
plurality of stakeholders’ views on how to combine the information on the 14 sub-pillars in
order to assess governance in Africa. Figure 4 shows the median rank and its 99% confidence
interval for each African country and displays the name of countries whose original 2006 Index
rank does not fall within this interval. Confidence intervals were estimated using bootstrap
(1000 samples taken with replacement, see Efron, 1979). For 41 of the 48 countries, the 2006
Index rank lies within this interval, which suggests that these countries were ranked in the
correct place, on average. Seven countries however appear to be slightly misplaced. Rwanda,
Mali, Niger and Guinea-Bissau have been favoured by the choices made in the 2006 Index by
Created with novaPDF Printer (www.novaPDF.com). Please register to remove this message.

38
between three and eight places, while Zambia, Gambia and Nigeria were placed in a lower
position (by three to five places) than our simulations would suggest. Any messages conveyed
by the 2006 IAG for those seven countries should, therefore, be formulated with great caution
and considered only as suggestive and contingent on the original methodological assumptions
made in developing the Index. Furthermore, a precise rank, on average, could be assigned for
twelve countries: Mauritius, Seychelles, Cape Verde, Botswana, Namibia, Sao Tome and
Principe, Senegal, Malawi, Djibouti, Chad, Dem. Rep. Congo, Somalia. The widest confidence
interval is estimated for Swaziland (=5 positions).
A positive result of this analysis is that the narrow confidence interval for almost all countries
suggests that there is no particularly volatile section in the graph and that almost all African
countries see little change in position, i.e. always less than three positions. The only exception is
Swaziland, for which the confidence interval for the median rank is five positions wide, i.e. still
not too wide to prevent further inference. These narrow confidence intervals suggest that robust
conclusions (on average) on the relative performance of African countries can be drawn.
Interestingly, a precise average rank can be assigned to twelve countries.
Overall, the 2006 Index ranking provides an unbiased summary picture of governance issues in
Africa, since it is representative of a plurality of methodological scenarios.
Created with novaPDF Printer (www.novaPDF.com). Please register to remove this message.

39
Figure 4. Simulated median and its 99% confidence interval (across 150 models) for the Index ranks
1
6
11
16
21
26
31
36
41
46Sim
ulat
ed M
edia
n ra
nk (9
9% c
onfid
ence
inte
rval
) Only 7 countries outside the interval (total of 48)
MaliNiger
Zambia
Gambia
Nigeria
SwazilandGuinea-Bissau
Rwanda
Note: The dots relate a country’s 2006 Index rank to the median rank calculated over the set of plausible scenarios (indicators,
weighting scheme, aggregation rule) generated in our uncertainty analysis. Ranks that fall outside the interval are marked in
black.
The results above are mostly presented as a suggestion to the developers. Plots such as these can
either be used directly as measures (thus replacing a crisp rank with a median performance) or as
part of a robustness analysis.
6.3 Sensitivity analysis results
Complementary to the uncertainty analysis, a sensitivity analysis makes it possible to assess the
impact of each of the 150 scenarios on the Index ranking. To this end, we calculate for each
country the absolute rank shift between the original Index rank and the rank provided by a given
scenario and then summarise these shifts over all 48 countries by using the 50th and the 90th
percentiles, the Spearman rank correlation coefficient and the Root Mean Square error.
Table 11 provides the results for the most and the least influential scenarios. Results for all 150
scenarios are provided in the Annex. Scenario 72, which employs a factor-analysis weighting
scheme across the 14 sub-pillars and a geometric aggregation rule and does not include the sub-
pillar on Participation in Elections, has the highest impact on the overall ranking: half the
countries (i.e. 24 countries) shift more than four positions and five countries shift more than
eleven positions (Burkina Faso, Cote d'Ivoire, Mali, Mauritania, Niger, Rwanda, Swaziland).
Created with novaPDF Printer (www.novaPDF.com). Please register to remove this message.
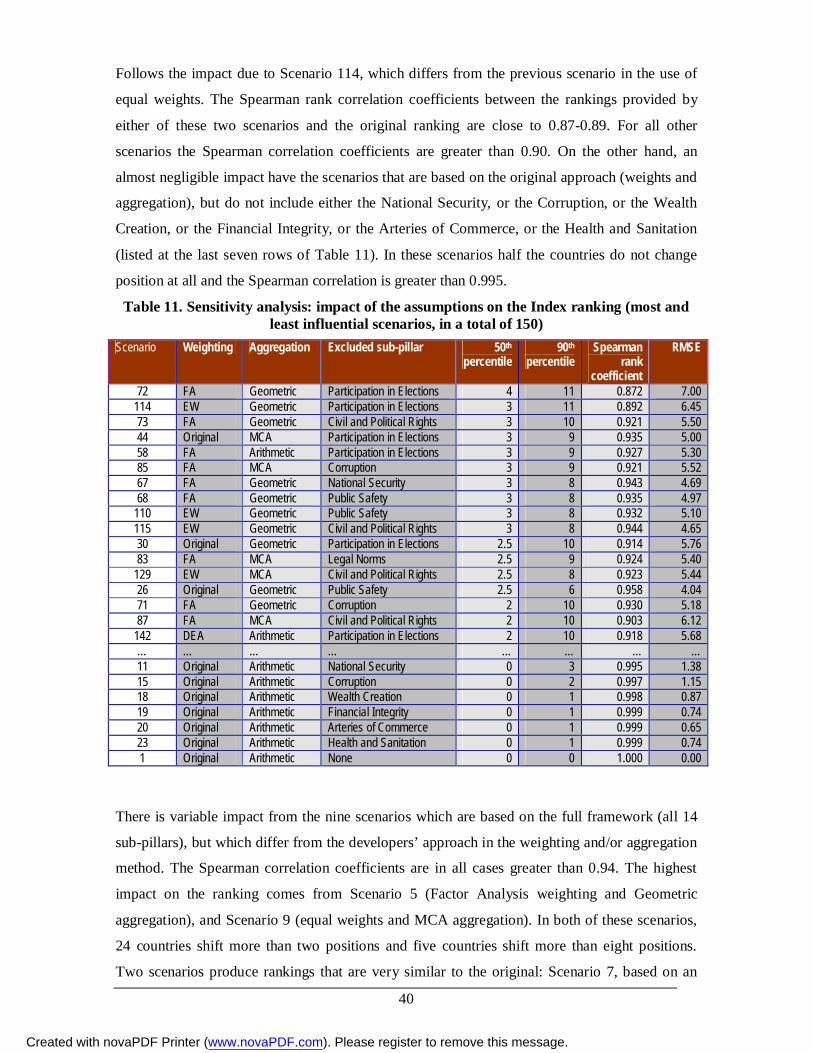
40
Follows the impact due to Scenario 114, which differs from the previous scenario in the use of
equal weights. The Spearman rank correlation coefficients between the rankings provided by
either of these two scenarios and the original ranking are close to 0.87-0.89. For all other
scenarios the Spearman correlation coefficients are greater than 0.90. On the other hand, an
almost negligible impact have the scenarios that are based on the original approach (weights and
aggregation), but do not include either the National Security, or the Corruption, or the Wealth
Creation, or the Financial Integrity, or the Arteries of Commerce, or the Health and Sanitation
(listed at the last seven rows of Table 11). In these scenarios half the countries do not change
position at all and the Spearman correlation is greater than 0.995.
Table 11. Sensitivity analysis: impact of the assumptions on the Index ranking (most and least influential scenarios, in a total of 150)
Scenario Weighting Aggregation Excluded sub-pillar 50th percentile
90th percentile
Spearman rank
coefficient
RMSE
72 FA Geometric Participation in Elections 4 11 0.872 7.00 114 EW Geometric Participation in Elections 3 11 0.892 6.45 73 FA Geometric Civil and Political Rights 3 10 0.921 5.50 44 Original MCA Participation in Elections 3 9 0.935 5.00 58 FA Arithmetic Participation in Elections 3 9 0.927 5.30 85 FA MCA Corruption 3 9 0.921 5.52 67 FA Geometric National Security 3 8 0.943 4.69 68 FA Geometric Public Safety 3 8 0.935 4.97
110 EW Geometric Public Safety 3 8 0.932 5.10 115 EW Geometric Civil and Political Rights 3 8 0.944 4.65 30 Original Geometric Participation in Elections 2.5 10 0.914 5.76 83 FA MCA Legal Norms 2.5 9 0.924 5.40
129 EW MCA Civil and Political Rights 2.5 8 0.923 5.44 26 Original Geometric Public Safety 2.5 6 0.958 4.04 71 FA Geometric Corruption 2 10 0.930 5.18 87 FA MCA Civil and Political Rights 2 10 0.903 6.12
142 DEA Arithmetic Participation in Elections 2 10 0.918 5.68 … … … … … … … … 11 Original Arithmetic National Security 0 3 0.995 1.38 15 Original Arithmetic Corruption 0 2 0.997 1.15 18 Original Arithmetic Wealth Creation 0 1 0.998 0.87 19 Original Arithmetic Financial Integrity 0 1 0.999 0.74 20 Original Arithmetic Arteries of Commerce 0 1 0.999 0.65 23 Original Arithmetic Health and Sanitation 0 1 0.999 0.74 1 Original Arithmetic None 0 0 1.000 0.00
There is variable impact from the nine scenarios which are based on the full framework (all 14
sub-pillars), but which differ from the developers’ approach in the weighting and/or aggregation
method. The Spearman correlation coefficients are in all cases greater than 0.94. The highest
impact on the ranking comes from Scenario 5 (Factor Analysis weighting and Geometric
aggregation), and Scenario 9 (equal weights and MCA aggregation). In both of these scenarios,
24 countries shift more than two positions and five countries shift more than eight positions.
Two scenarios produce rankings that are very similar to the original: Scenario 7, based on an
Created with novaPDF Printer (www.novaPDF.com). Please register to remove this message.

41
equal weighting of all 14 sub-pillars, and Scenario 10, based on cross-efficient Data
Envelopment Analysis.
Although the different scenarios produce relatively different rankings compared to the original
Index ranking, we would stress that on average these rankings are very similar to the 2006 Index
ranking. The Spearman correlation between the 2006 Index ranking and the most extreme
scenario (S72) is 0.872, and the correlation between the 2006 Index ranking and the most
extreme scenario employing the full framework is 0.936.
Table 12. Sensitivity analysis: impact of the assumptions on the Index ranking (scenarios based on the full framework)
Scenario Weighting Aggregation 50th percentile
90th percentile
Spearman rank
coefficient
RMSE
9 EW MCA 2 8 0.946 4.53 5 FA Geometric 2 8 0.949 4.41 8 EW Geometric 2 6 0.959 3.98 3 Original MCA 2 5 0.970 3.41 2 Original Geometric 2 5 0.975 3.08 6 FA MCA 1 9 0.936 4.97 4 FA Arithmetic 1 6 0.970 3.36 7 EW Arithmetic 1 4 0.989 2.06 10 DEA Arithmetic 1 4 0.984 2.52
Before concluding this chapter on sensitivity analysis we will discuss in more detail two issues:
compensability and fixed weighting schemes in the development of the Index of African
Governance.
When using equal weighting and either linear or geometric aggregation, the compensability
problem is likely to appear: high values in a few sub-pillars may offset very low values in many
others. A solution to mitigate this is to use a non-compensatory multi-criteria analysis or at least
a multi-criteria approach based on ordinal information on the indicators. The three scenarios in
which multi-criteria analysis is employed on the full framework but which differ in the
weighting scheme (Scenario 3, 6 and 9, see Table A.3 in the Annex) provide results that are
relatively similar to the Index ( 94.0Sr ). To give an example, had a multi-criteria aggregation
rule been used with the original weighting scheme (Figure 5), the median impact on the Index
ranking would have been two positions, and the most affected countries would have been
Swaziland (with a twelve-position change), Mauritania and Angola (seven positions). This
conclusion supports the methodological approach used by the developers, which, despite its
linear form, provides a ranking that is not particularly affected by compensability issues.
Created with novaPDF Printer (www.novaPDF.com). Please register to remove this message.

42
Upon granting some flexibility to each country in the assignment of the weights, the cross-
efficiency DEA ranking presents a strong association with the Index ( 984.0Sr ). The median
impact on the Index ranking would be just one position, and the most affected country would be
Congo (with a six-position change), as shown in Figure 5. This result shows that even if the
ensemble of the 48 “country-specific weighting schemes” had been employed to build the Index
of African Governance, as opposed to a single and fixed set of weights for all countries, the
picture of the state of governance in African countries would not have been substantially
affected.
Figure 5. Impact of selected scenarios on the Index ranking
Notes: (Top graph) Country rank changes with respect to the original rank are due to the application of a multi-
criteria analysis aggregation rule combined with the original weighting scheme. (Bottom graph) Country rank changes with respect to the original rank are due to the application of a cross-efficiency Data Envelopment Analysis.
Having carried out an uncertainty and sensitivity analysis of the 2006 Index of African
Governance, which showed that the results are, in most cases, reliable estimates of governance
issues in African countries, we show next how the Index can be used to extract data-driven
narratives, in addition to those provided already by the developers in the relevant report
(Rotberg and Gisselquist, 2008).
7
4
-8
-3 -2
-5
-2
24
6
-2 -2-4 -3
2
-2
1
-1
7
-1
-5
3
-2 -2
1
12
1
-2 -2
4
-5-8
-4
0
4
8
12
Ang
ola
Ben
inB
otsw
ana
Bur
kina
Bur
undi
Cam
eroo
nC
ape
Ver
deC
entra
lC
had
Com
oros
Con
goC
ongo
,C
ote
d'Iv
oire
Djib
outi
Equ
ator
ial
Erit
rea
Eth
iopi
aG
abon
Gam
bia
Gha
naG
uine
aG
uine
a-K
enya
Leso
tho
Libe
riaM
adag
asca
rM
alaw
iM
ali
Mau
ritan
iaM
aurit
ius
Moz
ambi
que
Nam
ibia
Nig
erN
iger
iaR
wan
daS
ao T
ome
Sen
egal
Sey
chel
les
Sie
rra L
eone
Som
alia
Sou
th A
frica
Sud
anS
waz
iland
Tanz
ania
Togo
Uga
nda
Zam
bia
Zim
babw
e
MCA
1
-2
31 2
-6
24
24 4 3
-1
1 1
-5
2
-4 -5
5
-1
1 24
13
-1
-5
-1
24 3
-8
-4
0
4
8
12
Ang
ola
Ben
inB
otsw
ana
Bur
kina
Bur
undi
Cam
eroo
nC
ape
Ver
deC
entra
lC
had
Com
oros
Con
goC
ongo
,C
ote
d'Iv
oire
Djib
outi
Equ
ator
ial
Erit
rea
Eth
iopi
aG
abon
Gam
bia
Gha
naG
uine
aG
uine
a-K
enya
Leso
tho
Libe
riaM
adag
asca
rM
alaw
iM
ali
Mau
ritan
iaM
aurit
ius
Moz
ambi
que
Nam
ibia
Nig
erN
iger
iaR
wan
daS
ao T
ome
Sen
egal
Sey
chel
les
Sie
rra L
eone
Som
alia
Sou
th A
frica
Sud
anS
waz
iland
Tanz
ania
Togo
Uga
nda
Zam
bia
Zim
babw
e
DEA
Created with novaPDF Printer (www.novaPDF.com). Please register to remove this message.

43
7. Policy implications
The Index and pillar scores capture different aspects of governance and provide good material
for the analysis of governance in African countries south of Sahara. A high Index (or pillar)
score means that a particular country has better governance conditions for economic and social
prosperity. Although not the sole factor contributing to such success, good governance is
increasingly important in competitive economies. While an African country will score higher
than some and lower than others, the purpose of the Index of African Governance is not to
identify winners and losers. Instead, the Index is intended to generate a discussion about what
factors contribute to the best possible governance conditions.
The relation between the Index (or pillar) scores and the respective ranks for the 48 countries
considered are shown in Figure 6. It is interesting to note the differences between two country
scores ranked successively along the classification ladder and across the pillars and the Index.
For example, in Sustainable Economic Opportunity, the distance between Namibia (6th) and
Congo (7th) is 8.7 points, while the average distance between two consecutively ranked counties
is merely 1.0 point.
This graph may also provide insight into the nature of policy challenges from the perspective of
governance. The best overall performance is found in the Safety and Security pillar, in which
three African countries score 100.0 points (Cape Verde, Gabon, Sao Tome and Principe) and all
but three countries (Central African Republic, Somalia, Sudan) obtain scores greater than 50
points. The curve of Rule of Law, Transparency and Corruption pillar closely follows that of the
overall Index. There is one pillar in which all countries’ performance is particularly worrying:
Sustainable Economic Opportunity. Only six countries manage to score more than 50 points
(Botswana, Gabon, Mauritius, Namibia, Seychelles, South Africa). This suggests that the four
components of this pillar, namely Wealth Creation, Macroeconomic Stability and Financial
Integrity, Arteries of Commerce, and Environmental Sensitivity, represent distinct and difficult
policy challenges for the African governments.
Created with novaPDF Printer (www.novaPDF.com). Please register to remove this message.

44
Figure 6. 2006 Index and pillar scores (and ranks)
0
10
20
30
40
50
60
70
80
90
100
1 5 9 13 17 21 25 29 33 37 41 45
Rank
Sco
re
Safety and Security
Rule of Law, Transparency, and Corruption
Participation and Human Rights
Sustainable Economic Opportunity
Human Development
IIAG
7.1 Exceptional behaviour of some African countries
The 2006 Index shows that there is no ideal African state south of the Sahara excelling in all 14
sub-pillars of governance, but rather that there is space for improvement in all countries. One
observation is that the top Index scores (Mauritius, Seychelles, Cape Verde, Botswana and
South Africa) are all found in the south east of Africa, with the exception of Cape Verde in the
north-western part of Africa. These countries share the “best practice cake” of governance in
Africa.
Given that the aim of this analysis was not to name and shame, but rather to throw the spotlight
on stronger and weaker points, we will discuss the results accordingly.
African countries which perform well in the overall Index generally perform well in all five
pillars of governance. The only exception is South Africa, which is ranked 42nd (bottom quartile)
Created with novaPDF Printer (www.novaPDF.com). Please register to remove this message.

45
in the Safety and Security pillar, but 4th in the overall Index (top quartile). To see this more
clearly, we grouped the countries into four quartiles according to their rank in the overall Index
and in each pillar. We will now discuss those countries that belong to the top quartile in the
overall Index (or pillar) but simultaneously to the bottom quartile of a given pillar (or Index),
and vice versa. Table 13 shows the results. As we suspect, the map of African governance
reveals several surprises.
In the Safety and Security pillar, only South Africa stands out, with a very strong performance in
the overall Index (2nd) but a very poor performance in this pillar (42nd). The challenges in South
Africa lie in decreasing the “Ease of Access to Small Arms and Light Weapons” and the level of
“Violent Crime (Homicides)”. The opposite is not observed, i.e. no country performs in the top
quartile in the Safety and Security pillar but in the bottom quartile in the overall Index. In the
Rule of Law, Transparency and Corruption pillar, there are no peculiarities to report and the
levels of performance follow that of the overall Index. In the Participation and Human Rights
pillar only Liberia stands out. Liberia performs in the top quartile in Participation and Human
Rights (2nd), but is at 38th position in the overall Index classification. This country is particularly
weak in the majority of the indicators underlying three pillars: Rule of Law, Transparency, and
Corruption; Sustainable Economic Opportunity; Human Development. In the Sustainable and
Economic Opportunity pillar only Equatorial Guinea stands out, with top performance in this
pillar (9th) but taking only 36th position in the overall Index classification. This country is
particularly weak in several indicators underlying three pillars: Rule of Law, Transparency, and
Corruption; Participation and Human Rights; and Human Development. Finally, in the Human
Development pillar only Sudan stands out, with a relatively good performance in this pillar (12 th
position), while taking 45th position in the overall Index classification. This country is
particularly weak in many of the indicators that belong to three pillars: Safety and Security;
Rule of Law, Transparency, Corruption; Participation and Human Rights.
Created with novaPDF Printer (www.novaPDF.com). Please register to remove this message.

46
Table 13. Comparison of the Index ranks versus the five pillar ranks (top/bottom quartiles)
Index of African Governance Top 25% Bottom 25% Safety and Security
Top 25% - Bottom 25% South Africa (42nd, 5th)
Rule of Law, Transparency, and Corruption - Top 25%
Bottom 25% - Participation and Human Rights
Top 25% Liberia (2nd, 38th) Bottom 25% -
Sustainable Economic Opportunity Top 25% Equatorial Guinea (9th, 36th)
Bottom 25% - Human Development
Top 25% Sudan (12th, 45th) Bottom 25% -
Created with novaPDF Printer (www.novaPDF.com). Please register to remove this message.

47
7.2. African Governance – what it is and is not about
This section analyses the Index of African Governance scores in relation to possible
determinants of governance success. In particular, we explore the correlation between the Index
and (1) GDP per capita; (2) Judicial independence using Freedom House’s Rule of Law; (3)
Public Sector Corruption; (4) Respect for Civil Rights; (5) Child Mortality, (6) Access to
Drinking Water; (7) Primary School Completion Rate. We also explore what the Index of
African Governance does not capture, contrary to what common expectations or the conceptual
framework would suggest.
GDP per capita
Though statistically significant, the correlation between GDP per capita and the Index of African
Governance is very low ( 347.r ). In fact, Figure 7 confirms the high variation in the Index
scores at every income level, in particular for 42 African countries at levels lower than $5000.
Equatorial Guinea, which has the highest GDP per capita among the countries studied ($26,300),
scores only 49.2 points in the overall Index (36th position). Beneath the aggregation level of the
Index, the only pillar that demonstrates a good relationship to income is the Sustainable
Economic Opportunity, as expected. All other pillars of Governance have a very low or
insignificant association with GDP per capita. Intuitively, this result is desirable, as it confirms
that good governance goes much beyond income benefits and captures more diverse aspects,
such as safety and security, transparency and corruption.
Figure 7. Index of African Governance vs. GDP per capita
Equatorial Guinea
GabonBotswana
MauritiusSeychelles
0
20
40
60
80
100
0 5 10 15 20 25 30
GDP per capita based on PPP (x1000 $)
2006
Inde
x sc
ore
r =.347, p <0.05
Created with novaPDF Printer (www.novaPDF.com). Please register to remove this message.

48
Judicial Independence- Freedom House’s Rule of Law
Figure 8 shows a strong relationship ( 849.r ) between governance and judicial independence
as measured by the Freedom House’s Rule of Law. The “Rule of Law” index is intended to
assess the independence of the judiciary, civilian control of the police, protection from political
terror, and equal treatment across various groups. It thus comes as no surprise that “Rule of
Law” explains a significant part of the variance in the overall Governance scores.
Figure 8. Index of African Governance vs. Judicial Independence
GabonSeychelles
Liberia
Mauritius
0
20
40
60
80
100
0 2 4 6 8 10 12 14 16
Judicial Independence (Freedom's House Rule of Law)
2006
Inde
x sc
ore
r =.849
Public Sector Corruption- Transparency International’s Corruption Perceptions Index
The relationship between the Index of African Governance scores and Public Sector Corruption
is very similar to that between the Index and Freedom House’s Rule of Law ( 834.r , Figure 9).
Given the lack of official statistics on corruption, the developers relied on the industry standard,
Transparency International’s Corruption Perception Index (CPI), which draws on multiple
expert opinion surveys of perceptions of public sector corruption. Low CPI values indicate high
levels of perceived corruption. The African countries with the highest CPI scores have the
lowest variance in governance and show up at the top of the Index of African Governance
distribution. Countries with lower CPI scores (higher perceived corruption) show consistently
lower Governance scores.
Created with novaPDF Printer (www.novaPDF.com). Please register to remove this message.
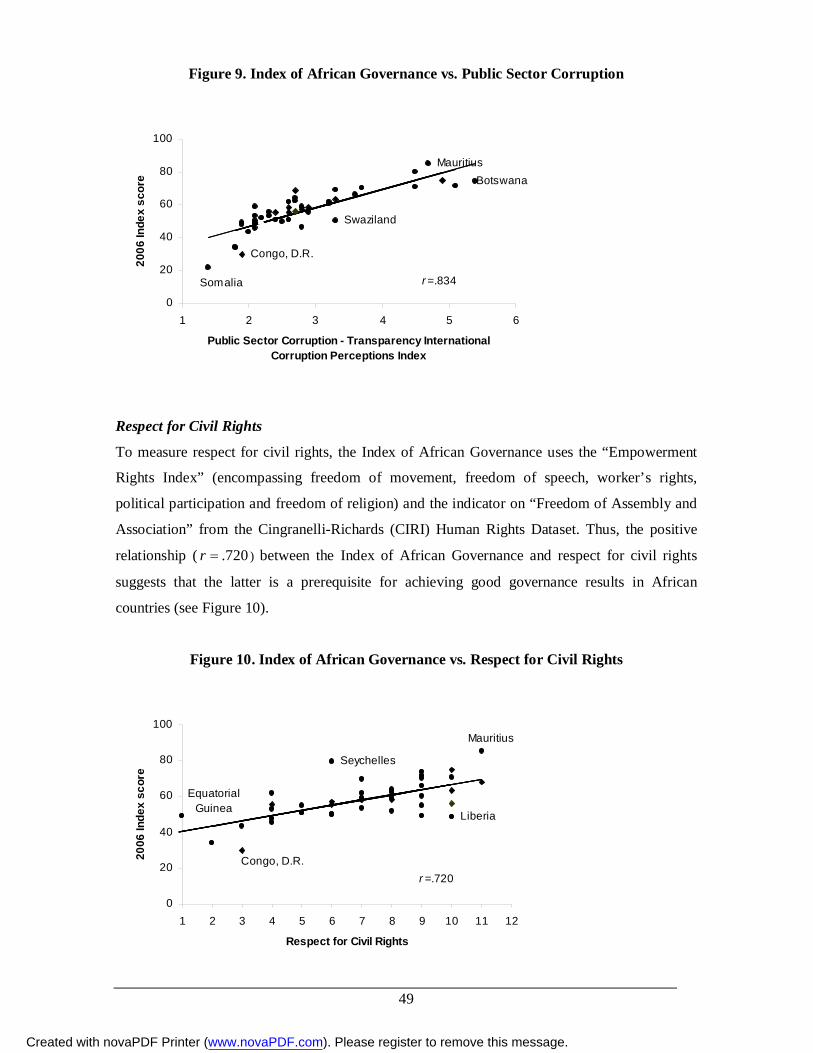
49
Figure 9. Index of African Governance vs. Public Sector Corruption
Botswana
Congo, D.R.
Mauritius
Swaziland
Somalia
0
20
40
60
80
100
1 2 3 4 5 6
Public Sector Corruption - Transparency International Corruption Perceptions Index
2006
Inde
x sc
ore
r =.834
Respect for Civil Rights
To measure respect for civil rights, the Index of African Governance uses the “Empowerment
Rights Index” (encompassing freedom of movement, freedom of speech, worker’s rights,
political participation and freedom of religion) and the indicator on “Freedom of Assembly and
Association” from the Cingranelli-Richards (CIRI) Human Rights Dataset. Thus, the positive
relationship ( 720.r ) between the Index of African Governance and respect for civil rights
suggests that the latter is a prerequisite for achieving good governance results in African
countries (see Figure 10).
Figure 10. Index of African Governance vs. Respect for Civil Rights
Liberia
Seychelles
Congo, D.R.
Equatorial Guinea
Mauritius
0
20
40
60
80
100
1 2 3 4 5 6 7 8 9 10 11 12
Respect for Civil Rights
2006
Inde
x sc
ore
r =.720
Created with novaPDF Printer (www.novaPDF.com). Please register to remove this message.

50
Child Mortality
Child mortality under the age of five is considered a key indicator of health outcomes and a
result of good governance. The importance of reducing child mortality is also stressed in the
Millennium Development Goals (Goal 4). The strong negative association between the Index of
Governance scores and child mortality rates ( 620.r ) suggests that, in general, good
governance leads to lower mortality rates and vice versa, and that a five-point increase in the
Index of African Governance score is associated with a 38.5 decrease in the mortality rate
(Figure 11). However, Figure 11 shows that African countries with the lowest mortality rates
have the lowest variance in governance and show up in the top of the Index of African
Governance distribution. In fact, the three lowest mortality rates in African countries (<40.0 per
1000 live births in 2006) are obtained by Mauritius, Cape Verde and Botswana, which are
ranked in the top four of the overall Index. The opposite is not equally evident. In fact, African
countries with high mortality rates have higher variance in governance. For example, mortality
rates greater than 200 per 1000 live births are found in six countries Angola, Congo Dem.
Rep., Equatorial Guinea, Niger, Sierra Leone, and Somalia but these countries score between
21.7 and 55.5 points in the overall Index of African Governance.
Figure 11. Index of African Governance vs. Child Mortality
Sierra Leone
Somalia
Sudan
BotswanaCape Verde
Congo, D.R.
Equatorial Guinea
Mauritius
NigerAngola
0
20
40
60
80
100
0 50 100 150 200 250 300
Child Mortality
2006
Inde
x sc
ore
r =-.620, y =-0.130 x +72.098
Created with novaPDF Printer (www.novaPDF.com). Please register to remove this message.

51
Access to Drinking Water
Access to potable water measures the percentage of the population with access to drinking water
and ranges between roughly 22% of the population in Ethiopia to 100% in Mauritius. The good
positive association between the Index of Governance scores and access to drinking water
( 657.r ) suggests that, in general, good governance leads to high access to potable water and
vice versa. This is confirmed in Figure 12 along the entire distribution range. Furthermore, a
five-point increase in the Index of African Governance score is associated with a 10.6 increase
in the percentage of population with access to potable water.
Figure 12. Index of African Governance vs. Access to drinking water
Somalia
Sudan
Ethiopia
Mauritius
0
20
40
60
80
100
0 20 40 60 80 100
Access to drinking water
2006
Inde
x sc
ore
r =.657y = 0.471 x +25.247
Primary School Completion Rate
Primary school completion rates range between 24.3% in Central African Rep. to over 100% in
Seychelles and South Africa. The good positive association between the Index of Governance
scores and primary school completion rate ( 628.r ) suggests that, in general, good governance
leads to high primary school completion rates and vice versa (Figure 13). Overall, a five-point
increase in the Index of African Governance score is associated with a 15.0 increase in the
primary school completion rate.
Created with novaPDF Printer (www.novaPDF.com). Please register to remove this message.

52
Figure 13. Index of African Governance vs. Primary School Completion Rate
SudanCentral African Republic
MauritiusSeychelles
South Africa
0
20
40
60
80
100
0 20 40 60 80 100 120
Primary School Completion Rate
2006
Inde
x sc
ore
r =.628y = 0.333 x +36.506
Less influential aspects in African Governance
What about other important indicators of governance, such as GDP growth and inequality of
income (Gini index), which were included in the conceptual framework for the Index? Figure 14
to Figure 17 show that the Index scores are randomly associated with GDP growth, inflation,
income inequality and HIV prevalence. In fact, the correlation coefficient is in all cases lower
than 0.28 (absolute value) and the 95% confidence interval for the slope includes zero in all
regressions. These results do not imply that keeping inflation, income inequality and HIV
prevalence at low levels, and GDP growth at high levels, should not be among the policy
objectives of governments in African countries. They simply point to the fact that, even if
governments made an effort to improve these aspects, the effort would not be captured by the
Index of African Governance. The complete list of indicators which were included in the
conceptual framework of African Governance but which are randomly associated with the
overall Index scores were presented in Table 5. These conclusions need to be taken into
consideration when interpreting the results of the Index.
Created with novaPDF Printer (www.novaPDF.com). Please register to remove this message.

53
Figure 14. Index of African Governance vs. GDP Growth
Congo, D.R.
Eritrea
Mauritius
Sudan
Mauritania
Chad
Equatorial Guinea
Zimbabwe
0
20
40
60
80
100
-8 -4 0 4 8 12 16
GDP growth (%)
2006
Inde
x sc
ore
r =.021, p>0.05
Figure 15. Index of African Governance vs. Inflation
Botswana
Congo, D.R.
Eritrea
Mauritius
Sao Tome and Principe
Guinea
0
20
40
60
80
100
-5 -1 3 7 11 15 19 23 27 31 35
Inflation (%)
2006
Inde
x sc
ore
r =-.089, p>0.05
Created with novaPDF Printer (www.novaPDF.com). Please register to remove this message.

54
Figure 16. Index of African Governance vs. Gini Index
Namibia
Sierra Leone
MauritiusSao Tome and
Principe
0
20
40
60
80
100
30 40 50 60 70
Gini Index
2006
Inde
x sc
ore
r =.077, p>0.05
Figure 17. Index of African Governance vs. HIV Prevalence
Botswana
Congo, D.R.Somalia
SwazilandZimbabwe
Mauritius
0
20
40
60
80
100
0 10 20 30 40
HIV prevalence (%)
2006
Inde
x sc
ore
r =.251, p>0.05
7.3 Index of African Governance and population size
A question on whether population size can favour governance can be raised. In African countries
south of the Sahara, the 2006 Index results show that there is no clear pattern as to whether
population size has a positive or negative impact on governance (Figure 18). The association
Created with novaPDF Printer (www.novaPDF.com). Please register to remove this message.

55
between the Index scores and population is not statistically significant ( 05.0,217.0 pr ).
This result shows that population size is not a determinant in good governance.
Figure 18. Index of African Governance vs. Population Size
Congo, D.R.
Cote d'IvoireEthiopia
Mauritius
Somalia
South Africa
Sudan
0
20
40
60
80
100
0 500 1000 1500
Population (x 100,000)
2006
Inde
x sc
ore
r =-.217, p>0.05
7.4. Index of African Governance & variability
To conclude the discussion on policy implications, we consider the relationship between the
Index scores and the variability (=coefficient of variation) in the set of 14 sub-pillars comprising
the governance framework. The countries situated high or mid-range in the Index tend to score
uniformly high in the majority of the sub-pillars. In other words, these countries display a
relatively low variability. Figure 19 shows that variability increases moving down the list in
decreasing order of the Index scores. This scissors pattern is evident and pronounced. The
correlation between the Index and the coefficient of variation series is equal to 908.0r ,
indicating a high degree of reverse association between the Index scores and variability in the
underlying sub-pillars. For comparison purposes, in the case of the Trade and Development
Index (UNCTD, 2005), which is based on eleven components and 110 countries, the correlation
coefficient between the index scores and the coefficient of variation was slightly ( 93.0r ). By
contrast, in the case of the Composite Learning Index (CCL, 2007), which is based on seventeen
indicators and 4567 communities in Canada, the correlation coefficient between the index scores
and the coefficients of variation series was much lower ( 61.0r ).
An implication of this finding is that while changes in the Index scores over time could
be regarded as a quantitative indication of trends in governance in Africa, those in respect of the
variability could be seen as qualitative changes. Reducing even further the variability in the sub-
pillars should be among the objectives of governance policies and strategies in Africa. To be
Created with novaPDF Printer (www.novaPDF.com). Please register to remove this message.

56
successful, an African country should put simultaneous efforts into achieving multiple goals
within a coherent governance strategy, while also focussing on the reduction of existing gaps in
performance. As the exceptional behaviour of a few countries (e.g. Liberia, Equatorial Guinea
and Sudan) indicates – i.e. countries which have very low overall Index performance but very
high performance in just one of the five pillars of governance (see results in Table 13) – a
disproportionate emphasis on a limited number of objectives without concomitant focus on the
many other determinants of governance can yield only marginal results. By demonstrating
significant inter-country differences in the values of the coefficient of variation, the scissors
diagram (Figure 19) points to the importance of country-specific approaches to governance
strategies. At the same time, however, there is no way that these variations in the different
governance-related issues will be reduced without coherence between policy- and law-making,
on the one hand, and strategies, partnership and solidarity, on the other.
Figure 19. The scissor diagram of the Index of African Governance and Variability
20
30
40
50
60
70
80
90
Mau
ritiu
sSe
yche
lles
Cap
e V
erde
Bots
wan
aSo
uth
Afric
aN
amib
iaG
hana
Gab
onSa
o To
me
and
Prin
cipe
Sene
gal
Mal
awi
Leso
tho
Beni
nC
omor
osTa
nzan
iaM
adag
asca
rK
enya
Rw
anda
Uga
nda
Bur
kina
Fas
oZa
mbi
aM
ozam
biqu
eM
ali
Nig
erC
amer
oon
Djib
outi
Gam
bia
Con
goTo
goG
uine
a-B
issa
uE
thio
pia
Mau
ritan
iaZi
mba
bwe
Sw
azila
ndBu
rund
iE
quat
oria
l Gui
nea
Sie
rra L
eone
Libe
riaN
iger
iaG
uine
aE
ritre
aC
ote
d'Iv
oire
Cen
tral A
frica
n R
ep.
Ang
ola
Suda
nC
had
Con
go, D
em. R
ep.
Som
alia
IND
EX S
core
0.00.10.20.30.40.50.60.70.80.91.0
Coe
ffici
ent o
f var
iatio
n
INDEX Variability
Created with novaPDF Printer (www.novaPDF.com). Please register to remove this message.

57
8. Conclusions
The Index of African Governance, developed by the Harvard Kennedy School (Rotberg and
Gisselquiest, 2008) distils key aspects of governance in five main dimensions:
a. Safety and Security,
b. Rule of Law, Transparency, and Corruption,
c. Participation and Human Rights,
d. Sustainable Economic Opportunity, and
e. Human Development.
These dimensions of governance range from National Security and Participation in Elections to
Environmental Sensitivity, Poverty and Education. A total of 57 indicators is included in the
conceptual framework for the Index. As always when combining statistical indicators to capture
a complex dimension, the Index of African Governance is a mixture of analysis and advocacy
related to the political priorities of 48 African countries south of the Sahara.
Important findings suggest that:
The performance of African countries is in general satisfactory in four of the five pillars.
However, the Sustainable Economic Opportunity pillar, which captures issues of Wealth
Creation, Macroeconomic Stability and Financial Integrity, Arteries of Commerce, and
Environmental Sensitivity, represents the main challenge for the majority of the countries:
only six countries manage to score more than 50 points (Botswana, Gabon, Mauritius,
Namibia, Seychelles, South Africa).
There is only one country, South Africa, which scores at the top of the Index (2nd) but has
a very poor performance in one of the pillars, coming 42nd in Safety and Security. The
challenges in South Africa lie in decreasing the “Ease of Access to Small Arms and Light
Weapons” and the number of “Violent Crime (Homicides)”. No other country makes it to
the top of the Index without scoring moderately to highly in all five pillars of governance.
The opposite, however, is observed for three countries whose overall Index score is in the
bottom quartile, while scoring in the top quartile in one of the pillars: Liberia has top
performance in Participation and Human Rights (2nd), Equatorial Guinea in Sustainable
and Economic Opportunity (9th), and Sudan in Human Development (12th).
Possible determinants of governance success in African countries are, among others, (1)
Judicial Independence using Freedom House’s Rule of Law; (2) Public Sector Corruption;
Created with novaPDF Printer (www.novaPDF.com). Please register to remove this message.

58
(3) Respect for Civil rights; (4) Child Mortality, (5) Access to Drinking Water; and (6)
Primary School Completion Rate.
Other important aspects of governance, such as GDP growth, inflation, income inequality
and HIV prevalence, although they were included in the conceptual framework, do not
bear any statistically significant association to the Index scores. These results do not imply
that keeping inflation, income inequality and HIV prevalence at low levels, and GDP
growth at high levels, should not be among the policy objectives of governments in
African countries. They simply point to the fact that even if governments made an effort to
improve these aspects, the effort would not be captured by the Index of African
Governance. The same comment holds for other indicators, such as Number of Days to
Settle a Contract Dispute, Deficits/Surplus as a % of GDP, Business Environment,
Incidence of Tuberculosis, and Progression to Secondary School.
Regarding an eventual question of whether population size can favour governance , in
African countries south of the Sahara, the 2006 Index results show that there is no clear
pattern as to whether population size can have a positive or negative impact on governance
(regression coefficients either very low or not statistically significant).
There is a high degree of reverse association ( 908.0r ) between the Index scores and
the variability in the 14 sub-pillars. An implication of this finding is that while changes in
the Index scores over time could be regarded as a quantitative indication of trends in
governance in Africa, those in respect of the variability could be seen as indicating
qualitative changes. To be successful, an African country must put simultaneous efforts
into achieving multiple goals within a coherent governance strategy, while working
towards the reduction of existing gaps performance. As the exceptional behaviour of a few
countries indicates (i.e. countries which have very low overall Index performance but very
high performance in just one of the five pillars of governance, e.g. Liberia, Equatorial
Guinea and Sudan), a disproportionate emphasis on a limited number of objectives without
concomitant focus on the many other the determinants of governance can yield only
marginal results.
We subjected the Index to thorough validity testing. First, we conducted an internal consistency
check to assess whether the conceptual framework was confirmed by the statistical analysis and
whether there were any potential pitfalls. Within this context, we suggested merging some
categorical values in four qualitative indicators: Ratification of Core International Human Rights
Conventions, Property Rights Index, Respect for Physical Integrity Rights and Respect for Civil
Rights. We also confirmed the conceptual framework and its splitting into pillars and sub-pillars
Created with novaPDF Printer (www.novaPDF.com). Please register to remove this message.

59
by means of (linear or non-linear) Principal Component Analysis. The impact of choosing an
equal weighting within each pillar, as preferred by the developers, versus a PCA-based
weighting to estimate the pillar ranking, was also estimated and was found to be non-important
in the case of four of the five pillars. Only the pillar on Sustainable Economic Opportunity needs
to be treated with caution due to missing data, in particular on the Environmental Sensitivity
index. The original approach to estimating missing data by mean substitution is not particularly
apt, as discussed in Sect. 3; hot-deck imputation is recommended instead. Despite these pitfalls,
the Index of African Governance is supported by more sophisticated statistical analysis, and has
the advantage of computational simplicity.
Among the good features of the Index, we would also stress three points:
All correlations between the overall Index scores and each of the five pillar scores are
positive and relatively high ( 89.069.0 r ). This shows that the pillars and the Index
point in the same direction and that there are no trade-offs between the main pillars of
the composite indicator.
Overall, there is no strong dominance issue, neither at the sub-pillar nor at the pillar
level. However, given that the variance of the pillar on Participation and Human Rights
is twice or even almost five times greater than the variance of the other pillar scores, it
seems that this pillar has a higher discriminating power among the Index scores
compared to the other pillars, despite the equal weighting of the five pillars. This
phenomenon could be avoided by standardising the five pillar scores prior to finally
aggregating them into an overall Index score. The same remark, at the sub-pillar level,
holds for Participation in Elections.
The overall Index reflects, without distortion, the information content in the dataset,
given the compatibility of the cluster analysis results at the sub-pillar level and the pillar
level.
Second, we conducted an uncertainty analysis to assess the impact on the Index ranking of
simultaneous variations in the methodological assumptions related to the weighting scheme, the
aggregation method and the number of sub-pillars included in the framework. The effect proved
to be acceptable for the vast majority of the countries, but important for seven countries:
Rwanda, Mali, Niger, Guinea-Bissau, Zambia, Gambia and Nigeria. Any Index-driven narrative
on those countries should be considered only as suggestive and contingent on the original
methodological assumptions made in developing the Index. Overall, the Index of African
Governance gives a fair representation of the ensemble of models considered and, consequently,
Created with novaPDF Printer (www.novaPDF.com). Please register to remove this message.

60
it is a construct that African governments could relate to and utilise. The sensitivity analysis
results indicated that although the different scenarios produce relatively different rankings
compared to the original Index ranking, on average these rankings are very similar to the 2006
Index ranking. The Spearman correlation between the 2006 Index ranking and the most extreme
scenario is 0.872, and the correlation between the 2006 Index ranking and the most extreme
scenario employing the full framework of 14 sub-pillars is 0.936. Additionally, the scenarios
which employ a multi-criteria analysis aggregation rule produce results that are relatively similar
to the Index ranking ( 94.0Sr ). This conclusion supports the methodological approach used by
the developers, which, despite its linear form, provides a ranking that is not particularly affected
by compensability issues. Finally, the strong correlation between the Index ranking and the
cross-efficiency DEA ranking ( 984.0Sr ) suggests that even if the ensemble of the 48
“country-specific weighting schemes” had been employed to build the Index of African
Governance, as opposed to a single and fixed set of weights for all countries, the picture of the
state of governance in African countries would not have been substantially affected.
The Index of African Governance, having passed the “statistical” filters of index quality, can
reliably be used to measure governance in countries south of the Sahara, to identify weaknesses
and propose remedial actions. From the point of view of implications, the assessment carried out
on the Index does not represent merely a methodological or technical appendage. Composite
measures are often attached to regulatory mechanisms whereby governments or organizations
are rewarded or penalised according to the results of such measurements. The use and
publication of composite measures can generate both positive and negative behavioural
responses and if significant policy and practice decisions rest on the results, it is important to
have a clear understanding of the potential risks involved in constructing a composite and
arriving at a ranking or benchmarking.
The analysis undertaken in this work provides no guarantee of the true ability of the Index to
describe governance in African countries. Yet, it provides enough evidence that the Index of
African Governance, tailored to the specific policy objectives and priorities in countries south of
Sahara, cannot easily be falsified.
Created with novaPDF Printer (www.novaPDF.com). Please register to remove this message.

61
ANNEX: Methodological boxes and additional information
Box 1. PCA, FA and Reliability Item Analysis and their role in the study of the Index of
African Governance .................................................................................................. 62 Box 2. Cluster Analysis and its role in the analysis of the Index of African Governance ......... 65 Box 3. Multi-criteria Analysis and its role in the robustness analysis of the Index of African
Governance............................................................................................................... 66 Box 4. Data Envelopment Analysis and its role in the robustness analysis of the Index of
African Governance .................................................................................................. 67
Created with novaPDF Printer (www.novaPDF.com). Please register to remove this message.

62
Box 1. PCA and Non-linear PCA, FA, Reliability Item Analysis and their role in the study of the Index of African Governance
Principal component analysis (PCA) is a multivariate statistical approach that essentially identifies patterns inherent in a multivariate model with a view to reducing the dimensionality in a set of variables, and/or to transforming interdependent variables into significant and independent ones (Manly, 1994; Dunteman, 1989). Classical PCA is used for quantitative indicators, while non-linear PCA is used for categorical indicators or mixed ones (Gifi, 1990, Michailidis and de Leeuw, 1998). PCA summarizes a p-dimensional dataset into a smaller number, q, of dimensions while preserving the variation in the data to the maximum extent possible. The q new dimensions are constructed such that: 1. They are linear combinations of the original variables; 2. They are independent of each other; 3. Each dimension captures a successively smaller amount of the total variation in the data.
These features of PCA justify its use as a tool to investigate the relationships between the selected indicators of lifelong learning. The objective was to capture those features in the data that help better understand lifelong learning or to discover interesting new patterns among the relationships between the indicators of learning. The p original indicators, per pillar of learning, were combined into q linear combinations, which form the new principal components of the system. A linear combination piZ i ,...,1, of a standardized data vector, ),...,,( 21 pxxxX is defined as:
pppppp
pp
pp
xaxaxaZ
xaxaxaZxaxaxaZ
......
...
...
2211
22221212
12121111
where 1... 2
1212
211 paaa , 1... 2
2222
221 paaa , etc. The coefficients ij are chosen so that
the explained variance of the original data is maximized (i.e. the squared difference of the new variable values and their respective means is maximized in relation to the total variance of the untransformed data). The results for paaa 11211 ,.., determine the first principal component. The second principal component with coefficients paaa 22221 ,.., is then obtained analogously by maximizing the variance orthogonal to the direction of the first component, and so forth. Orthogonality of the principal components means that they are statistically independent so that any changes in one component do not impact the others. This is sometimes a desirable feature of composite indicators.
The consecutive process of maximizing residual variance implies that at every step less variance is remaining. Once it falls below a specified threshold, the procedure is stopped and no additional principal components are calculated. Several criteria exist to determine the threshold value. Several methods consider the eigenvalues of the data matrix. The eigenvalue, , is the value that solves the detrimental equation: 0 IR , where R is the )( pp correlation matrix calculated from standardised data for the 48n African countries and p indicators ( or sub-pillars) and I is the identity matrix. This provides a p-th degree polynomial equation in and hence K roots. These roots are called eigenvalues of the correlation matrix R. Next is arranged in descending order of magnitude, as p ...21 . Corresponding to each value
Created with novaPDF Printer (www.novaPDF.com). Please register to remove this message.

63
of λ , the matrix equation 0)( aIR is solved for the 1p eigenvectors a , subject to the condition that 1aa (normalization condition).
Standard practice is to choose relevant dimensions (principal components) if they: (a) have associated eigenvalues greaten than 1.0 (Kaiser’s rule); 2. individually account to total variance by more than 10%; 3. cumulatively contribute to total variance by more than 60% (OECD, 2008). A more conservative Joliffe criterion suggests choosing relevant dimensions whose eigenvalue is greater than 0.7. These criteria were used in the analysis of the dataset (at the indicators’ and at the sub-pillars’ level) for the Index of African Governance.
Non-linear PCA, also called Categorical PCA has been specifically developed to handle categorical indicators or indicators of both qualitative and quantitative type (Gifi, 1990, Michailidis and de Leeuw, 1998). Non-linear PCA is a particular exploratory analysis technique which allows for synthesizing variables in one or more dimensions simultaneously preserving measurement levels of categorical data. It is then capable of handling at the same time qualitative (with either ordered or non ordered categories) and quantitative indicators. In the case of qualitative indicators with ordered categories the method provides a quantification of categories for each indicator while preserving their relative order. In other terms, if the measurement level of an indicator is ‘low’; ‘medium’, ‘high’ the corresponding quantified indicator will assume three not-decreasing numerical values associated respectively to the ‘low’, ‘medium’ and ‘high’ category. Equal quantifications are allowed, in this case two different original categories are associated to the same value. This often implies category redundancy helping the optimization of the related survey. The method is based on an algorithm which simultaneously computes optimal quantification of ordinal variables and scores of dimensions of the reduced space. Major outputs of the methods are optimal category quantifications of qualitative indicators, loadings of indicators and standardized unit scores. The interpretation of major outputs are similar to that offered by standard PCA. Still it is worth noting that, unlike standard PCA, in non-linear PCA the solutions in subspaces of different dimensions are not nested. This means that, once the relevant dimensions are identified, the model has to be re-run again with that exact number of dimensions..
Factor analysis (FA) is similar to PCA. It also aims at describing the set of p indicators ),...,,( 21 pxxxX in terms of a smaller number of q factors, and highlight the relationship
between these variables. However, whereas PCA simply is based on linear data combinations, FA is based on a rather special model that assumes that the data are composed of common and unique factors, and consequently, that the data variance can be decomposed into that accounted for by the common and the unique factors. The model is given by:
pqpqppp
FaFaFax
FaFaFaxFaFaFax
......
...
...
2211
222221212
112121111
As previously ),...,1( pixi represents the original variables (but standardized with zero mean and unit variance); pii aaa 121 ,.., are called factor loadings related to the variable ix ;
qFFF ,...,, 21 are the uncorrelated common factors, each with zero mean and unit variance; and
p ,...,, 21 are the specific factors assumed to be independently and identically distributed with zero mean. There are several approaches to deal with this FA model, e.g. communalities,
Created with novaPDF Printer (www.novaPDF.com). Please register to remove this message.

64
maximum likelihood factors, centroid method, principal axis method, etc. The most common is the use of PCA to extract the first q principal components and consider them as factors and neglect the remaining. Principal components factor analysis is most preferred in the development of composite indicators, e.g., Product Market Regulation Index (Nicoletti et al., 2000), as it has the virtue of simplicity and ensures that the resulting factors account for a large part of the cross-community variance of the underlying indicators. In fact, in factor analysis the focus is set only on those indicators of lifelong learning that are potentially useful for explaining the cross-community variation in learning environments (indicators values that are similar across communities are of little interest and cannot possibly explain differences in overall performance). Thus, the factors are constructed without pre-empting the conclusions of the analysis, since analyst’s beliefs are not considered.
Factor analysis was used in some of the alternative scenarios to build the Index of African Governance (e.g., Scenario 4, 5, etc.). After choosing the number of factors to keep, we applied rotation, a standard step that aims at performed to enhance the interpretability of the results (Darton, 1980). The sum of eigenvalues is not affected by rotation, but changing the axes, will alter the eigenvalues of particular factors and will change the factor loadings. There are various rotational strategies that have been proposed in the literature. The goal of all of these strategies is to obtain a clear pattern of loadings. However, different rotations imply different loadings, and thus different meanings of principal components - a problem some cite as a drawback to the method. We used the most common rotation method, the “varimax rotation”.
Cronbach’s alpha allows to study the internal consistency of groups of indicators by indicating the extend to which a set of indicators can be treated as measuring a single latent phenomenon (Cronbach, 1951). Cronbach’s can take values between negative infinity and 1, although only positive values make sense. If a scale has an alpha above 0.60, it is usually considered to be internally consistent, even if some authors suggest higher thresholds: for instance 0.7 by Nunnally (1978) or 0.80 by De Vellis (1991). This approach was used to confirm the single latent phenomenon captured by the indicators underlying single sub-pillars (e.g., in the case of six indicators under the National Security sub-pillar, or three indicators under the Ratification of Norms sub-pillar).
Created with novaPDF Printer (www.novaPDF.com). Please register to remove this message.

65
Box 2. Cluster Analysis and its role in the analysis of the Index of African Governance Cluster analysis refers to a rich suite of statistical classification methods used to determine similarities or dissimilarities of objects in large datasets (see Kaufman and Rousseeuw, 1990 for a broad introduction to this field). We used this technique to identify groups of the 48 countries south of Sahara according to the 14 sub-pillars of governance. Within each cluster, countries have a better basis for benchmarking their governance policies and priorities and identifying best practices (thus setting short-term targets) because the members of the cluster are similar with respect to the data used to classify them and the differences across the groups are maximized.
In this context, the question of interest in carrying out a cluster analysis of the 14 sub-pillars of Governance (without assuming a five pillar structure, for the moment) is whether there are similarities among African countries in their governance related issues.
There is no best method for cluster analysis and the results of cluster analyses are subject to interpretation. Therefore, we applied two different algorithms. Specifically, we explored the data structure using a non-parametric, distance-based agglomerative clustering algorithm known as Ward’s method. A feature of agglomerative clustering is that it starts with as many individual clusters as there are countries. It then successively combines countries that are most similar to each other with respect to a quantitative similarity measure until all countries are joined in a single cluster. The similarity measure decreases during this process, while the within-cluster dissimilarity increases as more and more countries are added.
The trade-off lies therefore in choosing a similarity measure, or “pruning value,” that yields both a relatively small number of clusters and a high level of similarity. We determine that three clusters yield a reasonable division between the 48 African countries. After determining the number of clusters, we use the k-means clustering method developed by Hartigan and Wong (1979) to determine cluster membership. k-means is a non-hierarchical method that requires that the number of clusters, k, be specified upfront (hence the preliminary use of Ward’s method) and then iteratively finds the disjoint partition of the objects into k homogeneous groups such that the sum of squares within the clusters is minimized. The algorithm converges in fewer than 10 iterations for the 14 sub-pillars and the 48 countries.
Created with novaPDF Printer (www.novaPDF.com). Please register to remove this message.
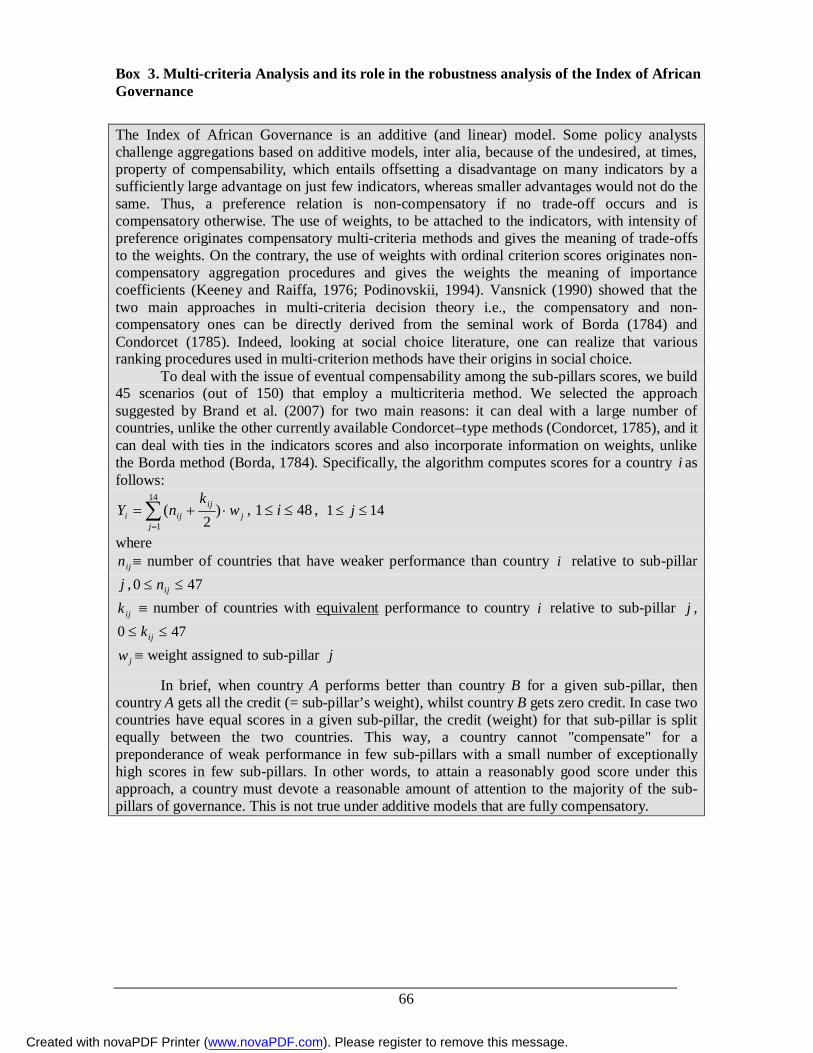
66
Box 3. Multi-criteria Analysis and its role in the robustness analysis of the Index of African Governance The Index of African Governance is an additive (and linear) model. Some policy analysts challenge aggregations based on additive models, inter alia, because of the undesired, at times, property of compensability, which entails offsetting a disadvantage on many indicators by a sufficiently large advantage on just few indicators, whereas smaller advantages would not do the same. Thus, a preference relation is non-compensatory if no trade-off occurs and is compensatory otherwise. The use of weights, to be attached to the indicators, with intensity of preference originates compensatory multi-criteria methods and gives the meaning of trade-offs to the weights. On the contrary, the use of weights with ordinal criterion scores originates non-compensatory aggregation procedures and gives the weights the meaning of importance coefficients (Keeney and Raiffa, 1976; Podinovskii, 1994). Vansnick (1990) showed that the two main approaches in multi-criteria decision theory i.e., the compensatory and non-compensatory ones can be directly derived from the seminal work of Borda (1784) and Condorcet (1785). Indeed, looking at social choice literature, one can realize that various ranking procedures used in multi-criterion methods have their origins in social choice.
To deal with the issue of eventual compensability among the sub-pillars scores, we build 45 scenarios (out of 150) that employ a multicriteria method. We selected the approach suggested by Brand et al. (2007) for two main reasons: it can deal with a large number of countries, unlike the other currently available Condorcet–type methods (Condorcet, 1785), and it can deal with ties in the indicators scores and also incorporate information on weights, unlike the Borda method (Borda, 1784). Specifically, the algorithm computes scores for a country i as follows:
jj
ijiji w
knY
)2
(14
1
, 481 i , 141 j
where ijn number of countries that have weaker performance than country i relative to sub-pillar
j , 470 ijn
ijk number of countries with equivalent performance to country i relative to sub-pillar j , 470 ijk
jw weight assigned to sub-pillar j
In brief, when country A performs better than country B for a given sub-pillar, then country A gets all the credit (= sub-pillar’s weight), whilst country B gets zero credit. In case two countries have equal scores in a given sub-pillar, the credit (weight) for that sub-pillar is split equally between the two countries. This way, a country cannot "compensate" for a preponderance of weak performance in few sub-pillars with a small number of exceptionally high scores in few sub-pillars. In other words, to attain a reasonably good score under this approach, a country must devote a reasonable amount of attention to the majority of the sub-pillars of governance. This is not true under additive models that are fully compensatory.
Created with novaPDF Printer (www.novaPDF.com). Please register to remove this message.

67
Box 4. Data Envelopment Analysis and its role in the robustness analysis of the Index of African Governance In absence of reliable information about the true weights to be attached to the 14 sub-pillars of Governance, we endogenously selected those country-specific weights that maximize a country’s score with respect to the 48n countries in the dataset using Data Envelopment Analysis (DEA) (Melyn & Moesen, 1991; Cherchye et al., 2004). This gives the following linear programming problem for each country i :
14
1
14
1
maxmax
jijcjdatasety
jijij
wiji
wy
wyY
c
(bounding constraint)
Subject to 0ijw , where 14,...,1j , 48,...,1i (non-negativity constraint)
In this basic programming problem, the weights are non-negative and a country’s score is
between 0 (worst) and 1 (best).
However, this traditional DEA model, though suitable for classifying countries into efficient and inefficient ones, it is not very appropriate for ranking countries, since the weights are country-specific. Cross efficiency evaluation method, proposed by Sexton, Silkman, and Hogan (1986), is a DEA extension tool that could be utilized to identify good overall performers and rank countries. The main idea is to use DEA in a peer evaluation instead of a self-evaluation. There are at least three advantages for cross-evaluation method. Firstly, it provides a unique ordering of the countries. Secondly, it eliminates unrealistic weight schemes without requiring the elicitation of weight restrictions from application area experts (Anderson, Hollingsworth, & Inman, 2002). Finally, the cross efficiency means can act effectively to differentiate between good and poor performers (Boussofiane, Dyson, & Thanassoulis, 1991). Therefore the cross-evaluation method is widely used for ranking performance of decision making units (Sexton et al., 1986; Shang & Sueyoshi, 1995).
In brief, the linear programming problem is solved for each country and the n sets of weights are used to calculate n DEA scores for each country. The average of those n scores for each country is used for the overall assessment of countries performance and final ranking.
Created with novaPDF Printer (www.novaPDF.com). Please register to remove this message.
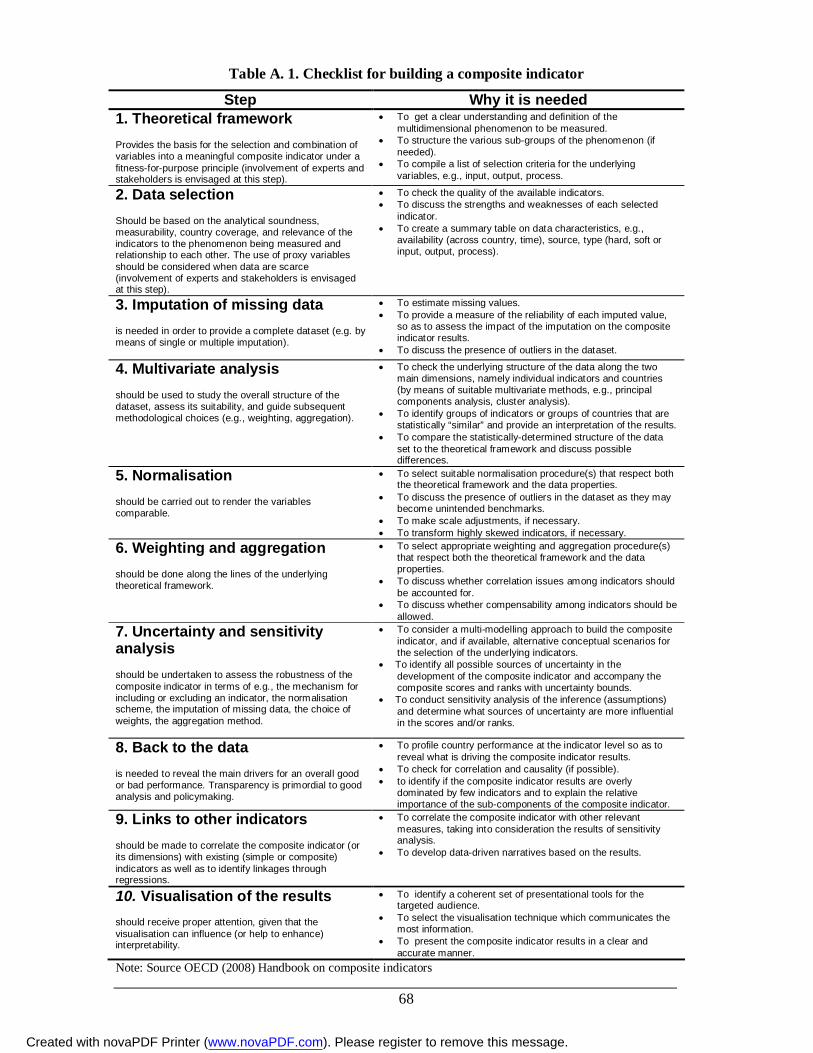
68
Table A. 1. Checklist for building a composite indicator
Step Why it is needed 1. Theoretical framework Provides the basis for the selection and combination of variables into a meaningful composite indicator under a fitness-for-purpose principle (involvement of experts and stakeholders is envisaged at this step).
To get a clear understanding and definition of the multidimensional phenomenon to be measured.
To structure the various sub-groups of the phenomenon (if needed).
To compile a list of selection criteria for the underlying variables, e.g., input, output, process.
2. Data selection Should be based on the analytical soundness, measurability, country coverage, and relevance of the indicators to the phenomenon being measured and relationship to each other. The use of proxy variables should be considered when data are scarce (involvement of experts and stakeholders is envisaged at this step).
To check the quality of the available indicators. To discuss the strengths and weaknesses of each selected
indicator. To create a summary table on data characteristics, e.g.,
availability (across country, time), source, type (hard, soft or input, output, process).
3. Imputation of missing data is needed in order to provide a complete dataset (e.g. by means of single or multiple imputation).
To estimate missing values. To provide a measure of the reliability of each imputed value,
so as to assess the impact of the imputation on the composite indicator results.
To discuss the presence of outliers in the dataset.
4. Multivariate analysis should be used to study the overall structure of the dataset, assess its suitability, and guide subsequent methodological choices (e.g., weighting, aggregation).
To check the underlying structure of the data along the two main dimensions, namely individual indicators and countries (by means of suitable multivariate methods, e.g., principal components analysis, cluster analysis).
To identify groups of indicators or groups of countries that are statistically “similar” and provide an interpretation of the results.
To compare the statistically-determined structure of the data set to the theoretical framework and discuss possible differences.
5. Normalisation should be carried out to render the variables comparable.
To select suitable normalisation procedure(s) that respect both the theoretical framework and the data properties.
To discuss the presence of outliers in the dataset as they may become unintended benchmarks.
To make scale adjustments, if necessary. To transform highly skewed indicators, if necessary.
6. Weighting and aggregation should be done along the lines of the underlying theoretical framework.
To select appropriate weighting and aggregation procedure(s) that respect both the theoretical framework and the data properties.
To discuss whether correlation issues among indicators should be accounted for.
To discuss whether compensability among indicators should be allowed.
7. Uncertainty and sensitivity analysis should be undertaken to assess the robustness of the composite indicator in terms of e.g., the mechanism for including or excluding an indicator, the normalisation scheme, the imputation of missing data, the choice of weights, the aggregation method.
To consider a multi-modelling approach to build the composite indicator, and if available, alternative conceptual scenarios for the selection of the underlying indicators.
To identify all possible sources of uncertainty in the development of the composite indicator and accompany the composite scores and ranks with uncertainty bounds.
To conduct sensitivity analysis of the inference (assumptions) and determine what sources of uncertainty are more influential in the scores and/or ranks.
8. Back to the data is needed to reveal the main drivers for an overall good or bad performance. Transparency is primordial to good analysis and policymaking.
To profile country performance at the indicator level so as to reveal what is driving the composite indicator results.
To check for correlation and causality (if possible). to identify if the composite indicator results are overly
dominated by few indicators and to explain the relative importance of the sub-components of the composite indicator.
9. Links to other indicators should be made to correlate the composite indicator (or its dimensions) with existing (simple or composite) indicators as well as to identify linkages through regressions.
To correlate the composite indicator with other relevant measures, taking into consideration the results of sensitivity analysis.
To develop data-driven narratives based on the results.
10. Visualisation of the results should receive proper attention, given that the visualisation can influence (or help to enhance) interpretability.
To identify a coherent set of presentational tools for the targeted audience.
To select the visualisation technique which communicates the most information.
To present the composite indicator results in a clear and accurate manner.
Note: Source OECD (2008) Handbook on composite indicators
Created with novaPDF Printer (www.novaPDF.com). Please register to remove this message.

69
Table A. 2. Summary statistics for the Pillars and Sub-pillars of Governance Mean Min Max Variance Skewness
Pillar Safety and Security 76.6 29.0 100.0 232.6 -1.1 Rule of Law, Transpar., Corruption 52.6 8.2 86.1 251.4 0.0 Participation and Human Rights 57.6 6.4 92.2 556.2 -0.6 Sustainable Economic Opportunity 41.4 23.3 71.4 117.0 0.9 Human Development 51.1 15.2 89.9 204.8 0.2 Index of African Governance 55.8 18.9 85.1 158.8 -0.3
Sub-pillar National Security 87.9 43.4 100.0 130.0 -1.8 Safety and
Security Public Safety 54.2 0.0 100.0 886.5 -0.4 Legal Norms 69.0 16.7 100.0 381.0 -1.0 Judicial Independence 52.6 0.0 88.0 330.9 -0.4
Rule of Law, Transparency, and Corruption Corruption 36.1 8.0 88.0 345.1 1.3
Participation in elections 57.8 0.0 100.0 1121.2 -0.7 Participation & Human Rights Civil and Political Rights 57.4 12.9 84.3 303.9 -0.6
Wealth Creation 29.5 14.0 57.2 76.6 1.3 Financial Integrity 75.6 37.5 89.9 92.3 -2.2 Arteries of Commerce 13.4 1.3 99.8 327.3 3.1
Sustainable Economic Opportunity
Environmental Sensitivity 48.1 0.0 100.0 558.7 0.0 Poverty 44.2 0.0 91.0 429.6 -0.4 Health and Sanitation 53.2 30.3 96.5 172.8 1.0
Human Development
Education 56.3 0.0 97.2 445.6 -0.2
Created with novaPDF Printer (www.novaPDF.com). Please register to remove this message.

70
Table A. 3. Sensitivity analysis results: impact of the assumptions on the Index ranking Scenario Weighting Aggregation Excluded indicator 50th
percentile
(shift in rank)
90th percentile
(shift in
rank)
Spearman rank coefficient
(with respect to
original ranking)
RMSE
(with respect to original
ranking) 1 Original Arithmetic None 0 0 1.000 0.00 2 Original Geometric None 2 5 0.975 3.08 3 Original MCA None 2 5 0.970 3.41 4 FA Arithmetic None 1 6 0.970 3.36 5 FA Geometric None 2 8 0.949 4.41 6 FA MCA None 1 9 0.936 4.97 7 EW Arithmetic None 1 4 0.989 2.06 8 EW Geometric None 2 6 0.959 3.98 9 EW MCA None 2 8 0.946 4.53 10 DEA Arithmetic None 1 4 0.984 2.52 11 Original Arithmetic National Security 0 3 0.995 1.38 12 Original Arithmetic Public Safety 1 4 0.988 2.10 13 Original Arithmetic Legal Norms 1 2 0.993 1.58 14 Original Arithmetic Judicial Independence 1 2 0.993 1.61 15 Original Arithmetic Corruption 0 2 0.997 1.15 16 Original Arithmetic Participation 1 8 0.951 4.33 17 Original Arithmetic Civil and Political Rights 1 3 0.987 2.25 18 Original Arithmetic Wealth Creation 0 1 0.998 0.87 19 Original Arithmetic Financial Integrity 0 1 0.999 0.74 20 Original Arithmetic Arteries of Commerce 0 1 0.999 0.65 21 Original Arithmetic Environmental Sensitivity 1 3 0.992 1.77 22 Original Arithmetic Poverty 1 4 0.985 2.41 23 Original Arithmetic Health and Sanitation 0 1 0.999 0.74 24 Original Arithmetic Education 1 3 0.991 1.81 25 Original Geometric National Security 1 5 0.976 3.04 26 Original Geometric Public Safety 2.5 6 0.958 4.04 27 Original Geometric Legal Norms 2 5 0.976 3.06 28 Original Geometric Judicial Independence 1 6 0.972 3.30 29 Original Geometric Corruption 1.5 6 0.963 3.79 30 Original Geometric Participation 2.5 10 0.914 5.76 31 Original Geometric Civil and Political Rights 1 6 0.963 3.78 32 Original Geometric Wealth Creation 2 5 0.970 3.39 33 Original Geometric Financial Integrity 2 6 0.975 3.11 34 Original Geometric Arteries of Commerce 1 5 0.970 3.38 35 Original Geometric Environmental Sensitivity 1 4 0.980 2.75 36 Original Geometric Poverty 2 7 0.963 3.76 37 Original Geometric Health and Sanitation 1.5 5 0.974 3.19 38 Original Geometric Education 2 5 0.973 3.20 39 Original MCA National Security 1 6 0.970 3.39 40 Original MCA Public Safety 2 8 0.953 4.26 41 Original MCA Legal Norms 2 4 0.970 3.39 42 Original MCA Judicial Independence 2 5 0.964 3.72 43 Original MCA Corruption 2 6 0.973 3.22 44 Original MCA Participation 3 9 0.935 5.00 45 Original MCA Civil and Political Rights 2 6 0.957 4.06 46 Original MCA Wealth Creation 1.5 4 0.976 3.06 47 Original MCA Financial Integrity 2 5 0.970 3.37 48 Original MCA Arteries of Commerce 1 6 0.973 3.24 49 Original MCA Environmental Sensitivity 2 5 0.967 3.57 50 Original MCA Poverty 2 6 0.954 4.19 51 Original MCA Health and Sanitation 2 5 0.963 3.75 52 Original MCA Education 2 6 0.968 3.51
Created with novaPDF Printer (www.novaPDF.com). Please register to remove this message.

71
Scenario Weighting Aggregation Excluded indicator 50th percentile
(shift in
rank)
90th percentile
(shift in
rank)
Spearman rank coefficient
(with respect to
original ranking)
RMSE
(with respect to original
ranking) 53 FA Arithmetic National Security 1 6 0.968 3.49 54 FA Arithmetic Public Safety 1 7 0.958 4.02 55 FA Arithmetic Legal Norms 1 6 0.977 2.99 56 FA Arithmetic Judicial Independence 1 5 0.972 3.28 57 FA Arithmetic Corruption 2 5 0.969 3.43 58 FA Arithmetic Participation 3 9 0.927 5.30 59 FA Arithmetic Civil and Political Rights 2 8 0.942 4.73 60 FA Arithmetic Wealth Creation 1 5 0.976 3.01 61 FA Arithmetic Financial Integrity 1 5 0.975 3.12 62 FA Arithmetic Arteries of Commerce 1 4 0.983 2.56 63 FA Arithmetic Environmental Sensitivity 1 4 0.981 2.72 64 FA Arithmetic Poverty 2 6 0.963 3.76 65 FA Arithmetic Health and Sanitation 1 5 0.976 3.01 66 FA Arithmetic Education 1 4 0.989 2.04 67 FA Geometric National Security 3 8 0.943 4.69 68 FA Geometric Public Safety 3 8 0.935 4.97 69 FA Geometric Legal Norms 2 7 0.949 4.43 70 FA Geometric Judicial Independence 2 7 0.942 4.71 71 FA Geometric Corruption 2 10 0.930 5.18 72 FA Geometric Participation 4 11 0.872 7.00 73 FA Geometric Civil and Political Rights 3 10 0.921 5.50 74 FA Geometric Wealth Creation 2 8 0.947 4.52 75 FA Geometric Financial Integrity 2 8 0.947 4.53 76 FA Geometric Arteries of Commerce 1 4 0.979 2.85 77 FA Geometric Environmental Sensitivity 1 5 0.966 3.59 78 FA Geometric Poverty 2 9 0.937 4.93 79 FA Geometric Health and Sanitation 2 8 0.953 4.25 80 FA Geometric Education 1.5 5 0.966 3.61 81 FA MCA National Security 2 9 0.919 5.58 82 FA MCA Public Safety 2 9 0.921 5.51 83 FA MCA Legal Norms 2.5 9 0.924 5.40 84 FA MCA Judicial Independence 2 8 0.927 5.29 85 FA MCA Corruption 3 9 0.921 5.52 86 FA MCA Participation 2 9 0.902 6.14 87 FA MCA Civil and Political Rights 2 10 0.903 6.12 88 FA MCA Wealth Creation 1 7 0.952 4.30 89 FA MCA Financial Integrity 2 8 0.935 4.98 90 FA MCA Arteries of Commerce 2 8 0.959 3.97 91 FA MCA Environmental Sensitivity 2 8 0.936 4.94 92 FA MCA Poverty 2 8 0.930 5.18 93 FA MCA Health and Sanitation 1 8 0.938 4.88 94 FA MCA Education 2 7 0.950 4.39 95 EW Arithmetic National Security 1 4 0.987 2.23 96 EW Arithmetic Public Safety 2 6 0.967 3.56 97 EW Arithmetic Legal Norms 1 3 0.990 1.99 98 EW Arithmetic Judicial Independence 1 5 0.985 2.39 99 EW Arithmetic Corruption 1 4 0.984 2.44 100 EW Arithmetic Participation 2 9 0.934 5.05 101 EW Arithmetic Civil and Political Rights 2 6 0.976 3.04 102 EW Arithmetic Wealth Creation 1 4 0.988 2.11 103 EW Arithmetic Financial Integrity 1 4 0.989 2.06 104 EW Arithmetic Arteries of Commerce 1 4 0.988 2.14 105 EW Arithmetic Environmental Sensitivity 1 3 0.991 1.90 106 EW Arithmetic Poverty 1 5 0.976 3.03
Created with novaPDF Printer (www.novaPDF.com). Please register to remove this message.

72
Scenario Weighting Aggregation Excluded indicator 50th percentile
(shift in
rank)
90th percentile
(shift in
rank)
Spearman rank coefficient
(with respect to
original ranking)
RMSE
(with respect to original
ranking) 107 EW Arithmetic Health and Sanitation 1 3 0.991 1.87 108 EW Arithmetic Education 1 3 0.989 2.01 109 EW Geometric National Security 2 7 0.957 4.05 110 EW Geometric Public Safety 3 8 0.932 5.10 111 EW Geometric Legal Norms 2 6 0.958 4.03 112 EW Geometric Judicial Independence 2 6 0.958 4.02 113 EW Geometric Corruption 2 8 0.944 4.64 114 EW Geometric Participation 3 11 0.892 6.45 115 EW Geometric Civil and Political Rights 3 8 0.944 4.65 116 EW Geometric Wealth Creation 2 8 0.954 4.22 117 EW Geometric Financial Integrity 2 8 0.953 4.26 118 EW Geometric Arteries of Commerce 1 4 0.970 3.42 119 EW Geometric Environmental Sensitivity 1 5 0.975 3.11 120 EW Geometric Poverty 2 9 0.940 4.81 121 EW Geometric Health and Sanitation 2 6 0.959 3.98 122 EW Geometric Education 2 6 0.962 3.80 123 EW MCA National Security 2 8 0.931 5.16 124 EW MCA Public Safety 2 8 0.923 5.42 125 EW MCA Legal Norms 2 8 0.949 4.41 126 EW MCA Judicial Independence 2 8 0.940 4.81 127 EW MCA Corruption 2 7 0.938 4.89 128 EW MCA Participation 2 8 0.911 5.84 129 EW MCA Civil and Political Rights 2.5 8 0.923 5.44 130 EW MCA Wealth Creation 1 7 0.964 3.73 131 EW MCA Financial Integrity 2 8 0.948 4.45 132 EW MCA Arteries of Commerce 1.5 7 0.958 3.99 133 EW MCA Environmental Sensitivity 2 8 0.943 4.66 134 EW MCA Poverty 2 7 0.937 4.91 135 EW MCA Health and Sanitation 2 8 0.941 4.77 136 EW MCA Education 2 7 0.958 4.03 137 DEA Arithmetic National Security 1 4 0.984 2.50 138 DEA Arithmetic Public Safety 2 6 0.968 3.53 139 DEA Arithmetic Legal Norms 2 5 0.982 2.69 140 DEA Arithmetic Judicial Independence 1 5 0.977 2.99 141 DEA Arithmetic Corruption 2 4 0.981 2.74 142 DEA Arithmetic Participation 2 10 0.918 5.68 143 DEA Arithmetic Civil and Political Rights 1 5 0.979 2.88 144 DEA Arithmetic Wealth Creation 1 4 0.987 2.34 145 DEA Arithmetic Financial Integrity 1.5 4 0.982 2.66 146 DEA Arithmetic Arteries of Commerce 2 5 0.979 2.89 147 DEA Arithmetic Environmental Sensitivity 2 7 0.969 3.48 148 DEA Arithmetic Poverty 2 6 0.968 3.51 149 DEA Arithmetic Health and Sanitation 1 5 0.982 2.65 150 DEA Arithmetic Education 1 5 0.977 3.02
Created with novaPDF Printer (www.novaPDF.com). Please register to remove this message.
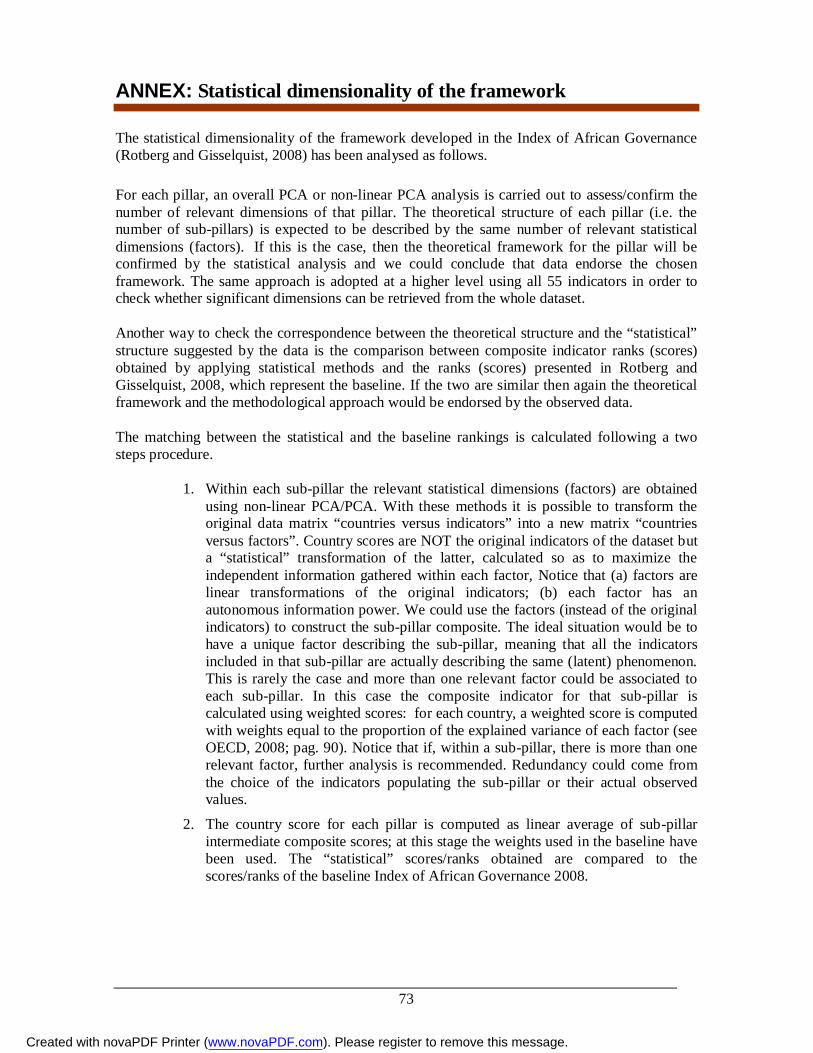
73
ANNEX: Statistical dimensionality of the framework
The statistical dimensionality of the framework developed in the Index of African Governance (Rotberg and Gisselquist, 2008) has been analysed as follows.
For each pillar, an overall PCA or non-linear PCA analysis is carried out to assess/confirm the number of relevant dimensions of that pillar. The theoretical structure of each pillar (i.e. the number of sub-pillars) is expected to be described by the same number of relevant statistical dimensions (factors). If this is the case, then the theoretical framework for the pillar will be confirmed by the statistical analysis and we could conclude that data endorse the chosen framework. The same approach is adopted at a higher level using all 55 indicators in order to check whether significant dimensions can be retrieved from the whole dataset.
Another way to check the correspondence between the theoretical structure and the “statistical” structure suggested by the data is the comparison between composite indicator ranks (scores) obtained by applying statistical methods and the ranks (scores) presented in Rotberg and Gisselquist, 2008, which represent the baseline. If the two are similar then again the theoretical framework and the methodological approach would be endorsed by the observed data.
The matching between the statistical and the baseline rankings is calculated following a two steps procedure.
1. Within each sub-pillar the relevant statistical dimensions (factors) are obtained using non-linear PCA/PCA. With these methods it is possible to transform the original data matrix “countries versus indicators” into a new matrix “countries versus factors”. Country scores are NOT the original indicators of the dataset but a “statistical” transformation of the latter, calculated so as to maximize the independent information gathered within each factor, Notice that (a) factors are linear transformations of the original indicators; (b) each factor has an autonomous information power. We could use the factors (instead of the original indicators) to construct the sub-pillar composite. The ideal situation would be to have a unique factor describing the sub-pillar, meaning that all the indicators included in that sub-pillar are actually describing the same (latent) phenomenon. This is rarely the case and more than one relevant factor could be associated to each sub-pillar. In this case the composite indicator for that sub-pillar is calculated using weighted scores: for each country, a weighted score is computed with weights equal to the proportion of the explained variance of each factor (see OECD, 2008; pag. 90). Notice that if, within a sub-pillar, there is more than one relevant factor, further analysis is recommended. Redundancy could come from the choice of the indicators populating the sub-pillar or their actual observed values.
2. The country score for each pillar is computed as linear average of sub-pillar intermediate composite scores; at this stage the weights used in the baseline have been used. The “statistical” scores/ranks obtained are compared to the scores/ranks of the baseline Index of African Governance 2008.
Created with novaPDF Printer (www.novaPDF.com). Please register to remove this message.

74
Pillar Safety and Security The pillar Safety and Security is divided into two sub-pillars, National Security and Public Safety. The variables populating the pillar are all quantitative but two (access to small arms and light weapons, level of violent crime) that are qualitative. Non-linear PCA is employed Table A4 displays the results when considering simultaneously all 7 indicators and confirms the existence of 2 relevant dimensions. Those two factors account for more than 60% of the variance and display a high Cronbach’s Alpha (at least the first factor) indicating a high ability to capture the latent phenomenon.
Table A4. Summary for the pillar Safety and Security, 7 indicators
Safety and Security
Variance Accounted For
Dimension
Cronbach's
Alpha Total (Eigenvalue) % of Variance
1 .789 3.090 44.149
2 .152 1.150 16.432
3 -.193 .858 12.257
4 -.603 .659 9.418
5 -.738 .613 8.752
6 -1.586 .424 6.055
7 -4.510 .206 2.936
Total 1.000a 7.000 100.000
a. Total Cronbach's Alpha is based on the total Eigenvalue.
Table A5 displays the results of the non-linear PCA for the sub-pillar National Security (the sub-pillar Public safety only has 1 indicator and thus PCA cannot be run). Two relevant dimensions are found. This requires the re-run of the non linear PCA imposing 2 factors (Table A6). From the corresponding eigenvalues the weights are calculated as: 962.3
814.21 w and
962.3148.1
2 w and used for computing the “statistical ranking” of the sub-pillar National
security. Pillar’s ranking (or statistical rank) is then obtained by linearly aggregating the statistical scores for National security and the indicator of Public safety with the baseline weights (2/3, 1/3 respectively). Figure A1 shows the difference between the statistical analysis (stat rank) and the baseline pillar ranking.
Created with novaPDF Printer (www.novaPDF.com). Please register to remove this message.

75
Table A5. Summary for the pillar Safety and Security, sub-pillar National Security
Total (Eigenvalue)
% of Variance 1 2
1 0.768 2.775 46.258 Number of Battle-Deaths 0.82 -0.342
2 0.116 1.107 18.45 Refugees and Asylum Seekers Originating From
the Country
0.581 0.616
3 -0.253 0.826 13.767 Ease of Access to Small Arms and Light Weapons
0.515 0.716
4 -0.66 0.645 10.754 Government Involvement in Armed Conflicts
0.764 -0.299
5 -1.602 0.428 7.139 Number of Civilian Deaths Due to One-Sided
Violence
0.675 -0.171
6 -4.306 0.218 3.633 Internally-Displaced People
0.706 -0.146
Total 1.000a 6 100
Component Loadings
Dimension
National Security
DimensionCronbach's
Alpha
Variance Accounted For
Table A6. Sub-pillar Public Safety, non-linear PCA on 2 factors.
Public Safety
Variance Accounted For
Dimension
Cronbach's
Alpha Total
(Eigenvalue) % of Variance
1 .773 2.814 46.892
2 .155 1.148 19.138
Total .897a 3.962 66.031
a. Total Cronbach's Alpha is based on the total Eigenvalue.
The two rankings are very similar. Spearman rank correlation coefficient is quite high at 0.93. The median impact is a two-position change and only one country shifts ten positions or more (Eritrea: max shift = 12).
Created with novaPDF Printer (www.novaPDF.com). Please register to remove this message.

76
Figure A1. Pillar Safety and Security, differences between the Index of African Governance (IAG) for the pillar and the index based on statistical analysis (stat-rank)
rank differences (IAG rank - stat rank)
-15
-10
-5
0
5
10
15
Ang
ola
Ben
inB
otsw
ana
Bur
kina
Fas
oB
urun
diC
amer
oon
Cap
e Ve
rde
Cen
tral
Afr
ican
Cha
dC
omor
osC
ongo
Con
go,
Cot
e d'
Ivoi
reD
jibou
tiEq
uato
rial G
uine
aEr
itrea
Ethi
opia
Gab
onG
ambi
aG
hana
Gui
nea
Gui
nea-
Bis
sau
Ken
yaLe
soth
oLi
beria
Mad
agas
car
Mal
awi
Mal
iM
aurit
ania
Mau
ritiu
sM
ozam
biqu
eN
amib
iaN
iger
Nig
eria
Rw
anda
Sao
Tom
e an
dSe
nega
lSe
yche
lles
Sier
ra L
eone
Som
alia
Sout
h A
fric
aSu
dan
Swaz
iland
Tanz
ania
Togo
Uga
nda
Zam
bia
Zim
babw
e
Pillar Rule of Law, Transparency and Corruption The pillar Rule of Law, Transparency and Corruption is divided in three sub-pillars: Ratification of Critical Legal Norms, Judicial Independence and Efficiency, Corruption. Overall it has 4 quantitative, 2 qualitative and 1 dichotomous variables, therefore non-linear PCE has to be employed. Table A7 displays the results when considering simultaneously all 7 indicators and confirms the existence of 3 relevant dimensions. Those two factors account for more than 70% of the variance and display a high Cronbach’s Alpha indicating a high ability to capture the latent phenomenon.
Created with novaPDF Printer (www.novaPDF.com). Please register to remove this message.

77
Table A7. Summary for the pillar Rule of Law, Transparency and Corruption, 7 indicators.
Rule of Law, Transparency and Corruption
Variance Accounted For
Dimension
Cronbach's
Alpha Total (Eigenvalue)
1 .731 2.675
2 .302 1.349
3 .221 1.234
4 -.295 .798
5 -.525 .690
6 -2.217 .345
7 -5.360 .179
Total 1.006a 7.270
a. Total Cronbach's Alpha is based on the total Eigenvalue.
Non-linear PCA can be conducted at the sub-pillar level only for the sub-pillars Ratification of critical legal norms and Judicial independence and efficiency, since the third pillar has only 1 indicator. Results are summarised in Tables A8 and A9.
Table A8. Summary for the pillar Rule of Law, Transparency and Corruption, sub-pillar Ratification of Critical Legal Norms.
Variance Accounted
For
Total (Eigenvalue) 1 2
1 0.519 1.529 Ratification of International Human Rights Conventions
1.033 0.645
2 0.396 1.359 presence of International Sanctions
-0.567 0.684
3 -0.729 0.673 Laws on Contracts and Property Rights
-0.381 0.73
Total 1.079a 3.562
Component Loadings
Dimension
a. Total Cronbach's Alpha is based on the total Eigenvalue.
Ratification of critical legal norms
DimensionCronbach's
Alpha
Created with novaPDF Printer (www.novaPDF.com). Please register to remove this message.

78
Table A9. Sub-pillar Ratification of critical legal norms, non-linear PCA on 2 factors
Ratification of Critical Legal Norms
Variance Accounted
For
Dimension
Cronbach's
Alpha Total (Eigenvalue)
1 .522 1.534
2 .442 1.417
Total .992a 2.951
a. Total Cronbach's Alpha is based on the total Eigenvalue.
In order to calculate the “statistical ranking” for the sub-pillar Ratification of critical legal norms, non-linear PCA is run again constraining it to consider only 2 factors. The eigenvalues so found (and the associated countries’ scores) constitute the relative weights for the statistical ranking, with 951.2
534.11 w and 951.2
417.12 w .
Table A10 presents the results for the PCA on the quantitative indicators of the sub-pillar Judicial Independence and efficiency. The sub-pillar is described by two dimensions and the relative weights to consider are )963.0288.1(
288.11 w and )963.0288.1(
963.02 w .
Notice that since PCA is a nested procedure is not necessary to run it again when more than one relevant factor is found, as with non-linear PCA.
Table A10. Summary for the pillar Rule of Law, Transparency and Corruption, sub-pillar Judicial Independence and Efficiency
Judicial Independence and Efficiency
Extraction Sums of Squared Loadings
Component Total % of Variance Cumulative %
1 1.288 42.948 42.948
2 .963 32.100 75.048
3 .749 24.952 100.000
Extraction Method: Principal Component Analysis.
Pillar’s ranking (or statistical rank) is obtained by linearly aggregating the statistical scores for the three sub-pillars with the baseline weights (1/3 each). Figure A2 shows the difference between the statistical analysis (stat rank) and the baseline pillar ranking. The ranking based on weights and scores retrieved from non-linear PCA appears to be similar to the original Rule of Law, Transparency and Corruption ranking but with a caveat. The Spearman rank correlation coefficient between the two is 0.77. The median impact is a five-position change and ten countries shift ten positions or more (Central Africa, Equatorial Guinea, Ethiopia, Gabon, Madagascar, Mali, Rwanda, San Tome and Principe, Sierra Leone, Swaziland and Somalia: max
Created with novaPDF Printer (www.novaPDF.com). Please register to remove this message.

79
shift 31 positions). These results suggest that a PCA-based ranking has a more significant impact on the results of this pillar, as compared to the previous pillar.
Figure A2. Pillar Rule of Law, Transparency and Corruption, differences between the Index of African Governance (IAG) for the pillar and the index based on statistical analysis (stat-rank)
rank differences (IAG rank - stat rank)
-30
-20
-10
0
10
20
30
Ang
ola
Ben
inB
otsw
ana
Bur
kina
Fas
oB
urun
diC
amer
oon
Cap
e Ve
rde
Cen
tral
Afr
ican
Cha
dC
omor
osC
ongo
Con
go,
Cot
e d'
Ivoi
reD
jibou
tiEq
uato
rial G
uine
aEr
itrea
Ethi
opia
Gab
onG
ambi
aG
hana
Gui
nea
Gui
nea-
Bis
sau
Ken
yaLe
soth
oLi
beria
Mad
agas
car
Mal
awi
Mal
iM
aurit
ania
Mau
ritiu
sM
ozam
biqu
eN
amib
iaN
iger
Nig
eria
Rw
anda
Sao
Tom
e an
dSe
nega
lSe
yche
lles
Sier
ra L
eone
Som
alia
Sout
h A
fric
aSu
dan
Swaz
iland
Tanz
ania
Togo
Uga
nda
Zam
bia
Zim
babw
e
Table A11. Quantification of categorical indicators
2 1 -6.861 1 6 -2.4223 2 -0.376 2 24 0.1344 3 0.112 3 10 0.9765 10 0.112 4 3 0.9766 23 0.123
7 9 0.123
Ratification of Int. Human Rights Conventions
Laws on Contracts and Property Rights
Cat
egor
y
Freq
uenc
y
Qua
ntifi
catio
n
Cat
egor
y
Freq
uenc
y
Qua
ntifi
catio
n
An interesting point in the use of non-linear PCA is that it provides quantification for categorical indicators, i.e. it optimally identifies the number and identity of categories of a qualitative variable. Table A11 shows that the qualitative variable Ratification of international human rights conventions, originally divided into 7 categories can be, without loss of information, divided in 4 categories (categories 4 and 5 and categories 6 and 7 can be merged). The same happens for the variable Laws on contracts and property rights: categories 3 and 4 can be merged with no
Created with novaPDF Printer (www.novaPDF.com). Please register to remove this message.

80
loss of information. Notice that if this result were to be found analyzing several years it would suggest the need to revise the questionnaire accordingly and eliminating the redundant categories.
Pillar Participation in Human Rights The pillar Participation in Human Rights is divided into two sub-pillars: Participation in election and Political rights. The variable populating the sub-pillars are mixed: qualitative (free and fair executive/legislative elections, respect for physical integrity rights, respect for civil rights, absence of gender discrimination), dichotomous (participation of oppositions in executive/legislative elections) and quantitative (press freedom index). Therefore a non-linear PCA needs to be employed. Table A12 displays the results when considering simultaneously all 8 indicators and confirms the existence of 2 relevant dimensions. Those two factors account for 63% of the variance and display a high Cronbach’s Alpha (at least the first factor) indicating a high ability to capture the latent phenomenon. When performing non-linear PCA separately on the two sub-pillars, the first one is explained by only one factor, as in the ideal case, while the second by two factors (Tables A13 and A14)
In order to derive a composite score for the pillar one has to re-run twice non-linear PCA imposing for the first sub-pillar one factor and for the second pillar two factors. The calculating the composite scores for the latter will be done by weighting the fist factor 2.516/3.752 and the second factor 1.237/3.752. The scores of the two sub-pillars are then equally weighted and aggregated as in the baseline.
Table A12. Summary for the pillar Participation and Human Rights, 8 indicators Participation and human rights
Variance Accounted For
Dimension
Cronbach's
Alpha Total (Eigenvalue)
1 .837 3.733
2 .286 1.336
3 .001 1.002
4 -.777 .597
5 -1.107 .508
6 -1.615 .416
7 -2.401 .323
8 -4.785 .194
Total 1.002a 8.108
a. Total Cronbach's Alpha is based on the total Eigenvalue.
Created with novaPDF Printer (www.novaPDF.com). Please register to remove this message.

81
Table A13. Summary for the pillar Participation and Human Rights, sub-pillar Participation in Elections
Total (Eigenvalue) % of Variance
1 0.882 2.956 73.8892 -1.069 0.555 13.8733 -2.66 0.334 8.3484 -7.236 0.156 3.89
Total 1.000a 4 100
Total (Eigenvalue) % of Variance
1 0.9 3.077 76.915Total 0.9 3.077 76.915
a. Total Cronbach's Alpha is based on the total Eigenvalue.
Participation in elections
DimensionCronbach's
Alpha
Variance Accounted For
Variance Accounted For
non-linear PCA with 1 dimension
DimensionCronbach's
Alpha
Table A14. Summary for the pillar Participation and Human Rights, sub-pillar Respect for Civil and Political Rights
Variance Accounted For
Total (Eigenvalue)
1 0.616 1.8572 0.198 1.1733 -0.577 0.74 -1.379 0.492
Total 1.018a 4.222
Variance Accounted For
Total (Eigenvalue)
1 0.803 2.5162 0.254 1.237
Total .978a 3.752
Respect for civil and political rights
DimensionCronbach's
Alpha
non-linear PCA with 2 dimensions
DimensionCronbach's
Alpha
a. Total Cronbach's Alpha is based on the total Eigenvalue.
Figure A3 shows the rank comparison (reported as absolute difference between the ranking obtained using non-linear PCA, i.e. by statistically eliminating redundancy and the baseline).
The highest difference between ranking is displayed by Seychelles and Mali (13 positions), while the median difference is of 2 positions. Overall, given the modest shift of the median, the statistical analysis supports both the theoretical framework and the methodological approach used by IAG developers.
Created with novaPDF Printer (www.novaPDF.com). Please register to remove this message.

82
Figure A3. Pillar Participation and Human Rights, differences between the Index of African Governance (IAG) for the pillar and the index based on statistical analysis (stat-rank)
rank differences (IAG rank - stat rank)
-15
-10
-5
0
5
10
15
Ang
ola
Ben
inB
otsw
ana
Bur
kina
Fas
oB
urun
diC
amer
oon
Cap
e Ve
rde
Cen
tral
Afr
ican
Cha
dC
omor
osC
ongo
Con
go,
Cot
e d'
Ivoi
reD
jibou
tiEq
uato
rial G
uine
aEr
itrea
Ethi
opia
Gab
onG
ambi
aG
hana
Gui
nea
Gui
nea-
Bis
sau
Ken
yaLe
soth
oLi
beria
Mad
agas
car
Mal
awi
Mal
iM
aurit
ania
Mau
ritiu
sM
ozam
biqu
eN
amib
iaN
iger
Nig
eria
Rw
anda
Sao
Tom
e an
dSe
nega
lSe
yche
lles
Sier
ra L
eone
Som
alia
Sout
h A
fric
aSu
dan
Swaz
iland
Tanz
ania
Togo
Uga
nda
Zam
bia
Zim
babw
e
Table A15. Quantification of categorical indicators.
0 1 -6.851 0 1 -6.853 0 4 -2.8981 1 0.136 1 5 0.139 1 1 -1.4872 8 0.136 2 5 0.139 2 1 -0.3163 15 0.136 3 5 0.139 3 2 -0.3154 16 0.136 4 8 0.139 4 5 -0.0385 4 0.212 5 12 0.139 5 5 -0.0386 3 0.212 6 8 0.172 6 5 -0.038
7 3 0.172 7 6 0.081
8 1 0.172 8 5 0.57
9 7 0.57
10 5 1.065
11 2 1.065
Absence of gender discrimination
Cat
egor
y
Freq
uenc
y
Qua
ntifi
catio
n
Respect for civil rights
Cat
egor
y
Freq
uenc
y
Qua
ntifi
catio
n
Respect for ph. Integrity
Cat
egor
y
Freq
uenc
y
Qua
ntifi
catio
n
Table A15 shows the quantification of three qualitative variables belonging to the sub-pillar Respect for civil and political rights.3 The measurement scale of indicator absence of gender
3 For the remaining qualitative indicators the CATPCA confirms the original measurement scale.
Created with novaPDF Printer (www.novaPDF.com). Please register to remove this message.

83
discrimination could be squeezed into 3 categories (0, 1, 2) instead of the original 6, given that categories 1 to 4 and 5,6 are statistically undistinguishable. A similar argument holds for the indicators respect for physical integrity and respect for civil rights where the original 8 and 11 categories can be transformed without loss of information into 4 and 5 respectively. Notice that if this result were to be found analyzing several years it would suggest the need to revise the questionnaire accordingly and eliminating the redundant categories.
Pillar Sustainable Economic Opportunity
The pillar Sustainable Economic Opportunity is described by four sub-pillars: Wealth creation; Macroeconomic stability and financial integrity; Arteries of commerce; Environmental sensitivity. Overall this pillar hosts 12 quantitative variables thus PCA can be employed. This pillar has many missing values, especially the Environmental Performance Index where 9 out of 48 data are missing. Moreover Somalia lacks data for 7 out of 12 indicators while Liberia lacks the data for 2 indicators. The imputation method has strong influence as suggested in section 3, therefore the methodological approach followed for the other pillars is meaningless: the results of the PCA and thus the statistical ranking proposed will be highly dependent on the imputation and we will be unable to confirm or reject the theoretical framework proposed.
Figure A4. Pillar Sustainable Economic Opportunities, differences between the Index of African Governance (IAG) for the pillar and the index based on statistical analysis (stat-rank – with imputed data)
rank differences (IAG rank vs imputation-method rank)
-8
-6
-4
-2
0
2
4
6
8
10
12
Ang
ola
Ben
inB
otsw
ana
Bur
kina
Fas
oB
urun
diC
amer
oon
Cap
e Ve
rde
Cen
tral
Afr
ican
Cha
dC
omor
osC
ongo
Con
go,
Cot
e d'
Ivoi
reD
jibou
tiEq
uato
rial G
uine
aEr
itrea
Ethi
opia
Gab
onG
ambi
aG
hana
Gui
nea
Gui
nea-
Bis
sau
Ken
yaLe
soth
oLi
beria
Mad
agas
car
Mal
awi
Mal
iM
aurit
ania
Mau
ritiu
sM
ozam
biqu
eN
amib
iaN
iger
Nig
eria
Rw
anda
Sao
Tom
e an
dSe
nega
lSe
yche
lles
Sier
ra L
eone
Som
alia
Sout
h A
fric
aSu
dan
Swaz
iland
Tanz
ania
Togo
Uga
nda
Zam
bia
Zim
babw
e
Nevertheless, once imputed missing values with the Hot-deck procedure, the overall score was computed following IAG 2008 approach (equal weights within and across the four sub-pillars). As expected, major differences regard countries with imputed observations. In Figure A4 rank differences are shown. “Statistical ranks” are highly different from baseline IAG ranks. This is probably due to the influence that missing data have on the IAG rank, from the one hand, and the influence that the imputation method has on the statistical rank, from the other hand.
Created with novaPDF Printer (www.novaPDF.com). Please register to remove this message.

84
Pillar Human Development The pillar Human Development is described by three sub-pillars: Poverty; Health and Sanitation; Educational Opportunity. The 21 variables populating the pillar are all quantitative, therefore PCA is used. The pillar is affected by a certain amount of missing values. In particular the variables Percentage of people who live on less that 1$ a day, Gini index, and percentage of students who progress from primary to secondary school show a percentage of missing observations above 10%, as shown in Table A16. The consequence is that in PCA the standard missing data options ‘pair-wise deletion’ and ‘list-wise deletion’ lead to discard too many records in the data-set.
Table A16. Some descriptive statistics and % of missing values for the pillar Human Development
N percentage of missing values Minimum Maximum Mean Std. Deviation
% of people who live on less than 1 $ a day 31 35% 0.00 100.00 48.79 27.43
% of people below their national poverty line 46 4% 0.00 100.00 37.83 21.93
Gini Index of income distribution41 15% 0.00 100.00 52.82 24.74
Life expectancy at birth48 0% 4.77 100.00 40.35 23.82
child mortality46 4% 4.91 100.00 53.91 23.26
maternal mortality46 4% 0.00 100.00 61.16 19.88
prevalence of denutrition45 6% 0.00 100.00 61.41 24.83
% of children immunized against diptheria 48 0% 0.00 100.00 66.04 23.49
% of children immunized against diptheria 48 0% 0.00 100.00 69.99 25.44
% of people affected by HIV44 8% 0.00 100.00 79.90 23.60
estimated new TB cases48 0% 0.00 100.00 70.79 19.78
physicians density48 0% 0.00 100.00 12.29 18.89
nurses to patients ratio48 0% 0.00 100.00 14.55 21.42
% of population with potable water48 0% 0.00 100.00 55.32 22.25
adult literacy48 0% 0.00 100.00 60.32 27.93
adult women literacy44 8% 4.10 100.00 56.60 28.75
% of children who complete primary school 46 4% 9.74 100.00 53.43 24.84
% of girls who complete the primary school 46 4% 6.28 100.00 51.59 26.92
pupil to teacher ratio44 8% 22.32 100.00 60.35 17.09
% of students who progress to secondary school 34 29% 19.08 96.22 57.30 21.94
female to male ratio at school47 2% 0.00 93.68 61.69 24.71
Valid N (listwise)20
Descriptive Statistics
Our suggestion is to investigate further the reason behind the ‘missingness’, especially for the above mentioned indicators, to explore the possibility of alternative data sources or the use of more sophisticated imputation methods, as shown for the pillar Sustainable Economic Opportunity. In the following we adopted the option ‘replace with mean’ in the PCA analysis of
Created with novaPDF Printer (www.novaPDF.com). Please register to remove this message.

85
sub-pillars. It should be kept in mind that sub-pillar Poverty is mostly affected by missing data, with two out of three indicators presenting a high percentage of missing values (Table A16).
Table A17. Summary for the pillar Human Development
Initial Eigenvalues
Component Total % of Variance Cumulative %
1 7.928 37.753 37.753
2 3.104 14.781 52.534
3 1.925 9.167 61.701
4 1.553 7.397 69.098
5 1.097 5.222 74.320
6 1.016 4.839 79.159
7 .783 3.728 82.887
8 .778 3.703 86.590
9 .623 2.968 89.558
10 .472 2.246 91.804
11 .369 1.757 93.561
12 .321 1.529 95.090
13 .264 1.259 96.349
14 .220 1.048 97.396
15 .179 .851 98.247
16 .123 .586 98.832
17 .097 .461 99.293
18 .065 .309 99.603
19 .045 .212 99.815
20 .036 .171 99.986
21 .003 .014 100.000
The statistical analysis of the Pillar Human Development shows that strictly according to Kaiser’s rule for dimension extraction, the first six dimensions are relevant. However dimensions 4, 5 and 6 accounts each for less than 7.4% of total variance, whilst the first three dimensions cumulatively account for more than 60% of total variance. The statistical structure of the pillar may be then downgraded to a three sub-pillar structure, confirming the IAG framework.
Table A18. Summary for the pillar Human Development, sub-pillar Poverty
loadings Component
Total% of
VarianceCumulative
% 11 1.668 55.598 55.598
% of people who live on
less than 1 $ a day
0.87
2 0.909 30.315 85.913% of people below their
national poverty line
0.831
3 0.423 14.087 100 Gini Index of income
distribution0.468
Component
Initial Eigenvalues
Created with novaPDF Printer (www.novaPDF.com). Please register to remove this message.

86
Table A19. Summary for the pillar Human Development, sub-pillar Health and Sanitation
loadings
Total % of Variance Cumulative % 1 2 31 4.232 38.474 38.474 Life expectancy at birth 0.561 0.738 -0.1792 2.279 20.722 59.196 child mortality 0.811 -0.058 0.0463 1.651 15.007 74.203 maternal mortality 0.745 -0.033 -0.0094 0.985 8.953 83.156 prevalence of
undernourishment0.495 0.057 -0.461
5 0.668 6.068 89.224 % of children immunized against diphtheria
0.599 0.074 0.706
6 0.494 4.493 93.717 % of children immunized against diphtheria
0.631 0.018 0.705
7 0.231 2.101 95.818 % of people affected by HIV -0.339 0.883 0.032
8 0.182 1.658 97.476 estimated new TB cases -0.072 0.913 0.0549 0.154 1.4 98.876 physicians density 0.726 0.219 -0.39910 0.067 0.607 99.484 nurses to patients ratio 0.669 -0.23 -0.48911 0.057 0.516 100 % of population with potable
water0.78 -0.087 0.079
ComponentInitial Eigenvalues Component
Table A20. Summary for the pillar Human Development, sub-pillar Educational Opportunities
loadings Total % of Variance Cumulative % 1 2
1 4.342 62.028 62.028 adult literacy 0.847 -0.262 1.07 15.279 77.307 adult women literacy 0.895 -0.1933 0.659 9.414 86.721 % of children who complete
primary school0.866 0.069
4 0.509 7.275 93.996 % of girls who complete the primary school
0.921 0.008
5 0.341 4.869 98.864 pupil to teacher ratio 0.659 0.486 0.074 1.06 99.925 % of students who progress
to secondary school0.51 0.706
7 0.005 0.075 100 female to male ratio at school
0.729 -0.481
ComponentInitial Eigenvalues Component
The PCA of the 3 sub-pillars is presented in Table A18, A19 and A20. The corresponding eigenvalues are used to compute the statistical racking of each sub-pillar that is further aggregated into a pillar ranking equally weighting each sub-pillar. Figure A4 shows the difference between the “statistical ranking” and the baseline IAG ranking. The Spearman rank correlation coefficient between the ranking obtained using PCA and the original Human Development ranking is 0.94. The median impact is a three-position change and only three countries shift ten positions or more (Comoros, Congo, Eritrea: max shift = 13).
Created with novaPDF Printer (www.novaPDF.com). Please register to remove this message.

87
Figure A5. Pillar Human Development, differences between the Index of African Governance (IAG) for the pillar and the index based on statistical analysis (stat-rank)
rank differences (IAG rank - stat rank)
-20
-15
-10
-5
0
5
10
15
20
Ang
ola
Ben
inB
otsw
ana
Bur
kina
Fas
oB
urun
diC
amer
oon
Cap
e Ve
rde
Cen
tral
Afr
ican
Cha
dC
omor
osC
ongo
Con
go,
Cot
e d'
Ivoi
reD
jibou
tiEq
uato
rial G
uine
aEr
itrea
Ethi
opia
Gab
onG
ambi
aG
hana
Gui
nea
Gui
nea-
Bis
sau
Ken
yaLe
soth
oLi
beria
Mad
agas
car
Mal
awi
Mal
iM
aurit
ania
Mau
ritiu
sM
ozam
biqu
eN
amib
iaN
iger
Nig
eria
Rw
anda
Sao
Tom
e an
dSe
nega
lSe
yche
lles
Sier
ra L
eone
Som
alia
Sout
h A
fric
aSu
dan
Swaz
iland
Tanz
ania
Togo
Uga
nda
Zam
bia
Zim
babw
e
Created with novaPDF Printer (www.novaPDF.com). Please register to remove this message.

88
References
Booysen F., 2002, An overview and evaluation of composite indices of development. Social Indicators Research 59 (2):115-151.
Borda J.C. de, 1784, Mémoire sur les élections au scrutin, in Histoire de l’ Académie Royale des Sciences, Paris.
Boussofiane A., Dyson R. G., & Thanassoulis E., 1991, Applied data envelopment analysis. European Journal of Operational Research 52, 1–15.
Brand D. A., Saisana M., Rynn L. A., Pennoni F., Lowenfels A. B., 2007, Comparative Analysis of Alcohol Control Policies in 30 Countries. PLoS Medicine 4(4): 752-759.
Canadian Council on Learning, 2007, The 2007 Composite Learning Index: Helping Communities improve their quality of Life, Ottawa, pp1-40.
Cherchye L., Moesen W., Rogge N., van Puyenbroeck T., Saisana M., Saltelli A., Liska R., Tarantola S., 2008, Creating Composite Indicators with DEA and Robustness Analysis: the case of the Technology Achievement Index. Journal of Operational Research Society 59:239-251.
Cherchye L., Moesen W., van Puyenbroeck T., 2004, Legitimately Diverse, Yet Comparable: on Synthesising Social Inclusion Performance in the EU. Journal of Common Market Studies 42:919-955.
Condorcet M. de, 1785, Essai sur l’application de l’analyse à la probabilité des décisions rendues à la probabilité des voix, De l’ Imprimerie Royale, Paris.
Cronbach L.J., 1951, Coefficient alpha and the internal structure of tests. Psychometrica16:297-334.
Cutter S. L., Boruff B.J., Shirley, W.L, 2003, Social vulnerability to environmental hazards. Social Science Quarterly 84(1):242-261.
Darton R. A., 1980, Rotation in Factor Analysis, The Statistician 29(3):167-194.
De Vellis, R.F., 1991, Scale Development Theory and Applications. SAGE Publications, Newbury Park, CA.
Dunteman G.H., 1989, Principal components analysis. Thousand Oaks, CA: Sage Publications, Quantitative Applications in the Social Sciences Series, No. 69.
Efron, B., 1979, Bootstrap methods: Another look at the jackknife. The Annals of Statistics 7(1), 1–26.
Gifi, A., 1990, Non-linear Multivariate Analysis. Wiley, New York. Grupp H., Mogee M.E., 2004. Indicators for national science and technology policy: how robust
are composite indicators? Research Policy 33, 1373-1384. Hartigan J., Wong M.A., 1979, A k-means Clustering Algorithm. Journal of Applied Statistics
28:100-108. Kaufman L., Rousseeuw P. J., 1990, Finding Groups in Data: An Introduction to Cluster
Analysis. Wiley-Interscience. Keeney R., Raiffa H., 1976, Decision with multiple objectives: preferences and value trade-offs,
Wiley, New York. Kemeny J., 1959, Mathematics without numbers. Daedalus 88:577–591.
Created with novaPDF Printer (www.novaPDF.com). Please register to remove this message.

89
Kennedy P., 2007, A Guide to Econometrics, Fifth ed. Blackwell.
Leamer E.E., 1990, Let's take the con out of econometrics. American Economics Review 73: 31-43.
Little, R.J.A., Rubin, D.B. (2002) Statistical Analysis with missing data. IInd edition; John Wiley & Sons, Inc.
Manly B., 1994, Multivariate statistical methods, Chapman & Hall, UK. Melyn W., Moesen W.W., 1991, Towards a synthetic indicator of macroeconomic performance:
unequal weighting when limited information is available, Public Economic research Paper 17, CES, KU Leuven.
Michailidis G., de Leeuw J., 1998, The Gifi System of Descriptive Multivariate Analysis. Statistical Science 13(4). Pp 307-336.
Nicoletti G., Scarpetta S., Boyland O., 2000, Summary indicators of product market regulation with extension to employment protection legislation, Economics Department Working Paper no 226, ECO/WKP(99)18.
Nunnally J., 1978, Psychometric theory. New York: McGraw-Hill. OECD, 2008, Handbook on Constructing Composite Indicators. Methodology and user Guide,
OECD Publishing, Paris. Podinovskii V.V., 1994, Criteria importance theory. Mathematical Social Sciences 27: 237-252. Rotberg R.I., Gisselquist, R.M., 2008, Strengthening African Governance. Ibrahim Index of
African Governance: Results and Rankings 2008, Kennedy School of Government, Massachusetts, October 2008.
Saisana M., 2008, The 2007 Composite Learning Index: Robustness Issues and Critical Assessment, Report 23274, European Commission, JRC-IPSC, Italy.
Saisana M., D’Hombres B., 2008, Higher Education Rankings: Robustness Issues and Critical Assessment, Report 23487, European Commission, JRC-IPSC, Italy.
Saisana M., Munda G., 2008, Knowledge Economy: measures and drivers, Report 23486, European Commission, JRC-IPSC.
Saisana M., Saltelli A., 2008, Expert Panel Opinion and Global Sensitivity Analysis for Composite Indicators, Chapter 11 in Computational Methods in Transport: Verification and Validation, Vol. 62, ISSN 1439-7358, Ed. Frank Graziani, Springer Berlin Heidelberg, pp.251-275.
Saisana M., Saltelli, A., 2008, Sensitivity Analysis for the 2008 Environmental Performance Index, Report 23485, European Commission, JRC-IPSC.
Saisana M., Tarantola S., 2002, State-of-the-art Report on Current Methodologies and Practices for Composite Indicator Development, Report 20408, European Commission, JRC, IPSC.
Saisana M., Tarantola S., Saltelli A., 2005, Uncertainty and sensitivity techniques as tools for the analysis and validation of composite indicators. Journal of the Royal Statistical Society A 168(2):307-323.
Saltelli A., Chan K., Scott M., 2000, Sensitivity Analysis. John Wiley & Sons Ltd. Saltelli A., M. Ratto, T. Andres, F. Campolongo, J. Cariboni, D. Gatelli, M. Saisana, S.
Tarantola, 2008, Global sensitivity analysis. The Primer, John Wiley & Sons, England. Saltelli, A., 2007, Composite indicators between analysis and advocacy. Social Indicators
Research 81(1), 65-77.
Created with novaPDF Printer (www.novaPDF.com). Please register to remove this message.

90
Sexton T. R., Silkman R. H., Hogan A. J., 1986, Data envelopment analysis: Critique and extensions. In R. H. Silkman (Ed.). Measuring efficiency: An assessment of data envelopment analysis (Vol. 32, pp. 73–105). San Francisco: Jossey-Bass.
Shang J., Sueyoshi T., 1995, A unified framework for the selection of a flexible manufacturing system. European Journal of Operational Research, 85, 297–315.
Stanley J.C., Wang M.D., 1968, Differential weighting: a survey of methods and empirical studies. Johns Hopkins Univ., Baltimore.
UNCTD, 2005, Trade and Development Index, Developing countries in international trade, United Nations Conference on Trade and Development.
Vansnick J. C., 1990, Measurement theory and decision aid - in Bana e Costa C.A. (ed.) - Readings in multiple criteria decision aid, Springer-Verlag, Berlin, pp. 81-100.
Young H. P., Levenglick A., 1978, A Consistent Extension of Condorcet's Election Principle. SIAM Journal on Applied Mathematics 35:285–300.
Created with novaPDF Printer (www.novaPDF.com). Please register to remove this message.

91
Created with novaPDF Printer (www.novaPDF.com). Please register to remove this message.

92
European Commission EUR 23773 EN – Joint Research Centre – Institute for the Protection and Security of the Citizen Title: A robust model to measure governance in African countries Author(s): Michaela Saisana, Paola Annoni, Michela Nardo Luxembourg: Office for Official Publications of the European Communities 2009 – 73 pp. – 21 x 29.70 cm EUR – Scientific and Technical Research series – ISSN 1018-5593 ISBN 978-92-79-11604-9 DOI 10.2788/82544 Abstract Levels of performance of any government do matter in determining the quality of the civil society. The Ibrahim Index of African Governance developed by the Harvard Kennedy School shows how governance can be measured. The Index assesses governance issues over time (2000, 2002, 2005, 2006) and for 48 African countries south of the Sahara, according to a five-pillar conceptual structure: (a) Safety and Security, (b) Rule of Law, Transparency, and Corruption, (c) Participation and Human Rights, (d) Sustainable Economic Opportunity, and (e) Human Development. This report aims at validating and critically assessing the methodological approach undertaken to build the 2006 Index of African Governance, by raising two key questions:
o Is the Index of African Governance internally sound and consistent from a statistical and conceptual point of view?
o What scenarios could have been used to build the Index and how do the results from these scenarios compare to the original results?
The overall assessment of the 2006 Index by means of multivariate analyses, uncertainty and sensitivity analyses reveals no particular shortcomings in the conceptual structure. Data-driven narratives on governance issues in Africa are also offered in this report with a view to show directions of discussions and messages that stem from an index-based analysis of governance. Overall, the Index of African Governance can be reliably used to identify weaknesses, propose remedial actions, allow for easy spatial and temporal comparisons (benchmarking), to prioritize countries in Africa of relatively low governance content, and ultimately to monitor and evaluate policies effectiveness.
How to obtain EU publications Our priced publications are available from EU Bookshop (http://bookshop.europa.eu), where you can place an order with the sales agent of your choice. The Publications Office has a worldwide network of sales agents. You can obtain their contact details by sending a fax to (352) 29 29-42758.
Created with novaPDF Printer (www.novaPDF.com). Please register to remove this message.

93
The mission of the JRC is to provide customer-driven scientific and technical support for the conception, development, implementation and monitoring of EU policies. As a service of the European Commission, the JRC functions as a reference centre of science and technology for the Union. Close to the policy-making process, it serves the common interest of the Member States, while being independent of special interests, whether private or national.
LB-N
A-23773 -EN
-C
Created with novaPDF Printer (www.novaPDF.com). Please register to remove this message.