a risk-based model for service level agreement di...
TRANSCRIPT

A Risk-based Model for Service Level AgreementDifferentiation in Cloud Market Providers
Mario Macias and Jordi Guitart
Barcelona Supercomputing Center (BSC) andUniversitat Politecnica de Catalunya - Barcelona Tech (UPC)
Jordi Girona 29, 08034 Barcelona, Spain{mario.macias, jordi.guitart}@bsc.es
Abstract. Cloud providers may not always fulfil the Service Level Agree-ments with the clients because of outages in the data centre or inaccu-rate resource provisioning. Minimizing the Probability of Failure of thetasks that are allocated within a Cloud Infrastructure can be economi-cally infeasible because overprovisioning resources increases the cost andis economically inefficient. This paper intends to increase the fulfilmentrate of Service Level Agreements at the infrastructure provider side whilemaximizing the economic efficiency, by considering risk in the decisionprocess. We introduce a risk model based on graph analysis for risk prop-agation, and we model it economically to provide three levels of risk tothe clients: moderate risk, low risk, and very low risk. The client maydecide the risk of the service and proportionally pay: the lower the riskthe higher the price.
1 Introduction
Cloud Computing arisen as a successful commercial solution to sell computingresources as a utility: clients dynamically size the resources according to theirworkloads, and pay only for what they use. Cloud resources are usually sold asVirtual Machines (VMs) that can run isolated in the same hardware as otherVMs and scale at runtime. In current commercial Clouds, infrastructure pro-viders price the resources and clients may decide to buy them or not. Thereis no negotiation. Our research, however, is framed in research Cloud Marketimplementations such as the SORMA [10] Market Middleware. In Cloud Mar-kets, both resource users and providers are autonomous agents that negotiatethe terms of the Quality of Service (QoS) and the price that the client will payto the provider. When the negotiation is finished, the terms of the contract areestablished in a Service Level Agreement (SLA) that keeps contractual informa-tion about the terms of the QoS as well as the pricing information (price andpenalty to pay in case of violation of the SLA).
Cloud providers may not always fulfil the SLAs they agree with the clientsbecause of outages in the data centre or errors in the hardware. Not fulfillingthe agreed SLAs would lead to economic penalties [8] and a loss of reputationthat can cause clients with high reliability requirements to not allocate their

tasks in the provider [7]. Minimising the Probability of Failure (PoF) of thetasks that are allocated within a Cloud Infrastructure can be economically in-feasible. Overprovisioning resources increases the cost and is economically andecologically inefficient because the overbooked resources are underused most ofthe time.
This paper has a main goal: to increase the fulfilment rate of SLAs at theinfrastructure provider side by providing risk-aware policies that maximize theeconomic efficiency. We introduce a risk model based on graph analysis for riskpropagation, and we model it economically to provide three levels of risk to theclients: moderate risk, low risk, and very low risk. The client may decide the riskof the service and proportionally pay: the lower the risk the higher the price.
To achieve the stated goal, this paper introduces the following contributions:
1. Model of the PoF of a multi-tier service that is hosted in a Cloud data centreby means of the analysis of the links between virtual resources.
2. A new revenue model that will help providing different levels of risk at differ-ent prices, while adapting prices to the present value of the resources (thatis, the rate the resources decrease their value over time).
This paper is structured as follows. After the related work section, Section 3introduces the baseline negotiation and revenue model that is used as frameworkfor this paper; Section 4 shows the risk model and Section 5 shows the revenuemodel; Section 6 describes the experiments and evaluates their results; at theend, Section 7 show the conclusions and the future work lines.
2 Related work
This paper extends our previous work [7,8], which demonstrated that differen-tiating SLAs according to their QoS level could lead to economic benefits in anopen market with many competitors, because there is a variety in the objectivesof clients. Some clients may require high QoS guarantees and other clients mayprioritize lower prices. This paper extends the previous research by modellingthe risk of complex cloud appliances and defining a revenue model that wouldallow to provide accurate prices as a function of the offered QoS level.
Bayesian networks[4] define a graph model for describing the probability ofan event from the probabilities of the events that would cause it, in terms like “ifevent A happen, event B will happen”. That is inaccurate for Cloud appliances,because a failure in a node would not always involve a failure in the linked node.In addition, it is difficult to express some complex relations like redundancy.Our graph model extends the Bayesian Network model with the addition ofweighted links and introduces two special types of node for representing unionand intersection operations. These additions ease the expression of some complexCloud appliances and the risk propagation through their nodes.
Djemame et al. [2] described an architecture to assess risk in computingGrids that allow providers to estimate the risk of agreeing a given SLA and usemanagement techniques to maximize its fulfilment. They use risk assessment for

task scheduling. Our work intends to be an upgrade of some of their risk modelsto adapt them to the architecture of Clouds and using such risk assessment alsofor improving business objectives.
Yeo and Buyya [16] provide two methods for risk analysis: separate, whichonly evaluates the risk over a facet, and integrated, which evaluates the riskover multiple facets. In the integrated method, they assume all the facets areindependent from each other. In our model, the facets are the multiple risks ofall the independent resources in a multi-tier application, but we do not considerthem as independent. The risk is propagated according how such resources arelinked, and the effects of such uncertainty have different impact depending onthe location of the risk within the resources graph.
Sawade et al. [12] consider that risk models may lose their validity over timefor some reason (the environment changes, the inputs change, learning errors,...). Our model can minimize these drawbacks, because it is dynamically builtaccording to the SLA templates from the clients.
The pricing models from Becker et al. [1] consider the concept of BusinessValue: how much a client is willing to pay for any extra unity of QoS. We alsoconsider this concept in our model. However, our intention is not to solve theissue of calculating it but consider it as an important part of a revenue model forproviding multiple pricing and risk levels. They also calculate the penalty of theexecution of multiple services, while distributing the risk between the differentservices. Our approach considers only a single project and calculates the risk ofpenalties by evaluating the internal topology of such service.
Simao et al. [14] propose a pricing model that allows clients and providersto negotiate the price and penalties, but also how much service degradationthe client is willing to accept and how much it will pay proportionally to suchdegradation. As in this paper, they define three levels of QoS and propose adepreciation strategy to control the degradation of the SLAs for each profile whenthe resources are overloaded. Our model does not explicitly select the SLAs todegrade, but allocates them by risk levels according to the envisioned probabilityof failure. Both models are complementary and may coexist simultaneously.
Wee [15] profiles in detail the Amazon Spot Instances. He concludes that suchmodel does not motivate enough users to move their workload to the off-peakhours. Our model provides an extra incentive to move because, in addition tothe lower prices derived from the low market demand, users can benefit also oflower risks derived from the low workload.
Li and Gillam [6] apply risk assessment to the financial aspect of the grid.They provide node granularity risk assessment to calculate prices and penaltiesfor the SLAs. Our approach combines assessments from several nodes and linksthem to consider a Cloud appliance topology.
3 SLA negotiation model
This paper focuses two stages of the Infrastructure as a Service (IaaS) provision-ing: the negotiation of SLAs between the clients and an Infrastructure Provider

(IP), and the provisioning of resources to fulfil the terms of the agreement. Weconsider the OCCI Standard [9] to describe the infrastructure: the client canget three types of cloud resources (compute nodes, networks, and storage nodes)and define how they are linked by means of network interfaces and storage links.
When a client wants to host a service, it calculates how many Cloud resourcesit needs and sends an offer to the IP to start a negotiation. Each IP owns a set ofN physical hosts. Each physical machine can host several VMs. The SLA of a set
of VMs is described as SLA = {−→S ,−→L ,∆t,RL,Rev(vt)}.
−→S = (s1, . . . , sk) are
the Service Level Objectives (SLOs) that describe the amount of resources to be
purchased by the client, and−→L describes how the resources are linked according
to its OCCI description. Each s∗ term represents the amount of CPUs, Memory,Disk, network bandwidth, and so on. RL is the risk level (medium, low, verylow) that the client selects for its service, having an impact in the price. ∆t isthe time period during which the VM will be allocated. If the IP provider hasnot enough free resources to allocate the SLA, it can reject it.
Current commercial Clouds do not compel to specify ∆t and sell resources atfixed price/hour. In contrast, research Cloud Market middlewares [10] require tospecify ∆t when a client and a provider negotiate a price. Market mechanismswould motivate clients to distribute their workloads across time, if possible.
Rev(vt), which was originally proposed in [7], is a revenue function thatdescribes the revenue of a provider after the operation of a SLA. The violationtime vt is the total time during which the agreed QoS has not been provided. LetMP be the Maximum Penalty (seen as negative revenue), MR the MaximumRevenue, MPT the Maximum Penalty Threshold, and MRT the MaximumRevenue Threshold, Equation 1 describes the revenue function.
Rev(vt) =MP −MR
MPT −MRT(vt−MRT ) +MR (1)
Equation 1 allows a grace period where the provider can violate the SLAwithout being penalized. If vt ≤ MRT , the provider will get all the negotiatedrevenue (MR); if vt ≥MPT , the provider will pay the maximum penalty (MP );for MRT > vt > MPT the money to earn or the penalty to pay will be pro-portionally in between MR and MP as a function of vt (see Figure 1) . TheMaximum Penalty MP is defined to avoid infinite penalties. Client and providercan negotiate the values of MRT , MR, MPT , MP for establishing differentQoS ranges that would report different revenues and penalties. The client canassume that vt will be normally near zero and will have to pay MR most times.
When the client wants to acquire resources from the IP, it starts the next
negotiation: it sends to the IP an SLA template with values for (−→S ,−→L ,∆t,RL).
According to its envisioned status for ∆t, if the IP has enough resources, itreturns a complete SLA that specifies the values for MRT , MR, MPT and MPas a function of the number of resources, the market status, and the risk levelrequested by the client. A lower risk level would entail higher prices (MR), buthigher penalties (lower MP and less tolerance to SLA violations (lower MRT

Fig. 1: Revenue of a SLA as a function of the violation time (Equation 1)
and MPT )). If the client agrees the terms proposed by the IP, it confirms theSLA or, otherwise, rejects it and looks for another provider in the market.
4 Risk Management
This paper considers risk as the effect of uncertainty on objectives [3]. Riskdepends on two facets: the probability of an unwanted event and how it deviatesthe desired outcomes. Given a time frame, an unwanted event may occur. Thismay impact or not in the desired outcomes. For example, if a single disk failswithin a storage system with redundancy, an unwanted event occurred but itsimpact is low (cost of replacement, but no data has been loss). In our work, theimpact of risk will be economically determined by the penalties that are specifiedin the SLA. Calculating the risk is calculating the PoF of a complex system, andcalculating how the failure can impact the fulfilment of the SLA.
Measuring risk in individual components. For each component basedon OCCI types, we identify as failure each incident that causes this componentto not work correctly. Although real computing resources may have multipledegrees of malfunction, our model adopts a binary definition of malfunction forsingle resources: working/failure. Our model does not care about the grade ofperformance for each individual component, but whether the propagation andaggregation of all the errors/misbehaviours of the individual resources will leadthe system to fulfil the SLA or not.
The quantitative risk assessment for each component is based on the processproposed by Guitart et al. [3], which divides the risk assessment into the followingstages: (1) Identify what weaknesses could prevent a component from functioningproperly. In this paper we identify two: overload of resources and age of resources.(2) Identify which situations can exploit system vulnerabilities. Information fromvulnerabilities and threats can be gathered from experts, historical databasesand files. (3) The monitoring information is retrieved at different levels. Webasically consider information from physical and virtual hosts. (4) Identify thelikelihood of a threat acting over a vulnerability. This information is retrievedfrom historical facts that take place in a specific context. And (5) calculate thePoF of a single component as a function of the current monitoring status, given

a time frame (e.g. calculate the PoF of a network during the next 24 hours). Inthis paper, we use statistical information from monitoring history (e.g. check thehistoric of failures when resources reach a given load). In our future work, wewill explore alternative methods: machine learning, non-linear regressions, etc.
Measuring risk in complex appliances. In compliance to OCCI, our riskmodel is composed by nodes that have dependencies between them. A node nxis failing when it is not providing the agreed QoS (e.g. a disk is not able to reador write data, a compute resource is not providing all the promised computationpower, a network fails...). The PoF of nx is notated as P (nx) and it can bemeasured according to the steps as previously described.
Let nx and ny be two nodes that are linked to work together as a compositesystem. We consider that nx has a risk link of weight ωxy to ny when the failureof ny prevents nx to work correctly (for example, nx is an application server thatuses ny as a database). The weight ωxy ∈ [0, 1] is the probability that a failurein ny is propagated to nx. In consequence, nx can fail because an internal failureon nx or a failure in ny that is propagated to nx with probability ωxy. Equation2 defines P ′(nx) as the propagated probability of failure of nx.
P ′(nx) = P (nx) + ωxyP (ny)− ωxyP (nx)P (ny) (2)
Equation 2 is based on the formula for union of probabilities, which assumesthat P (nx) and P (ny) are independent (unlike P ′(nx) that depends on bothP (nx) and P (ny)). The graphical notation for such risk relation is the next:
nx nyωxy
The aforementioned notation is used as a primitive for calculating the riskof complex systems. For example, let ws be a web server that handles requestsfrom clients and contacts the application server as. We measured that the 30%of the times that as is invoked it accesses a database (db). If the database fails,the error will be propagated to as and, in consequence, to ws. In this examplewe assume P (ws) = 0.05, P (as) = 0.01, and P (db) = 0.03.
ws as db0.3
If the arrow between nodes does not show any number, we assume a weightvalue = 1 between risk nodes. From the client side, if the node ws fails, thecomplete web application is failing. The PoF of the complete super system isP ′(ws), which is calculated as shown in equation 3. Resolving it, the probabilitythat the complete system fails (that is, the client cannot access ws) is ∼ 0.068.It is always true that P ′(nx) ≥ P (nx).{
P ′(ws) = P (ws) + P ′(as)− P (ws)P ′(as)
P ′(as) = P (as) + 0.3P (db)− 0.3P (as)P (db)(3)

In the previous example, the probability of failure of node as that will bepropagated to ws is actually the probability of failure of the subsystem formed byas and db. By this reason, Equation 3 calculates P ′(ws) as a function of P ′(as)instead of P (as). Our model allows simplifying complex systems by groupingmany of their nodes and treats them as a single node.
In our model, a node can also have risk dependencies to many other nodes.We introduce two types of meta nodes to represent unions and intersectionsbetween risk probabilities. The next system is interpreted as follows: the systemheaded by nx will fail when there is a failure in nx OR there is a failure in ny(with probability wxy) OR there is a failure in nz (with probability wxz).
nx
ny
nz∪
ωxy
ωxz
The node labelled as ‘∪’ (union operator) is a meta node to which P (∪) = 0.It is used to allow grouping the subsystem formed by ny and nz and treatingit as a single node when calculating the risk propagation to nx (calculated inP ′(∪)). In consequence, calculating P ′(nx) is solving the next equations:{
P ′(nx) = P (nx) + P ′(∪)− P (nx)P ′(∪)
P ′(∪) = ωxyP (ny) + ωxzP (nz)− ωxyP (ny)ωxzP (nz)(4)
As example, imagine nx is a VM that executes a disk-intensive task against aRAID-0 disk system which distributes the data chunks within two disks (ny andnz) for improving performance. If only one disk fails in a RAID-0 system, thecomplete system will fail, since there is no redundancy for recovering the data.
Our model also introduces the intersection operator ‘∩’ to model redundancyin fault tolerant systems:
nx
ny
nz∩
ωxy
ωxz
The probability of failure of the subsystem headed by the node ‘∩’ is theintersection of probabilities of failure for nodes ny and nz, assuming that theyare independent: P ′(∩) = ωxyωxzP (ny)P (nz). For example, imagine a RAID-1disk system that mirrors two disks.
The combination of the union and intersection operators may also be usedto model systems to which the redundancy is partial. For example, a masternode M sends tasks to slave nodes A, B, and C. If one of the slave nodes fails,the other two nodes can handle the work; if two slave nodes fail, the completesystem will fail.

Although we focus on the hardware failures at infrastructure level, our modelallows also expressing software components as nodes within the graph, or simplyconsidering the software failure within the PoF in the hardware node.
Risk-aware cloud operation. Risk must be considered during the alloca-tion and operation of cloud appliances. For example, a client that needs highavailability would negotiate SLAs with a high penalty for the provider in caseof SLA violation. In such scenario, the Cloud provider has to minimise the PoFof the application according to two complementary strategies:
– For each node nx, minimizing P (nx), which is caused by risk in the node(not propagated). This paper considers two factors that influence in P (nx):hardware lifetime and workload [13]. The failure rate of hardware resourcesis high both at the beginning and the end of the components lifetime. Thereis also direct correlation between the workload and the failure rate, beinghigher during peak hours and lower during off-peak hours. We use statisticalanalysis based on historical data to calculate P (nx).
– Consider decreasing P ′(nx) for each node nx. Analysing risk graphs andproviding redundancy in the critical points of the graph would noticeablyreduce the risks of the system with reasonable economical performance.
Analysing the risk propagation graphs is itself a large research field thatwould require to deep within the research of machine learning and pattern recog-nition algorithms, and how to apply them to this problem. The aim of this paperis to keep the focus in the risk and revenue model. We simplify the graph analy-sis by experimenting only with one template of application. The graph analysishas been done off line and the risk minimization policies always apply the sameaction with the graph: to add redundancy to the nodes whose failures wouldentail a failure to the rest of the application.
Both strategies for minimizing risk would entail an increment in the cost ofoperation. Next section describes a model for the management of the revenueduring both SLA negotiation and operation that would allow providers providingdifferentiated risk levels consistently according to its business objectives.
5 Revenue Modelling
This paper uses Equation 5 to establish the price of a set of Cloud resources, givena time frame. MR is the price for a service (Maximum Revenue, as previouslydefined in Equation 1).
MR = RP +DO +BV (5)
In Equation 5, RP is the Reservation Price: the minimum price the providercan sell a resource without losing money. DO and BV are subjective terms thatmay depend on several conditions. DO is the demand/offer overprice: a clientmay be willing to pay more when there is more demand than offer. DO will tend

to 0 when the demand is much lower than the offer. BV is the Business Value:the amount of money a client is willing to pay for an extra unit of QoS.
Our model calculates RP as the cost of amortization of all the resources thatthe client will use during a given period: the more amortized is a resource thelower is RP . Equation 6 shows how to calculate the amortization cost of a singleCloud resource that is allocated within a physical resource. The RP for a cloudappliance is the addition of the amortization costs for all its resources.
CostAm = (TCO −Amort) ∆t
(LTtotal − LTnow)Hρ (6)
TCO is the Total Cost of Ownership, the cost of the initial investment plusthe common expenses in electricity and maintenance during the whole lifetimeof a resource. Amort is the sum of all the income associated to the provisioningof virtual resources for the given physical resource. ∆t is the time that the clientis willing to use the resource. LTtotal is the Life Time that is planned for agroup of resources: the time since it is provisioned until it is disengaged from thedata centre. LTnow is the Life Time since a resource is provisioned until now.Finally ρ = [0, 1] is a density function that indicates the proportion of a groupof resources to which the cost is being calculated. For example, if a VM requires4 CPUs from a node with 16 CPUs, ρ = 0.25. Finally, H is the percentage ofusage of the resources as envisioned by the provider to this time. If H = 1, theprovider would consider that all the resources that are assigned to a VM are atfull occupation during this time. If the resources are underutilized, the value Hwould proportionally increase the reservation price that is needed for actuallyamortizing completely a resource at the end of its lifetime.
To avoid inequalities in the amortization of individual resources with thesame age, we group all resources from the same type and age into an accountinggroup. Then the values TCO, Amort, ρ and LT apply to the total of resourcesinstead of individual ones. Equation 6 differs from the traditional way to calculatethe amortization cost, TCO/LTtotal, because this formula assumes full load anddoes not consider how the value of a resource decreases over time.
To calculate DO overprice, our previous work [7] demonstrated that theDO must be low when the offer/demand ratio is high enough to allow users tochoose from a big enough set of providers, and high only in peak hours, whenmost resources are busy.
Calculating BV is difficult because it may rely on several hidden variablesthat depend on the client, the market status, the reputation of the provider,etc. Instead of trying to synthesize them in a mathematical formula, MachineLearning techniques can allow providers estimating this value. However, thosetechniques are out of the scope of this paper. We apply a fixed overprice for theSLAs in our experiments, according to their level of QoS and Risk.
We account DO and BV within the total of amortized cost, which are over-prices that accelerate the amortization of the resource and cause CostAm value todecrease over time. That will allow the provider using different prices dependingon the age of the resources that are being sold.

6 Evaluation
In our experiments, we used a Cloud Market simulator (available online [11])that adopts the simulation architecture and methodology from our previousworks [7,8]. We simulate 36 months of a IaaS provider that initially owns 50hosts with 16 CPUs each one. The number of deployed services initially oscil-lates between 5 and 60 services/hour, according to a web workload that variesas a function of the hour of the day and the day of the week. To simulate theconsolidation of the business of the provider, the average number of requests islinearly increased until it doubles its initial number at the end of the simulation.Because of the increase of the number of requests, the Cloud provider doubles itsnumber of resources at month 18. From the point of view of Equation 6, there isinitially an accounting group of resources and at the end of the simulation thereare two accounting groups: the initial bunch of resources, and the new resourcesthat were introduced at month 18.
feas2
as1
asn
db
Fig. 2: Basic architecture of a web application
The clients can deploy several types of applications. In our experiments, theclients deploy web services according to the structure in Figure 2: a web front-end (fe) balances the job across a set of n application servers (as1, . . . , asn)that use a database node (db) as persistence layer. The number of applicationservers varies from 2 to 4. The number of CPUs of each node follows a foldednormal distribution [5] with both minimum value and variance equal to 1. Thesame distribution is used to determine the duration of the deployments, withminimum value and variance of 1 hour.
The allocation process of the SLA is the same as described in Section 3. TheIP considers three different SLA allocation strategies, which offer three levels ofrisk for the SLA, from medium to lowest risk:
– Cost Minimization (CMin). The provider prioritizes the allocation of VMsin the hosts given two equally-weighted criteria: high consolidation, to saveenergy costs in hosts that are already running tasks and keep switched offthose hosts that are idle [3]; and amortization, to allow lower prices accord-ing to the model in Equations 5 and 6. Because of high consolidation andresources age, SLAs allocated according this policy have the higher risk.

– Node Risk Minimization (NRMin). The provider prioritizes the alloca-tion of VMs in the hosts according to two equally-weighted criteria: low con-solidation, to lower the risks derived from overload in resources that wouldentail to not provide the agreed QoS; and resource age, trying to avoid theresources that are new and those resources that are near the end of theirlifetime [13]. Figure 3 shows the used distribution of failures as a function ofthe age of the resource.
– Graph Risk Minimization (GRMin). The provider applies Node Riskminimization but, in addition, it analyses the OCCI links to try to detectsingle point of failures. Given the model in Section 4, the provider woulddetect that a failure in the database node would entail a failure in the wholeapplication, so it decides to replicate it.
Fig. 3: Probability of Failure of resources over time
CMin NMin GRMin
MP -MR -1.5MR -2MRMRT 0.15∆t 0.1∆t 0.05∆tMPT 0.75∆t 0.5∆t 0.3∆t
Table 1: Revenue function values for each group of SLAs
The client selects the type of risk minimization strategy as a function of therisk needs of its application. When the IP calculates the price, it applies a fixedoverprice of 50% to the NRMin SLAs and 100% to the GRMin SLAs. In additionto the overprice, that determines the MR value of Equation 1, the risk level alsodetermines MP , MPT and MRT . Lower values for MP , MPT and MRT implythat there is less tolerance to failures for low-risk SLAs (see Table 1), because vtwill reach MRT sooner (see Figure 1). These fixed values, as well as the otherconstants that the simulation relies on, are not intended to reflect real marketdata but to evaluate the model in terms of relative results and tendencies.
Evaluating risk minimization policies. The graphics of this section showweekly average values to make them more clear and understandable, because
hourly or daily averages are highly influenced by the workload oscillations. Theweekly granularity for the values is also accurate enough because the simulationis long-term enough (36 months) to show clearly the tendencies of the metricsused to evaluate the effectiveness of the policies.
(a) Average age of resources (b) Average PoF
(c) Average violation percentage
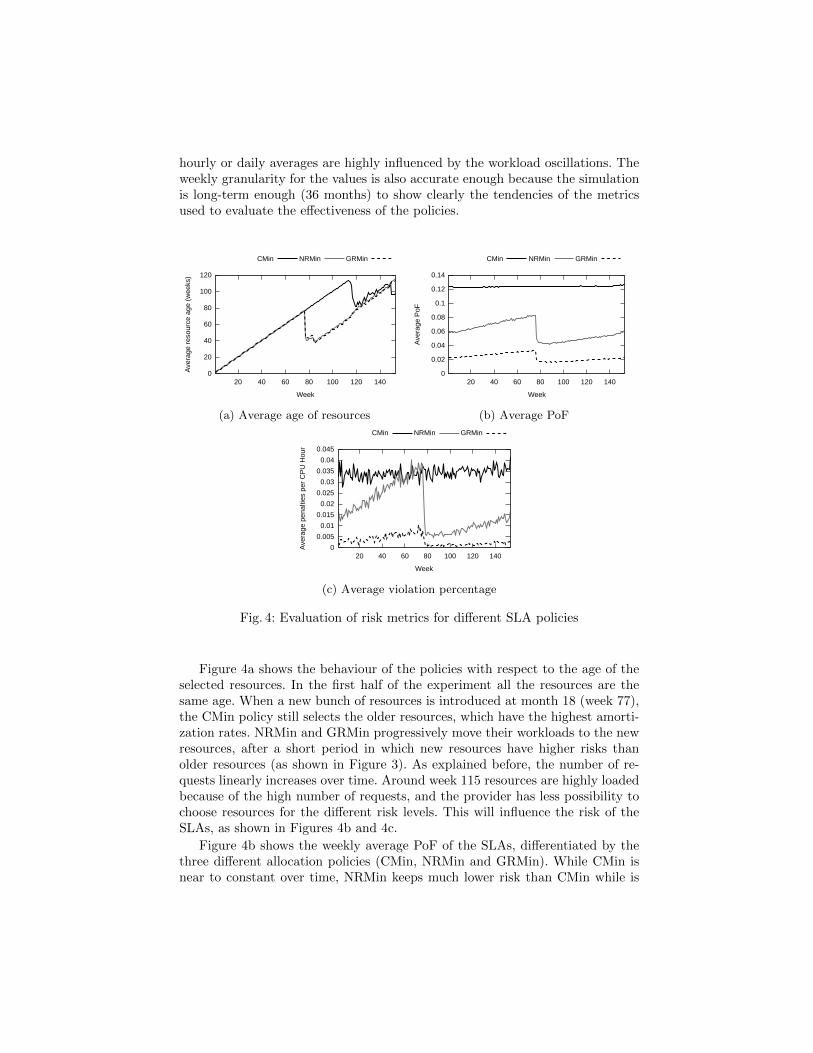
Fig. 4: Evaluation of risk metrics for different SLA policies
Figure 4a shows the behaviour of the policies with respect to the age of theselected resources. In the first half of the experiment all the resources are thesame age. When a new bunch of resources is introduced at month 18 (week 77),the CMin policy still selects the older resources, which have the highest amorti-zation rates. NRMin and GRMin progressively move their workloads to the newresources, after a short period in which new resources have higher risks thanolder resources (as shown in Figure 3). As explained before, the number of re-quests linearly increases over time. Around week 115 resources are highly loadedbecause of the high number of requests, and the provider has less possibility tochoose resources for the different risk levels. This will influence the risk of theSLAs, as shown in Figures 4b and 4c.
Figure 4b shows the weekly average PoF of the SLAs, differentiated by thethree different allocation policies (CMin, NRMin and GRMin). While CMin isnear to constant over time, NRMin keeps much lower risk than CMin while is

noticeably influenced by the load of the resources. The PoF for NRMin SLAsincreases linearly over time as the number of application executions also increasesbecause the possibility to choose is reduced. When the number of resources isdoubled, the PoF of NRMin is reduced again, while the PoF of CMin is keptconstant, because the policy still chooses the older resources. GRMin SLAs arealso sensible to the load of resources because the allocation policy is the sameas NRMin, but the elimination of the single point of failure causes the systemkeeping much lower risk rates.
The PoF has a direct impact in the economic penalties as consequence of theviolations of the SLAs. Figure 4c shows the strict correlation of the economicpenalties with the probability of failure. The economic impact of failures is higherin SLAs allocated with low-risk policies (NRMin and GRMin), because both theprices and the penalties are higher for these SLAs (see Table 1). Figure 4c, aswell as the rest of figures with economic information in our evaluation, does notshow absolute economic values, but values divided by CPU hours to facilitatethe comparison of data from appliances with different size and different time.
(a) Average revenue per CPU hour (b) Average net profit per CPU hour
Fig. 5
Evaluating the modelling of the revenue. Figure 5a shows the averageprice per CPU hour for the different types of SLAs. During the initial part ofthe experiment, the price decreases because the resources are being amortizedwhich, applying the pricing model of Equation 5, reduces RP . Figure 5b showsthat during this period the profit (the revenue minus the reservation price minusthe penalties) for CMin policy can be improved because the market allows higherprofit margin: RP decreases but DO and BV may increase in a lower proportionto decrease prices while increasing the profit margin. On the other side, profitfor risk minimization policies keeps near constant during this period (despite theprice reduction) because the business value (BV ) of low-risk SLAs is higher (theusers are willing to pay more for this extra QoS). In consequence, the providerhas more room to increase its margin profit with risk minimization policies.

Figure 5a shows that, when the resources are doubled at the half of theexperiment, prices increase for risk minimization policies because they tend toallocate tasks in newer resources with a lower amortization rate than older re-sources. CMin policy keeps constant prices because this policy still allocates theservices in the older resources.
Although the penalty rate increases for minimization policies in the firsthalf of the experiment (from week 1 to week 77), as shown in Figure 4c, theimpact of penalties in the net profit is proportionally low because of the differentscaling of Figures 5b and 4c. For this reason, the profit of NRMin and GRMinpolicies slightly decreases over time. However, when new resources are added, theincurred price increment and the reduction of SLA penalties have some positiveimpact in the net profit. The influence of penalties in CMin SLAs remains quitestable during the whole simulation.
7 Conclusions and future work
This paper introduces a model to differentiate SLAs as a function of multiplerisk levels and adapt the provisioning of resources to multiple client profiles ina Cloud Market. We introduce three policies for each differentiated risk profilethat we present in the paper: cost minimization, risk minimization at individ-ual node level, and risk minimization at graph level. In addition, we introducean accounting model that allows the provider adjusting prices to the risk as afunction of the amortization of the resources. Our model also helps adaptingprices at the long-term, allowing the provider to estimate how the price of theresources decays over time.
The risk propagation model will be improved in the future with bidirectionaldependencies and allowing cyclic graphs. The node-level risk analysis will also beimproved by exploring alternative methods to the statistical analysis: machinelearning, non-linear regressions, etc.
The other main line for future research is related to the automated analysisof graphs. New pattern recognition techniques must be introduced to allow theprovider to automatically identify critical points of failure and suggest correctiveactions that would minimize the risk only in the required points of the graph toavoid soaring the costs due to the excess of redundancy.
Regarding revenue modelling, we will work on techniques to discover theBusiness Value of resources. In other words, it is important that the provider es-timates accurately how clients are willing to pay the additional QoS to maximizethe profit of the provider without losing clients.
Acknowledgement
This work is supported by the Ministry of Science and Technology of Spain andthe European Union (FEDER funds) under contract TIN2012-34557 and by theGeneralitat de Catalunya under contract 2009-SGR-980.

References
1. Becker, M., Borrisov, N., Deora, V., Rana, O.F., Neumann, D.: Using k-pricingfor penalty calculation in grid market. In: 41st Hawaii International InternationalConference on Systems Science (HICSS-41 2008). pp. 97–106. IEEE ComputerSociety, Waikoloa, Big Island, HI, USA (January 2008)
2. Djemame, K., Padgett, J., Gourlay, I., Armstrong, D.: Brokering of risk-awareservice level agreements in grids. Concurr. Comput. : Pract. Exper. 23(13), 1558–1582 (Sep 2011), http://dx.doi.org/10.1002/cpe.1721
3. Guitart, J., Macias, M., Djemame, K., Kirkham, T., Jiang, M., Armstrong, D.:Risk-driven proactive fault-tolerant operation of iaas providers. In: 5th IEEE In-ternational Conference on Cloud Computing Technology and Science (CloudCom2013). Bristol, Uk (December 2013)
4. Jensen, F.V.: An introduction to Bayesian networks, vol. 210. UCL press (1996)5. Leone, F., Nelson, L., Nottingham, R.: The folded normal distribution. Techno-
metrics 3(4), 543–550 (1961)6. Li, B., Gillam, L.: Risk informed computer economics. In: Proceedings of the 2009
9th IEEE/ACM International Symposium on Cluster Computing and the Grid. pp.526–531. CCGRID ’09, IEEE Computer Society, Washington, DC, USA (2009),http://dx.doi.org/10.1109/CCGRID.2009.18
7. Macias, M., Guitart, J.: Client classification policies for SLA negotiation and allo-cation in shared cloud datacenters. Lecture Notes on Computer Sciences (LNCS)7150, 90–104 (December 2011)
8. Macias, M., Guitart, J.: Client classification policies for SLA enforcement in sharedcloud datacenters. In: 12th IEEE/ACM International Symposium on Cluster,Cloud and Grid Computing. pp. 156–163. Ottawa, Canada (May 2012)
9. Metsch, T., Edmonds, A.: Open Cloud Computing Interface - Infrastructure. Tech.Rep. GFD-P-R.184, Open Grid Forum (2011)
10. Neumann, D., Stoesser, J., Anandasivam, A., Borissov, N.: SORMA - building anopen grid market for grid resource allocation. In: 4th international conference onGrid economics and business models (GECON’07). pp. 194–200. Springer-Verlag,Berlin, Heidelberg (2007)
11. Risk-aware cloud market simulator. Online, https://github.com/mariomac/riskCloud12. Sawade, C., Landwehr, N., Bickel, S., Scheffer, T.: Active risk estimation. In: Pro-
ceedings of the 27th International Conference on Machine Learning (ICML10). pp.951–958. Omnipress, Haifa, Israel (June 2010)
13. Schroeder, B., Gibson, G.A.: A large-scale study of failures in high-performancecomputing systems. In: Proceedings of the International Conference on DependableSystems and Networks. pp. 249–258. DSN ’06, IEEE Computer Society, Washing-ton, DC, USA (2006), http://dx.doi.org/10.1109/DSN.2006.5
14. Simao, J., Veiga, L.: Flexible slas in the cloud with a partial utility-driven schedul-ing architecture. In: Cloud Computing Technology and Science (CloudCom), 2013IEEE 5th International Conference on. vol. 1, pp. 274–281 (Dec 2013)
15. Wee, S.: Debunking real-time pricing in cloud computing. In: 11th IEEE/ACMInternational Symposium on Cluster, Cloud and Grid Computing 2011. pp. 585–590 (may 2011)
16. Yeo, C.S., Buyya, R.: Integrated Risk Analysis for a Commercial Computing Ser-vice in Utility Computing. Journal of Grid Computing 7(1), 1–24 (Mar 2009)