a rfid-based infection prevention and control mechanism in
TRANSCRIPT

A RFID-Based Infection Prevention and Control Mechanism in AgedCare Living Residences
Lun-Ping Hung1& Nan-Chen Hsieh1
& Chien-Liang Chen2
Accepted: 26 November 2020# The Author(s), under exclusive licence to Springer Science+Business Media, LLC part of Springer Nature 2021
AbstractIn recent years, aged care living has drawn attention because of population aging and extension of average lifespan. Moreover,the rapid development of information communication technology and the internet of things lay the foundation for the applicationof sensor networks and cloud computing on medical care. Most elderly often suffer from chronic diseases due to weakerimmunity causing a higher infection risk. The problem of infection controlling is an essential issue for residences living in agedcare facilities. In the past, for infection control, medical personnel use the manual method of tracking, investigating, andinterviewing patients to obtain patient contact list. This method cannot identify residents who have a high risk of infection,distinguish the distance between patients and other residents, and evaluate the risk of infection. To isolate all the residents whocontact patients is the only solution that does not only cause repulsion of other residents but also waste medical resources. Thisstudy proposes a visual infection control positioning system for aged care facilities using the RFID (Radio FrequencyIdentification) technology and IoT technology. It can calculate the distance between users and reduce the positioning error.The system combines location fingerprinting with the K-nearest neighbor algorithm to fix errors caused by signal fluctuation ofRFID to improve the positioning accuracy. The system records the indoor movement path of the residents in a real-time mannerthrough the positioning function. When infectious diseases spread in aged care living residences, to help medical personnel, thesystem can screen out residents with a high risk of infection who closely contact with patients according to the movement path ofthe patients and other residents, and visually display them. For some infectious diseases, residents who live together with patientsmay be infected even if they do not have contact with the patients closely. This system can also identify the residents whosecumulative contact time exceeds the limit according to the medical definition of various infectious diseases and input time value.
Keywords IoT . Infection control . Aged care living residences . RSSI . RFID . Location fingerprinting
1 Introduction
In recent years, aging is increasingly serious according to de-mographic change. The statistic data released by the UnitedNations showed the people aged above 50 in most of the de-veloped regions increased by 1% annually, and the populationgrew from 287 million to 417 million. The aging populationwill increase by about 50% [1]. Due to the growth of the agingpopulation, long-term care of the elderly is a concern [2]. Howto provide a better care environment is an important issue for
modern scientific research. In general, international long-termcare facilities can be divided into the nursing facilities and res-idential care facilities. In Taiwan, there are nursing facilities,long-term care facilities, and elderly dwelling. The aged careliving residences are a type of elderly dwelling [3–8]. The nurs-ing facilities and long-term care facilities serve the elderly withmental and physical diseases. The aged care living residencesprovide service for the elderly who can live independently. Ascompared to other care facilities, the aged care living residencesoffer a concentrated residential environment which is like com-mon dwellings and are different from hospital-type long-termcare facilities. The residents in the aged care living residencescan move freely and enjoy the unrestricted living environment.The free residential environment can improve life quality, butthey cannot effectively control infection.
Infectious diseases have many channels of infection. Forexample, TB (tuberculosis) can spread through droplet, drop-let nuclei, and dust. The residents who have close contacts
* Chien-Liang [email protected]
1 Department of Information Management, National Taipei Universityof Nursing and Health Sciences, Taipei City, Taiwan
2 Department of Innovative Living Design, Overseas ChineseUniversity, Taichung City, Taiwan
Mobile Networks and Applicationshttps://doi.org/10.1007/s11036-020-01707-z

with the patients may inhale droplet when TB patients acough. Thus, they have a higher infection risk. The residentswho live with patients in one house or contact the patients for8 h or are exposed to the patients over 40 h may inhale dropletnuclei of patients. In addition to TB, for many infectious dis-eases, the distance between patients and other residents andthe cumulative exposure time can affect the infection risk. Inthe past infection control process, if medical personnel findTB patient, they would check the residents who contact thepatient and conduct the manual method of tracking and inves-tigating, and isolate the residents to avoid the spread of thedisease. This manual method can neither correctly record thepatient contact list and cumulative contact time, nor identifythe residents who closely contact patients. Medical personnelonly interviewed the patient, so the control effect is limited.Those residents with high infection risk cannot be identified ina real-time manner, and the medical resources cannot be ef-fectively allocated. As the elderly come to the hospital fre-quently, cluster infection in the hospital may occur. In recentyears, increasing attention has paid to the infection control inthe nursing facilities and long-term care facilities, and thegovernment has announced measures for the control [9, 10].However, the traditional infection control using manual meth-od neither solves the problem nor satisfies the needs of mod-ern care. To solve this problem, researchers have explored thepossible application method to create a better care environ-ment, and input many information technologies for support,hoping to make the infection control in long-term care achievetwice the result with half the effort. This study applies IT toinfection control in aged care living residences and also estab-lishes a modern infection control process for long-term carefacilities for the elderly.
The primary purpose of this study is to record indoormove-ment path of residents in the aged care living residences anddistinguish the distance between patients and other residents.One of the primary functions is indoor positioning of resi-dents. In a modern environment, GPS (Global PositioningSystem) can provide accurate outdoor positioning, but no de-vice can provide positioning in both indoor and outdoor
environments. The indoor positioning device can be dividedinto the following types: Indoor GPS (Indoor GlobalPositioning System), INS (inertial navigation System),Infrared, UWB (ultra wide band), WLAN (wireless local areanetwork), RFID (Radio Frequency Identification), ultrasoniclocalization, computer vision, etc., N., Li, X., Luo et al. Thecomparison of these devices is shown in Table 1 [11–14].
The balance between the device accuracy and the cost persquare meter should be achieved as the aged care living resi-dences are the large-sized environment, and are equipped withmany indoor devices. The movement of the residents in thevillages may obstruct the direct-line transmission, so the de-vice is required to transmit signals in non-direct line. As theresidents in the aged care living residences can move freely, ifthe device cannot provide wireless transmission, the residentmovement may be restricted. After considering the above con-ditions and comparing the indoor positioning devices, posi-tioning accuracy and the costs of the RFID can meet the needsof this study. Moreover, RFID features wireless transmissionand non-direct line transmission. Thus, it is the most suitableindoor positioning device in this study.
RFID is widely applied in industry and has been extensive-ly studied in academic research. Hence, RFID’s indoor posi-tioning algorithm undergoes continuous development andevolution. Real-Time Location Systems (RTLS) is an imme-diate addressing system through which personnel and items inthe environment can be addressed immediately. This systemcan be divided into four positioning modes, including theangle of arrival (AOA), time of arrival (TOA), time differenceof arrival (TDOA) and received signal strength indicator(RSSI). AOA conducts estimation with the angle of arrivalof signals, which needs the isotropic antenna for positioning.As signal refraction often occurs in the indoor environment,signal direction cannot be identified. The positioning will beinaccurate. TOA (time of arrival) conducts estimation basedon the time taken to transmit signal from Tag to Reader.TDOA (Time difference of arrival) which is similar to TOAperforms evaluation based on the difference of time when Tagarrives at each Reader. These two methods need highly
Table 1 Table of specification of different positioning equipment
Device IGPS INS WLAN UWB RFID Infrared
Accuracy 1 ~ 2cm
1.10 ~ 4.15 m 4.53 ~ 6.89 m 6 ~ 50 cm 1.55 ~ 3.11 m 30 ~ 50 cm
Cost per square meter (US$) 380 20 3 140 25 17
Non-direct line transmission No Yes Yes Yes Yes No
Resistance to signal interference No Yes No No No No
Wireless communication No No Yes Yes Yes Yes
Standalone RAM Yes Yes No No Yes No
Independent power Yes Yes No No No No
Mobile Netw Appl

accurate arrival time of the signal. In practice, this is difficultto achieve, so they are seldom used [15, 16]. RSSI uses thesignals from Tag to Reader to estimate positions. An increasein the distance between Tag and Reader is directly proportion-al to signal attenuation, and this method can be used for posi-tioning. This positioning method does not require any partic-ular device and can meet the needs of the actual application.Thus, this positioning method has been widely adopted andresearched, and new positioning methods have been continu-ously developed based on it.
Nan Li, Burcin Becerik-Gerber reviewed these RSSI posi-tioning methods and classified them into three types [13]. Thefirst one is triangulation, which initially uses RSSI. It uses thedirect-line distance between Tag and Readers as the standardfor measurement. In an indoor environment, three Readers arebuilt. As the distance from each Reader to Tag differs, thesignals by the three Readers are also different. The users canadd the relationship between the increase in range and thedecrease in signals in calculating to estimate the position ofa target. However, there are many materials such as metal andglass in the indoor environment. These materials may causesignal refraction. As signal refraction occurs, the transmissionpath becomes unpredictable, and the signals cannot be sent toReader in a straight line. Thus the triangulation loses efficacy.This method, therefore, has been seldom used in recent years.The second type is proximity, which can divide the environ-ment into several areas according to needs. Many Tags aredeployed in these areas, and these tags are called the RT(Reference Tag), which can continuously send signals toReaders in the environment. The signal by each RT representsa signal of one area in the environment. When the target per-son or item with the Tag moves in the environment, the
Reader will receive a signal by RT and target Tag. The com-parison shows which target Tag is closest to the RT to estimatethe area where target Tag is located. The arrangement methodis shown in Fig. 1.ManyRTs are arranged in the environment.The larger the environment, the more the RTs, the higher thesetup costs and maintenance costs. Thus, this method is ap-plied to the smaller environment.
The third one is scene analysis, which is similar to theproximity. It divides the environment into several areas ac-cording to needs. For this method, RT is built in each areaand each RT one area. The difference between this methodand the proximity method is that this method does not placeRT in the environment continuously and it removes it untilcertain quantities of signals collected from this area areachieved. The collected signals are stored in the database.When the target person or item with tag moves in the envi-ronment, the target signal can be compared with the storedsignals in the database to find the closest RT to estimate thearea where the users are located. When four readers are ar-ranged in the environment, each area collects four signals. Thepositioning accuracy can be improved by increasing the num-ber of readers. The signal collection method is shown inFig. 2. Both this method and the proximity method need theassistance of RT in the environment. However, the scene anal-ysis does not continuously put RT in the environment whichcan reduce device cost and maintenance cost.
The three types of positioning methods using RSSI havetheir advantages and disadvantages, and the selection dependson the demand of users. The three methods also have devel-oped different positioning mechanisms and algorithms, suchas MinMax, Ring Overlapping Circle RSSI, MaximumLikelihood, Fingerprinting and K-nearest neighbor (KNN),
Reader 1
Reader 3
Reader 2
Reader 4
Reference Tag 1
Area A
Reference Tag 5
Area E
Reference Tag 9
Area I
Reference Tag 13
Area M
Reference Tag 2
Area B
Reference Tag 6
Area F
Reference Tag 10
Area J
Reference Tag 14
Area N
Reference Tag 3
Area C
Reference Tag 7
Area G
Reference Tag 11
Area K
Reference Tag 15
Area O
Reference Tag 4
Area D
Reference Tag 8
Area H
Reference Tag 12
Area L
Reference Tag 16
Area P
Fig. 1 Proximity arrangement diagram
Mobile Netw Appl

etc. [14, 17]. This study is intended to build an infection con-trol system for aged care living residences. The residents in theenvironment can move freely, which cannot ensure the trans-mission of signals in the direct line between Tag and Reader.The triangulation with the direct-line transmission is not ap-plicable. The aged care living residences are the large sizedenvironment with fixed layout and facilities. If the proximitymethod is used, many RTs are required, making the mainte-nance more difficult. Given that the cost of equipment andsignal refraction, this study uses the scene analysis as theprimary positioning method. The investigation of the position-ing mechanism and the algorithms of scene analysis show thatthe location fingerprinting as a positioning method has a widerange of applications [13]. The world’s first WIFI based in-door positioning system is RADAR proposed by Microsoft[18]. X. Luo tested it in building environment [14]. BulutAltıntaş applied it to the medical field by combining it withmobile devices [19]. This study also establishes the position-ing mechanism. The remainder of this paper is organized asfollows: Section 2 introduces the positioning mechanism of
the infection control system for aged care living residencescontains Calibration Phase and Location Estimation Phase,and this method can be used to record and compute the posi-tion of the residents in aged care living residences, Section 3introduces the system structure and development; Section 4describes the experimental results.
2 Methodology
This study establishes the system positioning mechanism bycombining location fingerprinting with the KNN algorithm.The primary function of the positioning mechanism is to trackthe target in the environment. The target can be called mobileunit (MU) containing person and item. This mechanism con-sists of two phases: 1) building fingerprints database contain-ing many signals, which is called calibration phase; 2) tracingmechanism using K-Nearest Neighbor (KNN) and EuclideanDistance, which is called the location estimation phase.
Reference Tag 1
Area A
Reader 1 -40
Reader 2 -51
Reader 3 -62
Reader 4 -70
Reader 1
Reader 3
Reader 2
Reader 4
Reference Tag 2
Area B
Reader 1 -51
Reader 2 -62
Reader 3 -61
Reader 4 -77
Reference Tag 3
Area C
Reader 1 -62
Reader 2 -45
Reader 3 -80
Reader 4 -55
Reference Tag 4
Area D
Reader 1 --70
Reader 2 -42
Reader 3 -77
Reader 4 -65
Reference Tag 5
Area E
Reader 1 -59
Reader 2 -86
Reader 3 -42
Reader 4 -79
Reference Tag 6
Area F
Reader 1 -65
Reader 2 -69
Reader 3 -73
Reader 4 -78
Reference Tag 7
Area G
Reader 1 -78
Reader 2 -62
Reader 3 -78
Reader 4 -68
Reference Tag 8
Area H
Reader 1 -78
Reader 2 -58
Reader 3 -75
Reader 4 -78
Reference Tag 9
Area I
Reader 1 -72
Reader 2 -83
Reader 3 -65
Reader 4 -71
Reference Tag 10
Area J
Reader 1 -76
Reader 2 -82
Reader 3 -72
Reader 4 -75
Area K
Reader 1 -86
Reader 2 -81
Reader 3 -76
Reader 4 -72
Area L
Reader 1 -80
Reader 2 -75
Reader 3 -71
Reader 4 -62
Area M
Reader 1 -76
Reader 2 -90
Reader 3 -45
Reader 4 -70
Area N
Reader 1 -80
Reader 2 -85
Reader 3 -70
Reader 4 -75
Area O
Reader 1 -80
Reader 2 -70
Reader 3 -50
Reader 4 -40
Area P
Reader 1 -81
Reader 2 -70
Reader 3 -67
Reader 4 -40
Reference Tag 11 Reference Tag 12
Reference Tag 14 Reference Tag 15 Reference Tag 16Reference Tag 13
Fig. 2 Signal database diagram of scene analysis
Mobile Netw Appl

2.1 Calibration phase
In this section, a training database which stores Tag signalscollected from the environment for computation in locationestimation phase. In this positioning mechanism, the decreaserelationship between the signal and the distance is listed in thisdatabase. As refraction, reflection and diffraction of signals inthe environment are prone to occur; they may cause position-ing error if the distance is used for estimation.
In the process of creating the database, Readers should befirst arranged in the environment. This study arranges fourReaders. Each has different positions. Thus, the signal collect-ed by each Reader for the same Tag is different. After arrange-ment, these Readers can cover the global environment, and theenvironment is divided into several areas. Moreover, Tags areplaced in the environment for collecting signals. These Tagsin the environment can be used as Reference Tag (RT). This isan important phase as it affects the accuracy of the subsequentcalculation. The areas, quantity RT, division and position de-pend on user needs.
The RT signals in each area and the coordinate positionsare stored and recorded in this database. The storage formatsdiffer according to the algorithms. For the unit format in thisstudy, each stored signal and its coordinate number areassigned with one number and are regarded as CP(Calibration Point), and the unit formats include CPn (X, Y)[RSSI1 RSSI2, RSSI3... RSSIn]. CPn is number code, X rep-resents the horizontal coordinate of the code, Y is verticalcoordinate, RSSIn is collected signals, and the last numberrepresents the Reader which collects the signal. The quantityof signals changes with the quantity of arranged Readers in theenvironment and the Readers collect signals from each area ofthe environment.
As previously mentioned, the RFID signals may be differ-ent as the environment changes. In collecting RT signals in theenvironment, if all drifted signals are written into the database,positioning will be inaccurate, and the database will be huge.These may also reduce the calculation efficiency of the data-base. Many studies have suggested the signals to be used RTsignals and recorded in the database. The algorithm mecha-nism proposed by this study can estimate position throughlocation estimation phase, calculate the average value of thecollected RT signals, and use the average value as the RTsignal in the design of the training database after collectionof the signals and removal of outliers. This can reduce the loadof the database and improve algorithm efficiency. After RTvalues are stored in the database, the training database can becreated for calculation of Location Estimation Phase.
2.2 Location estimation phase
The second part of the Location Fingerprinting is locationestimation phase. The main purpose of this phase is to
calculate the position of MU in the environment. The calcula-tion method is to compare theMU signals with the Radio Mapdatabase in the calibration phase. In signal comparison, thedistance formula should be used. This study uses EuclideanDistance formula which can calculate the distance betweentwo points in the space.
This study constructs a mathematical model for Radio Mapdatabase in calibration phase. Assume there is n Readers, andthe RSSI from any point to all Readers is (ο1,⋯, οi,⋯, οn)where 1 ≤ i ≤ n. οi is the measured RSSI value of the i Reader.Assume there is m RT, and the signal measured by thej-reference tag can be expressed by γj = (οj, 1,⋯, οj, i,⋯, οj,n), where 1 ≤ j ≤m. οj, i is the RSSI value of iReader measuredby the j RT. In the indoor environment, we direct at RSSIvalue of each Reader collected by each RT in many times.Thus, we use οj, i, k to express the RSSI value of the iReader measured by the j reference tag in the k times. Wecalculate the average value of the RSSI values of all Readerscollected by each RT. Thus, the average value of the signalsmeasured by the j RT in t times is expressed by.
γ j ¼ ο j;1;⋯; ο j;i;⋯; ο j;n
� �; where
ο j;i ¼ 1
t∑t
c¼1ο j;i;k 1≤ i≤n; and 1≤ i≤n
ð1Þ
Thus, the database can be expressed by m × n matrix,
Δ ¼ γ1;⋯; γ j;⋯; γm� �T
, where 1 ≤ j ≤m.
In online phase, the RSSI values received from the nReaders at the MU coordinate position ℓ in indoor space canbe expressed by (λ1,⋯, λn), and compare RSSI values at MUcoordinate position with the signal database. The EuclideanDistance formula is used to calculate the distance betweenMU coordinate position ℓ and the coordinate j of each RTand find the reference point K closest to MU. The calculationformula is as follows:
d ℓ; jð Þ ¼ffiffiffiffiffiffiffiffiffiffiffiffiffiffiffiffiffiffiffiffiffiffiffiffiffiffiffi∑n
i¼1λi−ο j;i
� �2s
ð2Þ
From the above, if we can calculate the distance in Euclideanspace with MU coordinate position ℓ and the coordinate j ofeach RT, and reference point closest to ℓ, we can determine thecoordinate of RT closest to ℓ, that is the approximate coordinateposition L of ℓ. Thus, L = f(argmin dis(ℓ, j)), where f is a func-tion: correspond the RT signal value to RT coordinate.Calculate the distance in the Euclidean space with the coordi-nate position ℓ and coordinate j of each RT, and calculate the kRT closest to distance ℓ. Assume the coordinate positions of thek points closest to RT are ℓ1, ℓ2,⋯, ℓk, and obtain the approx-imate coordinate position L with arithmetic method
L ¼ 1
k∑k
i¼1ℓi ð3Þ
Mobile Netw Appl

KNN concept is to compare the required value to the valueof the training database through the distance formula, to findthe most approximate CP. The quantity of the CP depends onthe user needs. If assume K is 1, search for the closest CP, andif assume K is n, search for the n nearest CP, and assign theweights regarding the distance betweenMU and eachK value.The quantity of K may directly affect system calculation effi-ciency and positioning accuracy, so the amount must be de-termined by user needs.
3 System structure and development
In this section, we establish a set of infection control systemfor aged care living residences according to the indoor envi-ronment and the infection control process. The Readers arearranged based on RFID positioning method, and the systemarchitecture is shown in Fig. 3.
3.1 System architecture
The system architecture is divided into three parts: Tag infor-mation acquisition, RFID control center and the remote
monitoring system. In the data acquisition, the Tag informa-tion can be collected from the village indoor environment,including houses, restaurants, shops, sports center, lounge,and other indoor areas.
RFID control center consists of RFID relay software, data-bases, and RFID positioning and calculation system. When theReaders receive the signals from Tag, the Readers convert thereceived signals. The Tag ID Tag information and receipt timeinto the format that database can read through RFID relay soft-ware and written in the database at the same time. The relaysoftware can convert the data format, remotely control startupand shutdown of each Reader, and monitor normal work ofeach Reader to facilitate system maintenance by the managers.The database stores detailed information of each Reader andTag, including write-in record of Reader signals, and informa-tion that matches with residents of all Tags which contains IDnumber and the movement path of residents. After the systemcompletes positioning calculation, the remote monitoring sys-tem can obtain the target location, and display it in a visual andreal-time way on the terminal device of system users.
The residents of aged care living residences arematched with their Tags when they live in the villages.When the residents move freely in the environment, the
Fig. 3 System architecture diagram
Mobile Netw Appl

Tags move together with residents. In the movement, theReaders in the aged care living residences may read theTag signal strength and transmits the read signal strengthto the RFID relay system. The relay system stores theinformation in the database, and then reads the movementsignal strength from the database, and sends the data tothe positioning calculation system for positioning calcula-tion. After calculation, the results are stored in the data-base. If medical personnel identify the patients with infec-tious diseases in aged care living residences, they canexamine other residents, and input the patients and infec-tion conditions of infectious diseases to the system, whichcan perform automatic calculation according to the inputconditions in the database and identify the contacts withhigh risk. After the system identifies contacted residentswith high risk, the medical personnel check the contactedresidents and report the examination results to the healthbureau. The health bureau can take measures for infectionsituations. This developed infection control system flowchart is presented in a UML sequence diagram, and theoverall flow is shown in Fig. 4.
3.2 System selection conditions of residents with highrisk
As there are many notifiable diseases, this study uses the in-fection routes, infectivity and impact of the infectious diseasesas the factors, and selects three diseases with stronger infec-tion in an indoor environment, tuberculosis (TB), SARS(Severe Acute Respiratory Syndrome) and norovirus. The firstdisease is tuberculosis (TB), which has many infection routessuch as droplet and droplet nuclei (after evaporation of drop-lets), dust (containing pathogen and greater droplets), etc.New TB patients can be effectively found by examining otherresidents who contacted the patients. One-third of residentswho contact TB patients will be infected or become the po-tential infectors. The second disease, SARS, mainly spreadsthrough droplets at close range. Thus, the distance betweenother residents and patients can affect infection risk. If otherresidents touch their mouth or nose after they contact the pa-tient’s droplet, they may be infected. The third disease,norovirus, is a type of viral gastroenteritis with strong infec-tion. Norovirus can spread quickly in densely populated
Health agencyRFID relay
system
Resident+Tag
RFID ReaderDatabaseHigh risk infected perso
SystemPositioning
calculation system
1.Transfer Tag information to Reader in environment
2.Transfer the extracted Tag information to RFID relay system
3.Format converted and stored in database
4.Extract Tag signal from database
5.Send data to positioning calculation system
6.Positioning calculation
7.Save positioning calculation result in database
8.Detect infected person, start contact examination, input infected person, infection information and conditions9.Obtain calculation result
and related data
10.Screen out high risk infected persons according to the infection conditions entered by doctor
11.Obtain the list of high risk infected persons
12.Examine high risk infected persons for infectious diseases
13.Obtain examination results
14.Report infections to health office
15.Arrange sterilization for closed environment
Doctor
Fig. 4 Unified modelinglanguage sequence diagram of theproposed system
Mobile Netw Appl
facilities. It spreads by droplets, fecal-oral route and directcontact with infected persons, eating food or drinking liquidsthat are contaminated with norovirus, and inhaling the drop-lets from vomit by the infected persons.
This study regards the examination flow of the three infec-tious diseases as main reference objects. For the three dis-eases, the distance between the patients and other residents,the latent period, and the time length for which other residentslive together with the patients can affect infection risk.However, the three diseases have different infection distance,latent period and cumulative contact time which may causeinfection. For this reason, this system permits users to inputthe investigated period regarding the latent period of the dis-ease and transmission distance. The system can identifywhether the distance between patients and other residents issmaller than the transmission distance of the disease. If it islower than the transmission distance, the system lists the res-idents into the list of residents with a high risk of infection, andcalculate the distance between the patients and other residentsaccording to the following formula:
d lrooma ; lroomb
� �t ¼ffiffiffiffiffiffiffiffiffiffiffiffiffiffiffiffiffiffiffiffiffiffiffiffiffiffiffiffiffiffiffiffiffiffiffiffiffiffiffiffiffiffiffiffiffiffiffiffiffiffiffiffiffiffiffiffiffiffiffiffiffiffiffiffiffiffiffixt;rooma −xt;roomb
�� ��2 þ yt;rooma −yt;roomb
�� ��2qð4Þ
where, lrooma is the room of the patient and the position, lroomb isthe room of the resident in the aged care living residences andthe position, d is distance between the patient and the resident,t is the specific time point, xt;rooma and yt;rooma separately repre-sent coordinate positions of x axis and y axis of the lrooma of the
patient at time point t, and xt;roomb and lroomb separately representcoordinate positions of x axis and y axis of the lroomb of theresident at time point t.
For some diseases, the residents who do not have closecontacts with the patient may also be infected in a given timeframe. Thus, this system allows users to input the threshold oftime the resident lives together with the patient and the inves-tigated period. Like the distance comparison function, thissystem can automatically calculate whether the time the resi-dent lives along with the patient reaches the input threshold.The equation for calculating the threshold is as follows:
CT rolea; rolebð ÞT ¼ ∑nd¼1timerooma;b ; if rolerooma ¼ roleroomb
0; otherwise
�ð5Þ
rolea is the patient, roleb is resident in aged care livingresidences, T is the investigated period input by the user, CTis the cumulative time the resident live together with the pa-tient during the investigated period, d is the date in the period,rolerooma is indoor environment of the patient, roleroomb is in-door environment of the resident. If they are in the same en-vironment, the time will be accumulated. timerooma;b is the time
length they share one room within the date d.From the above equation, the system uses calculation
method 1 to obtain a list of residents with a high risk of
infection, and the doctors can check them and confirm wheth-er they are infected and report the check results to the healthbureau.
4 Experimental results
After visiting a well-known long-term care facility in northernTaiwan, this study takes the environment configuration as thereference and simulate an indoor environment for testing. TheRFID signals are collected and tested. The simulated environ-ment has a length of 1340 cm and width of 1120 cm, as shownin Fig. 5. The residents in the simulated aged care living res-idences move freely to test the signal reception and position-ing accuracy.
Many Tags are arranged in this study. Before the experi-ment, each Tag is tested for signal error, and placed in theinterference-free environment to observe whether it needs tobe calibrated. In the experiment, four Tags from 0 m to 5 mfrom Reader are tested for signal error. The test results areshown in Fig. 6. The test results show that the signals betweenthe Tags have some error with extremely difference which hasno significant impact on positioning, so no special calibrationis needed. RFID signal may be affected by items in the envi-ronment. In some studies, the test is conducted in an idealenvironment with less interference. In this environment, wecan reduce the objects which may interfere RFID signals tominimize the interference on the signal during transmission,so that the signals can be transmitted in a straight line, sug-gesting that the signals may be reduced with distance.
The proposed infection control system for aged care livingresidences, developed by this study, needs to be tested in anenvironment that reflects the actual situations. This environ-ment should be full of different devices and items that canreflect signals, thus making the signal transmission unpredict-able. This study tests the change of RFID signals with time inthe ideal environment and the real environment. The testvalues are shown in Fig. 7. As seen, RFID signals may de-crease with distance in the perfect environment. In the realenvironment, the signals at 0 m are the same as those in theideal environment. In other distance, the signals are interferedby the items in the real environment. The signals do not de-crease with the distance, and the signal transmission path can-not be obtained due to too many interference factors. IfReference Tags are arranged in a real environment, we cannotestimate the signals collected from various positions, so thatthe actual measurement method is more accurate.
For the device arrangement, this study arranges the fourReaders on the four corners of the ceiling to reduce signalmasking during transmission between the Reader and theTags. The reading scope of each Reader covers the wholeindoor environment. As shown in the figure, the Readers arenumbered as follows: Reader 1, Reader 2, Reader 3 and
Mobile Netw Appl

Reader 4. The Reader number can help match the signalscollected by the system with the corresponding field. Thearrangement method is shown in Fig. 8.
In the plan of Reference Tags, the indoor environment isdivided equally. The Reference Tag, Reference Point is de-ployed in each area, as shown in Fig. 9. The layout is shown inFig. 10.
This experiment simulates the search using the position in-formation recorded in the databasewhen a TB patient is found inaged care living residences. In the experimental design, thetransmission distance is set to 2 m, and the cumulative timefor infection when other residents live together with the patientsis 40 min. To simulate residents in the aged care living resi-dences, the subjects have a different status. The distribution
Fig. 5 Plan of simulated environment
Fig. 6 Error test chart of Tagsignals
Mobile Netw Appl

Fig. 7 Schematic diagram ofdecrease in signals in differentenvironment
Fig. 8 Deployment of Readers
Fig. 9 Plan map of ReferenceTag
Mobile Netw Appl

and the movement position of the tested persons are shown inFig. 11. The subjects are represented with a number. Patient A isdiagnosed with the infectious disease, the circles around A is thescope of infection, as described in the experiment, and is 2 m.The arrow represents the movement path. Patient Amoves fromthe position I to position II at 9:50, and no personal contacts withthe patient A during the movement. At 9:50 when Patient Amoves from position II to position III, Resident C is 2 m awayfrom Patient A; this distance is within the infection distancedesigned in this experiment. Thus, Resident C has a high risk
of infection. Resident B is 1 m from the patient A when PatientA moves from position III to the position IV. Like Resident C,Resident B has a high risk of infection due to close contact withPatient A. Residents E and F are in the room and do not havecontact with Patient A at close range. However, Residents E andF share a room with Patient A over 40 min. Residents E and Falso have a high risk of infection. Resident D does not contactwith Patient A at close range, and leave the room at 9:35. Thetime Resident D shares the room with Patient A is less than40 min, thus. Resident D has a low risk of infection.
Fig. 10 The deployment of RFIDReference Tags
Fig. 11 Position distribution oftested residents
Mobile Netw Appl
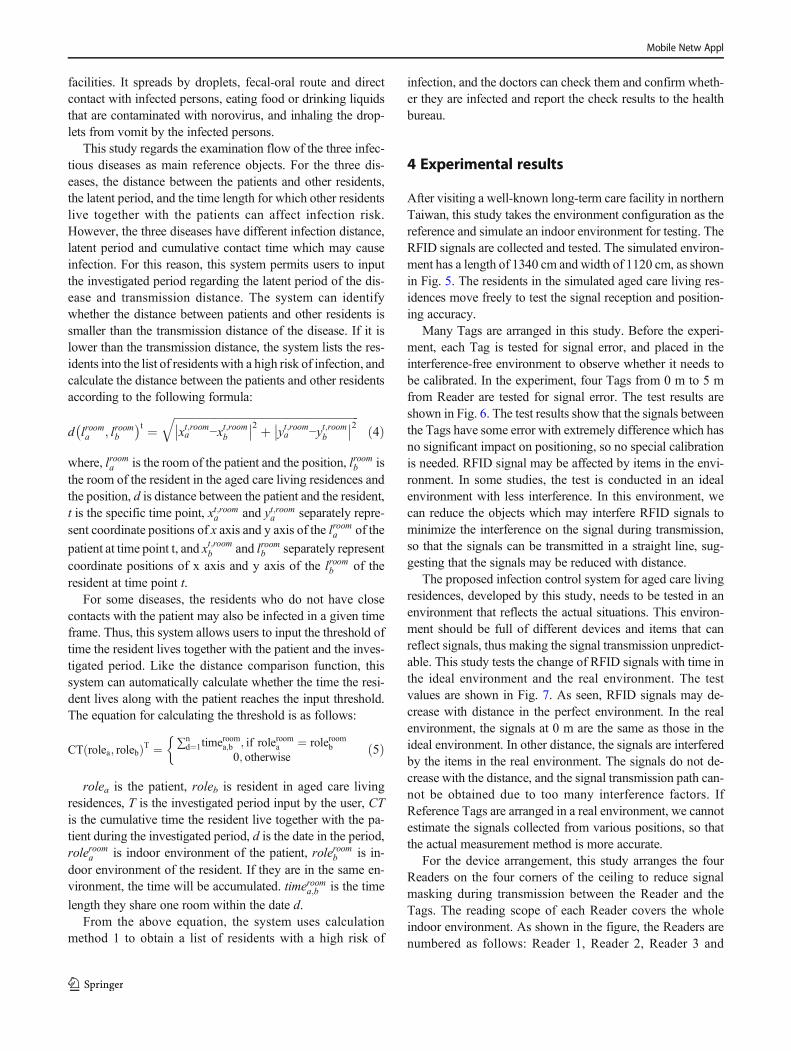
In this phase, the K values are imported into the positioningmechanism to test the accuracy of the positioning systemwhen K values are different. K value is assigned with differentvalues regarding the distance between MU and each CP. Thefarther the distance between CP and MU, the lower theweight, and the closer the distance between CP and MU, thehigher the weight. When the K value is set to 4, the four CPsclosest to MU are calculated by using Euclidean distance, asshown in Fig. 12. After calculation, the system adds up thedistance between the each CP and MU. After being added up,the weighted value of each CP is calculated regarding the
distance between the CPs and MU, and finally, the weightedvalue of each CP is multiplied by coordinates and summed.
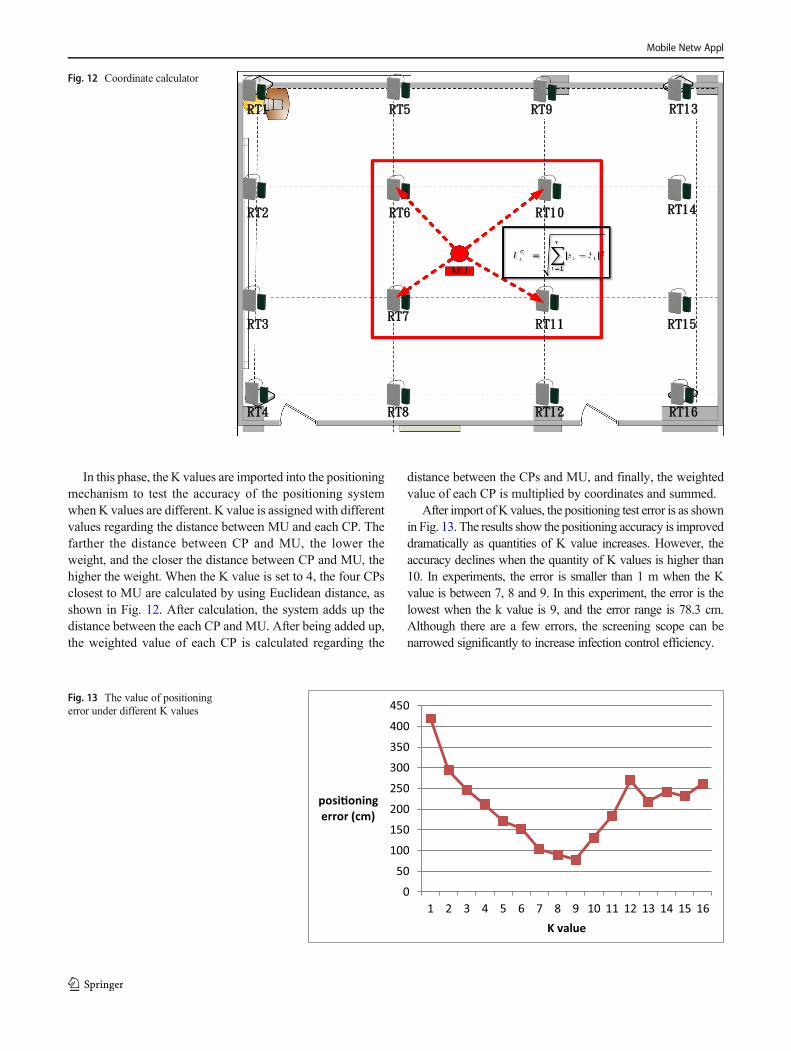
After import of K values, the positioning test error is as shownin Fig. 13. The results show the positioning accuracy is improveddramatically as quantities of K value increases. However, theaccuracy declines when the quantity of K values is higher than10. In experiments, the error is smaller than 1 m when the Kvalue is between 7, 8 and 9. In this experiment, the error is thelowest when the k value is 9, and the error range is 78.3 cm.Although there are a few errors, the screening scope can benarrowed significantly to increase infection control efficiency.
Fig. 12 Coordinate calculator
050
100150200250300350400450
1 2 3 4 5 6 7 8 9 10 11 12 13 14 15 16
posi�oning error (cm)
K value
Fig. 13 The value of positioningerror under different K values
Mobile Netw Appl

5 Discussion
Concerning IoT transmission security, there are many securityprotection measures whose development has reached maturi-ty. The design usually includes four security locks, with secu-rity protection mechanisms established according to theSecurity Development Lifecycle, SDL, including the sensorylayer, the transmission layer, the network layer, and the cloudlayer. In the cloud layer, in order to prevent the susceptibilityof equipment deployed during transmission to attacks, MIThas, through “elliptic curve cryptography”, developed a newchip placed on IoT products, thereby providing security en-cryption to protect transmissions; in the network layer, in or-der to prevent hackers from intercepting data from communi-cation channels, Securolytics Company has proposedmultiple-layer security strategies for IoT firewalls, includingfirewalls, encryption protocols, and authentication [20, 21]; inthe cloud layer, in order to eradicate major data leakage, AWSprovides several security features and services to strengthenprivacy protection and control network access, while TLSencryption is used to transfer data among services [22]; inthe application layer, the IMperva SecureSphere Web can ap-ply the software firewall on the patient management platform,PMP to analyze all the web application traffic and preventcomplex multi-faceted attacks from penetrating security pro-tection and contact with applications and data [23]. The wire-less transmission structure proposed in this study is relativelysimple and structuralized compared to the IoT transmissionstructure. Hence, deployment under the wireless transmissionstructure in accordance with the above concepts should not bea cause for concern.
6 Conclusion
Residents in the aged care living residences have weaker im-munity than young adults, and there are many indoor gather-ing places in aged care living residences. Most infectious dis-eases can spread more rapidly and the survival time of virusesmay be extended in an indoor environment. This study pre-sents an infection control system for the aged care living res-idences, which can collect the Tag signals of the residents inthe aged care living residences by using RFID technology. Itcombines the KNN (K-Nearest Neighbor) algorithm and thelocation fingerprinting method to improve positioning accura-cy and to accurately and timely calculate and store the indoormovement path of residents. This system can track movementtime, location, the path of patients, and the distance betweenthe patient and other residents, and the scope of infection toidentify residents with a high risk of infection and to establishthe database with the records. Using the positioning andscreening functions of the proposed system, medical
personnel can conduct more effective infection control to im-prove care quality of the aged care living residences.
References
1. United Nations (2012) World population prospects, ed. Availableon: https://www.un.org/en/development/desa/publications/world-population-prospectsthe-2012-revision.html. Accessed 12Feb 2019
2. Kaye HS, Harrington C, LaPlante MP (2010) Long-term care: whogets it, who provides it, who pays, and how much? Health Aff(Millwood) 29(1):11–21
3. Wang HH, Tsay SF (2012) Elderly and long-term care trends andpolicy in Taiwan: Challenges and opportunities for health care pro-fessionals. Kaohsiung J Med Sci 28(9):465–469
4. McGilton KS, Bowers BJ, Shannon K (2016) Recommendationsfrom the international consortium on professional nursing practicein long-term care homes. J Am Med Dir Assoc 17(2):99–103
5. Hsu PJ, Chang JH, Lin CY, Lin SH, Lee SD (2006) Overview ofinstitutionalized long-term care. TaiwanGeriatr Gerontol 1(4):198–215
6. Laws & Regulations Database of The Republic of China (2012)Establishment Standards of Senior Citizens’ Welfare Institutions.Available on: http://law.moj.gov.tw/Eng/LawClass/LawContent.aspx?PCODE=D0050039. Accessed 20 Feb 2019
7. Wu SC, Chou SC, ShenWC, Chen LH, Chung PC, Tsai YY (2007)The need for legislation long-term care in Taiwan. J Long-TermCare 11(1):35–50
8. Burton EJ, Mitchell L, Stride CB (2011) Good places for ageing inplace: development of objective built environment measures forinvestigating links with older people's wellbeing. BioMed CentralPublic Health 11(1):839
9. Rajagopalan S, Yoshikawa TT (2000) Tuberculosis in long-term-care facilities. Infect Control Hosp Epidemiol 21(9):611–615
10. Thrupp L, Bradley S, Simor P, Gantz N, Crossley K (2004)Tuberculosis prevention and control in long-term-care facilitiesfor older adults. Infect Control Hosp Epidemiol 25(12):1097–1108
11. Li N, Becerik-Gerber B (2011) Performance-based evaluation ofRFID-based indoor location sensing solutions for the built environ-ment. Adv Eng Inform 25(3):535–546
12. Luo X, O’Brien WJ, Julien CL (2011) Comparative evaluation ofreceived signal-strength index (RSSI) based indoor localization tech-niques for construction jobsites. Adv Eng Inform 25(2):355–363
13. S. Y. Lien, Y. C. Kuo, D. J. Deng, .H. L. Tsai, A. Vinel, and A.Benslimane, "Latency-optimal wave radio access for V2Xsupporting next generation driving use cases" IEEE Access, Vol.7, pp. 6782–6795, 2018. https://doi.org/10.1109/ACCESS.2018.2888868
14. Deng DJ, Lin YP, Yang X, Zhu J, Li YB, Chen KC (2017) IEEE802.11ax: highly efficient WLANs for intelligent information in-frastructure. IEEE Commun Mag 55(12):52–59
15. Deak G, Curran K, Condell J (2012) A Survey of Active andPassive Indoor Localization Systems. Comput Commun 35(16):1939–1954
16. Yu K, Sharp I, Guo YJ (2009) Ground-based wireless positioning.Wiley-IEEE Press, Hoboken
17. Honkavirta V (2008) Location fingerprinting methods in wirelesslocal area networks",Master of Science Thesis, Tampere Universityof Technology. Available on: http://math.tut.fi/posgroup/.Accessed 13 Apr 2019
18. Bahl P, Padmanabhan VN (2000) RADAR: an in-building RF-based user location and tracking system", INFOCOM 2000.
Mobile Netw Appl

Nineteenth Annual Joint Conference of the IEEE Computer andCommunications Societies 2:775–784
19. Altintas B, Serif T (2011) Location-aware patient record access:Patient identification using fingerprinting technique, World ofWireless, 2011 IEEE International Symposium on Mobile andMultimedia Networks, pp. 1–6
20. Murison M (2018) MIT develops low-power high-speed chips forIoT security, internet of business. Available on: https://internetofbusiness.com/mit-energy-efficient-chips-iot-security/.Accessed 20 Feb 2019
21. Securolytics (2018) IoT Firewall. Available on https://securolytics.io/products/iot-security/iot-firewall/. Accessed 13 Apr 2019
22. AWS secure cloud, Available on: https://aws.amazon.com/tw/security/. Accessed 11 Mar 2019
23. Imperva Secure Sphere (2017) Available on: DATASHEET https://www.imperva.com/. Accessed 29 Jan 2019
Publisher’s Note Springer Nature remains neutral with regard to jurisdic-tional claims in published maps and institutional affiliations.
Mobile Netw Appl