a review of two recyclable waste processing plants and
TRANSCRIPT

A REVIEW OF TWO RECYCLABLE WASTE PROCESSING PLANTS AND THEIR SYSTEMS'
TECHNOLOGIES
TENCH C. FORBES AND ROBERT E. FANTASIA Alternative Resources, Inc.
Concord, Massachusetts
ABSTRACf
Recent concerns associated with the landfilling and
incinerating of waste materials have generated a lot of
interest in alternative waste disposal technologies. Sev
eral new technologies have emerged that are fully au
tomated, and attempt to reuse all the waste materials
that are processed without leaving any residue. This
paper will examine the technical and economic per
formance of two such plants that mechanically process
waste for complete reuse, without burning or landfill-•
mg.
INTRODUCfION
As a result of recent concerns associated with the
incineration and landfilling of solid waste materials,
alternative waste processing technologies have emerged
to address these concerns. These recently developed
mechanical waste processing technologies are designed
to recover 100% of the waste constituents for reuse as
raw materials in manufacturing. Two such technolo
gies have been recently employed in two different fa
cilities: the first by ORFA USA in its 388 TPD (352 tpd) facility operating in Philadelphia, and the second
by Rubber Research Elastomerics Tirecyde at a facility
in Babbitt, Minnesota. Both of these facilities utilize
various mechanical processing methods to separate,
103
size, and treat waste to produce raw end-products for
use in various manufacturing industries.
The authors of this paper have reviewed these two
facilities for a developer who is interested in nonburn,
waste disposal technologies. The information presented
in this paper originates from the authors' direct ob
servations of the plants, conversations with the devel
opers of the plants, and from written material
concerning the plants. Complete information concern
ing these plants, however, was not available, so the
authors used their experience from other waste proc
essing systems to complete the review presented in this
paper, and to form final opinions on these plants.
The ORF A facility processes unsorted Municipal
Solid Waste (MSW) and recovers 100% of the waste
into three basic products: fiber for use in the paper,
building and agricultural industry, granulate products
and ferrous materials. The Tirecyde facility processes
automobile and truck tires to recover 100% of the
tires' constituents, turning them into three basic prod
ucts: steel, chord fiber, and rubber for use in the rubber
and plastics industries.
In order to assess the viability of these mechanical
systems, this paper will review two key performance
criteria for each plant the design and operation, and
market availability / acceptance of the end products.
More specifically, we will review the design philosophy,
facility construction, operation and maintenance, and

their associated costs; we will also look at the end product( s) and their markets to determine if the level of mechanization (compared to other waste reduction / recycling technologies) can be profitable.
The developers of these two plants have stated that the added value of the product raw materials created in the two mechanical waste processing technologies will provide revenue that exceeds the production costs; these materials are supposed to be more cost effective than virgin material. Furthermore, these processes look very economically attractive because they are designed to produce two income streams: the stream generated by the tipping fee for accepting the waste, and the revenue stream generated by selling the processed waste as a raw material to an end user.
A thorough review of these two processes is necessary because both of these facilities represent the first attempt to develop a project using these technologies. Although these technologies offer creative solutions for the long-term management of solid waste, their designers have stated that the plants are in the development stages so complete information on all aspects of the plants are unavailable making a judgement of their future prospects difficult. Adding to the uncertainty is the fact that little independent information exists on either of these plants. So, this review of the technical and market conditions surrounding these facilities should provide the reader with a better understanding of how these facilities operate, and how they might succeed as waste disposal options in the opinion of the authors.
ORFA OF AMERICA PHILADELPHIA, PENNSYLVANIA FACILITY
The ORF A facility employs a Swiss technology that is designed to process approximately 388 tons per day (TPD) (352 tpd) of nonseparated, Municipal Solid Waste (MSW) that is, collected bagged or loose at the curbside, and turned into treated waste fiber and granular end products. All the incoming waste is screened for unacceptable material once it has been unloaded at the plant receiving area (tipping floor-see below for details).
Other than this prescreening, the plant is fully mechanized. The process involves no burning, and is designed to leave no residue because all the material separated from the MSW is meant to be sold to an end user. The end-markets range from shoe-box manufacturers to mushroom growers and the wood products building industry.-
Construction started on the ORFA plant at Phila-
104
delphia in the Fall 1986. It started-up in the summer of 1988. From the summer of 1988, to the summer of 1989 the plant was undergoing shakedown testing and additional modifications. Figure 1 depicts the layout of the Philadelphia facility.
Facility Description
The following discussion illustrates the facility as it was in June of 1989. Figure 1 depicts the basic flow diagram of the ORFA process. The ORFA process can be broken-down into four basic operations: Receiving and screening; size reduction and ferrous separation; product treatment including drying, stabilization and sterilization; and end-product preparation. There are two 100% capacity size reduction and ferrous separation lines each capable of 388 TPD (352 tpd) based on 16 TPH (14.7 tph) 16 hr/day; there are two 50% drying, stabilizing and sterilization lines each capable of 194 TPD (176 tph) based on 8 TPH (7.35 tph) 16 hr/day. The end-products are divided into four different streams: fine, medium, and coarse fiber; granulate products, and ferrous material.
Receiving and Screening
MSW, carried by packer trucks, arrives at the facility tipping area and is dumped on the tipping floor for inspection. Personnel on the tipping floor, and in frontend loaders spread the received load out on the floor with the purpose of removing any obviously hazardous, unprocessible and oversized waste. These items amount to only 1 % or 2% of the incoming waste stream because the plant's major waste source (0 'Hara) provides primarily residential waste. The processible waste is then carried by front-end loaders to the shredder infeed conveyors.
Size Reduction and Ferrous Separation
The waste moves on the in-feed conveyor to the lowspeed, hydraulic shredder for bag-opening and sizereduction to roughly 5 in. (127 mm), and then to the first drum magnetic separator. The shredded waste then moves by belt conveyor to the second hydraulic shredder for further size reduction to roughly IX in. (31.75 mm). A second drum magnetic separator removes additional ferrous at the secondary shredder discharge conveyor. The combined, recovered ferrous streams move by belt conveyor to roll-off containers which are removed from the plant. After going through the initial shredding and separation stage, the remaining waste moves by conveyor to a temporary storage

- o
VI
FIR
ST
LOW
-SPE
EJ) �
SHREDD
ER
-.
FERROU
S MEr
AL
I B
IN
i �
Bag
hous
e(s)
I. 2.
�
1=
Lig
ht
Fra
ctio
n
,--1+
- ,1/4
" (6.4
nun)
�
""
.. i
FIR
ST
I.J
MA
GNETI
C r"'1
SEP
AR
AT
OR
R
EMO
VED
BY
SCR
AP
DEAlER
.. HAM
MER MIlL
... + 1/
4"
� II
•
1 i
.1 Bl0
-(FIN
AL)
FlL:IER
SECON
D
I ..J
I LOW-S
PEEll r"
""1 SHRED
DER
SEC
ON
D
1.1
14
I I
"
... �
MA
GNETI
C r
ISEPA
RA
TOR
H
eav
y F
ract
ion
+ IW
(6.4
nun)
aJITING
MILL
,
BUF
FER BO
X A
ll
Mat
eria
l
DRYER
I B \lFFER I
r L
ight
r BO
X.
F
ract
ion
Co
mbi
ned
1
FIRST
I
Over
and
Under
SCREENING
IW
(u.
MA
CIll
NE
HEA
VY
FRA
CTIO
N
-1/4"
(6.4
MM)
'Tl/
1
�/
RU
fATIN
G
DR
YER
DR
UM
•
�
Bag
hous
e
Cy
clo
ne
OZONE
MlXlN
G
DR
UM
�
•
OZONE
L.I.==---:MU� NICIP
AL
I BULKY
I T
IPPIN
G FLO
OR
UIASJE
.
1.) T
he f
inal
cla
ssif
icat
ion
syst
em
cont
ains
a s
erie
s o
f cy
clo
nes
and
mec
han
ieal
scr
eens
ser
vic
ed b
y a
co
mbi
nati
on
of
belt
and
pne
um
atic
co
nvey
ors
.
2.)
No
te:
Th
e O
rCa
proc
ess
is c
om
ple
tely
pr
op
riet
ary
, so
onl
y b
asic
sch
emat
ics
are
avai
labl
e.
Th
eref
ore
, the
cy
clo
nes
and
b
agho
uses
sho
wn
in t
his
dra
win
g r
epre
sent
the
aut
hors
' un
ders
tand
ing
of
the m
ater
ial
flo
w.
The
exac
t nu
mb
er o
f ba
gho
uses
and
cy
clo
nes
are
not p
ubli
c in
formati
on.
GAS
HEA
TER
�TOR
SOL
ID
WASf
fi
Key
Bel
t C
onv
eyo
r
Pne
umat
ic
Co
nvey
or
FIG.
1
ORFA
™ P
ROCE
SS F
LOW
DIA
GRAM
•
MED
lUM
J CO
URSE
A
BER
I B
ALER
FINAL
C
LA
SSlF
l· �
CA
TIO
N
ANE
F
IBER
( I)
I
SILO
IGRANULA
� SIL
O

bin (buffer box) that controls material flow to the rest of the separation stage of the system.
From the buffer box the shredded material travels by belt conveyor to the three-way screen, that is a combination mechanical screen-table and vacuum separator, which divides the material into three fractions: two heavy fractions (ceramics, glass, non-ferrous metals, and dense plastics) containing dense material larger than one-quarter inch (6.35 mm) and dense material smaller than one-quarter inch (6.35 mm), and a light fraction of mixed size containing primarily paper, textiles and light plastics. The small, heavy fractions discharge from the screening machine through the holes in the mechanical screen to one belt conveyor, and the large heavy fractions travel over the mechanical screen to another conveyor. The larger, heavy fraction travels by belt conveyor to a hammer mill for size reduction and then travels back to the buffer box, and the smaller heavy fraction travels directly to a second buffer box called the dryer buffer box located upstream of the product preparation stage (see below). The large and small material from the light fraction is separated from the heavy fraction mentioned above by the vacuum in the screening machine. This light material then moves by pneumatic conveyor to cyclone separators mounted above cutting mills; the larger light material drops from the cyclone into the cutting mills which grind the material prior to entering the same, dryer buffer box. The small, light material moves from the cyclone separator by pneumatic and belt conveyor to the same buffer box. The output from the size reduction stage is the combination of the uniformly sized [less than one-quarter inch (6.35 mm)] heavy and light material into the dryer buffer box upstream of the product drying, stabilization and sterilization stage.
Product Drying, Stabilization and Sterilization
This area consists of a standard, gas-fired multiplepass rotary drum dryer and an ozonator. A variable speed screw conveyor feeds the dryer which is heated by a separate natural gas combustion unit. From the dryer, an induced draft fan draws the shredded waste into a cyclone that separates fugitive dust from the rest of the material. The fugitive dust goes through one of the baghouses, then out through the Bio-filter, and the rest of the material travels into the ozonator by belt conveyor. The ozonator, a rotary device similar in configuration to the dryer, is an ORF A proprietary design meant to mix small amounts of ozone, created by a separate, high voltage ozone generator, designed to destroy all fatty acids, butolic acids, and pathogens in the material stream.
106
Material then travels by conveyor to the final product separation area where a series of screens and air classifiers separate the material stream into the three product sizes; that is-coarse and medium fiber; fine fiber; and granulate material (glass, grit, stone, fine metal). From the product preparation area, the granular product travels by conveyor to silos for bulk storage and loading. The ORF A fiber coarse and medium streams travel to a baler which bales the fiber for storage and shipment. The fine fiber travels to a silo for bulk storage and shipment.
Product
The final end products' material breakdown is the following; it should be noted that the process takes only ordinary, unsorted MSW-no oversized, special or industrial waste:
For each pound (2.2 kg) of MSW processed, the following percentage ranges of product are produced:
Coarse, Medium and Fine Fiber = 50-60% Granulate Material = 18%
Ferrous = 8-9% Evaporated moisture = 13-24%
Process Environmental Issues
The major environmental issues stated by ORF A and observed by the authors is fugitive dust created in the process through the action of shredding, screening, and separating waste. This dust is created in several areas : the conveyor transition points, the cyclone separators, air classifiers, and pneumatic conveyors. To control this dust, most of the material transition points at the shredder outlets, and belt conveyor transfer points are covered by dust collection vents. These vents are ducted to several baghouses located throughout the plant. Also, the outlets of the numerous pneumatic conveyors, air classifiers and cyclones located throughout the process feed into these baghouses. Heavier material in the dust laden air flowing into the baghouses is collected on bags and drops into the baghouse hoppers, which are connected by rotary seal valves to conveyors that carry the material into the product preparation buffer boxes; this process is designed to insure that only the small dust particles from the airflow are ejected from the baghouse outlet. The baghouse outlet connects to a Biological Filter, filled with tree bark that is attached to the outside wall of the facility process building. The filter is designed to remove odors and volatile organic compounds from the

air flow. All available information and observations conclude that the filter works as designed.
Other sources of air emissions are dust and volatile organic compounds driven off the material in the dryers and ozonators. The airflow from the dryer / ozonators outlets also travels to the Bio-Filter. No other waste products or residue are produced by the process so neither waste storage nor residue pickups are required.
It should be noted that in the spring of 1989, a fire occurred at the outlet of the ozonator causing enough damage to shut down the plant for several weeks. At the time we visited the plant several months after the fire, all machinery was running with no visible damage. ORF A said that they added fire protection (unspecified) to the ozonator -eutlet to prevent future fires.
The other environmental concern is noise levels inside the plant. The highly mechanized nature of the process, including the numerous pneumatic conveyors and 185 motors makes noise control a major concern; as of late June, the noise levels had not been controlled to the satisfaction of ORFA personnel, and required more sound reduction work.
Plant Layout
Nonproprietary plant layouts were unavailable at the time of writing. A plant visit and discussions with ORFA personnel, however, revealed that the Philadelphia facilities' dimensions are 408 ft (123.6 m) by 164 ft (49.6 m), with the process area being 195 ft (59 m) by 164 ft (49.6 m); the tipping floor is 164 ft (49.6 m) by 155 ft (46.9 m) and the product storage area is 164 ft (49.6 m) by 50 ft (15 m); the first floor footprint takes up 60,000 fe (5580 m2). The building is about 50 ft ( 15 m) high. Given the design throughput of 388 TPD (352 tpd) and the highly mechanical nature of the process the processing area appeared, in the opinion of the authors, to be too small to contain the equipment necessary for this technology. The undersized nature of the building was highlighted by the fact that the facility needed two levels of process equipment; the upper level containing the light material fraction, cyclone/ cutting mill assemblies (connected by pneumatic conveyor to the primary screen), several other air classification equipment, and pneumatic conveyors. The lower half of the facility contained the rest of the processing equipment. This crowding of equipment required that all the material travel through conveyors that force the material to make many 90 deg. turns as it traveled through the process. The shredding and screening equipment was also close together preventing any clear access for maintenance. This situation was highlighted by the fact that maintenance and
107
retrofit activities were being performed at the time of our visit, through holes cut in the roof.
Control System
The ORF A facility was designed to be a totally automated plant requiring a minimal number of personnel. The material handling system, and product treatment (dryer and ozonator) controls were all designed to be monitored and operated by a computerized, Distributive Control System (DCS). The control system highlights are discussed below :
(a) Speed switches for all belt conveyors with automatic shutdown sequences of upstream conveyors if a conveyor stops.
(b) Level switches for the buffer boxes that shut down the upstream material flow if the box levels become too high.
(c) Material-flow through the dryer, controlled by a in-feed screw conveyor, is controlled by the moisture content of the material in the drum.
Operation
The following discussion illustrates the way the plant was running in June of 1989, and also discusses changes in operation that ORFA was planning at that time.
Personnel During the early summer of 1989, the Philadelphia
facility operated with a total of 60 people, including management and administration. At this staffing level, the plant operated with two shifts per day, twelve operators and quality control inspectors per shift, five days per week. Standing-by were two shifts, also with 12 operators and QC people that were used as fill-ins, relief shifts, and also as the operating crews for a third shift that ORFA was planning on adding during the early summary of 1989.
Throughput The ORF A facility throughput was originally de
signed at 388 TPD (352 tpd) running 16 hr/day 5 days a week. This schedule would be accommodated with three operating shifts so that the third shift could perform maintenance and/or complete a day's production run if the first two shifts did not process the entire 388 tons (352 t). Through June of 1989, however, ORFA reported that the Philadelphia facility operated with an average throughput of about 100 TPD (90.7 tpd), 5 days per week. The main reason for this reduced throughput as described by ORFA personnel was undersized equipment including: hole sizes in the primary screens that restricted throughput

to 13 TPH (11.8 tph); rotary seal valves that were too large or too small; and jamming in the final product separation screens and air-classifiers. Also, the equipment layout mentioned above that required the material to make many 90· turns caused frequent jams at the conveyor transition points. This layout also impeded operator access to quickly unjam the equipment.
Fuel and Electricity Usage Maximum, installed natural gas usage by the process
dryers was designed to be 25,000 ft3/hr (700 m 3/h) although the actual gas usage varies based on material moisture content; the procedure of varying the material flow (as described above) in the dryer is the main moisture control for the process. Other natural gas uses included cooling and heating systems with total connected usage of around 6000 fe /hr (168m3/h).
The connected load for the plant process motors is 2.4 MW. These were the designed loads so the actual loads became higher because more equipment was added after the plant began operating. ORF A personnel reported that electrical usage was relatively high because equipment such as the rotary seal valves and conveyors were either undersized or oversized.
FINANCIAL INFORMATION
The following discussion details the original capital cost of the facility, the 0 & M expenditures as of June, 1989, and estimates of capital improvements to be made in the last quarter of 1989.
Costs
Capital Costs and Sources of Financingl ORF A raised $30,000,000 from a bond issue spon
sored by the Philadelphia Redevelopment Authority to provide long term debt to cover development, financing and construction of the facility in Philadelphia. The bond issue stipulates, however, that the proceeds of the bonds be held in escrow until ORFA successfully remarkets the bonds by November 1989; if they do not remarket the bonds by that time, the proceeds will go back to the bondholders. Furthermore, ORF A was unable to provide the actual cost of the facility by the summer of 1989 because they stated that they were continuing to upgrade the process to achieve a consistent design throughput efficiently.
I Detailed Financial Information from ORFA's Form lO-k to the Securities and Exchange Commission, Washington, D.C. 20549.
108
The Philadelphia facility is reported on ORF A's balance sheet as an asset originally worth roughly $18,000,000. The original price is estimated by the authors to be higher than $18 million. Since Research Cottrell financed the plant construction, however, the actual cost is unavailable. The information referenced above states that ORFA paid $6,750,000 for ResearchCottrell's interest in the plant, and $1,518,000 for other project costs during construction.
Capital Improvements and Costs From the time ORFA acquired the facility, through
December 1988 they spent $2,778,000 for capital improvements to the plant.
ORF A reports that it will continue to make capital improvements including more baghouses for improved dust control, more noise attenuation, and more equipment changes to increase the plant's efficiency and long-term throughput.
O&M Costs
ORFA reported that it spent $1,614,000 on plant "operations" during the second half of 1988. Most of the costs involved unspecified labor and materials needed for starting up the plant.
ORFA reported that operating personnel requirements were in-line with expectations and original estimates. It was not clear, however, what the effect on personnel costs would be once the plant achieved design throughput on a regular basis, and start-up activities subsided. The authors assume that ORF A's long term goal is to make many capital improvements during this start-up period so that the operating and maintenance costs will be lower. This assumption can be confirmed only in the future.
ORF A reported during the summer of 1989 that the Philadelphia facility's electrical costs were fixed at approximately $lO.00/ton; this cost per ton was not expected to change even as the facility throughput increased.
PRODUcr MARKET AND SALES
The following section describes the markets for ORFA products, the sales activities to date, and planned marketing activities as described by ORF A. ORF A products were originally designed to sell primarily in the secondary fiber paper market. The Philadelphia plant was equipped to bale the coarse/ medium fiber for shipment to secondary fiber plants because they prefer their raw material in this form;

the fine fiber is stored and shipped in bulk. As of June 1989, ORFA had tested their products with several secondary fiber mills that make box board; ORFA had also conducted tests at Michigan State University to prove the usefulness of ORFA fiber as a raw material for the secondary fiber market. ORFA reported that these tests had successfully passed standard paper industry quality tests. No long-term buyers, however, had yet contracted for any fiber because ORF A reported that the secondary fiber markets were in a slump.
Discussions with ORFA personnel, and our own observations have led us to the conclusion that the size of the coarse fiber output from the plant, during the first half of 1989, was too small, and contained too many granular contaminates for use in secondary fiber mills. To address these problems, ORFA has reconfigured the first screening machine, and the final product classification screens. These actions, however, have forced ORF A to downgrade its plant's through put.
Because of the above discussed problems with the secondary fibers market, ORFA had expanded its marketing efforts beyond the secondary fiber industry. These other markets include:
Agricultural Markets
The most promising application in this market is the use of coarse and medium fiber as filler material for mushroom beds. ORF A and other reliable sources have reported that a long term contract with a major mushroom grower is close.
Other Agricultural uses include a medium for spreading pesticides over fields; the medium consists of pelletized ORF A fiber soaked in pesticide. ORF A reports satisfactory tests with this application.
Consumer Markets
ORFA reports that its Swiss licensor's pilot plant (1 TPH or 0.907 t/h) has had success making and marketing kitty litter out of pelletized ORFA fiber. ORFA had not, however, produced this product in its Philadelphia plant.
ORFA has sold some quantities of ORFA fiber for use in making particleboard building products; ORF A reports that the Japanese have expressed interest in this application.
Other Markets
ORFA received permission from the Pennsylvania Department of Environmental Resources to test
109
ORFA granular products as a daily cover for landfill faces. In conjunction with this application, ORFA has performed Extraction Procedure Toxicity tests on ORF A fiber to insure that any land application would not cause any contamination. ORF A reports that the tests have shown no problems.
Sales Level
By December 31, 1988 ORFA had not sold any ORFA fiber since the Philadelphia facility was still in a start-up mode. From the end of December through the early summer of 1989, ORFA reported selling small quantities of fiber products to some of the markets listed above. Ferrous and granular products were either given away or disposed at cost during various periods in the first half of the year. Also, ORFA reported that they were stockpiling product so they could continue developing markets while performing additional, capital improvements on the Philadelphia facility. As mentioned above, ORFA is close to a long term sales agreement with a mushroom grower.
ORF A expects to continue developing markets for their product as they continue to improve on the performance of the Philadelphia facility.
CONCLUSIONS
The conclusions from the site visit, and review of the design, construction and operation of the ORF A facility are as follows:
(a) While the developers of the Philadelphia facility have made significant progress in developing the ORF A process, they have yet to prove that the facility can achieve its original throughput goal of 388 TPD (352 tpd) or even the reduced goal of 300 TPD (272 tpd).
(b) The developers of ORFA have not yet found long-term, viable markets for 100% of the fiber or granulate end-products. The developers are, however, having some success in selling the medium and coarse fiber output from the plant to local markets that will make long term commitments for the product. Therefore, the markets for ORF A products should expand, in our opinion, as ORF A gains more experience with its process, and installs new and improved waste processing equipment to handle these expanded markets.
(c) As of August, 1989, ORFA reports that the capital costs, and operating and maintenance costs for the ORFA facility in Philadelphia are too high to be adequately covered by the revenue from the end prod-

uct sales. Therefore, in our opinion, there is a question as to whether the resultant tip fees for Philadelphia waste needed to cover the high costs can be competitive with other waste processing technologies. Future ORFA plants must strive for lower capital and operating costs and higher product revenues in order to have tipping fees competitive with other processes.
(d) Our past review of other recycling methods indicates that Future ORF A facilities might have significant competition from source separation and other, less mechanized recycling processes that are rapidly being developed.
RUBBER RESEARCH ELASTOMERIC TIRECYCLE PLANT; BABBIIT, MINNESOTA
Tirecycle is a proprietary technology that was developed by Rubber Research Elastomerics (RRE) in Minneapolis. The facility accepts passenger tires and small truck tires for processing into products designed for use as raw material in the rubber and plastics industries. The process shreds and grinds the tires down to their component parts: rubber, fiber, and steel. The ground tire components are further treated and sold. Since an attempt is made to sell all the material, no residue is produced.
A full sized plant using this process is located in .
Babbitt Minnesota, about 200 mi (333.4 km) north of Minneapolis. Although the process is unique, much of the equipment used in the process is standard for the rubber industry. The plant was completed and started operation in April, 1987; in its original configuration, the plant was designed to recover 5 million lb (2.3 million kg) of product per year, expandable to 60 million lb (27.3 million kg) of product per year.
As of August, 1989 RRE vacated the Babbitt facility primarily because of a dispute with their major lender over the operation and capital requirements needed to raise the facility throughput to a profitable level. Our view of the situation is that the process, product, and markets remained viable despite the dispute between the two parties; the fact that the owner was, during August 1989, trying to solicit another vendor to operate the plant indicates that the process is considered viable by the owner.
FACILITY DESCRIPTION
This section briefly describes the Babbitt facility as it was in November, 1988; very little was changed from November until the time the plant was shut down. We
110
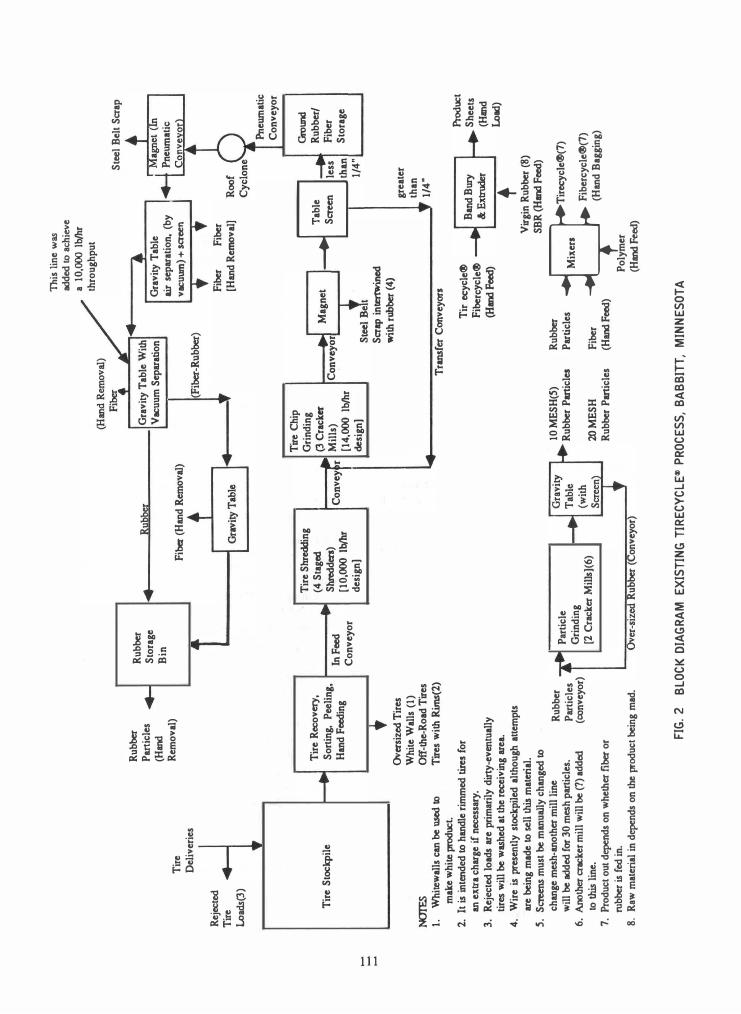
have prepared a block diagram that shows the process when we visited the plant (see Fig. 2).
The Tirecycle process is most easily understood when divided into seven steps: tire storage and receiving; tire sorting and feeding; tire shredding and grinding; ground tire separation into rubber, tire-fiber and steel belting material; secondary rubber grinding to produce finer rubber; rubber and polymer mixing; and product and virgin material mixing and extruding to create a Tirecycle sheet product.
Storage and Receiving
Upon receipt, tires are stored in a pile outside the plant. The tires are visually inspected, and tires filled with dirt that have been dug up from landfills are rejected at the time of delivery. Tires are manually loaded from the stock pile to trailers. The trailers are taken to the unloading dock at the receiving floor, and the tires manually unloaded.
Tire Sorting and Feeding
On the receiving floor, the tires are hand sorted in the following categories: passenger tires, truck tires, tires with their rims still in place, and whitewalls. Presently, the whitewalls are de-whitewalled, and rimmed tires are not processed, although plans exist to process these tires in the future. The processible tires are then fed manually onto the shredder in-feed conveyor.
Tire Shredding and Grinding
The tires are carried by a series of conveyors through four shredders and three crackermills (grinders) to produce one-quarter inch (6.4 mm) ground tire material. The shredders used in the process are hydraulic, low speed shear shredders; the crackermills are standard rubber industry grinders that have two, wide counter-rotating wheels between which the rubber chips are ground. The ground tire material (rubber, fiber, and steel mixed together) is carried by a pneumatic conveyor to the separation process.
Ground Tire Separation
In this step, the ground tire materials are carried by conveyor past a series of magnets, screen tables and vacuum/ gravity separation tables that separate steel belting material and tire fiber from the rubber chips. The remaining pure rubber chips are stored in cardboard bins. The fiber (free of rubber and steel) and
- -
Tir
e D
eliv
erie
s
Rub
ber
Part
icle
s (H
and
Rem
ov
al)
Rub
ber
Sto
rage
B
in
•
Rubber
I Gra
vit
y T
able
With
V
acuu
m S
epar
atio
n
(Fibe
r-R
ubbe
r)
This
lin
e w
as
added
to a
chiev
e a
10
,000 l
b/h
r th
rou
ghp
ut
Gra
vit
y T
able
air
sep
arat
ion,
(b
y v
acuum
) +
screen
Stee
l B
elt
Scr
ap
Rej
ected
T
ire
Loads
(3)
Fi�
(H
and
Rem
OVal�
..
.. --
--
--11
t"'_
�: ... "1'.'-
'.
1 F
iber
Fibe
r [H
and
Remo
val
]
Tir
e S
tockp
ile
Tir
e R
eco
very
,
,
So
rtin
g,
P�l
ing'l In
Feed
H
and
Feed
ing
Co
nv
eyo
r
NOI'ES
1.
White
wal
ls c
an be
used to
Over
sized
Tir
es
Whi
te W
alls
(1)
Of
f-the-
Ro
ad T
ires
T
ires
with
Rims(2)
m
ake
whi
te prod
uct.
2. It
is in
tende
d to
han
dle
rim
med
tires fo
r an
ex
tra
char
ge if
nec
essa
ry.
3.
Rej
ected
lo
ads
are
prim
aril
y dirt
y-ev
entu
ally
ti
res w
ill
be w
ashe
d at
the
rec
eiv
ing
area
. 4
. W
ire
is pr
esen
tly
stoc
kpil
ed a
ltho
ugh
atte
mpt
s ar
e be
ing
mad
e to
sell
this m
ateri
al.
S.
Scre
ens mus
t be
man
ually
chan
ged to
chan
ge m
esh-
ano
ther
mil
l li
ne
wil
l be
add
ed for
30
mes
h p
arti
cles
. R
ubb
er
Par
ticl
e G
rin
ding
Tir
e S
hred
ding
(4 S
taged
S
hredders
) [1
0,00
0 lblhr
d
esig
n]
6.
Another
crac
ker
mil
l w
ill be
(1)
add
ed
to this
line
.
Par
ticl
es
(conv
eyo
r)
[2 C
racker
MiII
s](6
)
7.
Pro
duct
out
depe
nds
on w
heth
er fi
ber o
r ru
bbe
r is
fed in
. 8.
Raw
mat
erial
in
depend
s on
the
prod
uct
bein
g m
ad.
over-siZed Ru
bbe
r (C
onv
eyo
r)
Tir
e C
hip
Gri
ndi
ng
I-_
..... ��
(3 C
rack
er
Mil
ls)
Co
nv
eyo
r [1
4,00
0 lb
/hr
desi
gn]
-EJab
le
Scre
en le
ss
L-_
_ -
--I'
than
Pneum
atic
C
on
vey
or
Ground
R
ubb
er/
Fib
er
Sto
rage
• 1/4
"L' _
__
...
Scr
ap i
ntertwined
with
rub
ber ( 4
) gr
eate
r th
an
1/4
" T
ransfer
Con
vey
ors
10M
ES
H(S
) R
ubbe
r P
artic
les
20 M
ES
H
Rub
ber
Part
icle
s
--
--
---.
Produc
t T
irec
ycle
� �
Band B
ury
L... Sh
eets
F
iberc
ycle
�
& E
xtruder
I ..
..- (H
and
(lIn
Feed)
+ Lo
ad)
Vir
gin
Rub
ber
(8)
SB
R (lI
n Feed
)
Rub
� ?
Tir
ecY
c1e�
(7)
Par
ucl
es
Mix
ers
Fib
ercy
cle�
(7)
Fibe
r (H
and
Bag
ging
) (H
andfe
ed)
Po
lym
er
(Hand
feed)
FIG.
2
BLOC
K DI
AGRA
M E
XIST
ING
TIRE
CYCL
E® P
ROCE
SS, B
ABBI
n, M
INNE
SOTA

steel belting material (intertwined with rubber) are stored in various cardboard bins located throughout the facility. After the separation process, the steel belting material is moved by handcart for storage and final disposal or sale.
Secondary Rubber Grinding
Separated rubber chips are manually moved with hand carts in the cardboard storage bins to the secondary rubber crackermills in series followed by a separation table. The separation table has manually changeable screens that remove several different sizes of ground rubber from the rubber stream. Oversized rubber particles from the separation table are returned by conveyor to the crackermills for further size reduction.
Rubber and Fiber Mixing to Produce Tirecycle
Final product is produced in this step of the process. The ground and separated rubber particles are fed manually into proprietary treaters; these treaters are vats with motorized paddle mixers that mix the particles with a polymeric chemical, also fed by hand. As mentioned above, the polymer activates the chemical bonds in the ground rubber so it can mix chemically with virgin materials. After this treatment, the rubberpolymer combination becomes Tirecycle. The finished Tirecycle product is either hand-bagged for sale as pellets, or stored for further processing (see SheetProduct Production, below).
The i.ire-fiber that was separated is also used to produce a product. When the proprietary treaters are not mixing Tirecycle, they are used to mix tire-fiber and polymer (both hand-fed into the treaters) to create Fibercycle. The Fibercycle is then either hand-bagged for sale or stored for further processing.
Sheet-Product Production
The Tirecycle and Fibercycle that is not directly sold is further processed to produce Tirecycle or Fibercycle sheet. To produce Tirecycle sheet, Tirecycle and a virgin material, either natural rubber or synthetic rubber, is pressed together in a bandbury mixer, a rubber industry standard device for mixing rubber and polymeric materials together, and then passed by conveyor into an extrusion device which forms sheet material. The sheet material is then hand-trimmed and stacked for shipment. Tirecycle and the virgin material are hand-fed into the bandbury mixer. Fibercycle sheet is produced the same way in the same devices except
112
that Fibercycle is mixed with the virgin material rather than Tirecycle. This sheet production step is the final processing step at the facility. This sheet product can be pressed directly into new products by rubber product manufacturers without any further processing.
PRODUcr DESCRIPTION
The product material breakdown by weight produced by the plant was the same as that for a tire: approximately 15% fiber, 60% to 65% rubber, and 10% to 15% steel. From this raw material breakdown, the finished product mix that the Babbitt facility generally produced was approximately 20% Tirecycle and Fibercycle product as particles, and 80% Tirecycle and Fibercycle as sheet product. Very little steel scrap product was sold, and it was stored onsite and given away to the state as ballast in road building.
The particle and sheet product that was produced in Babbitt appeared clean and uniform. RRE sampled and tested the finished products before shipment to customers; RRE reported that an insignificant amount of products from Babbitt had been rejected (see below for product information).
Plant Layout
The entire process described above at the Babbitt facility is contained in a one room building whose dimensions are 275 ft (83.4 m) by 120 ft (36.4 m), and 25 ft (7.6 m) high. The conveyor layouts produce a material flow with a minimum of 90 deg. turns. The shredding, grinding and treatment equipment have a lot of space between them for maintenance and operator access. The only noticeable shortage of space is the tire receiving area where tires are received from a trailer that has moved the tires from a stock pile outside. Within this space that measures 60 ft (18 m) by 20 ft (6.1 m) tires are manually unloaded, sorted and fed into the shredders. This space appeared unable to handle the quantity of tires required by the plant's design throughput of 60 million lb (27.3 million kg) per year or 240,000 lb/day (109,090 kg/d).
Environmental Issues
There are not many environmental issues associated with this process. The grinding of rubber does not create a large amount of dust, although dust was a concern at the primary separation table located in the primary shredding line. A small bag house was added

at this point, so fugitive dust was no longer a problem.
No other emission controls are necessary.
No residue is created at the facility by the polymeric
preparation or the particle and polymer mixing because
the preparation occurs off site and the mixing is done
on a batch basis with no leftover material. Noise is not
a problem because the plant does not use many large
horsepower motors, and the processing of rubber is a
quiet process. All the final product that is not shipped
out is meant to be stored on site. Since the tires are
planned to be stored in the trailers in which they were
delivered, leachate from tire piles is not an environ
mental concern.
Control Systems
The control systems in the Tirecycle plant contain
normal sequential start and stop features through re
laying that start the lines in sequence, and shut them
down in sequence if a conveyor fails. Half the process,
however, is manual including the product mixing and
preparation.
Operation
The following discussion illustrates the way the plant
operated between November 1988 and July 1989.
Personnel
The Tirecycle plant operated with. 15 people per
shift. When production started, the plant operated with
one shift; as throughputs increased (see below), second
and third shifts were added. The second and third
shifts, however, worked mostly on maintenance and
clean-up. Consequently, most of the product produc
tion occurred during the first shift.
Other personnel at the plant included four super
visory personnel and six quality control personnel
bringing the total force to 40 people.
THROUGHPUT
As mentioned in the introduction, the Babbitt plant
was designed to produce 60 million lb (27.3 million
kg) of Tirecycle product per year. The plant, however,
did not begin commercial operation in a configuration
that could handle the design throughput. The plant
could not obtain design throughput because most of
the automated material handling equipment was not
installed. Its "start-up" rating was 5 million lb (2.3 million kg) per year of product. The reason that the
113
plant could be designated as a 60 million lb (27.3 million kg) per year facility was that the shredders
and their associated feed conveyors had the design
capacity to handle this complete throughput, once the
additional automated equipment was installed. In the
authors opinion, the conveyors and shredders were not
large enough to handle the design throughput on a
sustained basis. RRE did report, however, that they
ran short performance tests on the primary shredding
line at the design throughput. As mentioned above,
full design throughput was never achieved by the plant
for a sustained period of time. The plant, as built, was able to produce the amount
of product that RRE had planned for the early phases
of the plant. Throughput rose gradually from approx
imately 1.8 million lb (818,818 kg) during the first
year (March 1987 to March 1988) of operation to 5.2 million lb (2.4 million kg) during the second year
ending March 1989. Monthly product throughput
ranged from a low of 75,000 lb (34,090 kg) to a high
of over 550,000 lb (250,000 kg). Considering that a
tire on average weighs 20 lb (9.1 kg), these monthly
throughputs translate to 3750 tires and 27,500 tires
respectively. When the authors visited the plant, the
equipment appeared to be handling these reduced
throughputs efficiently.
Energy Usage
Electricity is the only type of energy used, other
than that for space heating, in the Tirecycle process.
The facility is served by a 480 V, 4000 A service.
Although the exact plant usage is not available, the
installed horse power is approximately 2560 hp (1910 kW) from 26 motors ranging in size from less than 1 hp to 350 hp (261 kW); this installed horsepower is
approximately 1600 kW. The device that used the larg
est amount of power was the first tire shredder.
FINANCIAL AND PRODUcr INFORMATION2
Capital Costs and Sources of Financing
RRE reported that the original cost of the Babbitt
facility was $2.3 million; the capital costs were financed
by several state and local development agencies in
northern Minnesota. St. Louis County, in which Bab
bitt is located, owns the plant and equipment. RRE
leased the facility from the county.
2 Portions of this detailed financial information corne from RRE's Prospectus for a stock offering dated August 13, 1987.

Capital Improvements and Costs2
During late 1987, the city of Babbitt and St. Louis County made available more capital to assist RRE in further developing the Babbitt facility. Other funds were raised through several public stock offerings that provided funds to pay off loans from the state and county agencies, fund research and development, and provide working capital for RRE to run the facility. The initial stock offering occurred in November with a second offering occurring in late 1987; the proceeds were expected by the prospectus to be between $2.7 and $4.3 million. By late 1988, approximately $600,000 of the public and private money were used towards throughput improvements to the Babbitt facility.
Proceeds from these capital improvement funds were used to tune the process by installing an additional gravity (separation) table in the primary shredding line to more efficiently separate rubber from fiber. RRE planned additional improvements to enable the entire plant to reach the design throughput of 60 million lb (27.3 million kg) per year. These improvements included transfer conveyors to automatically move the separated rubber from the primary shredding line to the secondary shredding line, pneumatic conveyors to transfer rubber and fiber to the polymeric treaters, and material handling equipment for the final product separation.
These improvements were never made because RRE was unable to raise the needed funds to accomplish the work. RRE reported that they were could not obtain additional funds from the State of Minnesota and St. Louis County. Despite the lack of funds, it is the authors' opinion that the facility could not be commercially profitable without the equipment to efficiently increase throughput, and therefore meet the market requirements.
Operation and Maintenance Costs
Specific information is not available concerning O&M costs other than estimated payroll that included approximately 40 people (see personnel section for details on the staffing requirements) with an average hourly rate of $7.75 for operators to $ 15.00 for supervision. These labor costs average out to $1 million per year. Electricity costs were not available, but assuming a peak usage of 1.2 MW averaged over three shifts per day, 5 days/week 45 weeks/year (allowing 7 weeks per year for maintenance) at 5 cents/kWh yields electrical costs of $3 18,240 per year. Since this estimate assumes 100% designed electrical demand,
1 14
the actual demand and therefore cost is probably half that amount.
Other unknown costs were the price of the polymer used to activate the rubber and fiber particles, and the virgin rubber used to make the rubber sheet product. We assume that these material costs were significant, and could have accounted for most of the deficit that the plant accumulated while in operation.
Product Market and Sales
Market Description RRE sold Tirecycle products primarily to the man
ufacturers of rubber products. These products include buckets, carpet underlay mats, railroad crossing material, roofing products, flooring, and truck mats. Tire manufacturers, however, did not use the product, although RRE reported that they had tested Tirecycle for use as tread material with good results. By November 1988, the number of customers who had bought some quantity of Tirecycle product included 70 different users.
In November 1988, the market for Tirecycle products demanded mainly sheet product; therefore, the product split produced in the facility was 80% sheet product and 20% particle product. This product split was the opposite expected by RRE. Since producing the sheet product was more labor intensive than particle production (see process description), RRE reported that this 80% /20% product split caused the production costs to rise significantly.
Sales Levels Sales levels paralleled the throughput in that reve
nues started out at a low level, and continued to grow erratically until the plant closed down. Monthly sales levels ranged from a low of $16,824 for 75,000 lb (34,09 1 kg) of product to a high of $126,000 for 400,000 lb (18 1,8 18 kg) sold. These sales figures represented all four types of Tirecycle products (as mentioned above, mostly sheet product) being sold in small quantities to RRE's dozens of different customers. By the time the plant closed down, the sales efforts were showing. RRE indicated that they had 1 .2 million lb (545,454 kg) worth of orders for Tirecycle products.
CONCLUSIONS
The conclusions from the site visit, and review of the design, construction and operation of the Tirecycle facility are the following:
(a) The Babbitt facility has proven that the Tirecycle process works by effectively separating the three

constituents of small truck and car tires, and produce
raw materials and products useful to the manufacturers
of rubber products.
(b) There are many processes that can use both the
Tirecycle and Fibercycle end products; the number of
customers reinforces this point. Markets for the re
covered steel should also be plentiful in most areas of
the country since the steel is a pure material.
(c) In the authors' opinion, a Tirecycle facility
should be able to compete economically with other tire
recycling technologies because the Tirecycle facility
effectively created a new, value-added product from
tires.
(d) A Tirecycle facility should be much less costly
to construct, operate, and maintain than a compara
tively sized tire incinerating facility, and much easier
115
to site with respect to public acceptance and environ
mental impacts since no burning is involved, and no
residues are created.
(e) Although tires have caused many problems for
the solid waste disposal industry, the ability to deliver
a waste tire supply with consistent tire sizes and types
is still a problem facing all tire recycling operations.
This inability to obtain a tire supply with consistent
quality means that tip fees are not stable. Tirecycle,
therefore, has an advantage over other recycling tech
nologies because the Tirecycle end-product has a
higher value that offsets the instability in tip fees.
Key Words: Hammermill; Materials Recovery; Rubber; Screening; Separation; Shredding; Size