a review of models
TRANSCRIPT

INSTITUTE OF PHYSICS PUBLISHING NETWORK: COMPUTATION IN NEURAL SYSTEMS
Network: Comput. Neural Syst. 12 (2001) R1–R47 www.iop.org/Journals/ne PII: S0954-898X(01)20615-0
TOPICAL REVIEW
Competition in the development of nerve connections:a review of models
Arjen van Ooyen
Netherlands Institute for Brain Research, Meibergdreef 33, 1105 AZ Amsterdam,The Netherlands
E-mail: [email protected]
Received 5 January 2001
AbstractThe establishment and refinement of neural circuits involve both the formationof new connections and the elimination of already existing connections.Elimination of connections occurs, for example, in the development ofmononeural innervation of muscle fibres and in the formation of oculardominance columns in the visual cortex. The process that leads to theelimination of connections is often referred to as axonal or synaptic competition.Although the notion of competition is commonly used, the process is not wellunderstood—with respect to, for example, the type of competition, what axonsand synapses are competing for, and the role of electrical activity. This articlereviews the types of competition that have been distinguished and the modelsof competition that have been proposed. Models of both the neuromuscularsystem and the visual system are described. For each of these models, theassumptions on which it is based, its mathematical structure, and the extent towhich it is supported by the experimental data are evaluated. Special attentionis given to the different modelling approaches and the role of electrical activityin competition.
Contents
1. Introduction R22. Biological background R5
2.1. Neuromuscular system R52.1.1. Adult neuromuscular system. R52.1.2. Development of mononeuronal innervation. R62.1.3. Reinnervation experiments. R62.1.4. Indications for competition. R62.1.5. What mediates the competition in the development of mononeuronal
innervation? R7Consumptive competition: neurotrophic factors. R7Interference competition: competition for space. R7Interference competition: direct negative interactions. R7
0954-898X/01/010001+47$30.00 © 2001 IOP Publishing Ltd Printed in the UK R1

R2 A van Ooyen
2.1.6. Role of electrical activity. R82.2. Visual system R8
2.2.1. Adult visual system. R82.2.2. Development of ocular dominance columns. R92.2.3. Competition. R102.2.4. Role of electrical activity. R10
2.3. Other parts of the nervous system R113. Review of models R11
3.1. Constant total synaptic strength R123.1.1. Stollberg (1995). R13
3.2. Modified Hebbian learning rules R143.3. Consumptive competition: competition for target-derived resource R14
3.3.1. Constant amount of resource. R153.3.1A. Gouze et al (1983). R153.3.1B. Dual constraint model. R16Description of the model. R16Results of the model. R17Further analyses and extensions of the model. R183.3.1C. Harris et al (1997). R20
3.3.2. Variable amount of resource. R223.3.2A. Elliott et al (1996a). R223.3.2B. Elliott and Shadbolt (1998a). R23Description of the model. R23Results of the model. R243.3.2C. Jeanpretre et al (1996). R243.3.2D. Van Ooyen and Willshaw (1999b). R25Description of the model. R27Results of the model. R28Further analyses and extensions of the model. R30
3.4. Interference competition: competition for space R323.4.1. Van Essen et al (1990). R323.4.2. Induced-fit model. R32
3.5. Interference competition: direct negative interactions R343.5.1. Willshaw (1981). R343.5.2. Liu et al (1994a). R353.5.3. Nguyen and Lichtman (1996). R363.5.4. Barber and Lichtman (1999). R36
4. Discussion R39Acknowledgments R40References R40
1. Introduction
During development and in adulthood, the establishment and refinement of neural circuitsinvolve both the formation of new connections and the elimination of already existingconnections (e.g. Wolff and Missler (1992), Bailey and Kandel (1993), Donoghue (1995),Lohof et al (1996), Strata and Rossi (1998), Moser (1999)). A well-studied case of this formof plasticity is the withdrawal of connections that takes place during development. Neurons—and other cell types—often are initially innervated by more axons than ultimately maintain

Competition in the development of nerve connections: a review of models R3
into adulthood (Purves and Lichtman 1980, Lohof et al 1996). This initial hyperinnervationfollowed by elimination is a widespread phenomenon in the developing nervous system andoccurs, for example, in the development of connections between motor neurons and musclefibres (e.g. Brown et al (1976), Jansen and Fladby (1990)) and in the formation of oculardominance columns in the visual cortex (e.g. Hubel et al (1977), Wiesel (1982)). The processthat reduces the amount of innervation onto a postsynaptic cell is often referred to as axonalor synaptic competition. However, neither term describes the process adequately (Colmanand Lichtman 1992, Snider and Lichtman 1996). Since a single axon can branch to innervate,and compete on, many postsynaptic cells simultaneously, competition is better described asoccurring between axon branches rather than between axons. By further arborization, thecontact between an axon branch and a postsynaptic cell can comprise a number of synapses,so that competition occurs not between single synapses but between groups of synapses.Notwithstanding, because of their widespread use in the literature, I will continue to use theterms axonal and synaptic competition.
Competition can be defined in various ways. One of themost general definitions was givenby Van Essen et al (1990). In discussing the neuromuscular system, they defined competitionas a process in which there are multiple participants whose behaviour is governed by certainrules such that one or more of the participants emerge as victors. This definition leaves openby what processes the victors arise. Based on whether or not there are interactions betweenthe participants, Colman and Lichtman (1992) distinguished two ways by which victors cancome about, leading to two types of competition.
In independent competition, the victors do not arise as a result of interactions between theparticipants. An example of this formof competition is a contest. In a contest, where the victorsare chosen by judges based on a comparison of the performance of the participants, there areno interactions between the participants. One participant does not influence the performanceof the other participants during the process of competition. In axonal competition, this wouldmean that the axons innervating the same postsynaptic cell do not affect each other and thatthe postsynaptic cell (e.g. the muscle fibre) would act as judge and decide, on the basis ofsome performance criteria, which axon(s) would win. Since axons do affect each other (seesection 2), this form of competition is unlikely. Competition as in a contest is reminiscent ofcompetitive learning, or winner-take-all learning, which was introduced by Kohonen (1982).In neural network models based on competitive learning, changes in synaptic strength areperformed only for synapses impinging onto the target cell that is responding most stronglyto a stimulus, and for synapses onto neighbours of the ‘winning’ cell. The term competitiverefers to the (hypothetical) process by which the most responding target cell is chosen amongthose responding less strongly (see also Swindale (1996)).
In interdependent competition, victors emerge as a result of interactions—direct orindirect—between the participants (as in a boxing match, for example). In this case, theactions of one participant do affect the performance of the other participants during the processof competition. Interdependent competition is the type of competition that is considered inpopulation biology. In population biology, where one studies the dynamics of populationsof organisms, two species of organisms are said to compete if they exert negative effects onthe growth of each other’s population. A disadvantage of applying this definition to axonalcompetition is that it does not include independent competition, which is, at least in principle,a viable option, which should not be discarded just on the basis of terminology (see Ribchester(1992), and reply by Colman and Lichtman (1992)). Compared to the definition by Van Essenet al (1990), an advantage of the population biology definition is that nothing is said about theoutcome of competition—all participants may emerge as ‘victors’ as a result of competition,i.e. negative interactions between the participants. In population biology, negative interactions

R4 A van Ooyen
between species can come about in different ways (Yodzis 1989), leading to different types ofcompetition:
• In consumptive competition, in systems of consumers and resources (e.g. predators andpreys, respectively), each individual consumer tries to avoid the others and hindersthe others solely by consuming resources that they might otherwise have consumed;in other words, consumers hinder each other because they share the same resources.In neurobiology, competition is commonly associated with this dependence on sharedresources (Purves and Lichtman 1985, Purves 1988, 1994, Guillery 1988). In particular,it is believed that axons compete for neurotrophic factors, which are survival- or growth-promoting substances released by the postsynaptic cells upon which the axons innervate.During an earlier stage of development, when initial synaptic contacts are made, theseneurotrophic factors have a well-established role in the regulation of neuronal survival(e.g. Farinas et al (1994), Primi and Clarke (1996), Oppenheim (1996), Ma et al (1998)).But many studies now indicate that neurotrophic factors may also be involved in the laterstages of development, when there is further growth and elimination of innervation (seesections 2.1.5 and 2.2.3; for a critical review, see Snider and Lichtman (1996)). Forexample, neurotrophic factors have been shown to regulate the degree of arborization ofaxons (e.g. Cohen-Cory and Fraser (1995); for more references, see section 3.3.2D). Animportant class of neurotrophic factors are the neurotrophins, with NGF (nerve growthfactor) as its best-characterized member (Bothwell 1995, Lewin and Barde 1996).
• In interference competition, instead of hindrance through dependence on shared resources,there is direct interference between individuals. This occurs, for example, if there aredirect negative interactions—e.g. aggressive or toxic interactions—between individuals.In axonal competition, nerve terminals could seek to destroy each other by releasingproteases (see sections 2.1.5 and 3.5).Interference competition also occurs if some essential resource can be obtained onlyby occupying, more or less exclusively, some portion of space (competition for space).Competition for space is primarily interference competition because each individualconsumer is seeking to monopolize a portion of space, rather than to share resources(Yodzis 1989). In competition for space, the essential resource may be space itself, asin nest sites for hole nesting birds; or it may be another resource, such as, in the case ofplants, light, which can only be obtained by occupying a certain amount of space aboveground. In axonal competition, the essential resource may also be space itself or, forexample, some essential extracellular matrix component (see section 3.4).
Although the notion of competition is commonly used in neurobiology, the process isnot well understood—with respect to, for example, the type of competition, what axons andsynapses are competing for, and the role of electrical activity—and only a few formal modelsexist. In population biology, in contrast, the concept of competition is well developed andhas been studied by means of many formal models (e.g. MacArthur (1970), May (1974),Kaplan and Yorke (1977), Yodzis (1989), Keddy (1989), Van der Meer and Ens (1997), Grover(1997)). The concept of competition in population biology provides a useful framework forthinking about competition in neurobiology (Van Essen et al 1990, Ribchester and Barry 1994,Van Ooyen and Willshaw 2000), and in this paper I classify the different models accordingto the forms of competition that are distinguished in population biology (see also Ribchesterand Barry (1994)). Since the innervation of mammalian skeletal muscle by its motor nerve(reviewed in Jansen and Fladby (1990), Sanes and Lichtman (1999), Ribchester (2001)) isthe most accessible system for studying the development of nerve connections, most modelsof competition describe the neuromuscular system. But a number of competition models

Competition in the development of nerve connections: a review of models R5
Synapticbouton
(b)
Muscle fibre
Endplate
Axon
Motor neuron
(a)
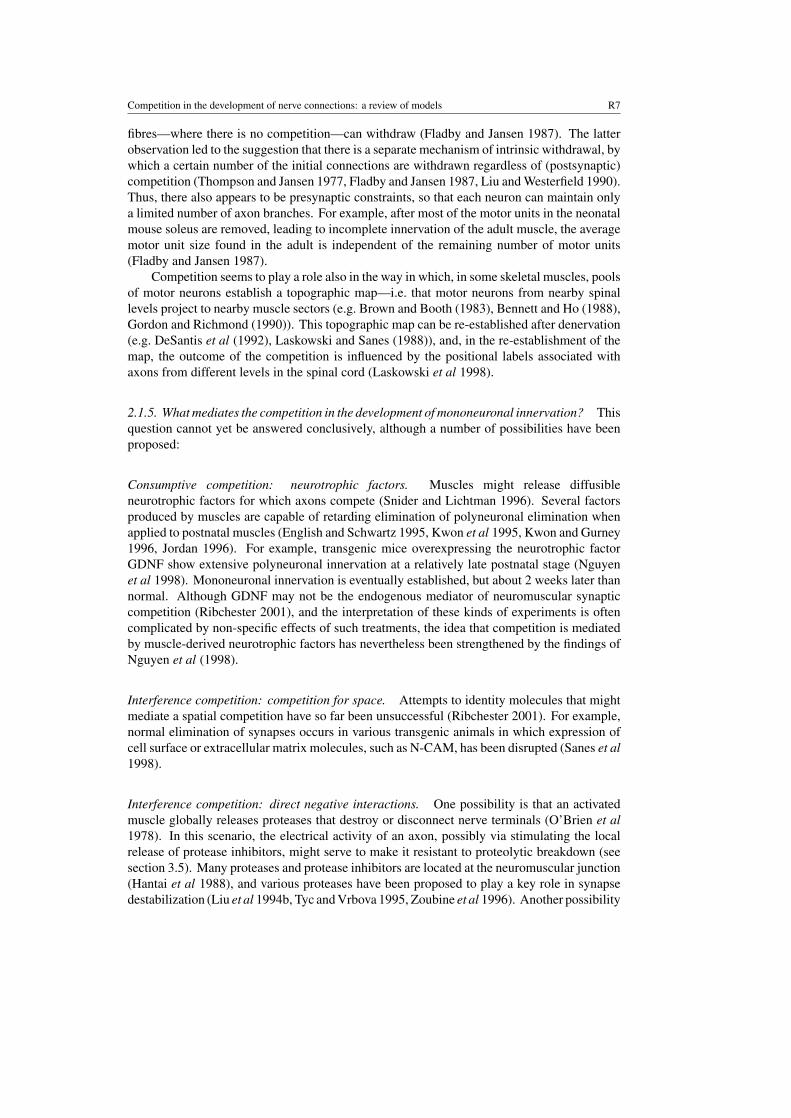
Figure 1. The development of connections between motor neurons and muscle fibres. (a) Atbirth, each muscle fibre is innervated by axons from several different motor neurons (polyneuronalinnervation). (b) In adulthood, each muscle fibre is innervated by the axon from a single motorneuron (mononeuronal innervation). Note that the number of synaptic boutons of the remainingaxon on each endplate has increased. Drawn after Purves (1994).
also exist for the visual system, and they are reviewed here as well, since their mathematicalstructure is in many ways similar to that of the models proposed for the neuromuscular system.
Before presenting the models, I briefly review the development of the neuromuscular andvisual system, focusing on competition and the role of electrical activity.
2. Biological background
2.1. Neuromuscular system
2.1.1. Adult neuromuscular system. Skeletal muscles are made up of many individual cells,called muscle fibres. Muscle fibres are innervated by motor neurons. At the endplate—adiscrete region near the midpoint of the muscle fibre—each muscle fibre is innervated by theaxon from a single motor neuron (mononeuronal or single innervation) (figure 1(b)). Whilsteach muscle fibre is innervated by a single motor neuron, a single motor neuron, throughits axonal branches, typically contacts many muscle fibres. The number of fibres contactedby a given motor neuron is called the motor unit size. Motor neurons with successivelyhigher firing thresholds—which are therefore less frequently activated—have successivelylarger motor units (size principle) (Henneman 1957, 1985).
Mononeuronal innervation enables optimal control of muscle force. Muscle contractionsof increasing strength are generated by activating increasing numbers of motor neurons. To beable to do this—andwithout havingwasted axon terminals (skeletal neuromuscular connectionsare so powerful thatmultiple innervation of the same fibrewould be redundant)—it is necessarythat a muscle fibre is innervated by only one motor neuron (e.g. Lichtman et al (1999)).
Mononeuronal innervation does not occur in all types of vertebrate muscle fibres. Twitch

R6 A van Ooyen
fibres—the type that skeletal muscles are made of—are mononeuronally innervated. But tonicfibres are not. These are muscle fibres that, in contrast to twitch fibres, contract slowly and donot generate action potentials in response to nerve stimulation. They havemultiple endplates aswell as multiple axons at individual endplates (Lichtman et al 1985, Porter and Baker 1996). Insome species, e.g. amphibians, even the endplates of twitchfibres are polyneuronally innervated(Trussell and Grinnell 1985, Werle and Herrera 1991, Grinnell 1995).
2.1.2. Development of mononeuronal innervation. During prenatal development, the axonsof themotor neurons grow towards their target muscle, and near themuscle each axon arborizesto innervate a large number of muscle fibres. At birth, the endplate of each muscle fibre iscontacted by axons from several differentmotor neurons (polyneuronal ormultiple innervation)(figure 1(a)). During the subsequent few weeks, axons withdraw some of their branchesuntil each muscle fibre is innervated by the axon from a single motor neuron (mononeuronalinnervation) (figure 1(b)).
At the endplate, the terminal of an axon branch consists of multiple synapses, or synapticboutons. During the elimination of polyneuronal innervation, the number and size of thesynaptic boutons of the winning axon increase, while the synaptic boutons of the losing axonare gradually retracted; when no boutons remain, the axon branch withdraws. The changefrom poly- to mononeuronal innervation is often called synapse elimination, but this term isunfortunate in the sense that there is contemporaneous addition and loss of synaptic boutons,and the synaptic area on the endplate actually increases during the elimination of polyneuronalinnervation (Purves 1994, Sanes and Lichtman 1999). Input elimination would thereforedescribe the phenomenon more accurately (Sanes and Lichtman 1999).
During elimination of polyneuronal innervation, motor unit sizes, as well as the range ofmotor unit sizes, decrease, but there is no change in the number of motor axons innervating themuscle as a whole, i.e. there is no motor neuron death (Brown et al 1976, Balice-Gordon andThompson 1988). Somemotor neurons do die during development, but the period of cell deathprecedes the period of elimination of polyneuronal innervation (Oppenheim 1989, 1991).
2.1.3. Reinnervation experiments. In neonates and adults, muscles can be partiallydenervated by injuring some of the axons in the motor nerve. Reinnervation of the muscle bysprouting of intact axons and regeneration of damaged axonsmay then result in polyneuronallyinnervated muscle fibres (McArdle 1975, Brown et al 1981, Taxt 1983, Barry and Ribchester1995). The subsequent elimination of polyneuronal innervation resembles that seen duringnormal postnatal development (McArdle 1975, Brown et al 1976, Betz et al 1979). Partialdenervation experiments are used to investigate the mechanisms involved in the elimination ofpolyneuronal innervation.
2.1.4. Indications for competition. The elimination of polyneuronal innervation appears tobe a competitive process. Following removal of some motor axons at birth, the average size ofthe remaining motor units after elimination of polyneuronal innervation is larger than normal(Thompson and Jansen 1977, Fladby and Jansen 1987). Thus, individual motor axons appearto innervate more fibres as the result of the absence of other axons.
Competition for the endplate alone (postsynaptic competition) cannot account for allfindings. If there was only postsynaptic competition, the withdrawal of axon branches ateach endplate would occur independently of the withdrawal at other endplates. Postsynapticcompetition alone therefore cannot explain why larger motor units reduce in size more thansmaller ones (so reducing the range of motor unit sizes) and why branches at singly innervated
Competition in the development of nerve connections: a review of models R7
fibres—where there is no competition—can withdraw (Fladby and Jansen 1987). The latterobservation led to the suggestion that there is a separate mechanism of intrinsic withdrawal, bywhich a certain number of the initial connections are withdrawn regardless of (postsynaptic)competition (Thompson and Jansen 1977, Fladby and Jansen 1987, Liu andWesterfield 1990).Thus, there also appears to be presynaptic constraints, so that each neuron can maintain onlya limited number of axon branches. For example, after most of the motor units in the neonatalmouse soleus are removed, leading to incomplete innervation of the adult muscle, the averagemotor unit size found in the adult is independent of the remaining number of motor units(Fladby and Jansen 1987).
Competition seems to play a role also in the way in which, in some skeletal muscles, poolsof motor neurons establish a topographic map—i.e. that motor neurons from nearby spinallevels project to nearby muscle sectors (e.g. Brown and Booth (1983), Bennett and Ho (1988),Gordon and Richmond (1990)). This topographic map can be re-established after denervation(e.g. DeSantis et al (1992), Laskowski and Sanes (1988)), and, in the re-establishment of themap, the outcome of the competition is influenced by the positional labels associated withaxons from different levels in the spinal cord (Laskowski et al 1998).
2.1.5. Whatmediates the competition in the development of mononeuronal innervation? Thisquestion cannot yet be answered conclusively, although a number of possibilities have beenproposed:
Consumptive competition: neurotrophic factors. Muscles might release diffusibleneurotrophic factors for which axons compete (Snider and Lichtman 1996). Several factorsproduced by muscles are capable of retarding elimination of polyneuronal elimination whenapplied to postnatal muscles (English and Schwartz 1995, Kwon et al 1995, Kwon and Gurney1996, Jordan 1996). For example, transgenic mice overexpressing the neurotrophic factorGDNF show extensive polyneuronal innervation at a relatively late postnatal stage (Nguyenet al 1998). Mononeuronal innervation is eventually established, but about 2 weeks later thannormal. Although GDNF may not be the endogenous mediator of neuromuscular synapticcompetition (Ribchester 2001), and the interpretation of these kinds of experiments is oftencomplicated by non-specific effects of such treatments, the idea that competition is mediatedby muscle-derived neurotrophic factors has nevertheless been strengthened by the findings ofNguyen et al (1998).
Interference competition: competition for space. Attempts to identity molecules that mightmediate a spatial competition have so far been unsuccessful (Ribchester 2001). For example,normal elimination of synapses occurs in various transgenic animals in which expression ofcell surface or extracellular matrix molecules, such as N-CAM, has been disrupted (Sanes et al1998).
Interference competition: direct negative interactions. One possibility is that an activatedmuscle globally releases proteases that destroy or disconnect nerve terminals (O’Brien et al1978). In this scenario, the electrical activity of an axon, possibly via stimulating the localrelease of protease inhibitors, might serve to make it resistant to proteolytic breakdown (seesection 3.5). Many proteases and protease inhibitors are located at the neuromuscular junction(Hantai et al 1988), and various proteases have been proposed to play a key role in synapsedestabilization (Liu et al 1994b, Tyc andVrbova 1995, Zoubine et al 1996). Another possibility

R8 A van Ooyen
is that axon-derived, or axon-stimulated local release of, protease mediates direct negativeinteractions between axons (Sanes and Lichtman 1999) (see section 3.5).
2.1.6. Role of electrical activity. Regarding the role of activity in synapse elimination—which occurs at a time when muscles are becoming active—at least two questions can beasked (Ribchester 2001).
(1) Does the overall level of activity affect the rate of synapse elimination?(2) Do differences in the activity of innervating axons confer competitive advantages on the
more active axons?
Concerning question (1), blocking activity (by interfering with input activity, synaptictransmission, ormuscle activity) delays or prevents synapse elimination (Thompson et al 1979,Brown et al 1982, Callaway and Van Essen 1989, Blondet et al 1989, Barry and Ribchester1995, Ribchester and Taxt 1984), while stimulating activity accelerates synapse elimination(O’Brien et al 1978, Thompson 1983, Zhu and Vrbova 1992, Vyskocil and Vrbova 1993),although there are some nuances to these findings (see Ribchester (2001)).
Concerning question (2) the findings are less clear-cut. Selectively stimulating motorneurons in neonates, Ridge andBetz (1984) found that themore active axons have a competitiveadvantage over the less active ones, whereas Callaway et al (1987) (see also Callaway et al(1989)) using selective blocking found the opposite. Experiments in tissue culture, too, showopposing results (Magchielse and Meeter 1986, Nelson et al 1993). The view that activesynapses have a competitive advantage is also supported by Balice-Gordon and Lichtman(1993, 1994). Based on observations that synapse elimination begins with elimination ofAChRs (the postsynaptic receptors for acetylcholine, the neurotransmitter in motor neurons)and that, in adults, partial—but not complete—paralysis of the endplate leads to the eliminationof the terminals overlying the silent patches, they suggest that electrically active synapses are thestimulus for removing theAChRsunderlying the less active synapses, which are then eliminated(see sections 3.5.3 and 3.5.4). However, in regeneration experiments, Ribchester (1988, 1993)showed that inactive terminals are capable of competitively displacing other—active andinactive—terminals. Recently, Costanzo et al (2000) also found that, during regeneration,activity is not necessary for competitive synapse elimination. Making the regenerating nerve,the intact nerve, and the muscle endplate completely silent, they demonstrated that silentsynapses from the regenerating nerve can displace other silent synapses from the intact nerve.Electrical activity also seems not to be sufficient for synapse elimination. Barry and Ribchester(1995) found that following recovery from chronic nerve conduction block, many reinnervatedmuscle fibres in partially denervated muscles retain polyneuronal innervation, in spite of theresumption of normal neuromuscular activity.
In conclusion, activity is influential but does not seem to be decisive (Costanzo et al 2000,Ribchester 2001). To reconcile the different findings concerning activity, one possibility isthat activity is just one of the many influences in competition, while the actual competition isgoverned by other factors, e.g. neurotrophic factors and their receptors (Costanzo et al (2000);see also section 3.3.2D).
2.2. Visual system
2.2.1. Adult visual system. Retinal axons from the two eyes project to the lateral geniculatenucleus (LGN) of the thalamus. The LGN is composed of two or more layers, each of whichreceives axons from either the left or the right eye. In turn, the axons from the LGN project tolayer IV of the visual cortex. Like the different layers in the LGN, cells in layer IV respond

Competition in the development of nerve connections: a review of models R9
Cortex
(a) (b)
(c)
LGN
Stripe
Column
R L
R L
R
L
R L
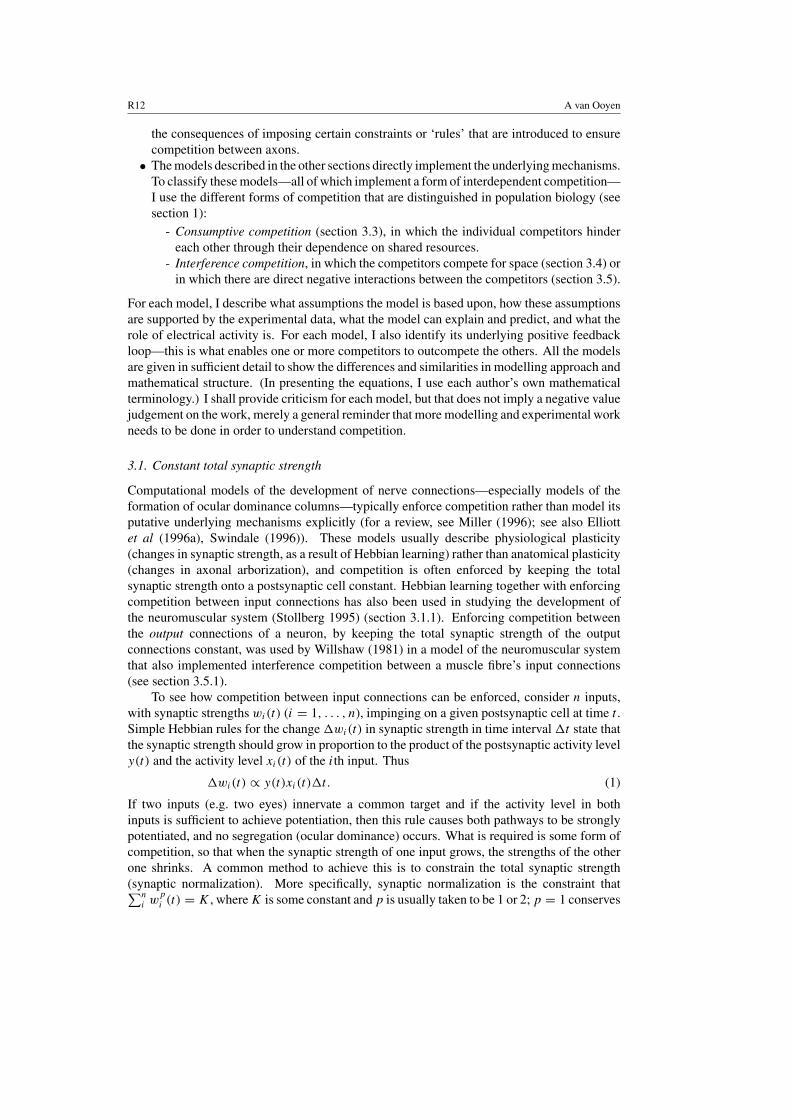
Figure 2. The development of ocular dominance columns. (a) The adult visual system. The LGNof the thalamus is composed of two or more layers, each of which receives axons from either theleft or the right eye. The axons from the LGN project to layer IV of the visual cortex. Like thedifferent layers in the LGN, cells in layer IV respond preferentially to input from either the left orthe right eye (ocular dominance). (b) In the immature system, the arbors of the geniculate axonsoverlap extensively within layer IV. (c) During further development, remodelling of axonal arborstakes place so that each cortical cell receives axons from either left-eye or right-eye geniculateneurons. Note that the number of branches (and thus synapses) of the remaining axon on eachcortical cell has increased. Drawn after Gilbert (1992) and Lichtman et al (1999).
preferentially to input from either the left or the right eye; in other words, they show oculardominance (figure 2(a)). Unlike the mononeuronal innervation of muscle fibres, a singlecortical cell is typically innervated by a number of LGN cells (of the same ocular dominance)(e.g. Tanaka (1985), Gilbert (1992)). Within layer IV and perpendicular to the cortical surface,cells with the same ocular dominance are stacked on top of each other, forming so-called oculardominance columns. Parallel to the cortical surface, columns of the same ocular dominanceare grouped together and form a pattern of alternating stripes. For a more detailed descriptionof the visual system and its development, the reader is referred to Reid (1999), Lichtman et al(1999), and Swindale (1996), and references therein.
The functional significance of ocular dominance columns is not clear. In addition toocular dominance stripes, positions in the retina are projected in a topographical manner tothe cortex (Roskies et al 1995), and ocular dominance stripes might be a ‘side effect’ of that:experimental results (Fawcett andWillshaw1982) andmodelling results (e.g.VonderMalsburgand Willshaw (1976), Goodhill (1993)) show that mechanisms that ensure correspondingtopographic mappings from the two retinas onto a single sheet of cells usually also produceocular dominance stripes (see also Swindale (1996)).
2.2.2. Development of ocular dominance columns. The formation of eye-specific layers inthe LGN and ocular dominance columns in the cortex requires anatomical remodelling ofaxonal arbors during development (figures 2(b), (c)). Initially, the retinal axons from the twoeyes overlap extensively within the LGN, before gradually segregating to form eye-specificlayers. Similarly, the arbors of geniculate axons are initially evenly distributed within layer IV,

R10 A van Ooyen
before becoming restricted to eye-specific columns. Just as in the elimination of polyneuronalinnervation in the neuromuscular system, the refinement of connections to the LGN and cortexinvolves both the retraction of axonal side branches that project to the wrong region and theelaboration of branches that project to the correct region, and the total number of synapsesonto a postsynaptic cell actually increases during the period in which elimination takes place.
2.2.3. Competition. The formation of eye-specific layers and columns appears to be acompetitive process. For example, when kittens are reared with one eye closed (monoculardeprivation), the ocular dominance stripes associated with the closed eye become smallerthan those associated with the open eye (see further section 2.2.4). As in the neuromuscularsystem, the formation of eye-specific regions might involve competition between axons oraxon branches for target-derived neurotrophic factors. Continuous infusion of the neurotrophinNT-4/5 or the neurotrophin BDNF in the cat visual cortex prevents the formation of oculardominance columns (Cabelli et al 1995), presumably because the geniculate axon branches failto retract. As expected when axons compete for neurotrophic factor, removal of neurotrophicfactor by application of neurotrophic factor antagonists prevents the formation of oculardominance column by eliminating inputs from both eyes (Cabelli et al 1997). In monoculardeprivation experiments in cat, excess neurotrophic factor mitigates the relative increase of theocular dominance stripes associatedwith the open eye (Carmignoto et al 1993, Hata et al 1996),presumably by overwhelming the competitive disadvantage of the closed eye. Infusion of theneurotrophin NGF abolishes the effects of monocular deprivation in the rat LGN (Domeniciet al 1993) and visual cortex (Yan et al 1996).
2.2.4. Role of electrical activity. The segregationprocess into eye-specific layers and columnsis influenced by the neural activity impinging on the LGN and cortex. Neural activity arisesnot only from visual stimulation through photoreceptor activation but also from spontaneouslyoccurring activity (i.e. not visually driven activity) in retinal ganglion cells; and treatmentsthat block all activity have different effects compared to those that block only visually drivenactivity. When all activity in both eyes of kittens is blocked by injection of tetrodotoxin(TTX, which blocks the generation of action potentials), ocular dominance columns do notform at all (Stryker and Harris 1986). But when only the visually driven activity is blocked,as in macaque monkeys reared in complete darkness, a normal pattern of ocular dominancecolumns is found (LeVay et al 1980). In fact, in monkeys at least, ocular dominance columnsare present prior to birth and eye opening (Horton and Hocking 1996). Taken together, theseobservations suggest that spontaneously occurring activity in the immature retina may instructthe early segregation of axonal arbors into ocular dominance columns. Immature retinalganglion cells generate waves of activity that propagate across the retina (Wong et al 1993).Since waves are generated independently in each retina, activities from the two eyes—andtherefore also the neural activities to the LGN and cortex—are likely to be asynchronous,which could provide a signal for segregation. Inconsistent with a critical role for spontaneousactivity are the findings by Crowley and Katz (1999), who showed that total removal of retinalinfluence (by eye removal) in ferrets early in visual development does not prevent the normaldevelopment of ocular dominance columns. To reconcile these finding with those by Strykerand Harris (1986), one possibility is that blockade of all activity by TTX results in increasednon-specific neurite outgrowth (see also Kater et al (1988), Van Ooyen et al (1995), Van Ossand Van Ooyen (1997)), which may mask already established columns rather than disrupttheir formation (Crowley and Katz 1999). Recently, Crowley and Katz (2000) showed that,in ferret, ocular dominance columns appear much earlier during development—already less

Competition in the development of nerve connections: a review of models R11
than 7 days after geniculocortical innervation of layer IV—than previously thought, and thatthese early columns were unaffected by experimentally induced imbalances in retinal activity. They proposed that axon guidance cues are sufficient to initially establish columns, and thatneuronal activity is subsequently required for their maintenance and plasticity.
Although activity might not be necessary for the initial formation of ocular dominancecolumns, it does certainly play a role in their plasticity. When vision through one eye isprevented by suturing the eyelids shut after birth, the stripes or patches formed by the suturedeye’s input become dramatically smaller than those formed by the open eye’s input (e.g. inkittens: Wiesel and Hubel (1963), Shatz and Stryker (1978)), indicating that segregation is acompetitive process and that the open eye has a competitive advantage. However, when thepostsynaptic cortical cells are silenced, the closed eye has a competitive advantage (Reiterand Stryker 1988). In addition to affecting ocular dominance, activity—e.g. spontaneouslyoccurring retinal waves—may play a role in the synapse elimination that occurs in sharpeningup the initial, coarse topographic maps, which are formed by gradient-dependent mechanismsduring early development (see e.g. Roskies et al (1995), Goodhill and Richards (1999)). Foran extensive review on the development of topography and ocular dominance columns, as wellas on the various formal models that have been proposed, see Swindale (1996).
In conclusion, just as the role of activity in the development of the neuromuscular system,activity is influential in the development of the visual system but might not be decisive.
2.3. Other parts of the nervous system
An initial excess and subsequent decrease in the number of connections that an individualtarget cell receives occurs in many parts of the nervous system, not just in the neuromuscularand visual system (Purves and Lichtman 1980). In neonatal rat cerebellum, for example,individual Purkinje cells are initially innervated by several climbing fibres, which, duringsubsequent development, compete with each other until only a single one remains (Crepel1982). In the ciliary ganglion of newborn rabbits, all neurons—irrespective of their number ofdendrites—are initially innervated by approximately the same number of axons. But duringsubsequent axon elimination, neurons that lack dendrites lose all but one of their innervatingaxons. In contrast, neurons with many dendrites remain innervated by the largest numberof axons (Hume and Purves 1981, Purves and Hume 1981, Purves 1994). Submandibularganglion cells in the rat are initially innervated by five or more axons, but this number reducesto one or two over the first month after birth (Lichtman 1977). Changes in the number ofconnections also occur in the olfactory bulb, hippocampus, and spinal cord (Purves 1994,Lohof et al 1996).
3. Review of models
Models in which competition plays an important role have been proposed for both theneuromuscular and the visual system. In the neuromuscular system, themain aim of themodelsis to explain the change from polyneuronal to mononeural innervation during development.In the visual system, the main aim is to explain the development of ocular dominance. Sincethe ways in which competition is modelled in both systems have many similarities, models ofboth systems are reviewed together.
The presentation of the models is structured as follows:
• The models described in section 3.1 (and, in part, also in section 3.2) enforce competitionrather than implement its putative underlying mechanisms; that is, these models explore
R12 A van Ooyen
the consequences of imposing certain constraints or ‘rules’ that are introduced to ensurecompetition between axons.
• Themodels described in the other sections directly implement the underlyingmechanisms.To classify thesemodels—all of which implement a form of interdependent competition—I use the different forms of competition that are distinguished in population biology (seesection 1):
- Consumptive competition (section 3.3), in which the individual competitors hindereach other through their dependence on shared resources.
- Interference competition, in which the competitors compete for space (section 3.4) orin which there are direct negative interactions between the competitors (section 3.5).
For each model, I describe what assumptions the model is based upon, how these assumptionsare supported by the experimental data, what the model can explain and predict, and what therole of electrical activity is. For each model, I also identify its underlying positive feedbackloop—this is what enables one or more competitors to outcompete the others. All the modelsare given in sufficient detail to show the differences and similarities in modelling approach andmathematical structure. (In presenting the equations, I use each author’s own mathematicalterminology.) I shall provide criticism for each model, but that does not imply a negative valuejudgement on the work, merely a general reminder that moremodelling and experimental workneeds to be done in order to understand competition.
3.1. Constant total synaptic strength
Computational models of the development of nerve connections—especially models of theformation of ocular dominance columns—typically enforce competition rather than model itsputative underlying mechanisms explicitly (for a review, see Miller (1996); see also Elliottet al (1996a), Swindale (1996)). These models usually describe physiological plasticity(changes in synaptic strength, as a result of Hebbian learning) rather than anatomical plasticity(changes in axonal arborization), and competition is often enforced by keeping the totalsynaptic strength onto a postsynaptic cell constant. Hebbian learning together with enforcingcompetition between input connections has also been used in studying the development ofthe neuromuscular system (Stollberg 1995) (section 3.1.1). Enforcing competition betweenthe output connections of a neuron, by keeping the total synaptic strength of the outputconnections constant, was used by Willshaw (1981) in a model of the neuromuscular systemthat also implemented interference competition between a muscle fibre’s input connections(see section 3.5.1).
To see how competition between input connections can be enforced, consider n inputs,with synaptic strengths wi(t) (i = 1, . . . , n), impinging on a given postsynaptic cell at time t .Simple Hebbian rules for the changewi(t) in synaptic strength in time intervalt state thatthe synaptic strength should grow in proportion to the product of the postsynaptic activity levely(t) and the activity level xi(t) of the ith input. Thus
wi(t) ∝ y(t)xi(t)t. (1)
If two inputs (e.g. two eyes) innervate a common target and if the activity level in bothinputs is sufficient to achieve potentiation, then this rule causes both pathways to be stronglypotentiated, and no segregation (ocular dominance) occurs. What is required is some form ofcompetition, so that when the synaptic strength of one input grows, the strengths of the otherone shrinks. A common method to achieve this is to constrain the total synaptic strength(synaptic normalization). More specifically, synaptic normalization is the constraint that∑n
i wp
i (t) = K , whereK is some constant and p is usually taken to be 1 or 2; p = 1 conserves
Competition in the development of nerve connections: a review of models R13
the total synaptic strength, whereas p = 2 conserves the length of the weight vector. At eachtime intervalt , following a phase of Hebbian learning, in whichwi(t+t) = wi(t)+wi(t),the new synaptic strengths are forced to satisfy the normalization constraint. For a particularnormalization constraint, there are various ways in which that constraint may be enforced. Inmultiplicative normalization (Von der Malsburg 1973, Von der Malsburg and Willshaw 1976,Willshaw and Von der Malsburg 1976), each synaptic strength wi(t + t) is multiplied byan amount so as to enforce the constraint. In subtractive normalization (Miller et al 1989,Miller and Stryker 1990), an amount is subtracted from each synaptic strength so as to enforcethe constraint. For both multiplicative and subtractive normalization, it is also possible toimplicitly enforce the normalization constraint by including a decay term in equation (1)(Miller and MacKay 1994).
The final outcome of development may differ depending on whether multiplicativeor subtractive normalization is used (Miller and MacKay 1994). If two equivalent inputpopulations (e.g. two eyes) innervate a common target, multiplicative normalization preventstheir segregation (i.e. formation of ocular dominance) if there are positive correlationsbetween the two populations (positive between-eye correlations are likely to be present whenthe two eyes are open), whereas subtractive normalization allows segregation under thesecircumstances. Segregation under multiplicative normalization can occur only if there areanticorrelations between the two populations.
With competitive learning (see section 1)—where changes in synaptic strength areperformed only for synapses impinging onto the target cell that is responding most strongly toa stimulus, and for synapses onto neighbours of the ‘winning’ cell—normalization constraintsare also used to prevent synapses from growing without bounds. As with simple Hebbianlearning, the outcome of competitive learning shows important differences depending onwhether multiplicative or subtractive normalization is used (Goodhill and Barrow 1994).
Experimental evidence for multiplicative normalization has been found in cultures ofcortical neurons (Turrigiano et al 1998). In these cultures, the strengths of all synapses ontoa pyramidal neuron are scaled down when the overall activity level of the neuron is increased,and are scaled up when the overall activity level of the cell is decreased. In addition to scalingsynaptic strength, activity can regulate the excitability of the whole neuron, in such a waythat when the activity of a neuron is high, ionic conductances in the neuron are modified todecrease activity, and when the activity of a neuron is low, ionic conductances are modifiedto increase activity (for reviews on such homeostatic plasticity, see Van Ooyen (1994) andTurrigiano (1999)). Since the effect of synaptic strength is weighted by the excitability of thepostsynaptic cell, such regulation of neuronal excitability is functionally similar to activity-dependent scaling of synaptic strength (Miller 1996).
3.1.1. Stollberg (1995). Stollberg (1995) used a form of synaptic normalization to studythe establishment of the size principle (i.e. that motor neurons with higher firing thresholdsinnervate larger numbers ofmuscle fibres—see section 2.1.1). Themodel considers the relativestrengths of synapses impinging on a muscle fibre. The relative synaptic strength is assumed toincrease when synapse and muscle fibre are either both active or both inactive, and to decreasein all other situations. Furthermore, it is assumed that the absolute collective strength increasesduring development. Early on during development, the absolute collective synaptic strengthis low, so that the muscle fibres are not activated. The synapses that are then active will beeliminated. These synapses are mostly those from lower threshold neurons because they areactivated more often; whenever a neuron with a particular threshold is active, all the neuronsin the same pool with a lower threshold are active as well. The removal of the synapsesfrom lower threshold neurons thus produces the size principle. (The elimination of inactive

R14 A van Ooyen
synapses when the muscle fibre is active was shown not to be dominant.) During the course ofdevelopment, also more fibres in the model become mononeuronally innervated, althoughmany remain polyneuronally innervated, and it seems that the model does not guaranteemononeuronal innervation for all fibres. Barber and Lichtman (1999) proposed a relatedmodel of the establishment of the size principle (section 3.5.4).
3.2. Modified Hebbian learning rules
With equation (1), only increases in synaptic strength can take place; decreases insynaptic strength—and competition—are brought about by enforcing synaptic normalizationafterwards. Another approach for achieving competition, which does not impose synapticnormalization, is to modify the simple Hebbian learning rule so that both increases insynaptic strength (long-term potentiation, or LTP) and decreases in synaptic strength (long-term depression, or LTD) can take place.
If we assume that the postsynaptic activity level y(t) must be above some threshold θyto achieve LTP, and otherwise yield LTD; and assume a similar possibility for the presynapticactivity level xi(t), then a suitable synaptic modification rule is (Miller 1996)
wi(t) ∝ [y(t) − θy][xi(t) − θx]t. (2)
If both y(t) and xi(t) are above their thresholds (θy and θx , respectively), LTP occurs; if oneis below its threshold and the other is above, LTD occurs. (To prevent LTP when both y(t)
and xi(t) are below their thresholds, wi(t) is often set to zero in this case.) For LTD toachieve competition, the synaptic strength lost through LTD must roughly equal the strengthgained through LTP. This can only be achieved with appropriate input correlations, whichmakes simple LTD a fragile mechanisms for achieving competition (Miller 1996).
Another mechanism that ensures that when some synaptic strengths increase, others mustcorrespondingly decrease (i.e. competition) is to make one of the thresholds variable. Ifthe threshold θ ix increases sufficiently as the postsynaptic activity y(t) or synaptic strengthwi(t) (or both) increases, conservation of synaptic strength can be achieved (Miller 1996).Similarly, if the threshold θy increases faster than linearlywith the average postsynaptic activity,then the synaptic strengths will adjust to keep the postsynaptic activity near a set point value(Bienenstock et al 1982). This results in temporal competition between input patterns, ratherthan spatial competition between different sets of synapses.
Yet another mechanism that can balance synaptic strengths is based on a form of—experimentally observed—long-term synaptic plasticity that depends on the relative timing ofpre- and postsynaptic actions potentials (spike-timing dependent plasticity, or STDP) (Zhanget al 1998). Presynaptic action potentials that precede postsynaptic spikes strengthen a synapse,whereas presynaptic action potentials that follow postsynaptic spikes weaken it. Synapsessubject to STDP in effect compete for control of the timing of postsynaptic action potentials(i.e. competition in the time domain) (Song et al 2000). Synapses of inputs that fire thepostsynaptic neuron with short latency or that act in correlated groups become strengthened,while others become weakened. As a consequence of the intrinsic nonlinearity of the spike-generation mechanisms, STDP has the effect of keeping the total synaptic input to the neuronroughly constant, independent of the presynaptic firing rates. However, for this to work, it isstill necessary to impose a hard limit on the maximum strength of individual synapses allowed.
3.3. Consumptive competition: competition for target-derived resource
Keeping the total synaptic strength onto a postsynaptic cell constant (synaptic normalization)is a biologically unrealistic way of modelling competition. In both the neuromuscular and
Competition in the development of nerve connections: a review of models R15
the visual system, the total number of synapses onto a postsynaptic cell increases duringcompetition as thewinning axons elaborate their branches and the losing axons retract branches(see section 2). Synaptic normalization is too rigid a constraint compared with the plasticity ofthe developing nervous system, and models based on this constraint may therefore become toorestricted in the range of phenomena they can produce (see also Swindale (1996) and e.g. Elliottand Shadbolt (1998b)). If Hebbian learning rules are modified only to enforce competition andnot to represent a possible physiological mechanism this is equally unsatisfactory. Modellingthe actual mechanism of competition can give the models more flexibility and potentially alarger explanatory and predictive power. It will also be easier to interpret and extend thesemodels because its variables and parameters are more directly linked to biological processesand mechanisms.
In models that implement consumptive competition (resource models), competitionbetween input connections does not have to be enforced but comes about naturally throughtheir dependence on the same target-derived (i.e. postsynaptic) resource. There are two waysin which this can be modelled:
• In fixed resource models (section 3.3.1), the total amount of postsynaptic resource is keptconstant. The total amount of resource is the amount taken up by the input connections(i.e. the total synaptic strength if resource is ‘converted’ into synaptic strength) plus theamount left at the target. Thus, the total synaptic strength is not kept constant (as withsynaptic normalization) and can increase during development when resource becomespartitioned among the input connections.
• In variable resource models (section 3.3.2), even the total amount of resource is notconstrained to remain constant, which is a further step towards biological realism. Inthese models, there is continuous production of neurotrophin and continuous uptake orbinding of neurotrophin. Continuous uptake or binding (‘consumption’) of neurotrophinis needed to sustain the axonal arbors and synapses; this view of the way in which theresource exerts its effects is closer to the biology of neurotrophins, and also closer toother consumer–resource systems in biology: organisms need a continuous supply offood (resource) to sustain themselves.
3.3.1. Constant amount of resource. Two fixed resource models of the development ofneuromuscular connections (Gouze et al (1983) and the dual constraint model (Bennett andRobinson 1989, Rasmussen and Willshaw 1993)) and one of the development of oculardominance columns (Harris et al 1997) are described. The models proposed by Gouze et al(1983) and Harris et al (1997) consider only competition for a postsynaptic resource, whereasthe dual constraint model combines competition for a postsynaptic resource with competitionfor a presynaptic resource (i.e. a presynaptic cell has a fixed amount of resource to distributeamong its output connections). Electrical activity plays the most explicit role in the model byHarris et al (1997).
3.3.1A. Gouze et al (1983). This model is one of the earliest to implement competition fora postsynaptic resource. In the model, there are N motor neurons and M muscle fibres. Amotor neuron is indexed by n, a muscle fibre by m, and a nerve terminal by nm. The modelassumes the following:
(1) Nerve terminals compete for a postsynaptic resource µ, present at concentration µm. Thetotal amount of postsynaptic resource is kept constant.
(2) At each nerve terminal, a postsynaptic stabilization factor s is produced from µ. Theproduction of s is autocatalytic and increases with the mean firing rate In of the neuron.

R16 A van Ooyen
(3) A nerve terminal becomes stabilized when the concentration snm of s reaches a thresholdvalue S.
In terms of differential equations:
dsnmdt
= kInµmsαnm (3)
dµm
dt= −k
N∑n=1
Inµmsαnm (4)
where k is a constant and α is an exponent >1 to express the autocatalytic character of thereaction. Since there is no degradation, there is a fixed amount of resource at each musclefibre m (µm +
∑Nn=1 snm = constant). Assuming a Poisson distribution for the initial number
of nerve terminals per muscle fibre and a normal distribution for the initial values of µm andsnm (In may be taken the same for all n), Gouze et al (1983) showed that the exponent α willamplify the initial differences in snm and that as a result only one nerve terminal per musclefibre becomes stabilized.
The weak points of the model are that (i) no explicit process is suggested for theautocatalytic reaction; (ii) it uses a threshold value for the stabilization of a terminal; and(iii) it is very parameter sensitive—the value of S has to be set relative to the values of theother parameters to ensure single innervation. Also, the model shows that motor unit sizeincreases with In, which is not in agreement with the size principle (see section 2.1.1).
3.3.1B. Dual constraint model. Based on experimental results that suggest a role for botha postsynaptic and a presynaptic resource in the development of neuromuscular connections(see section 2.1.4), the dual constraint model—first proposed by Bennett and Robinson (1989)and later extended and clarified by Rasmussen and Willshaw (1993)—combines competitionfor both these types of resources. A role for a presynaptic resource was first suggested byWillshaw (1981) (section 3.5.1) and later also by Smalheiser and Crain (1984).
Description of the model. There areN motor neurons andM muscle fibres. A motor neuronis indexed by n, a muscle fibre by m, and a terminal by nm. Each motor neuron has apresynaptic resource A (e.g. a receptor), which is located in all its terminals, in amount Anm.Each muscle fibre has a postsynaptic resource B (e.g. a neurotrophin molecule), in amountBm, for which motor neuron terminals compete. In the synaptic cleft, a reversible reactiontakes place between A and B to produce binding complex C, in amount Cnm. Thus
Anm + Bm � Cnm. (5)
The binding complex C is essential to the maintenance of a terminal: the size of the terminalis assumed to be directly proportional to Cnm. For the rate of change of Cnm the followingequation is assumed:
dCnm
dt= αAnmBmC
µnm − βCnm (6)
whereα andβ are rate constants. IncludingCµnm (withµ > 0) in the rate of the forward reaction
incorporates a positive feedback: larger terminals favour the forward reaction and so canbecome larger still. The justification given by Bennett and Robinson (1989) for including thispositive feedback is that electrical activity in the nerve terminal could produce electromigrationof moleculesB in the endplate—so that larger terminals will attract moremolecules. IncludingCµnm (with µ > 0) is needed to achieve single innervation (Bennett and Robinson 1989, Van
Ooyen and Willshaw 1999a)

Competition in the development of nerve connections: a review of models R17
The total amount A0 of presynaptic substance in each motor neuron and the total amountB0 of postsynaptic substance in each muscle fibre are fixed. Molecules of A can be locatedin the cell soma and in the terminals of the neuron, either bound or unbound. Thus, theconservation equation for A is
A0 = An +M∑j=1
Anj +M∑j=1
Cnj (7)
where An is the amount of A located in the cell soma of motor neuron n.The amountAnm of unbound presynaptic substance is assumed to be proportional to (i) the
size Cnm of the terminal (thus incorporating a second positive feedback); and (ii) the amountAn of presynaptic factor in the cell soma, yielding
Anm = KCnmAn (8)
where K is a constant. Bennett and Robinson (1989) did not discuss what process could giverise to the distribution of A given by equation (8). Rasmussen and Willshaw (1993) showedthat anterograde transport of A down the axon in combination with retrograde transport ofA from the terminal could give rise to such a distribution. The role of the combination ofboth positive feedback loops (one in equation (6) and one in equation (8)) in achieving singleinnervation has not been analysed.
Using equations (7) and (8), we obtain
Anm = KCnm
A0 −∑Mj=1 Cnj
1 +K∑M
j=1 Cnj
. (9)
Molecules of B can either be unbound in the endplate membrane or bound in one of theterminals. Thus, the conservation equation for B is
B0 = Bm +N∑i=1
Cim. (10)
Introducing equations (9) and (10) into (6) gives a set of differential equations for howCnm
changes over time. For the initial conditions, Bennett and Robinson (1989) chose a randomset of terminals whereby each terminal had the same initial value of Cnm, so that symmetrywas broken only by the spread in initial motor unit sizes. Rasmussen and Willshaw (1993)broke the symmetry also by variation in the initial values of Cnm.
Results of the model. By means of simulation, Bennett and Robinson (1989) showed thatafter an initial phase in which all terminals grow, a state of single innervation is reachedin most cases. Using perturbation analysis, Rasmussen and Willshaw (1993) showed thatsingle innervation is indeed a stable state of the model. They also showed that there is anupper limit—proportional to A0/B0—on the number of terminals that can be supported byeach motor neuron. So if the initial amount of polyneuronal innervation is larger than thislimit, then terminals will withdraw, even in the absence of competition, i.e. there is intrinsicwithdrawal. They suggested that intrinsic withdrawal should not be regarded as a separatenon-competitive mechanism (Thompson and Jansen 1977, Fladby and Jansen 1987) but ratheras a side effect of the competitive mechanism.
Neither Rasmussen and Willshaw (1993) nor Bennett and Robinson (1989) analysedwhether polyneuronal innervation can also be a stable state of themodel. Using bifurcation andphase–space analysis, Van Ooyen and Willshaw (1999a) showed that, for certain parametersettings, polyneuronal states can be stable and can coexist with single innervation states.
R18 A van Ooyen
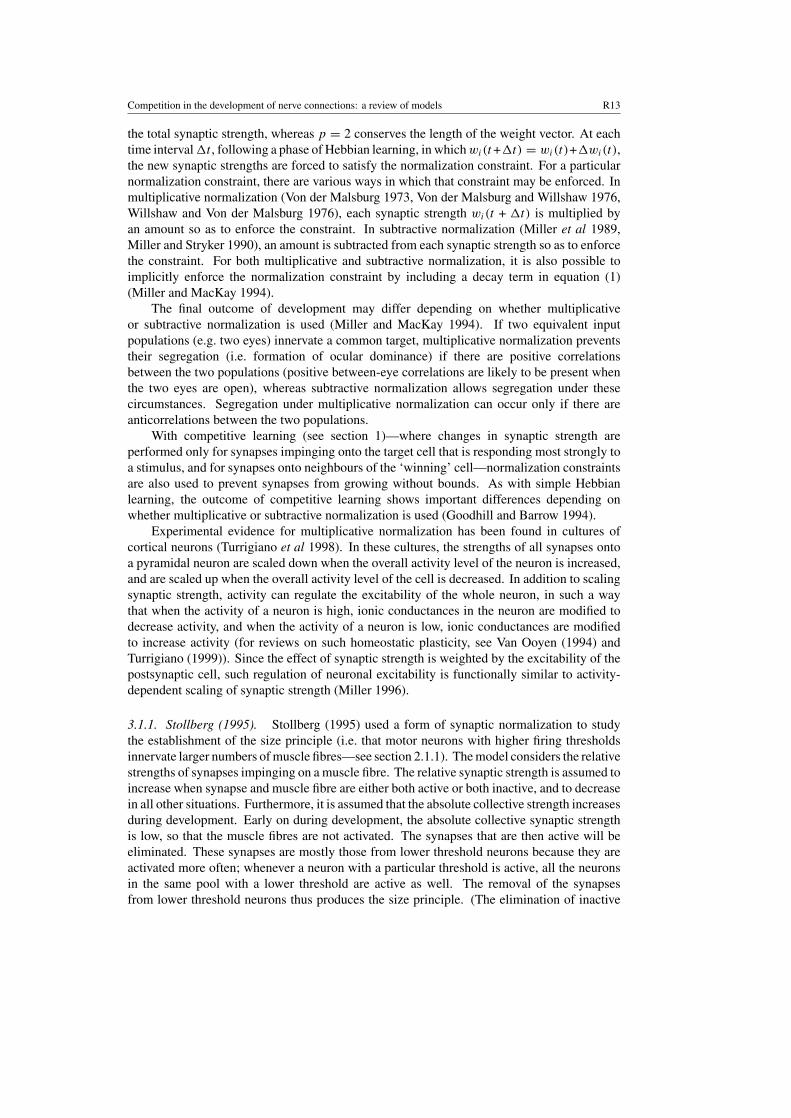
Which of these states will be reached depends on the initial amounts of binding complexC in the terminals. The coexistence of stable polyneuronal and single innervation statesoffers an explanation for partial denervation experiments that show that persistent polyneuronalinnervation occurs after reinnervation and recovery from prolonged nerve conduction block(Brown et al (1982), Barry and Ribchester (1995); see section 2.1.6), while under unblockedconditions single innervation develops (see section 2.1.3 and figure 3). The model by VanOoyen and Willshaw (1999b), section 3.3.2D, offers a related explanation for persistentpolyneuronal innervation.
To study the formation of topographic maps in the projections from motor neuron pool tomuscle (see section 2.1.4), Bennett and Robinson (1989) considered a situation in which therate constant α of the forward reaction (see equation (6)) takes on different values accordingto which motor neuron n and which muscle fibre m are involved. This situation is possibleif the properties of the presynaptic and postsynaptic substance depend on respectively whichmotor neuron and which muscle fibre synthesizes them. A topographic map will emerge ifthese properties change according to position of motor neuron andmuscle fibre. In simpler andmore general models with a graded affinity between axons and postsynaptic sites (designedfor the visual system), Prestige and Willshaw (1975) showed that a topographic map emergesif both the number of axon branches that can contact a postsynaptic cell and the number ofpostsynaptic sites that an axon can contact are limited; in other words, if, as in Bennett andRobinson (1989), there is both a postsynaptic and a presynaptic constraint causing competition.
Weak points of the dual constraintmodel are that (i) it does notmake clear the identity of thepre- and postsynaptic resource; (ii) a stronger biological justification for the positive feedbackloops is needed; and (iii) without electrical activity (µ = 0 in equation (6)), no competitiveelimination of connections takes place (see also figure 3(c)), which is not in agreement withrecent experimental findings (see section 2.1.6).
Further analyses and extensions of the model. By giving a more specific interpretation of thedual constraintmodel, Joseph andWillshaw (1996)were able to offer an alternative justificationfor the dependence of the rate of the forward reaction (in equation (6)) on the sizeCnm of amotorneuron terminal. They assumed that molecule A represents the protein agrin, and moleculeB the acetylcholine receptor (AChR). AChR diffuses freely in the muscle membrane, butwhen agrin binds to agrin-specific receptors in the muscle, AChRs immobilize and aggregate(Axelrod et al 1976, Wallace 1988). Aggregation is an activity-dependent process becauseit requires Ca2+, which enters the muscle following AChR activation by acetylcholine (theneurotransmitter in motor neuron terminals). The number of aggregated AChRs is representedin the model by Cnm, which determines the size of the terminal. However, because agrindoes not bind directly to AChR, a different reaction scheme between A and B is required;nonetheless, this reaction scheme also produces equation (6) for the rate of change of Cnm.But the rate of the forward reaction is now proportional to the size of the terminal because of thedependence of aggregation on Ca2+ influx into the muscle, which is proportional to the amountof AChR activation and therefore to the area of the terminal. Joseph and Willshaw (1996)used the model to explain that, during reinnervation, the regenerating nerve displaces moreterminals from the intact nerve when the muscle is paralysed than when it is not (Ribchester1993). Under conditions of paralysis in the model—which means no Ca2+ influx into themuscle—there is a change in the dependence of the rate of the forward reaction on the size ofan individual terminal, which gives the small reinnervating terminals some initial advantagein the competitive process.
By combining elements from the models by Joseph and Willshaw (1996) and Kerszbergand Changeux (1993)—so that Ca2+ now inhibits AChR production globally and stimulates
Competition in the development of nerve connections: a review of models R19
0 0.3 0.60
0.3
0.6(a) (b)
(c) (d)
0 0.3 0.60
0.3
0.6
0 0.3 0.60
0.3
0.6
0 0.3 0.60
0.3
0.6
c11
c11
c11
c 21c 21
c 21c 21
c11
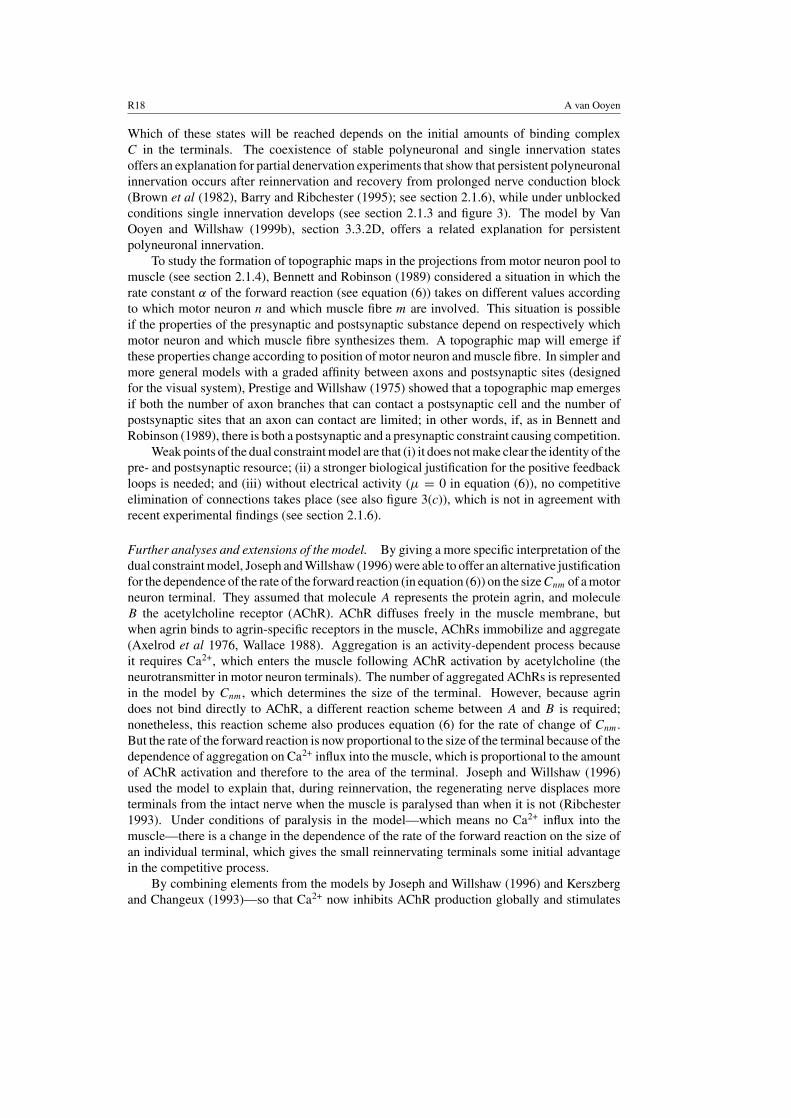
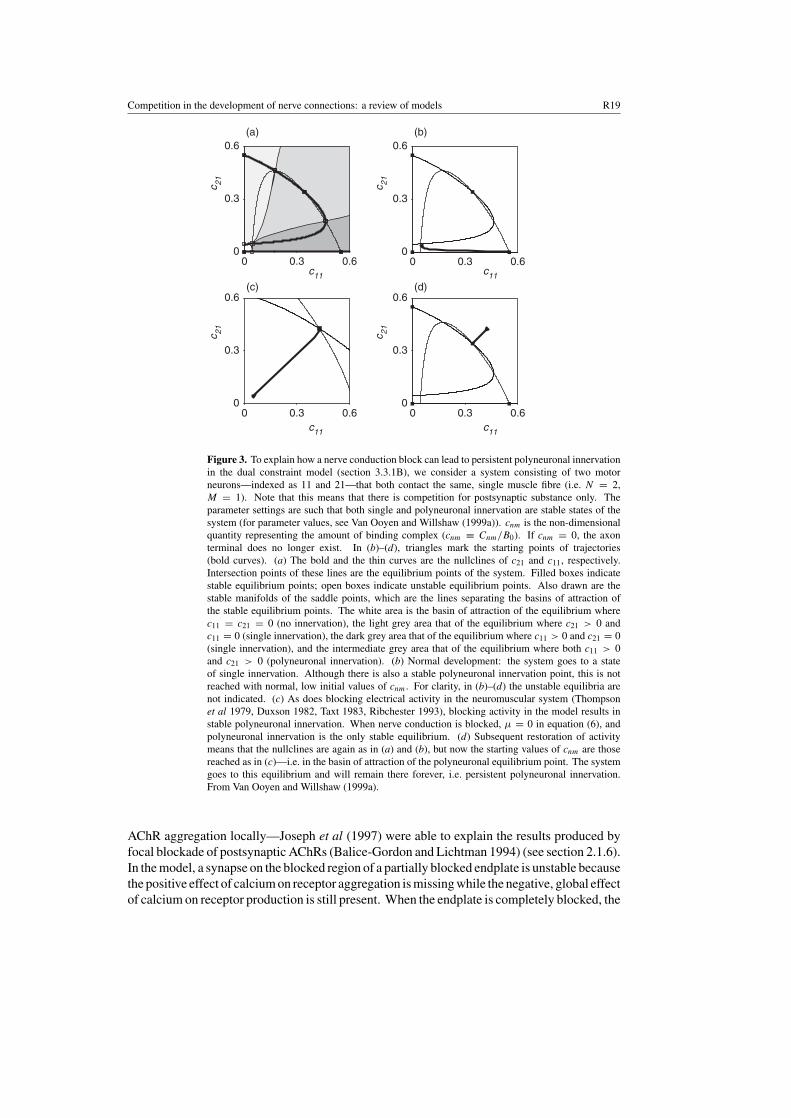
Figure 3. To explain how a nerve conduction block can lead to persistent polyneuronal innervationin the dual constraint model (section 3.3.1B), we consider a system consisting of two motorneurons—indexed as 11 and 21—that both contact the same, single muscle fibre (i.e. N = 2,M = 1). Note that this means that there is competition for postsynaptic substance only. Theparameter settings are such that both single and polyneuronal innervation are stable states of thesystem (for parameter values, see Van Ooyen and Willshaw (1999a)). cnm is the non-dimensionalquantity representing the amount of binding complex (cnm ≡ Cnm/B0). If cnm = 0, the axonterminal does no longer exist. In (b)–(d), triangles mark the starting points of trajectories(bold curves). (a) The bold and the thin curves are the nullclines of c21 and c11, respectively.Intersection points of these lines are the equilibrium points of the system. Filled boxes indicatestable equilibrium points; open boxes indicate unstable equilibrium points. Also drawn are thestable manifolds of the saddle points, which are the lines separating the basins of attraction ofthe stable equilibrium points. The white area is the basin of attraction of the equilibrium wherec11 = c21 = 0 (no innervation), the light grey area that of the equilibrium where c21 > 0 andc11 = 0 (single innervation), the dark grey area that of the equilibrium where c11 > 0 and c21 = 0(single innervation), and the intermediate grey area that of the equilibrium where both c11 > 0and c21 > 0 (polyneuronal innervation). (b) Normal development: the system goes to a stateof single innervation. Although there is also a stable polyneuronal innervation point, this is notreached with normal, low initial values of cnm. For clarity, in (b)–(d) the unstable equilibria arenot indicated. (c) As does blocking electrical activity in the neuromuscular system (Thompsonet al 1979, Duxson 1982, Taxt 1983, Ribchester 1993), blocking activity in the model results instable polyneuronal innervation. When nerve conduction is blocked, µ = 0 in equation (6), andpolyneuronal innervation is the only stable equilibrium. (d) Subsequent restoration of activitymeans that the nullclines are again as in (a) and (b), but now the starting values of cnm are thosereached as in (c)—i.e. in the basin of attraction of the polyneuronal equilibrium point. The systemgoes to this equilibrium and will remain there forever, i.e. persistent polyneuronal innervation.From Van Ooyen and Willshaw (1999a).
AChR aggregation locally—Joseph et al (1997) were able to explain the results produced byfocal blockade of postsynaptic AChRs (Balice-Gordon and Lichtman 1994) (see section 2.1.6).In themodel, a synapse on the blocked region of a partially blocked endplate is unstable becausethe positive effect of calciumon receptor aggregation ismissingwhile the negative, global effectof calcium on receptor production is still present. When the endplate is completely blocked, the

R20 A van Ooyen
negative effect of calcium is also missing, creating again a stable situation. For an alternative,but related, explanation of the focal blockade experiments, see sections 3.5.3 and 3.5.4.
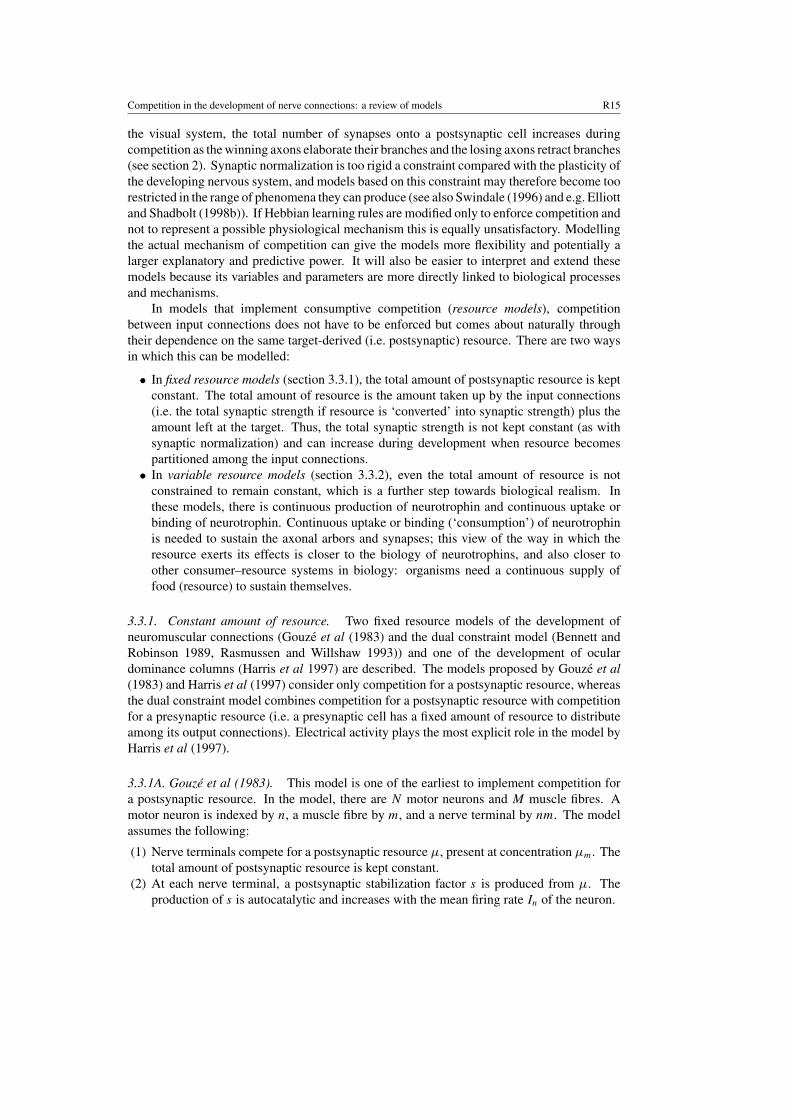
3.3.1C. Harris et al (1997). Harris et al (1997) proposed a model of the development ofocular dominance columns that incorporates an interesting combination of Hebbian synapticmodification and activity-driven competition for neurotrophins. The model assumes thefollowing:
(1) Each cortical cell has a fixed pool of neurotrophin to distribute over its input connections.(2) Connection strength increases due to Hebbian LTP and decreases due to heterosynaptic
LTD.(3) The more neurotrophin a synapse has taken up, the higher the rate at which its connection
strength increases (Korte et al 1995).(4) The higher the connection strength, the faster the uptake of neurotrophin.
In the description of the model, a single cortical cell i will be considered, which receivesinput from both right and left eyes.
From assumption (1)
N fi + (nr
i + nli ) = Ni (11)
where Ni is the total amount of neurotrophin available at cortical cell i, (nri + n
li ) is the sum of
the amounts currently taken up by the right and left eye inputs, and N fi is the amount of free
neurotrophin left at cell i (see figure 4). The equations controlling connection strength andneurotrophin level are given for the input from the right eye; identical equations hold for theleft eye. A maximum level of connection strength is assumed, which is set arbitrarily to 1:
wri + f r
i = 1 (12)
where wri is the current connection strength of the input from the right eye, and f r
i is the freestore of raw material still available at the connection.From assumptions (2) and (3), there is a reversible interchange between connection strengthand free store of raw material:
K+
f ri � wr
i
K−
with
K+ = k+nrivia
r (13)
K− = β1vi (14)
where k+ and β1 are constants, vi is the firing rate in cortical cell i, and ar is the activity in thethalamic input from the right eye. Using equations (12)–(14), we obtain for the rate of changeof wr
i
dwri
dt= k+nr
iviar(1 − wr
i ) − β1viwri . (15)
From assumption (4),
wri
N fi � nr
i
β2

Competition in the development of nerve connections: a review of models R21
Cortical cell
R LConnection strength (w)
Neurotrophin taken up (n)
Free neurotrophin (N)
Free store of material (f)
Figure 4. The model by Harris et al (1997) (section 3.3.1C). Each cortical cell i receives inputfrom both the left (L) and the right (R) eye. The connection from each eye has a fixed total amountof material available, so that—for the right eye, for example—the current connection strength wr
i
plus the free store of raw material f ri remains constant. The rate at which raw material is reversibly
transformed into connection strength is affected by the amount nri of neurotrophin taken up bythe connection. Each cortical cell has a fixed total amount of neurotrophin available, so that theamounts taken up by the right and left eye connections (nri , n
li ) plus the amount of free neurotrophin
left at cortical cell i remains constant. Drawn after Harris et al (2000).
and, using equation (11)
dnri
dt= [Ni − (nr
i + nli )]w
ri − β2n
ri (16)
where β2 is a constant. Equations (15) and (16) form the crucial part of the model.The model shows that ocular dominance columns develop normally—even with positive
inter-eye correlations in activity (cf section 3.1)—when available neurotrophin is below acritical amount and that column development is prevented when excess neurotrophin is added.Harris et al (2000) showed that the model can also account for the experimental results thatcolumn formation is prevented by removal of neurotrophin (Cabelli et al 1997) and that theshift to the open eye in monocular deprivation experiments is mitigated by excess neurotrophin(Carmignoto et al 1993, Hata et al 1996) (see section 2.2.3).
A criticism of the model is that it incorporates only physiological plasticity and that itdoes not explicitly describe anatomical plasticity, while the latter is (mainly) involved in theformation of ocular dominance columns and its breakdown following infusion of neurotrophin(see section 2.2, and also Elliott and Shadbolt (1998b)). Essential features of the model areassumptions (1), (3), and (4). Assumption (4) is motivated by evidence that neurotrophincan be released in an activity-dependent manner (Blochl and Thoenen 1995), although thissays something about the amount available and not directly about the rate constant for uptake.Moreover, if the released neurotrophin diffuses too far, the connections from both eyes wouldprofit from increased release, which would invalidate assumption (4).

R22 A van Ooyen
3.3.2. Variable amount of resource. As opposed to the models in section 3.3.1, in variableresource models it is not required that the total amount of resource should remain constant.There is continuous production and uptake or binding of neurotrophin; continuous uptake orbinding is needed to sustain the axonal arbors and synapses. The models are formulated interms that usually have a clear biological interpretation (production, decay, growth). Elliott andShadbolt (1998a) and Elliott et al (1996a) proposed models of competition in the developmentof the visual system, whereas the models by Jeanpretre et al (1996) and Van Ooyen andWillshaw (1999b) were not intended to model a particular system and study in generalcompetition for a target-derived neurotrophic factor. Although the model by Elliott et al(1996a) is significantly different from the other models in this section—in that resource is notexplicitly modelled—I still consider it here because the amount of resource is interpreted interms of postsynaptic activity, which is variable.
3.3.2A. Elliott et al (1996a). Elliott et al (1996a) used an approach from statistical mechanicsto model sprouting and retraction of axonal processes (i.e. anatomical plasticity). The modelconsists of a sheet of presynaptic cells and a sheet of postsynaptic cells, whereby eachpresynaptic cell has axonal projections over a preferred region of the postsynaptic sheet. Theenergy of the network is defined as
E = − 12
∑〈ij〉
σiσj (17)
where i and j index axonal processes of presynaptic cells and σi = +1(−1) denotes activity(inactivity) of the presynaptic cell from which process i emerges. The symbol 〈ij〉 meansthat the product σiσj contributes to the sum if and only if the axonal processes are attachedto the same or to adjacent postsynaptic cells. The energy Ei of any particular axonal processi is defined implicitly in equation (17). Thus, axonal processes that have the same activationstate as axonal process i, and that are attached to the same or to adjacent postsynaptic cells,decrease the energyEi , while processes of opposite states of activation increase it. Low energyis interpreted as high trophic support: a postsynaptic cell is stimulated to release neurotrophinwhen the axons innervating it are active (e.g. Zafra et al (1991)). The sum over nearestpostsynaptic neighbours represents local diffusion through the target field.
After a pattern of presynaptic activity is established, active presynaptic cells are selected toundergo, with a certain probability, sprouting and retraction such that the energy of the networkis minimised. Only active presynaptic cells are selected because active processes are assumedto require greater trophic support than inactive ones. Energy minimisation thus correspondsto cells searching for the greatest trophic support by sprouting into postsynaptic regions ofhigh support and retracting from postsynaptic regions of low support. Energy minimisationimplements competition because pairs of axonal processes of opposite activation increase theenergy. The model was used to study the development of ocular dominance columns, theplasticity of adult somatosensory maps, and various pharmacological manipulations of thedeveloping visual system (Elliott et al 1996a–c, 1997).
A criticism of the model is that it implements only a very crude approximation ofcompetition for neurotrophin. Furthermore, Miller (1998) showed that the energy functionused in this model is mathematically equivalent to the energy function used in models that areformulated in terms of synaptic strengthmodification of anatomically fixed connections (Milleret al 1989). However, Elliott et al (1998) argued that this equivalence of energy functions doesnot entail equivalence of models and that there are significant dynamical differences.
Competition in the development of nerve connections: a review of models R23
3.3.2B. Elliott and Shadbolt (1998a). Elliott and Shadbolt (1998a) proposed a model(improved from Elliott and Shadbolt (1996)) of the development of the visual system thatexplicitly describes anatomical plasticity and incorporates the role of electrical activity. Theirmodel will be described for the case of a single target (e.g. a cortical cell) with a number ofinnervating axons (e.g. from the LGN).
Description of the model. The model is formulated in discrete time steps initially and thentransformed into differential equations. The variable in the model is the number sni of synapsesthat axon i has on the target at time step n. The target releases neurotrophin, in amount rn
rn = T0 + T1fn (18)
where T0 is a constant representing the activity-independent component of release, T1 is aconstant for the activity-dependent component, and 0 � f n � 1 is the mean activity of asynapse averaged over all synapses impinging onto the target:
f n =∑
i sni a
ni∑
i sni
(19)
where ani ∈ [0, 1] is the level of electrical activity of axon i. The uptake uni of neurotrophinby axon i increases with its number of synapses and its level of activity:
uni = Qnrnsni g(ani )ρ
ni (20)
where Qn is a constant of proportionality, g is some function describing the dependence ofneurotrophin uptake on the axon’s electrical activity, and ρi is the affinity of each synapsefor the neurotrophin and is interpreted as the number of neurotrophin receptors. It is furtherassumed that the total uptake of neurotrophin by all axons completely exhausts the availablepool of neurotrophin at each time step. This means that
∑i u
ni = rn, which defines Qn as
Qn = 1∑i s
ni g(a
ni )ρ
ni
. (21)
The function g is
g(ani ) = a + ani (22)
where a is a constant determining the capacity of an inactive axon to take up the neurotrophin.Uptake of neurotrophin increases the number of synapses (for references, see section 3.3.2D):
sn+1i − sni = ε(uni − sni ) (23)
where ε is a constant determining the growth rate. Note that for an axon to sustain its synapsesit needs to take up neurotrophin; if uni = 0, the number of synapses decreases. Equations (20)and (23) incorporate a positive feedback: neurotrophin increases the number of synapses, andmore synapses mean a higher uptake of neurotrophin. Putting all the equations together, wehave
sn+1i − sni = εsni
[(T0 + T1
∑j s
nj a
nj∑
j snj
)(a + ani )ρ
ni∑
j snj (a + anj )ρ
nj
− 1
]. (24)
From equation (24) a differential equation is obtained by omitting n everywhere and replacingthe left side by dsi/dt . For the number ρi of neurotrophin receptors per synapse, two caseswere considered. Either ρi was a fixed number or it was proportional to the recent time averageani of the axon’s activity, i.e.
ρi = λani
/∑x
snxi (25)
where λ is an arbitrary constant and x is the index of a target (two or more targets need tobe considered in this case). Dividing by the axon’s total number of synapses means that thereceptors are distributed over the axon’s synapses.
R24 A van Ooyen
Results of the model. Elliott and Shadbolt (1998a) analysed mathematically the case for twoinnervating axons and a single target. Both choices of the number ρi of neurotrophin receptorsgive essentially identical results and numerically they found little qualitative difference whenmore than two innervating axons were considered. When the activity-independent uptake ofneurotrophin dominates the activity-dependent uptake (the limit a → ∞), then both axonssurvive. When the activity-dependent uptake is sufficiently strong (a sufficiently small), singleinnervation occurs, where the axon with the highest activity level ai wins the competition.When both axons have the same mean activity level but are not necessarily active at the sametime, then if the activity-dependent release of neurotrophin dominates (c ≡ T0/(aT1) < 1),single innervation always develops, for all values of p < 1, where p is the probability thatboth axons have the same activity in any given time interval (only binary activity is considered;p = 0.5 represents uncorrelated activity). The two fixed points of single innervation, whereeither of the axons is present, are both stable; the fixed point of multiple innervation is unstable.Which of these stable points will be reached in any specific situation depends on the axons’initial number of synapses. Conversely, if the activity-independent release dominates (c > 1),then both axons survive, for all values of p < 1. The stability of the fixed points is now exactlythe reverse from above.
Elliott and Shadbolt (1998b) extended the simple system with only one target cell to afull model consisting of two sheets of LGN cells, one representing the left eye and the otherrepresenting the right eye, and one sheet of cortical cells. Further: (i) each LGN cell wasconstrained to arborize over a fixed square patch of cortical cells; (ii) equation (25) was usedfor the number of neurotrophin receptors per synapse; and (iii) the neurotrophin releasedby the cortical cells was assumed to diffuse through the target field. They showed that thismodel permits the formation of ocular dominance columns, even in the presence of positivelycorrelated interocular images (with synaptic normalization this would have been possible onlywith subtractive normalization—see section 3.1). In accordance with the simple system, theyfound that a high level of neurotrophin released in an activity-independent manner preventsthe formation of ocular dominance columns. To compare their results with neurotrophininfusion experiments (see section 2.2.3), a high level of neurotrophin released in an activity-independent manner was taken to represent the level of neurotrophin availability by exogenouscortical infusion.
In a further study, Elliott and Shadbolt (1999) used their competition model to show thatspontaneous retinal activity can drive the segregation of afferents into eye-specific laminae(LGN) and columns (cortex), as well as the refinement of topographic and receptive fields inthe retinogeniculocortical pathway. Again, afferent segregation and receptive field formationare disrupted in the presence of exogenous neurotrophins.
Criticisms of the model are the following. (i) In equation (19), the activity-dependentrelease by the target is dependent not just on its level of activity but on its level of activitydivided by the total number of synapses impinging onto the target. Why this is so and how thisnormalization affects the results is not made clear. (ii) In the model, electrical activity directlyincreases the uptake of neurotrophin (equation (20)). Although electrical activity can increaseuptake by increasing the number of neurotrophin receptors (Salin et al 1995, Birren et al 1992)or, by stimulating axonal branching, the number of synapses (Ramakers et al 1998), this is notthe way in which it was modelled in equation (20).
3.3.2C. Jeanpretre et al (1996). Jeanpretre et al (1996) were the first to model neurotrophicsignalling in a fully dynamical way: the model describes changes in the extracellularconcentration of neurotrophin resulting from production, degradation, and binding ofneurotrophin.

Competition in the development of nerve connections: a review of models R25
A single target is considered at which there are n innervating axons. Neurotrophinis released by the target into the extracellular space and is removed by the axons throughreceptor-mediated uptake. The model also considers removal of neurotrophins other than bythe innervating axons: i.e. by degradation and diffusion and by receptor-mediated uptake byneural and non-neural cells (e.g. glia) in the target area. The variables in the model are the‘axonal vigour’, xi for axon i, and the concentration S of neurotrophin in the extracellularspace. The axonal vigour represents the ability of each axon to take up neurotrophin and isproportional to the total number of neurotrophin receptors (occupied plus unoccupied) at eachaxon. Focusing on the essential elements of the model, ignoring receptor-mediated uptake ofneurotrophin other than by the innervating axons, we obtain
dxidt
= xiGi(xi)
[S
Kd,i + S− STi
Kd,i + STi
](26)
dS
dt= Q − AS −
n∑i=1
xiS
Kd,i + S(27)
whereQ is the rate of release of neurotrophin;A is the rate constant for degradation; S/(Kd,i+S)is the fraction of occupied receptors, which follows from assumingMichaelis–Menten kinetics,where Kd,i is a constant of the binding reaction; Gi(xi) is a function with the only restrictionthat it always remains between two positive constants; and STi is a constant that represents thevalue of S that gives zero growth of the vigour of axon i. Thus, in equation (27), the amount ofneurotrophin that is removed by axon i increases with the number xiS/(Kd,i + S) of occupiedreceptors. In equation (26), the rate of change of vigour depends on the vigour itself (i.e.positive feedback) and increases with the number of occupied receptors, over and above somethreshold STi /(Kd,i + STi ).
By means of a Lyaponov function, they showed that the system will approach a stableequilibrium point in which a single axon—the one with the lowest value of STi —survives.Although well known from models of population dynamics (Yodzis 1989), they rightlyemphasized that the widespread intuitive belief that competition is a consequence of resourcesbeing produced in limiting amounts is too simplistic. For example, the number of survivingaxons cannot be increased by increasing the rate of release of neurotrophin. The higher releasebecomes again limiting by the resulting increase in axonal vigour.
Criticisms of the model are that (i) it can only explain single innervation; however,Kohli and Clarke (1997) showed that if axonal vigour is bounded—i.e. a ceiling on Gi(xi)
is imposed—multiple innervation also becomes possible; (ii) equation (26), which specifiesthe rate of change of axonal vigour (including the positive feedback), is postulated but notexplicitly derived from underlying biological mechanisms; (iii) the thresholds do not emergefrom the underlying dynamics but need to be assumed; and (iv) in this formulation, axons haveonly a single target, whereas in many biological systems each axon often innervates a numberof targets.
3.3.2D. Van Ooyen and Willshaw (1999b). Independently from Jeanpretre et al (1996), VanOoyen and Willshaw (1999b) proposed a model of competition that implements neurotrophicsignalling in a fully dynamical way. Unlike Jeanpretre et al (1996), they did not need toassume a priori thresholds and could explain both single and multiple innervation. Importantvariables in theirmodel are the total number of neurotrophin receptors that each axonhas and theconcentration of neurotrophin in the extracellular space. In themodel, there is positive feedbackloop between the axon’s number of receptors and amount of bound neurotrophin. Unlike inJeanpretre et al (1996), this positive feedback—which enables one ormore axons to outcompete

R26 A van Ooyen
Figure 5. The model by Van Ooyen and Willshaw model (section 3.3.2D) (from Van Ooyen andWillshaw (1999b); see this paper for parameter values). (a) Target cell with three innervatingaxons, each with a different degree of branching. The target releases neurotrophin, which bindsto neurotrophin receptors at the axon terminals. For three different classes of growth functions(as defined in section 3.3.2D), (b)–(d) show the development of innervation for a system offive innervating axons, where each axon has a different competitive strength, βi (defined insection 3.3.2D). Figures (e)–(g) show the nullcline pictures for a system of two innervating axons(the variables Ri, Ci, i = 1, 2 and L are set at quasi-steady state; in (e) and (f ), β1 > β2; in(g), β1 = β2). Axons that at the end of the competitive process have no neurotrophin (Ci = 0;equivalent to φi = 0) are assumed to have withdrawn. In (e)–(g), the bold curves are the nullclinesof φ1 and the light curves are the nullclines of φ2 (the x- and y-axes are also nullclines of φ2 andφ1, respectively). Intersection points of these lines are the equilibrium points of the system. Afilled square indicates a stable equilibrium point; an open square indicates an unstable equilibriumpoint. Vectors indicate direction of change. (b) Class I: elimination of axons takes place until asingle axon remains. The axon with the highest value of the competitive strength, βi , survives.(c) Class II: for the parameter settings used, several axons survive. (d) Class III: dependence oninitial conditions: although axon one has the highest value of the competitive strength, axon twosurvives because its initial value of φi is sufficiently higher than that of axon one. (e) Class I: thenullclines do not intersect at a point where both axons coexist. (f ) Class II: the nullclines intersectat a point where both axons coexist. For a sufficiently lower rate of release of neurotrophin, forexample, the nullclines would not intersect, and only one axon would survive. (g) Class III: thereis a stable equilibrium point where both axons coexist, as well as stable equilibrium points whereeither axon is present (the stable equilibrium point at (φ1 = 0, φ2 = 0) is not indicated because ittoo close to another, unstable point). For a sufficiently higher value of Ki , for example, the stableequilibrium point where both axons coexist would disappear.

Competition in the development of nerve connections: a review of models R27
Figure 5. (Continued)
the others—wasderiveddirectly fromunderlyingbiologicalmechanisms. Followingbinding toreceptor, neurotrophins can increase the terminal arborization of an axon (Campenot 1982a, b,Edwards et al 1989, Yasuda et al 1990, Yunshao et al 1992, Diamond et al 1992, Cohen-Cory and Fraser 1995, Causing et al 1997, Schnell et al 1994, Funakoshi et al 1995) andtherefore the axon’s number of synapses. Because neurotrophin receptors are located onsynapses, increasing the number of synapses means increasing the axon’s total number ofreceptors. Thus, the more receptors an axon has, the more neurotrophin it will bind, whichfurther increases its number of receptors, so that it can bind even more neurotrophin—at theexpense of the other axons.
Instead of by increasing the terminal arborization of an axon, neurotrophinsmight increasethe axon’s total number of receptors by increasing the size of synapses (e.g. Garofalo et al(1992)) or by upregulating the density of receptors (e.g. Holtzman et al (1992)).
Description of the model. A single target cell is considered at which there are n innervatingaxons each from a different neuron (figure 5(a)). Neurotrophin is released by the target into theextracellular space, at a (constant) rate σ , and is removed by degradation, with rate constant δ.In addition, at each axon i, neurotrophin is bound to receptors, with association and dissociationconstants ka,i and kd,i , respectively. Bound neurotrophin (the neurotrophin-receptor complex)is also degraded, with rate constant ρi . Finally, unoccupied receptor is inserted into each axon,at rate φi , and is degraded, with rate constant γi . Thus, the rates of change of the total numberRi of unoccupied receptors on axon i, the total numberCi of neurotrophin-receptor complexeson axon i, and the extracellular concentration L of neurotrophin are
dCi
dt= (ka,iLRi − kd,iCi) − ρiCi (28)
dRi
dt= φi − γiRi − (ka,iLRi − kd,iCi) (29)

R28 A van Ooyen
dL
dt= σ − δL −
n∑i=1
(ka,iLRi − kd,iCi)/v (30)
where v is the volume of the extracellular space. The term (ka,iLRi − kd,iCi) represents thenet amount of neurotrophin that is (continuously—to counter ρiCi) being bound to receptor.Axons that end up with no neurotrophin (Ci = 0) are assumed to have withdrawn.
The biological effects of neurotrophins—all of which, as explained above, can lead to anaxon getting a higher total number of receptors—are triggered by a signalling cascade thatis activated upon binding of neurotrophin to receptor (Bothwell 1995). In order for the totalnumber of receptors to increase in response to neurotrophin, the rate φi of insertion of receptorsmust be an increasing function, fi (called growth function), of Ci . To take into account thataxonal growth is relatively slow, φi lags behind fi(Ci) with a lag given by
τdφidt
= fi(Ci) − φi (31)
where the time constant τ for growth is of the order of days. Setting immediately φi = fi(Ci)
does not change the main results. Van Ooyen and Willshaw (1999b) studied different classesof growth functions, all derived from the general growth function
fi(Ci) = αiCmi
Kmi + Cm
i
. (32)
Depending on the values of m and K , the growth function is a linear function (class I: m = 1andKi � Ci), a Michaelis–Menten function (class II:m = 1 andKi � Ci), or a Hill function(class III: m = 2). Within each class, the specific values of the parameters αi and Ki , aswell as those of the other parameters, will typically differ between the innervating axons—e.g.as a result of differences in activity or other differences. For example, increased presynapticelectrical activity can increase the axon’s total number of receptors (e.g. by upregulation:Birren et al (1992), Salin et al (1995); or by stimulating axonal branching: Ramakers et al(1998)), which implies that, for example, αi is increased or γi is decreased.
Results of the model. For class I, starting with any number of axons, elimination of axonstakes place until a single axon remains (single innervation), regardless of the rate σ of releaseof neurotrophin (see figure 5). The axon that survives is the one with the highest value of thequantity βi ≡ (ka,i (αi/Ki −ρi))/(γi(kd,i +ρi)), which is interpreted as the axon’s competitivestrength. For class I, only in the ‘degenerate’ case when two axons have exactly the sameparameter values can they coexist. If the growth function is a saturating function—classes IIand III—more than one axonmay survive (multiple innervation); the higher the rateσ of releaseof neurotrophin, the more axons survive. For class III, stable equilibria for single and multipleinnervation can coexist, and which of these will be reached in any specific situation depends onthe initial conditions. For classes I and II, there is no dependence on initial conditions. For allclasses, axons with a high competitive strength βi survive, and the activity dependence of βi(e.g. via αi) means that these are the most active ones provided that the variation due to otherfactors does not predominate. The coexistence of several stable equilibria for class III impliesthat an axon that is removed from a multiply innervated target may not necessarily survive(‘regenerate’) when replaced with a low number of neurotrophin receptors (figures 6(a), (b)).
The model can account for the following observations:
• Following a stage of hyperinnervation, the development of both single and multipleinnervation.
• The coexistence of stable states of single and multiple innervation (class III) in skeletalmuscle. Persistent multiple innervation is found in denervation experiments after

Competition in the development of nerve connections: a review of models R29
Figure 6. The implications of the coexistence of stable states of single and multiple innervation forclass III in the model by Van Ooyen and Willshaw (1999b) (section 3.3.2D). In (a), (b), removalof an axon from a multiply innervated target and subsequent replacement, for (a) class II and(b) class III (see section 3.3.2D). At t = 504 h, axon 1 (bold curve) is removed by setting α1 = 0.At t = 756 h, axon 1 is replaced by setting α1 back to its original value, with initial conditionsφ1 = 30, R1 = φ1/γ , and C1 = 0. Only for class II the replaced axon can survive. For class III,in order for the replaced axon to survive, a much higher initial value of φ1 would be required.From Van Ooyen and Willshaw (1999b). The phase–space plots of (c) and (d) illustrate how, forclass III, persistent multiple innervation can arise after recovery from nerve conduction block, ina system of two innervating axons. For explanation of nullclines and symbols, see figure 5 (forclarity, the unstable equilibria are not indicated). The basins of attraction of the equilibrium pointsare comparable with those in figure 3(a). The triangles mark the starting points of trajectories(bold curves). As shown in (c), under normal conditions—with electrically active axons that havea different level of activity (represented by α1 = 400 and α2 = 300; other parameter values asin figure 5(g)) and a low initial number of receptors (i.e. φi is low: φ1 = φ2 = 0.25)—singleinnervation develop. When activity is blocked (values of αi lower and the same: e.g. α1 = 250and α2 = 250), as in (d), the same initial conditions lead to multiple innervation. Subsequentrestoration of activity means that the nullclines are again as in (c), but now the starting values ofφi are those reached as in (d)—i.e. in the basin of attraction of the polyneuronal equilibrium point.The system goes to this equilibrium and will remain there forever, i.e. persistent polyneuronalinnervation. Another way in which persistent multiple innervation can arise following a nerveconduction block is through altering the rate of release of neurotrophin, σ , which also changes thesizes of the basins of attraction of the equilibria.
reinnervation and recovery from prolonged nerve conduction block (Barry and Ribchester(1995), see sections 2.1.6 and 3.3.1B). In terms of the model, conduction block changesthe sizes of the basins of attraction of the equilibria (via changes in the competitive strengthβi or in the rate σ of release of neurotrophin), so that the system can go to an equilibriumof multiple innervation, while under normal conditions single innervation develops. Oncethe conduction block is removed, the system will remain in the basin of attraction ofthe multiple innervation equilibrium (see figures 6(c), (d)). The dual constraint model,section 3.3.1B, offers a related explanation for persistent multiple innervation.

R30 A van Ooyen
• Increasing the amount of target-derived neurotrophin delays the development of singleinnervation (class I) (see section 2.1.5) or increases the number of surviving axons(classes II and III) (e.g. in epidermis: Albers et al (1994)).
Further, the following points should be noted:
• If the biological interpretation is that the axon’s total number of neurotrophin receptorschanges because of changes in its arborization, then this means that, during competition,a winning axon elaborates its branches and a losing axon retracts branches (as describedfor biological systems in sections 2.1.2 and 2.2.2).
• For competition to occur, it is not necessary that there is presynaptic or postsynapticactivity, or that there is activity-dependent release of neurotrophin (cf Snider and Lichtman(1996)). The axon’s competitive strength, βi , can be influenced also by other factors thanpresynaptic activity. Thus, both presynaptic and postsynaptic activity may be influentialbut are not decisive (Ribchester 1988, Costanzo et al 2000). The fact that inactivepostsynaptic cells often appear to have increased rather than decreased neurotrophinrelease (Pittman and Oppenheim 1979, Snider and Lichtman 1996) poses no problemfor the occurrence of competition in the model.
• For class III, the dependence on initial conditions means that it is difficult for innervatingaxons to displace existing axons, even if the innervating axons have a higher competitivestrength than the existing axons. This form of plasticity is required in learning, where newexperiences should be unable to overwrite the memories already laid down (Lichtmanet al 1999). When axons should occupy targets that already have innervation—as inregeneration—themodel suggest that it ismore efficient to increase the number of receptorson the regenerating axons than to increase the amount of neurotrophin (which also affectsthe existing axons).
• Decreasing the difference in competitive strengths between the different axons delays thedevelopment of single innervation or increases the number of surviving axons (the latteronly for classes II and III).
• The model can be, and is (Ribchester, personal communication), tested experimentally.The model predicts that axons that are being eliminated will have a small number ofneurotrophin receptors. The shape of the growth function—which determines what typeof innervation can develop—can be determined experimentally in vitro by measuring, fordifferent concentrations of neurotrophin, the axon’s total number of neurotrophin receptorsit has over all its synapses. In relating axon survival to neurotrophin concentration, themodel predicts, for example, that the smaller the value of Ki of the growth function, thelower the concentration of neurotrophin needed to rescue more axons.
Criticisms of the model are that (i) rather than study a number of different classes ofgrowth functions, it would be better to derive the critical properties of the growth functionresponsible for producing a particular result; (ii) in this formulation, axons have only a singletarget, whereas in the neuromuscular system, for example, each axon innervates a number oftargets, so that there will also be competition between branches of the same axon (as in thedual constraint model); and (iii) the effects of activity have not yet been studied explicitly (forexample, σ can be made dependent on postsynaptic activity).
Further analyses and extensions of the model. Van Ooyen and Willshaw (1999b) assumedthat the concentration of neurotrophin is uniform across the extracellular space, so that allaxons ‘sense’ the same concentration. This is a good assumption if all the axons are closetogether on the target structure, as, for example, at the endplate on muscle fibres, where theyare completely intermingled (Balice-Gordon et al 1993). However, if the target structure is

Competition in the development of nerve connections: a review of models R31
large (e.g. a large dendritic tree), the spatial dimension of the extracelluar space should betaken into account. Modelling local release of neurotrophin along the target and diffusion ofneurotrophin in the extracelluar space, Van Ooyen and Willshaw (2000) showed that distancebetween axons mitigates competition, so that if the axons are sufficiently far apart on thetarget, they can coexist (i.e. even under conditions—e.g. a class I growth function—wherethey cannot coexist with a uniform extracellular space). This can explain that (i) whencoexisting axons are found on mature muscle cells they are physically separated (Kufferet al 1977, Lømo 1980, Lo and Poo 1991) and (ii) a positive correlation exists betweenthe size of the dendritic tree and the number of innervating axons surviving into adulthood(Hume and Purves 1981, Purves and Hume 1981, Purves 1994). The latter is not a matter ofavailable space because in, for example, the ciliary ganglion of adult rabbits, all neurons—with no dendrites at all or with many dendrites—are initially innervated by the same numberof axons.
In another extension of the model, Van Ooyen and Willshaw (2000) considered asingle target that releases two types of neurotrophin (e.g. Barde (1989), McManaman et al(1989), Lindsay et al (1994)) and at which there are two types of innervating axons. Eachaxon type can respond to both neurotrophin types. The following two situations wereexamined. (i) Individual axons have only a single type of neurotrophin receptor, but thiscan bind to more than one type of neurotrophin. Different types of axons have differentreceptor types. (ii) Individual axons have more than one type of neurotrophin receptor,and each receptor type binds exclusively to one type of neurotrophin. Different types ofaxons have these receptor types in different proportions. The results show that, for both(i) and (ii), different types of axons can coexist (i.e. even under conditions—e.g. a class Igrowth function—where they cannot coexist with a single type of neurotrophin) if theyrespond to the neurotrophins with sufficiently different ‘affinities’. For (i), this meansthat each type of receptor should bind preferentially, but not necessarily exclusively, toone type of neurotrophin. For (ii), this means that the receptor content between differenttypes of axons should be sufficiently different. By having axons respond with differentaffinities to more than one type of neurotrophin, the model can account for competitiveexclusion among axons of one type while at the same time there is coexistence with axonsof another type innervating the same target. This occurs, for example, on Purkinje cells(Crepel 1982), where climbing fibres compete with each other during development untilonly a single one remains, which coexists with parallel fibres innervating the same Purkinjecell.
In population biology, the concept of competition is well developed (see section 1).Parallels with axonal competition would allow results from population biology to be applied toneurobiology. Van Ooyen and Willshaw (2000) showed that the equations describing axonalcompetition are of the same form as those describing consumer–resource systems (Yodzis1989). By making quasi-steady-state approximations—on the slow time scale of φi—for Ri
and Ci (i.e. dRi/dt = dCi/dt = 0), they showed that equations (28)–(30) can be rewritten as
dφidt
= φi(gi(L, φi) − λ3) (33)
dL
dt= σ − δL −
n∑i=1
φihi(L) (34)
where the function gi(L, φi) encompasses the growth function, and the function hi(L) ≡λ1L/(λ2,i +L) includes the binding kinetics of neurotrophin to receptor (all λs are constants).Note that under the quasi-steady-state approximations, φi = ρiCi +γiRi . Thus, φi is a measurefor the total number of neurotrophin receptors (unoccupied plus bound to neurotrophin) on

R32 A van Ooyen
axon i. In population biological terms, φi is the size of the population of consumer species i,L is the size of the resource population, hi(L) is the functional response of the consumer, andgi(L, φi) − λ3 is the numerical response of the consumer. For class I of the general growthfunction, gi(L, φi) = gi(L) = λ4,iL/(λ2,i + L).
Equations (33) and (34), for class I, also show the similarities with themodel by Jeanpretreet al (1996). Variable xi corresponds to φi (especially if ρi = γi), variable S is L, andS/(Kd,i + S) has a similar form as hi(L) and gi(L). One difference is that the expressionwith STi , in equation (26), varies among axons, unlike the corresponding λ3, in equation (33).Van Ooyen and Willshaw’s model also encompasses the dual constraint model (with only apostsynaptic resource): for class III, the isocline picture is qualitatively the same as that of thedual constraint model (cf figures 3(a) and 5(g)).
3.4. Interference competition: competition for space
Competition for space occurs if some essential resource can be obtained only by monopolizingsome portion of space. The resource may be space itself or may be some immobile resource.Themodel byVanEssen et al (1990) and the induced-fitmodel byRibchester andBarry (1994),both of the neuromuscular system, can be classified as incorporating a form of competition forspace; this is most explicit in the model by Van Essen et al (1990).
3.4.1. Van Essen et al (1990). Van Essen et al (1990) incorporated competition for spacetogether with the idea that the increase in size of a motor neuron terminal depends on howmuch ‘scaffold’ is incorporated in the underlying basal lamina at the endplate. The notionof a scaffold was motivated by experiments showing that the basal lamina at the endplatepersists for long periods after denervation and is recognized by regenerating axons as a site fordifferentiation of synapses (e.g. Marshall et al (1977), Sanes et al (1978)).
In the model (figure 7), each endplate is a one-dimensional structure of fixed length,consisting of a number of equally spaced positions. A terminal occupies a number of thesepositions and grows by occupying more positions, at the expense of the size of other terminals.Scaffold—an immobile structure, which does not diffuse—is formed from a precursor thatis synthesized by the muscle fibre and is continuously incorporated into the basal laminaunderneath nerve terminals, but not in vacant positions of the endplate. There is also acontinuous turnover of scaffold, which is greater in vacant positions than in innervatedpositions. In the presynaptic terminal, a scaffold-recognition signal is generated that isproportional to the scaffold concentration immediately underneath; this signal can spread overa small distance within the presynaptic terminal. The growth of each terminal is simulatedas a stochastic process, whereby the probability that a terminal will increase or decrease itssize depends on a weighted average of the scaffold-recognition signals arising within a smalldistance from each end of the terminal. The higher this average, the higher the probability ofgrowth and the smaller the probability of retraction.
Starting with polyneuronal innervation, the model showed that even after many iterations,a high percentage (20% in the reported simulation) of muscle fibres remained polyneuronallyinnervated, so it is not clear whether this model can account for single innervation. Nerveterminal elimination occurred relatively rapidly, however, if the probability of growth was alsomade proportional to the size of the terminal (positive feedback)—but in this case it seems thatthe scaffold did not play a critical role anymore.
3.4.2. Induced-fit model. By analogy with enzyme–substrate and antigen–antibody binding,Ribchester and Barry (1994) proposed a model of synaptic competition based on induction of

Competition in the development of nerve connections: a review of models R33
Scaffold
Scaffold precursor Turnover
Growth dynamics
Spread ofrecognition signal
Terminal
Endplate
(b)
Terminals
Endplate
(a)
Figure 7. The model by Van Essen et al (1990) (section 3.4.1). (a) An endplate consisting of anumber of equally spaced positions. A terminal occupies a number of these positions and growsby occupying more positions, at the expense of the size of the other terminals. (b) Signals andmechanisms involved in the growth (or retraction) of each terminal. Drawn after Van Essen et al(1990).
selective adhesion between nerve terminal and muscle endplate. The model, which was notgiven in mathematical terms, assumes the following:
(1) Nerve terminals from different axons have different isoforms of an adhesion molecule.Each endplate may express a number of different complementary isoforms.
(2) Nerve terminals induce a conformational change in the complementary adhesionmolecules in the endplate so that goodness-of-fit increases. (Instead of a conformationalchange, the endplate could be induced to increase the expression of the appropriatecomplementary isoform.)
(3) Competing nerve terminals can occupy synaptic space because there is a partial fit betweenuncomplementary isoforms.
(4) With time, a conformational change in, or expression of, a particular isoform becomesmore permanent; this could represent a form of positive reinforcement.
(5) Electrical activity in a terminal accelerates the conformational change or synthesis of theappropriate complementary isoform.
The model was used to explain that nerve conduction block delays or inhibits eliminationof polyneuronal innervation in partially denervated and reinnervated muscle (see figure 8)(Taxt (1983), Barry and Ribchester (1994, 1995); see also sections 2.1.3 and 2.1.6).
To test whether the model can indeed explain mononeuronal innervation as well as resultsfrom denervation experiments, it should be expressed in more specific, mathematical terms. Itis also not clear what molecules could be involved, but isoforms of N-CAM were suggested.However, normal elimination of synapses occurs in various transgenic animals in whichexpression of cell surface molecules, such as N-CAM, has been disrupted (Sanes et al 1998).
The induced-fit model is reminiscent of the marker induction model of the establishmentof ordered nerve connections between retina and optic tectum (Willshaw andVon derMalsburg1979). In this model, molecular markers of several different types label the retinal cells, withnearby retinal cells carrying similar collections of markers. During development, the markersare induced, through the synapses formed, onto the optic tectum. At each tectal site, themarkers from the various retinal cells that are innervating it become blended together withmarkers from neighbouring tectal sites. A positive feedback loop is set up whereby the patternof retinotectal connections is gradually refined according to the match between the patterns ofretinal and tectal markers at each synapse, leading to changes in the profile of markers across

R34 A van Ooyen
(c)
Induction
Single innervation CoexistenceSproutingRegeneration
(b)(a)
Figure 8. The induced-fit model of synaptic competition (section 3.4.2), as applied to explain thatconduction block delays or inhibits elimination of polyneuronal innervation in partially denervatedand reinnervated rat muscle. (a) The initial state of single innervation. Complementary adhesionmolecules cause a tight bond between the motor nerve terminal and the muscle fibre. (b) Afterdenervation of the muscle fibre by injuring the axon, the muscle fibre may become reinnervatedby regeneration of the damaged axon and by sprouting of intact axons. The goodness-of-fit ofthe regenerating axon depends on how long the new sprout from the intact axon had had time torespecify the isoforms (induction) on the endplate, and also on howactive the sprout had been. Thus,under conduction block—which is assumed to slow down the induction process—a regenerationaxon can be maintained for longer, so that multiple innervation (c) will persist for longer. Drawnafter Ribchester and Barry (1994).
the tectum, and then to further changes in the pattern of connections, and so on. By this means,an initially disordered pattern of retinotectal connections is gradually refined into an orderedmap of retina onto tectum, at which point the retinal marker profiles have become replicatedacross the tectum.
3.5. Interference competition: direct negative interactions
In the following models, all of which describe the neuromuscular system, interferencecompetition involves direct negative interactions: nerve terminals are destroyed ordisconnected by the punitive effects of other axons (this idea is the least explicit in the modelby Liu et al (1994a), section 3.5.2). In addition to interference, two models incorporate apresynaptic constraint. In the model byWillshaw (1981), the total synaptic strength supportedby each motor neuron is kept constant (i.e. synaptic normalization as in section 3.1, but nowof the total strength of the output connections). In the model by Barber and Lichtman (1999),the total amount of presynaptic resource is kept constant (as in the dual constraint model,section 3.3.1B). Except in the model by Willshaw (1981), electrical activity plays a decisiverole in all models.
3.5.1. Willshaw (1981). This is the first formal model of the elimination of polyneuronalinnervation in the neuromuscular system. Based on a proposal by O’Brien et al (1978),Willshaw (1981) assumed that each axon terminal injects into its endplate a degrading signalthat reduces the ‘survival strength’ of all the terminals (including itself) at that endplate. Thesize of a terminal is thought to be proportional to its survival strength. In particular, the modelassumes that:
(1) Each terminal has a survival strength SIJ for the contact between axon I and fibre J .(2) Each terminal injects into its endplate a degrading signal at a rate proportional to its own
survival strength. The total rate of release into fibre J is thus proportional to the sum∑i SiJ of the survival strengths of the fJ terminals there. This total signal reduces the
survival strengths of all the terminals there, all being affected equally. The rate at whicheach terminal on fibre J is degraded is proportional to the mean strengthMJ = 1
fJ
∑i SiJ .
Competition in the development of nerve connections: a review of models R35
(3) The survival strength of each terminal increases at a rate proportional to that strength(positive feedback).
(4) The total amount of survival strength supported by each motor neuron is kept constant.Thus, for each I ,
∑′j SIj = constant, where
∑′j denotes a sum over all fibres contacted
by the axon in question.
From assumptions (2) and (3) it follows that
dSIJdt
= −αMJ + βSIJ (35)
where α and β are rate constants. From assumption (4) it follows that′∑j
dSIjdt
=′∑j
(−αMj + βSIj ) = 0. (36)
Equation (36) gives an expression for β, which can be substituted in equation (35), yielding
dSIJdt
= α
( ′∑j
Mj
)(SIJ∑′j SIj
− MJ∑′j Mj
). (37)
The model can account for the elimination of polyneuronal innervation, whatever theinitial distribution of survival strengths. At each endplate, the terminal whose survival strengthrepresents the largest fraction of the total strength available to its motor neuron is likely tosurvive. Fromequation (37), it can be seen thatwhenpolyneuronal innervation is eliminated, nofurther change in survival strengths will occur: no polyneuronal innervation meansMJ = SIJfor all innervated fibres, and MJ/
∑′j Mj becomes equal to the first term within the brackets,
so that dSIJ /dt becomes zero. In addition to accounting for the elimination of polyneuronalinnervation, the model accounts for (i) the decrease in spread of motor unit size duringthe elimination of polyneuronal innervation (e.g. Brown et al (1976)); (ii) the competitiveadvantage of the terminals of smaller motor units over those of larger ones (Brown et al1976, Brown and Ironton 1978); and (iii) the increase in motor unit size after neonatal partialdenervation (Thompson and Jansen 1977, Fladby and Jansen 1987). To be able to accountfor the above phenomena, it is essential that the total amount of survival strength availableto each motor neuron is kept constant. This assumption is also essential for the eliminationof polyneuronal innervation: without it, elimination proceeds until the terminal that initiallyhas the largest survival strength remains, so that some neurons might lose all their initial axonterminals.
Criticisms of the model are that (i) the positive feedback (assumption (3)) is postulatedand not accounted for biologically; (ii) it uses synaptic normalization of output connections(assumption (4)), which implies that not all fibres will show an increase in their total inputsurvival strength during development (see section 2.1.2); (iii) in obtaining the degrading signal(see assumption (2)), which is divided by the number of terminals present at an endplate, amathematical discontinuity is introduced when a terminal withdraws (see also Gouze et al(1983)); and (iv) the effects of electrical activity are not considered.
3.5.2. Liu et al (1994a). In this model, which was not given in mathematical terms, axonsvie to escape the punitive effects of a target-derived toxic factor, which may be a proteasethat disconnects nerve terminals. This idea is supported by observations that several proteaseinhibitors can partly prevent synapse elimination at the neuromuscular junction (Connoldet al 1986, Vrbova and Fisher 1989, Liu et al 1994b). The model was applied to both theneuromuscular and the visual system (Liu et al 1994a).

R36 A van Ooyen
In the model, an electrically activated postsynaptic cell releases proteases globally,resulting in a strength reduction of all its inputs. Presynaptic activity, in contrast, causeslocal release of protease inhibitor, which offers protection to the protease; thus, the survivingaxons will be the ones that are active most often. There is no positive feedback loop, andhow the model can generate single innervation is not clear. It is possible that proteasescould also mediate direct negative interactions between axons (Sanes and Lichtman 1999);however, the model would then become very similar to the model described in the nextsection.
3.5.3. Nguyen and Lichtman (1996). Also not given in mathematical terms, this model,as well as the one in section 3.5.4, has many similarities with Willshaw’s (1981) model(section 3.5.1), except that there is an explicit role for electrical activity. Interference isincorporated by punishment and protection signals (whose identities are not further specified),and more active synapses prosper by punishing their less active neighbours. The model (seealso Balice-Gordon and Lichtman (1994), Jennings (1994)) is based on observations that levelsof AChRs—the postsynaptic receptors for acetylcholine, the neurotransmitter in motor neuronterminals—begin to decline before the overlying nerve terminal withdraws (Balice-Gordonand Lichtman (1993), Culican et al (1998); see also section 2.1.6). In the model (figure 9), adecrease in AChRs instigates the removal of the overlying nerve terminal. By activating itsunderlying AChRs, each active synapse generates two postsynaptic signals: (i) a punishmentsignal that spreads over short distances and eliminates AChRs of neighbouring synaptic sites;and (ii) a more locally confined protection signal that neutralizes the punishment signal. Thestrength of both signals is proportional to the level of activity; at inactive sites, no signalsare generated. Thus, when postsynaptic sites at the same endplate have a different level ofactivity, the less active ones will generate a weaker protection signal (and a weaker punishmentsignal) than the more active ones, so that the less active ones lose more AChRs. The lossof AChRs further reduces local postsynaptic activity, leading to an even weaker protectionsignal, more loss of AChRs, and eventually the removal of the overlying nerve terminal. Sucha positive feedback loop can bring about the removal of all nerve terminals but the most activeone. When the postsynaptic sites are equally active, they generate equally strong punishmentsignals, but also equally strong protection signals, so that all nerve terminals are maintained.All terminals are maintained also when all the postsynaptic sites are inactive, because thenneither the punishment signal nor the protection signal is generated. Thus, elimination requiresthe presence of active neighbouring sites.
The model can explain the following observations. (i) When the AChRs of a portion ofan endplate are blocked, the blocked AChRs and their directly overlying nerve terminals areeliminated only when a substantial portion remains unblocked (Balice-Gordon and Lichtman1994). (ii) AChRs are lost from denervated portions of incompletely reoccupied endplatesfollowing reinnervation (Stanco and Werle 1997), whereas AChRs at completely denervatedendplates are relatively stable (Moss and Schuetze 1987).
A criticism of this model is that it relies heavily on electrical activity whilerecent experimental results suggest that activity might not play such a decisive role(section 2.1.6). AChRs, too, are unlikely to play a pivotal role: synapse formation andelimination occur normally in mutant zebrafish lacking nicotinic AChRs (Liu and Westerfield1990).
3.5.4. Barber and Lichtman (1999). Barber and Lichtman (1999) put the ideas of Nguyenand Lichtman (1996) (section 3.5.3) into mathematical terms. However, the punishment and

Competition in the development of nerve connections: a review of models R37
Postsynapticreceptors
receptorsLoss of
Removal of
Protection
terminal
Inactive terminalActive terminal
Punishment signal
signal
Figure 9. The model by Nguyen and Lichtman (1996) (section 3.5.3). The punishment signal,generated by the active terminal, causes selective loss of receptors beneath the inactive terminal—which lacks a protection signal—leading to its subsequent removal. Drawn after Nguyen andLichtman (1996).
protection signals are not explicitly modelled, and there is the extra element of keeping thetotal amount of presynaptic resource constant (as in the dual constraint model, section 3.3.1B).The main aim of the model was to reconcile two paradoxical results regarding the role ofactivity: (i) the more active neurons maintain the smallest motor units—i.e. the size principle(Henneman 1957, 1985, Callaway et al 1987, 1989); and (ii) activity drives competition atindividual endplates (Balice-Gordon and Lichtman 1994, Ribchester and Taxt 1983). Themodel was developed from the following assumptions:
R38 A van Ooyen
(1) The ability of an axon to eliminate competing axons is proportional to the amount ofneurotransmitter it releases; this amount is proportional to the axon’s total synaptic area(i.e. terminal size) at the endplate and to its activity (mean firing rate).
(2) Axons are only able to compete effectively during asynchronous activity.(3) The total amount of presynaptic resource in each motor neuron is kept constant; this
constrains the amount of neurotransmitter available for release and the total synaptic areathe neuron can support.
(4) The amount of presynaptic resource in each neuron is divided among all its connections,with large synaptic areas receiving a greater share.
(5) Large synaptic areas are disproportionally less taxing on the resources of the neuron.
Each synaptic area, Amn for the area that neuron n makes on muscle fibre m, is thussubjected to two effects: (i) loss of synaptic area, in amount Emn, through competition; and(ii) gain or loss of synaptic area, in amount Umn, through utilization of neuronal resources.Thus,
dAmn
dt= −αEmn + βUmn (38)
where α and β are rate constants.From assumptions (1) and (2),
Emn =∑i =n
fiAmi(1 − τ 2fnfi) (39)
where fi and fn are the firing rates of neuron i and n, respectively; the neurons areasynchronously active during a fraction (1 − τ 2fnfi) of the time, where τ is a constant.From assumption (3), the conservation equation for the total amountR of presynaptic resourceis
R = Ra,n + fn∑j
Aγ
jn (40)
whereRa,n is the amount of free resource left in motor neuron n and γ < 1 represents that largesynaptic areas are disproportionally less taxing on the resources of the neuron (assumption (5)).Fromassumption (4), the amount of free resource is divided amongall the neuron’s connections,so that
Umn = Ra,nAmn∑j Ajn
=(R − fn
∑j
Aγ
jn
)Amn∑j Ajn
. (41)
In addition to accounting for the elimination of polyneuronal innervation, the model isable to reproduce the size principle, because the presynaptic resource is more utilized withincreased activity of the neuron. A competitive advantage of higher frequency axons early indevelopment is overcome at later stages by greater synaptic efficacy of axons firing at a lowerrate. In the model, early competition is dominated by active axons that battle against otheractive axons, whereas later on the main changes in connectivity are dominated by relativelyinactive axons that battle other inactive axons. The way the size principle is generated in thismodel has similarities to theway it is generated in themodel by Stollberg (1995) (section 3.1.1),as themodel by Barber and Lichtman (1999) can also be viewed as being driven by correlationsin presynaptic and postsynaptic activity.
In addition to the criticisms given for the previous model (section 3.5.3), which are alsovalid here, assumptions (2) and (5) do not have strong experimental support.

Competition in the development of nerve connections: a review of models R39
4. Discussion
Models of competition in the development of nerve connections, both in the neuromuscularand in the visual system, have been reviewed. The models differ with respect to:
(1) The type of competition. This can be none (enforcing competition), consumptivecompetition, or interference competition (competition for space, direct negativeinteractions). In some instances, depending on the objectives of the model, it might besufficient to enforce competition rather than tomodel the putative underlyingmechanisms.But if the objective is to understand competition and to relate to experiments, thenmodelling underlying mechanisms is important. However, even if the main objectiveis to understand not competition per se but a process in which it is involved (for example,the formation of ocular dominance columns and topographic maps), the specific wayin which competition is modelled could make a difference. Considering that alreadythe way in which the normalization constraint is enforced makes a difference as towhen ocular dominance columns can develop (see section 3.1), differences might alsobe expected if underlying mechanisms are explicitly modelled. For example, Harris et al(1997) and Elliott and Shadbolt (1998b) showed that models implementing the putativeunderlyingmechanisms of activity-dependent competition permits the formation of oculardominance columns in the presence of positively correlated interocular images. Oculardominance columns do not occur under these conditions when competition is enforcedusing multiplicative normalization.Further experimental studies are necessary to find out what type(s) of competition is(are) involved in the formation of nerve connections. Recent findings (see sections 2.1.5and 2.2.3), both in the neuromuscular and in the visual system, have supported a role forneurotrophic factors (in consumptive competition). More types of competition may beinvolved at the same time, e.g. consumptive competition plus direct negative interactions(see section 2.1.5).
(2) The specific underlying mechanisms. The role of electrical activity and the mechanismsthat create the positive feedback loop differ between models.In both the neuromuscular and the visual system, electrical activity may be just oneof the influences in competition—competition can occur without pre- and postsynapticelectrical activity, see section 2—while the actual competition is driven by other factors,e.g. neurotrophic factors and their receptors. However, in many of the reviewed models(but not all, e.g. Willshaw (1981), Jeanpretre et al (1996), Van Ooyen and Willshaw(1999b)), electrical activity plays a decisive role.Mostmodels proposed for the development of neuromuscular connections can produce thechange from polyneuronally to mononeuronally innervated muscle fibres, but the extentto which the positive feedback loop—the most essential part of the models, enabling oneof the axons to outcompete the others—is biologically justified varies between models.In addition to elimination of polyneural innervation, a model has to account for the sizeprinciple, the reduction of motor unit sizes, the effects of electrical activity, and theoccurrence of stable polyneuronal innervation under some circumstances. Models differas to their ability to account for all these observations (or have not yet considered them).Similarly, in models proposed for the development of ocular dominance columns, thebiological justification of the positive feedback loop differs between models.
(3) The modelling approach. Even if the same type of competition is modelled, the modellingapproach may differ. For example, consumptive competition can be implemented in afixed or a variable resource model (see section 3.3). Although under some conditionsboth types of models can be expressed in terms of the other, a variable resource model
R40 A van Ooyen
has the advantage that its variables and parameters are better interpretable in terms of theunderlying biology (e.g. release, degradation, and binding of neurotrophin; insertion andturnover of receptor). This makes it also more straightforward to extend these models,e.g. explicit modelling of the extracellular space and diffusion.
Models can improve our intuitive ideas about competition. For example, the widely heldbelief that competition is a consequence of resources being produced in limited amounts is toosimplistic. For instance, in themodel by Jeanpretre et al (1996) and in themodel byVanOoyenand Willshaw (1999b) for class I of the growth function (i.e. axonal vigour is unbounded), thenumber of surviving axons cannot be increased by increasing the amount of neurotrophin:the higher amount of neurotrophin becomes again limiting by the resulting increase in axonalvigour of the winning axon. Examination of models have also shown that activity-dependentrelease of neurotrophin and presynaptic activity are not necessary for competition to occur,although activity can be influential (see sections 2.1.6 and 2.2.4). In experiments testing therole of electrical activity, it is important to know exactly how activity has been changed:postsynaptic activity (and whether inactive postsynaptic cells have increased or decreasedrelease of neurotrophin—see Snider and Lichtman (1996), and section 3.3.2D: results of themodel), the absolute level of presynaptic activity, and the relative difference in activity betweeninnervating axons.
Challenges for further modelling studies, of both the neuromuscular and the visual system,include (i) modelling the role of electrical activity in competition (pre- and postsynaptic; andaccounting for the observation that activity is influential butmaybenot decisive); (ii) combiningphysiological plasticity (changes in synaptic strength) with anatomical plasticity (changes inaxonal arborization) (see alsoHarris et al (2000)); (iii) combining different types of competition(e.g. consumptive competition plus direct negative interactions), and (iv) studying whetherexplicitly modelling the putative underlying mechanisms of competition makes a difference inmodels in which competition is involved.
Acknowledgments
The author thanks David Willshaw and Richard Ribchester for critical reading of themanuscript.
References
Albers K M, Wright D E and Davies B M 1994 Overexpression of nerve growth factor in epidermis of transgenicmice causes hypertrophy of the peripheral nervous system J. Neuroscience 14 1422–32
Axelrod D, Ravdin P, Koppel D E, Schlessinger J, Webb W W, Elson E L and Podleski T R 1976 Lateral motion offluorescently labelled acetylcholine receptors in membranes of developing muscle fibers Proc. Natl Acad. Sci.USA 73 4594–8
Bailey C H and Kandel E R 1993 Structural changes accompanying memory storage Annu. Rev. Physiol. 55 397–426Balice-Gordon R J, Chua C K, Nelson C C and Lichtman J W 1993 Gradual loss of synaptic cartels precedes axon
withdrawal at developing neuromuscular junctions Neuron 11 801–15Balice-Gordon R J and Lichtman JW 1993 In vivo observations of pre- and postsynaptic changes during the transition
from multiple to single innervation at developing neuromuscular junctions J. Neurosci. 13 834–55——1994 Long-term synapse loss induced by focal blockade of postsynaptic receptors Nature 372 519–24Balice-Gordon R J and Thompson W J 1988 Synaptic rearrangements and alterations in motor unit properties in
neonatal rat extensor digitorum longus muscle J. Physiol. 398 191–210Barber M J and Lichtman JW 1999 Activity-driven synapse elimination leads paradoxically to domination by inactive
neurons J. Neurosci. 19 9975–85Barde Y A 1989 Trophic factors and neuronal survival Neuron 2 1525–34

Competition in the development of nerve connections: a review of models R41
Barry J A and Ribchester R R 1994 Effects of recovery from nerve conduction block on elimination of polyneuronalinnervation in partially denervated and reinnervated rat muscle J. Physiol. 476 62–3
——1995 Persistent polyneuronal innervation in partially denervated rat muscle after reinnervation and recovery fromprolonged nerve conduction block J. Neurosci. 15 6327–39
Bennett M R and Ho S 1988 The formation of topographical maps in developing rat gastrocnemius muscle duringsynapse elimination J. Physiol. (Lond.) 396 471–96
Bennett M R and Robinson J 1989 Growth and elimination of nerve terminals at synaptic sites during polyneuronalinnervation of muscle cells: atrophic hypothesis Proc. R. Soc. B 235 299–320
BetzW J, Caldwell J H and Ribchester R R 1979 The size of motor units during postnatal development of rat lumbricalmuscle J. Physiol. 297 463–78
Bienenstock E L, Cooper L N and Munro P W 1982 Theory for the development of neuron selectivity: orientationspecificity and binocular interaction in visual cortex J. Neurosci. 2 32–48
Birren S J, Verdi J M and Anderson D J 1992 Membrane depolarization induces p140trk and NGF responsiveness, butnot p75LNGFR MAH cell Science 257 395–7
Blochl A and Thoenen H 1995 Characterization of nerve growth factor (NGF) release from hippocampal neurons:evidence for a constitutive and an unconventional sodium-dependent regulated pathway Eur. J. Neurosci. 71220–8
Blondet B, Duxon M J, Harris A J, Melki J, Guenet J L, Pinconraymond M and Rieger F 1989 Nerve and muscledevelopment in paralysed mutant mice Dev. Biol. 132 153–66
BothwellM 1995 Functional interactions of neurotrophins and neurotrophin receptorsAnnu. Rev. Neurosci. 18 223–53Brown M C and Booth C M 1983 Postnatal development of the adult pattern of motor axon distribution in rat muscle
Nature 304 741–2Brown M C, Holland R L and Hopkins W G 1981 Motor nerve sprouting Annu. Rev. Neurosci. 4 17–21Brown M C, Hopkins W G and Keynes R J 1982 Short- and long-term effects of paralysis on the motor innervation
of two different neonatal mouse muscles J. Physiol. 329 439–50Brown M C and Ironton M R 1978 Sprouting and regression of neuromuscular synapses in partially denervated
mammalian muscles J. Physiol. (Lond.) 278 325–48Brown M C, Jansen J K S and Van Essen D 1976 Polyneuronal innervation of skeletal muscle in newborn rats and its
elimination during maturation J. Physiol. (Lond.) 261 387–422Cabelli R J, Hohn A and Shatz C J 1995 Inhibition of ocular dominance column formation by infusion of NT-4/5 or
BDNF Science 267 1662–6Cabelli R J, Shelton D L, Segal R A and Shatz C J 1997 Blockade of endogenous ligands of TrkB inhibits formation
of ocular dominance columns Neuron 19 63–76Callaway E M, Soha J M and Van Essen D C 1987 Competition favouring inactive over active motor neurons during
synapse elimination Nature 328 422–6——1989 Differential loss of neuromuscular connections according to activity level and spinal position of neonatal
rabbit soleus motor neurons J. Neurosci. 9 1806–24Callaway E M and Van Essen D C 1989 Slowing of synapse elimination by alpha-bungarotoxin superfusion of the
neonatal rabbit soleus muscle Dev. Biol. 131 356–65Campenot R B 1982a Development of sympathetic neurons in compartmentalized cultures. I. Local control of neurite
outgrowth by nerve growth factor Dev. Biol. 93 1–12——1982b Development of sympathetic neurons in compartmentalized cultures. II. Local control of neurite survival
by nerve growth factor Dev. Biol. 93 13–22Carmignoto G G, Canella R, Candeo P, Comelli M C and Maffei L 1993 Effects of nerve growth factor on neuronal
plasticity of the kitten visual cortex J. Physiol. 464 343–60Causing CG, Gloster A, Aloyz R, Bamji S X, Chang E, Fawcett J, Kuchel G andMiller F D 1997 Synaptic innervation
density is regulated by neuron-derived BDNF Neuron 18 257–67Cohen-Cory S and Fraser S E 1995 Effects of brain-derived neurotrophic factor on optic axon branching and
remodelling in in vivo Nature 378 192–6Colman H and Lichtman J W 1992 ‘Cartellian’ competition at the neuromuscular junction Trends Neurosci. 15 197–9Connold A L, Evers J V and Vrbova G 1986 Effect of low calcium and protease inhibitors on synapse elimination
during postnatal development in the rat soleus muscle Dev. Brain Res. 28 99–107Costanzo E M, Barry J A and Ribchester R R 2000 Competition at silent synapses in reinnervated skeletal muscle
Nature Neurosci. 3 694–700Crepel F 1982 Regression of functional synapses in the immature mammalian cerebellum Trends Neurosci. 5 266–9Crowley J C and Katz L C 1999 Development of ocular dominance columns in the absence of retinal input Nature
Neurosci. 2 1125–30——2000 Early development of ocular dominance columns Science 290 1321–4
R42 A van Ooyen
Culican S M, Nelson C C and Lichtman J W 1998 Axon withdrawal during synapse elimination at the neuromuscularjunction is accompanied by disassembly of the postsynaptic specialization and withdrawal of Schwann cellprocesses J. Neurosci. 18 4953–65
DeSantis M, Berger P K, Laskowski M B and Norton A S 1992 Regeneration by sekeletomotor axons in neonatal ratsis topographically selective at an early stage of reinnervation Exp. Neurol. 116 229–39
Diamond J, Holmes M and Coughlin M 1992 Endogenous NGF and nerve impulses regulate the collateral sproutingof sensory axons in the skin of the adult rat J. Neurosci. 12 1454–66
Domenici L, CellerinoA andMaffei L 1993Monocular deprivation effects in the rat visual cortex and lateral geniculatenucleus are prevented by nerve growth factor (NGF). II. Lateral geniculate nucleus Proc. R. Soc. B 251 25–31
Donoghue J P 1995 Plasticity of adult sensorimotor representations Curr. Opin. Neurobiol. 5 749–54Duxson M J 1982 The effect of post-synaptic nerve block on development of the neuromuscular junction in postnatal
rats J. Neurocytol. 11 395–408Edwards R H, Rutter W J and Hanahan D 1989 Directed expression of NGF to pancreatic β cells in transgenic mice
leads to selective hyperinnervation of the islets Cell 58 161–70Elliott T, Howarth C I and Shadbolt N R 1996a Neural competition and statistical mechanics Proc. R. Soc. B 263
601–6——1996b Axonal processes and neural plasticity. I: ocular dominance columns Cereb. Cortex 6 781–8——1996c Axonal processes and neural plasticity. II: adult somatosensory maps Cereb. Cortex 6 789–93——1997 Axonal processes and neural plasticity. III: competition for dendrites Phil. Trans. R. Soc. B 352 1975–83——1998 Axonal processes and neural plasticity: a reply Neural Comput. 10 549–54Elliott T and Shadbolt N R 1996 A mathematical model of activity-dependent, anatomical segregation induced by
competition for neurotrophic support Biol. Cybern. 75 463–70——1998a Competition for neurotrophic factors: mathematical analysis Neural Comput. 10 1939–81——1998b Competition for neurotrophic factors: ocular dominance columns J. Neurosci. 18 5850–8——1999 A neurotrophic model of the development of the retinogeniculocortical pathway induced by spontaneous
retinal waves J. Neurosci. 19 7951–70English A W and Schwartz 1995 Both basic fibroblast growth factor and ciliary neurotrophic factor promote the
retention of polyneuronal innervation of developing skeletal muscle fibers Dev. Biol. 169 57–64Farinas I, Jones K R, Backus C, Wang X-Y and Reichardt L F 1994 Severe sensory and sympathetic deficits in mice
lacking neurotrophin-3 Nature 369 658–61Fawcett J W and Willshaw D J 1982 Compound eyes project stripes onto the optic tectum Nature 296 350–2Fladby T and Jansen J K S 1987 Postnatal loss of synaptic terminals in the partially denervated mouse soleus muscle
Acta Physiol. Scand. 129 239–46Funakoshi H, Belluardo N, Arenas E, Yamamoto Y, Casabona A, Persson H and Ibanez C F 1995 Muscle-derived
neurotrophin-4 as an activity-dependent trophic signal for adult motor neurons Science 268 1495–9Garofalo L, Ribeiro-da-Silva A and Cuello C 1992 Nerve growth factor-induced synaptogenesis and hypertrophy of
cortical cholinergic terminals Proc. Natl Acad. Sci. USA 89 2639–43Gilbert C D 1992 Horizontal integration and cortical dynamics Neuron 9 1–13Goodhill G J 1993 Topography and ocular dominance: a model exploring positive correlations Biol. Cybern. 69
109–18Goodhill G J and Barrow H G 1994 The role of weight normalization in competitive learning Neural Comput. 6
255–69Goodhill G J and Richards L J 1999 Retinotectal maps: molecules, models and misplaced data Trends Neurosci. 22
529–34Gordon D C and Richmond F J R 1990 Topography in the phrenic motoneuron nucleus demonstrated by retrograde
multiple-labelling techniques J. Comput. Neurol. 292 424–34Gouze J-L, Lasry J-M and Changeux J-P 1983 Selective stabilization of muscle innervation during development: a
mathematical model Biol. Cybern. 46 207–15Grinnell A D 1995 Dynamics of nerve-muscle interaction in developing and mature neuromuscular junctions Physiol.
Rev. 75 789–834Grover J P 1997 Resource Competition (London: Chapman and Hall)Guillery R W 1988 Competition in the development of the visual pathways The Making of the Nervous System ed
J G Parnavelas, C D Stern and R V Stirling (Oxford: Oxford University Press) pp 356–79Hantai D, Rao J S and Festoff B W 1988 Serine proteases and serpins: their possible roles in the motor system Rev.
Neurol. (Paris) 144 680–7Harris A E, Ermentrout G B and Small S L 1997 A model of ocular dominance column development by competition
for trophic factor Proc. Natl Acad. Sci. USA 94 9944–9——2000 A model of ocular dominance column development by competition for trophic factor: effects of excess

Competition in the development of nerve connections: a review of models R43
trophic factor with monocular deprivation and effects of anatagonist of trophic factor J. Comput. Neurosci. 8227–50
Hata Y, Katsuyama N, Fukuda M, Ohshima M, Tsumoto T and Hatanaka H 1996 Brain-derived neurotrophic factordisrupts effects of monocular deprivation in kitten visual cortex Society for Neuroscience Abstracts (Washington,DC: Society for Neuroscience)
Henneman E 1957 Relation between size of neurons and their susceptibility to discharge Science 126 1345–7——1985 The size-principle: a deterministic output emerges from a set of probabilistic connections J. Exp. Biol. 115
105–12Holtzman DM, Li Y, Parada L F, Kinsman S, Chen C-K, Valletta J S, Zhou J, Long J B andMobleyWC 1992 p140trk
mRNAmarks NGF-responsive forebrain neurons: evidence that trk gene expression is induced by NGF Neuron9 465–78
Horton J C and Hocking D R 1996 An adult-like pattern of ocular dominance columns in striate cortex of newbornmonkeys prior to visual experience J. Neurosci. 16 1791–807
Hubel D H, Wiesel T N and LeVay S 1977 Plasticity of ocular dominance columns in the monkey striate cortex Phil.Trans. R. Soc. B 278 377–409
Hume R I and Purves D 1981 Geometry of neonatal neurones and the regulation of synapse elimination Nature 293469–71
Jansen J K S and Fladby T 1990 The perinatal reorganization of the innervation of skeletal muscle in mammals Prog.Neurobiol. 34 39–90
Jeanpretre N, Clarke P G H and Gabriel J-P 1996 Competitive exclusion between axons dependent on a single trophicsubstance: a mathematical analysis Math. Biosci. 133 23–54
Jennings C 1994 Death of a synapse Nature 372 498–9Jordan C L 1996 Ciliary neurotrophic factor may act in target musculature to regulate developmental synapse
elimination Dev. Neurosci. 18 185–98Joseph S R H, Steuber V and Willshaw D J 1997 The dual role of calcium in synaptic plasticity of the motor endplate
Computational Neuroscience: Trends in Research 97 ed J Bower (New York: Plenum) pp 7–12Joseph S R H and Willshaw D J 1996 The role of activity in synaptic competition at the neuromuscular junction Adv.
Neural Inform. Process. Syst. 8 96–102Kaplan J L and Yorke J A 1977 Competitive exclusion and nonequilibrium coexistence Am. Nat. 111 1030–136Kater S B,MattsonMP, Cohan C and Connor J 1988 Calcium regulation of the neuronal growth cone Trends Neurosci.
11 315–21Keddy P 1989 Competition (London: Chapman and Hall)Kerszberg M and Changeux J-P 1993 A model for motor endplate morphogenesis: diffusible morphogens,
transmembrane signaling, and compartmentalized gene expression Neural Comput. 5 341–58Kohli R and Clarke PGH 1997Mathematical analysis of competition between sensory ganglion cells for nerve growth
factor in the skin Artificial Neural Networks—ICANN’97 edWGerstner, A Germond, M Hasler and J-D Nicoud(Berlin: Springer) pp 133–8
Kohonen T 1982 Self-organized formation of topologically correct feature maps Biol. Cybern. 43 59–99Korte M, Carroll P, Wolf E, Brem G, Thoenen H and Bonhoeffer T 1995 Proc. Natl Acad. Sci. USA 92 8856–60Kuffer D, Thompson W and Jansen J K S 1977 The elimination of synapses in multiply-innervated skeletal muscle
fibres of the rat: dependence on distance between end-plates Brain Res. 138 353–8Kwon Y W, Abbondanzo S J, Stewart C L and Gurney M E 1995 Leukemia inhibitory factor influences the timing of
programmed synapse withdrawal from neonatal muscles J. Neurobiol. 28 35–50KwonYWandGurneyME1996Brain-derived neurotrophic factor transiently stabilizes silent synapses on developing
neuromuscular junctions J. Neurobiol. 29 503–16Laskowski M B, Colman H, Nelson C and Lichtman J W 1998 Synaptic competition during the reformation of a
neuromuscular map J. Neurosci. 18 7328–35Laskowski M B and Sanes J R 1988 Topographically selective reinnervation of adult mammalian skeletal muscles J.
Neurosci. 8 3094–9LeVay S, Wiesel T N and Hubel D H 1980 The development of ocular dominance columns in normal and visually
deprived monkeys J. Comput. Neurol. 191 1–51Lewin G R and Barde Y-A 1996 Physiology of the neurotrophins Annu. Rev. Neurosci. 19 289–317Lichtman J W 1977 The reorganization of synaptic connexions in the rat submandibular ganglion during post-natal
development J. Physiol. (Lond.) 273 155–77Lichtman J W, Burden S J, Culican S M and Wong R O L 1999 Synapse formation and elimination Fundamental
Neuroscience ed M J Zigmond, F E Bloom, S C Landis, J L Roberts and L R Squire (San Diego: Academic)pp 547–80
Lichtman J W, Wilkinson R S and Rich M D 1985 Multiple innervation of tonic endplates revealed by activity-

R44 A van Ooyen
dependent uptake of fluorescent probes Nature 314 357–9Lindsay R M, Wiegand S J, Altar C A and DiStefano P S 1994 Neurotrophic factors: from molecule to man Trends
Neurosci. 17 182–9Liu DWC andWesterfield M 1990 The formation of terminal fields in the absence of competitive interactions among
primary motoneurons in the zebrafish J. Neurosci. 10 3946–59Liu Y, Fields R D, Fitzgerald S, Festoff B W and Nelson P G 1994a Proteolytic activity, synapse elimination, and the
Hebb synapse J. Neurobiol. 25 325–35Liu Y, Fields R D, Festoff B W and Nelson P G 1994b Proteolytic action of thrombin is required for electrical
activity-dependent synapse reduction Proc. Natl Acad. Sci. USA 91 10 300–4Lohof A M, Delhaye-Bouchaud N and Mariani J 1996 Synapse elimination in the central nervous system: functional
significance and cellular mechanisms Rev. Neurosci. 7 85–101LoY-J and PooM-M1991Activity-dependent synaptic competition in vitro: heterosynaptic suppression of developing
synapses Science 254 1019–22Lømo T 1980 What controls the development of neuromuscular junctions? Trends Neurosci. 3 126–9Ma Y T, Hsieh T, Forbes M E, Johnson J E and Frost D O 1998 BDNF injected into the superior colliculus reduces
developmental retinal ganglion cell death J. Neurosci. 18 2097–107MacArthur R H 1970 Species packing and competitive equilibrium for many species Theor. Popul. Biol. 1 1–11Magchielse T and Meeter E 1986 The effect of neuronal activity on the competitive elimination of neuromuscular
junctions in tissue culture Dev. Brain Res. 25 211–20Marshall L M, Sanes J R and McMahan U J 1977 Reinnervation of original synaptic sites on muscle fiber basement
membrane after disruption of the muscle cells Proc. Natl Acad. Sci. USA 74 3073McArdle J J 1975 Complex endplate potentials at regenerating neuromuscular junction of the rat Exp. Neurol. 49
629–38McManaman J L, Crawford F, Clark R, Richker J and Fuller F 1989 Multiple neurotrophic factors from skeletal
muscle: demonstration of effects of bFGF and comparisons with the 22-kdalton CAT development factor J.Neurochem. 53 1763–71
May RM 1974 Stability and Complexity in Model Ecosystems. (Monographs in Population Biology vol 6) (Princeton,NY: Princeton University Press)
Miller K D 1996 Synaptic economics: competition and cooperation in correlation-based synaptic competition Neuron17 371–4
——1998 Equivalence of a sprouting-and-retraction model and correlation-based plasticity models of neuraldevelopment Neural Comput. 10 529–47
Miller KD, Keller J B and StrykerM P 1989 Ocular dominance column development: analysis and simulation Science245 605–15
Miller K D and MacKay D J C 1994 The role of constraints in Hebbian learning Neural Comput. 6 100–26Miller K D and Stryker M P 1990 The development of ocular dominance columns: mechanisms and models
Connectionist Modelling and Brain Function: The Developing Interface ed S J Hanson and C R Olson(Cambridge, MA: MIT Press) pp 255–305
Moser M B 1999 Making more synapses: a way to store information? Cell. Mol. Life Sci. 55 593–600Moss B L and Schuetze S M 1987 Development of rat soleus endplate membrane following denervation at birth J.
Neurobiol. 18 101–18Nelson P G, Fields R D, Yu C and Liu Y 1993 Synapse elimination from the mouse neuromuscular junction in vitro:
a non-Hebbian activity-dependent process J. Neurobiol. 24 1517–30Nguyen Q T and Lichtman J W 1996 Mechanism of synapse disassembly at the developing neuromuscular junction
Curr. Opin. Neurobiol. 6 104–12Nguyen Q T, Parsadanian A S, Snider W D and Lichtman J W 1998 Hyperinnervation of neuromuscular junctions
caused by GDNF overexpression in muscle Science 279 1725–9O’Brien R A D, Ostberg A J C and Vrbova G 1978 Observations on the elimination of polyneuronal innervation in
developing mammalian skeletal muscles J. Physiol. (Lond.) 282 571–82Oppenheim RW 1989 The neurotrophic theory and naturally occurring motoneuron death Trends Neurosci. 12 252–5——1991 Cell death during development of the nervous system Annu. Rev. Neurosci. 14 453–501——1996 The concept of uptake and retrograde transport of neurotrophic molecules during development: history and
present status Neurochem. Res. 21 769–77Pittman R and Oppenheim R W 1979 Cell death of motoneurons in the chick embryo spinal cord. IV. Evidence that
a functional neuromuscular interaction is involved in the regulation of naturally occurring cell death and thestabilization of synapses J. Comp. Neurol. 187 425–46
Porter J D and Baker R S 1996 Muscles of a different ‘color’: the unusual properties of the extraocular muscles maypredispose or protect them in neurogenic and myogenic disease Neurology 46 30–7

Competition in the development of nerve connections: a review of models R45
Prestige M C and Willshaw D J 1975 On a role for competition in the formation of patterned neural connexions Proc.R. Soc. B 190 77–98
Primi M-P and Clarke P G H 1996 Retrograde neurotrophin-mediated control of neurone survival in the developingcentral nervous system Neuroreport 7 473–6
Purves D 1988Body and Brain: A Trophic Theory of Neural Connections (Cambridge, MA: Harvard University Press)——1994 Neural Activity and the Growth of the Brain (Cambridge: Cambridge University Press)Purves D and Hume R I 1981 The relation of postsynaptic geometry to the number of presynaptic axons that innervate
autonomic ganglion cells J. Neurosci. 1 441–52Purves D and Lichtman J W 1980 Elimination of synapses in the developing nervous system Science 210 153–7——1985 Principles of Neural Development (Sunderland, MA: Sinauer)Ramakers G J A, Winter J, Hoogland T M, Lequin M B, Van Hulten P, Van Pelt J and Pool C W 1998 Depolarization
stimulates lamellipodia formation and axonal but not dendritic branching in cultured rat cerebral cortex neuronsDev. Brain Res. 108 205–16
Rasmussen C E and Willshaw D J 1993 Presynaptic and postsynaptic competition in models for the development ofneuromuscular connections Biol. Cyber. 68 409–19
Reid RC 1999VisionFundamental Neuroscience edM J Zigmond, F EBloom, SCLandis, J L Roberts and LRSquire(San Diego: Academic) pp 821–51
Reiter H O and Stryker M P 1988 Neural plasticity without postsynaptic action potentials: less-active inputs becomedominant when kitten visual cortical cells are pharmacologically inhibited Proc. Natl Acad. Sci. USA 85 3623
Ribchester R R 1988 Activity-dependent and -independent synaptic interactions during reinnervation of partiallydenervated rat muscle J. Physiol. (Lond.) 401 53–75
——1992 Cartels, competition and activity-dependent synapse elimination Trends Neurosci. 15 389 (And reply byColman and Lichtman, Trends Neurosci. 15 390–91)
——1993 Co-existence and elimination of convergent motor nerve terminals in reinnervated and paralysed adult ratskeletal muscle J. Physiol. 466 421–41
——2001 Development and plasticity of neuromuscular connections Brain and Behaviour in Human NeuralDevelopment ed A F Kalverboer and A Gramsbergen (Dordrecht: Kluwer) at press
Ribchester R R and Barry J A 1994 Spatial versus consumptive competition at polyneuronally innervatedneuromuscular junctions Exp. Physiol. 79 465–94
Ribchester R R and Taxt T 1983 Motor unit size and synaptic competition in rat lumbrical muscles reinnervated byactive and inactive motor axons J. Physiol. (Lond.) 344 89–111
——1984 Repression of inactive motor-nerve terminals in partially denervated rat muscle after regeneration of activemotor axons J. Physiol. (Lond.) 347 497–511
Ridge R M A P and Betz W J 1984 The effect of selective, chronic stimulation on motor unit size in developing ratmuscle J. Neurosci. 4 2614–20
Roskies A, Friedman G C and O’Leary D D M 1995 Mechanisms and molecules controlling the development ofretinal maps Perspect. Dev. Neurobiol. 3 63–75
Salin T, Mudo G, Jiang X H, Timmusk T, Metsis M and Belluardo N 1995 Up-regulation of trkB mRNA expressionin the rat striatum after seizures Neurosci. Lett. 194 181–4
Sanes J R and Lichtman J W 1999 Development of the vertebrate neuromuscular junction Annu. Rev. Neurosci. 22389–442
Sanes J R,Marshall LMandMcHahanU J 1978Reinnervation ofmuscle fiber basal lamina after removal ofmyofibers.Differentiation of regenerating axons at original synaptic sites J. Cell. Biol. 78 176–98
Sanes J R et al 1998 Development of the neuromuscular junction: genetic analysis in mice J. Physiol. (Paris) 92167–72
Schnell L, Schneider R, Kolbeck R, Barde Y-A and Schwab M E 1994 Neurotrophin-3 enhances sprouting ofcorticospinal tract during development and after adult spinal cord lesion Nature 367 170–3
Shatz C J and Stryker M P 1978 Ocular dominance columns in layer IV of the cat’s visual cortex and the effects ofmonocular deprivation J. Physiol. (Lond.) 281 267–83
Smalheiser N R and Crain SM 1984 The possible role of ‘sibling neurite bias’ in the coordination of neurite extension,branching, and survival J. Neurobiol. 15 517–29
Snider W D and Lichtman J W 1996 Are neurotrophins synaptotrophins? Mol. Cell. Neurosci. 7 433–42Song S, Miller K D and Abbott L F 2000 Competitive Hebbian learning through spike-timing dependent synaptic
plasticity Nature Neurosci. 3 919–26Stanco A M and Werle M J 1997 Agrin and acetylcholine receptors are removed from abandoned synaptic sites at
reinnervated frog neuromuscular junctions J. Neurobiol. 33 999–1018Stollberg J 1995 Synapse elimination, the size principle, and Hebbian synapses J. Neurobiol. 26 273–82Strata P and Rossi F 1998 Plasticity of the olivocerebellar pathway Trends Neurosci. 21 407–13

R46 A van Ooyen
Stryker M P and Harris W A 1986 Binocular impulse blockade prevents the formation of ocular dominance columnsin cat visual cortex J. Neurosci. 6 2117–33
Swindale N V 1996 The development of topography in the visual cortex: a review of models Network: Comput.Neural Syst. 7 161–247
Tanaka K 1985 Organization of geniculate inputs to visual cortical cells in the cat Vision Res. 25 357–64Taxt T 1983 Local and systemic effects of tetrodotoxin on the formation and elimination of synapses in reinnervated
adult rat muscle J. Physiol. 340 175–94Thompson W J 1983 Synapse elimination in neonatal rat muscle is sensitive to pattern of muscle use Nature 302
614–6ThompsonW J and Jansen J K S 1977 The extent of sprouting of remaining motor units in partly denervated immature
and adult rat soleus muscle Neuroscience 4 523–35Thompson W J, Kuffler D P and Jansen J K S 1979 The effect of prolonged reversible block of nerve impulses on the
elimination of polyneuronal innervation of new-born rat skeletal muscle fibres Neuroscience 4 271–81Trussell L O and Grinnell A D 1985 The regulation of synaptic strength within motor units of the frog cutaneous
pectoris muscle J. Neurosci. 1 243–54Turrigiano G G 1999 Homeostatic plasticity in neuronal networks: the more things change, the more they stay the
same Trends Neurosci. 22 221–7Turrigiano G G, Leslie K R, Desai N S, Rutherford L C and Nelson S B 1998 Activity-dependent scaling of quantal
amplitude in neocortical neurons Nature 391 892–6Tyc F and Vrbova G 1995 Stabilisation of neuromuscular junctions by leupeptin increases motor unit size in partially
denervated rat muscles Dev. Brain Res. 88 186–93Van der Meer J and Ens B J 1997 Models of interference and their consequences for the spatial distribution of ideal
and free predators J. Anim. Ecol. 66 846–58Van Essen D C, Gordon H, Soha J M and Fraser S E 1990 Synaptic dynamics at the neuromuscular junction:
mechanisms and models J. Neurobiol. 21 223–49Van Ooyen A 1994 Activity-dependent neural network development Network: Comput. Neural Syst. 5 401–23Van Ooyen A, Van Pelt J and Corner M A 1995 Implications of activity-dependent neurite outgrowth for neuronal
morphology and network development J. Theor. Biol. 172 63–82Van Ooyen A and Willshaw D J 1999a Poly- and mononeuronal innervation in a model for the development of
neuromuscular connections J. Theor. Biol. 196 495–511——1999b Competition for neurotrophic factor in the development of nerve connections Proc. R. Soc. B 266 883–92——2000 Development of nerve connections under the control of neurotrophic factors: parallels with consumer-
resource systems in population biology J. Theor. Biol. 206 195–210Van Oss C and Van Ooyen A 1997 Effects of inhibition on neural network development through activity-dependent
neurite outgrowth J. Theor. Biol. 185 263–80Von der Malsburg Ch 1973 Self-organization of orientation sensitive cells in the striate cortex Kybernetik 14 85–100Von der Malsburg Ch and Willshaw D J 1976 A mechanism for producing continuous neural mappings: ocularity
dominance stripes and ordered retino-tectal projections Exp. Brain Res. (Suppl.) 1 463–9Vrbova G and Fisher T J 1989 The effect of inhibiting the calcium activated neutral protease, on motor unit size after
partial denervation of the rat soleus muscle Eur. J. Neurosci. 1 616–25Vyskocil F and Vrbova G 1993 Nonquantal release of acetylcholine affects polyneuronal innervation on developing
rat muscle-fibers Eur. J. Neurosci. 5 1677–83Wallace B G 1988 Regulation of agrin-induced acetylcholine receptor aggregation by Ca++ and phorbol ester J. Cell.
Biol. 107 267–78Werle M J and Herrera A A 1991 Elevated levels of polyneuronal innervation persist for as long as two years in
reinnervated frog neuromuscular junctions J. Neurobiol. 22 97–103Wiesel T N 1982 Postnatal development of the visual cortex and the influence of environment Nature 299 583–91Wiesel T N and Hubel D H 1963 Single cell responses in striate cortex of kittens deprived of vision in one eye J.
Neurophysiol. 26 1003–17Willshaw D J 1981 The establishment and the subsequent elimination of polyneuronal innervation of developing
muscle: theoretical considerations Proc. R. Soc. B 212 233–52Willshaw D J and Von der Malsburg Ch 1976 How patterned neural connections can be set up by self-organisation
Proc. R. Soc. B 194 431–45——1979 A marker induction mechanism for the establishment of ordered neural mappings: its application to the
retinotectal problem Phil. Trans. R. Soc. B 287 203–43Wolff J R and Missler M 1992 Synaptic reorganization in developing and adult nervous systems Anat. Anz. 174
393–403Wong R O L, Meister M and Shatz C J 1993 Transient period of correlated bursting activity during development of

Competition in the development of nerve connections: a review of models R47
the mammalian retina Neuron 11 923–38Yan H Q, Mazow M L and Dafny N 1996 NGF prevents the changes induced by monocular deprivation during the
critical period in rats Brain Res. 706 318–22Yasuda T, Sobue G, Ito T, Mitsuma T and Takahashi A 1990 Nerve growth factor enhances neurite arborization of
adult sensory neurons; a study in single-cell culture Brain Res. 524 54–63Yodzis P 1989 Introduction to Theoretical Ecology (New York: Harper and Row)Yunshao H, Zhibin Y, Yaoming G, Guobi K and Yici C 1992 Nerve growth factor promotes collateral sprouting of
cholinergic fibres in the septohippocampal cholinergic system of aged rats with fimbria transection Brain Res.586 27–35
Zafra F, Castren E, ThoenenH and LindholmD1991 Interplay between glutamate and γ -aminobutyric acid transmittersystems in the physiological regulation of brain-derived neurotrophic factor and nerve growth factor synthesisin hippocampal neurons Proc. Natl Acad. Sci. USA 88 10 037–41
Zhang L I, HuizhongWT,Holt C E,HarrisWAand PooM-M1998A critical window for cooperation and competitionamong developing retinotectal synapses Nature 395 37–44
Zhu PH andVrbovaG1992The role of Ca-2+ in the elimination of polyneuronal innervation of rat soleusmuscle-fibresEur. J. Neurosci. 4 433–7
Zoubine M N, Ma J Y, Smirnova I V, Citron B A and Festoff B W 1996 A molecular mechanism for synapseelimination: novel inhibition of locally generated thrombin delays synapse loss in neonatal mouse muscle Dev.Biol. 179 447–57