a review of droop controlled, grid-forming inverters in
TRANSCRIPT

1
A Review of Droop Controlled, Grid-Forming Inverters in CERTS Microgrid and Their Potential
Impact on Bulk Power Systems
Wei Du
Senior Research Engineer
Pacific Northwest National Laboratory
April 20, 2020
WECC Model Validation Working Group Annual Meeting
This work is partially funded by the Microgrid R&D program, which is
funded by the U.S. Department of Energy’s (DOE) Office of Electricity.
The Microgrid R&D Program is managed by Mr. Dan Ton.
2
OUTLINE
➢ Grid-Forming & Grid-Following Concept
➢ A brief introduction
➢ Droop-Control for Grid-Forming Inverters in CERTS Microgrid
➢ Controller design, simulation, and field tests in CERTS/AEP test bed
➢ Comparison of grid-following and grid-forming inverter
➢ Distribution-level networked microgrids
➢ Transmission systems (Hawaiian Island of Oahu)
➢ Discussion: How should inverters respond to faults in a highly inverter-penetrated bulk power system?

3
Voltage Source Inverter
Grid-Following (Current Source) Grid-Forming (Voltage Source)
+ Current control (PLL+ current loop)
+ Control P & Q
- Do not control voltage and frequency
- Cannot work without a grid
+ Voltage & frequency control
+ Can work in islanded mode
- No direct control of current
- Overload/over-current Issues
At the beginning of disturbance, the inverter
output current is approximately constant,
then external controls adjust Id and Iq.
At the beginning of disturbance, the inverter
internal voltage is constant, then external
controls adjust E and ω.

4
Droop Control for Grid-Forming Inverters in
CERTS Microgrid

5
Sources
Loads
60 kW Tecogen Inverter-
coupled IC engine-generator
Static Switch
http://certs.lbl.gov/certs-der-pubs.htmlAEP/CERTS Microgrid Test Bed
• AEP/CERTS Microgrid: one of the earliest inverter-based microgrids in the world
(constructed in 2006), funded by DOE
• Principle Investigator: Prof. Bob Lasseter from University of Wisconsin-Madison
• The CERTS Microgrid Program has been running for almost 20 years
A 100% Grid-Forming-Inverter-based Microgrid
6
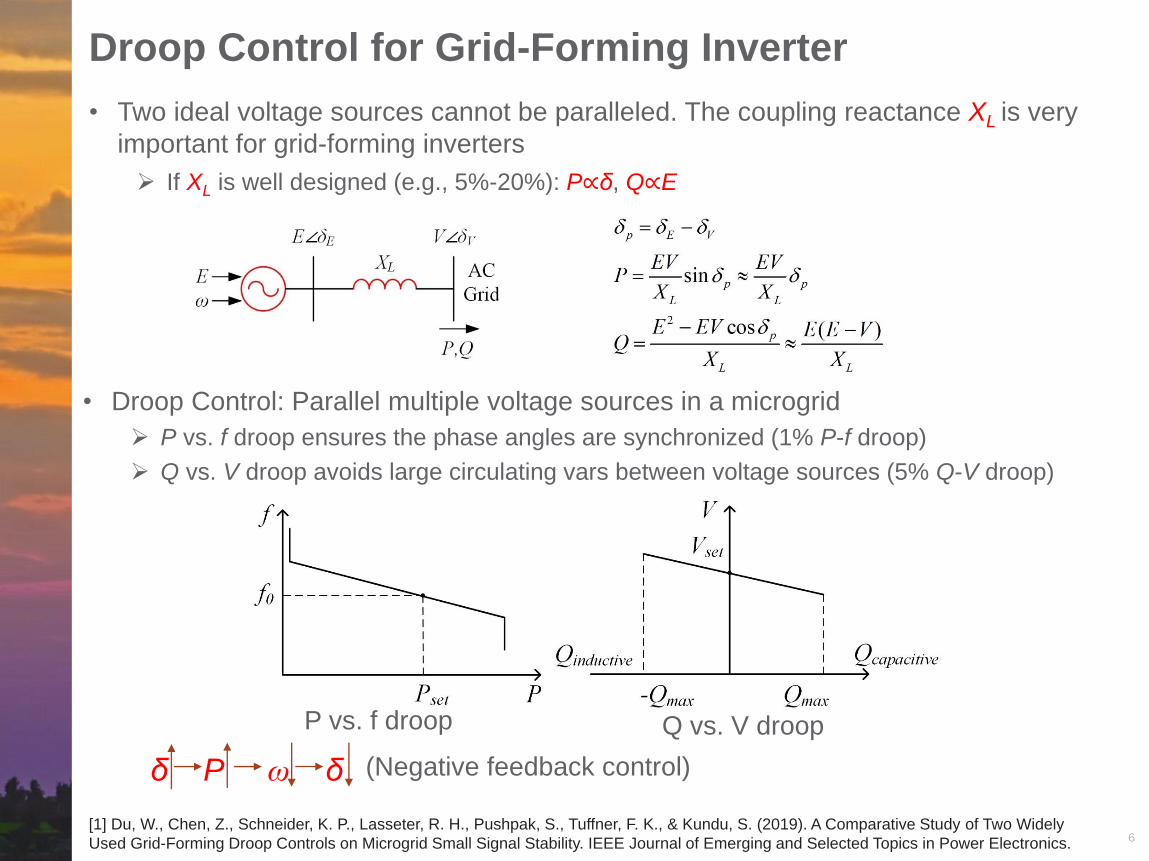
Droop Control for Grid-Forming Inverter
• Two ideal voltage sources cannot be paralleled. The coupling reactance XL is very
important for grid-forming inverters
➢ If XL is well designed (e.g., 5%-20%): P∝δ, Q∝E
• Droop Control: Parallel multiple voltage sources in a microgrid
➢ P vs. f droop ensures the phase angles are synchronized (1% P-f droop)
➢ Q vs. V droop avoids large circulating vars between voltage sources (5% Q-V droop)
P vs. f droop Q vs. V droop
δ P ω δ (Negative feedback control)
[1] Du, W., Chen, Z., Schneider, K. P., Lasseter, R. H., Pushpak, S., Tuffner, F. K., & Kundu, S. (2019). A Comparative Study of Two Widely
Used Grid-Forming Droop Controls on Microgrid Small Signal Stability. IEEE Journal of Emerging and Selected Topics in Power Electronics.
Time/s 2.80 3.00 3.20 3.40 3.60 3.80 ...
...
...
0
10
20
30
40
50
60
70
80
P [
kW]
P_A1 P_A2
-10.0
-5.0
0.0
5.0
10.0
Q [
kvar]
Q_A1 Q_A2
58.00
58.50
59.00
59.50
60.00
60.50
61.00
Fre
quency
[H
z]
f_A1 f_A2
7
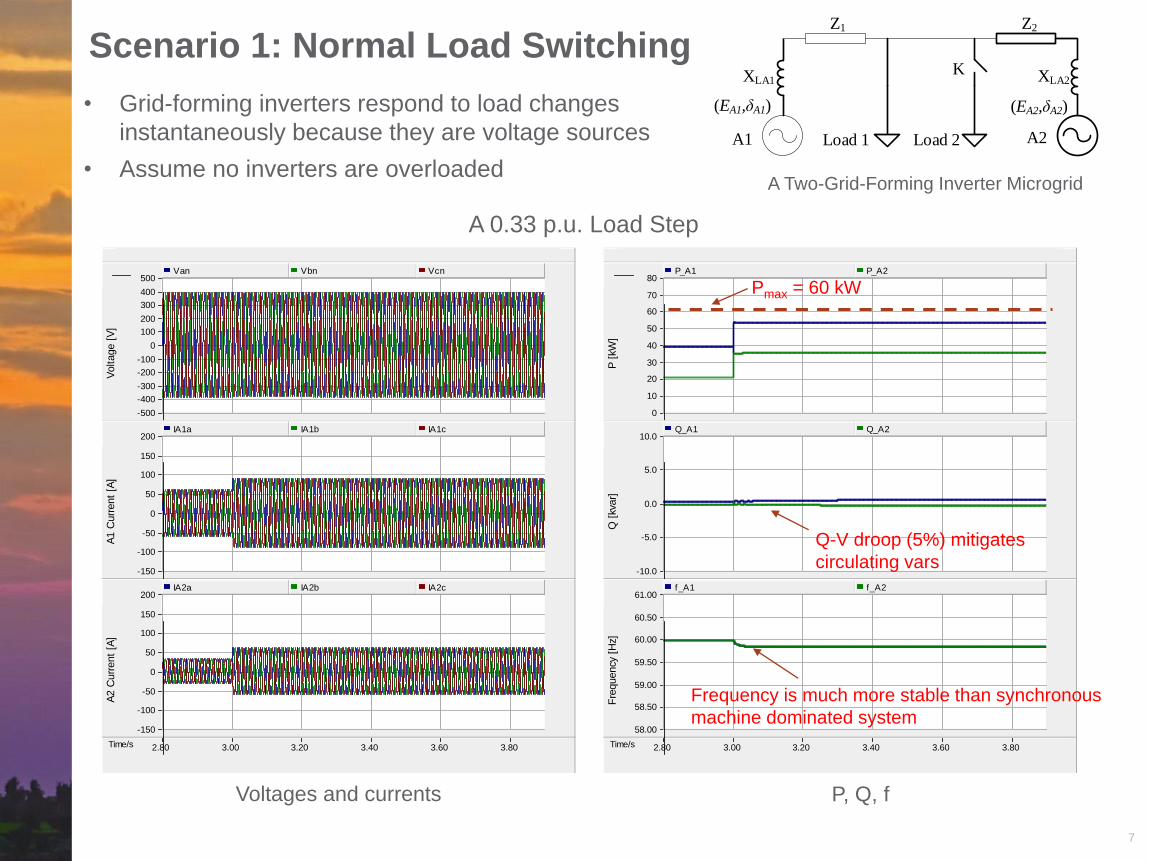
A Two-Grid-Forming Inverter Microgrid
Z1
A1
XLA1
Z2
K
A2
XLA2
(EA1,δA1) (EA2,δA2)
Load 1 Load 2
Scenario 1: Normal Load Switching
Time/s 2.80 3.00 3.20 3.40 3.60 3.80 ...
...
...
-500
-400
-300
-200
-100
0
100
200
300
400
500
Voltage [
V]
Van Vbn Vcn
-150
-100
-50
0
50
100
150
200
A1 C
urr
ent
[A]
IA1a IA1b IA1c
-150
-100
-50
0
50
100
150
200
A2 C
urr
ent
[A]
IA2a IA2b IA2c
Voltages and currents P, Q, f
Q-V droop (5%) mitigates
circulating vars
• Grid-forming inverters respond to load changes
instantaneously because they are voltage sources
• Assume no inverters are overloaded
Pmax = 60 kW
Frequency is much more stable than synchronous
machine dominated system
A 0.33 p.u. Load Step

8
0
20
40
60
80
A1 Power kW
A2 Power kW
-500
0
500
Load Voltage Phase a
Load Voltage Phase b
Load Voltage Phase c
0 0.2 0.4 0.6 0.8 1
-100
0
100
Time Seconds
A1 3 Phase Currents
A2 3 Phase Currents
Overload
Scenario 2: Partial Overload
Without Pmax Controller
• When one source is dispatched near its
maximum generation, a load step can result in
overload
• Overload can collapse dc bus of inverters,
stall the synchronous generators, etc.
A Two-Source System
Z1
A1
XLA1
Z2
K
A2
XLA2
(EA1,δA1) (EA2,δA2)
Load 1 Load 2
0 10 20 30 40 50 60 70 8059
59.2
59.4
59.6
59.8
60
60.2
60.4
60.6
Power[kW]
Fre
quency[H
z]
P
max=60kW
Pset-A2
=5kW
Pset-A1
=55kW
PA2
=20kW PA1
=70kW
Without Pmax Controller

9
0
20
40
60
80
A1 Power kW
A2 Power kW
-500
0
500
Load Voltage Phase a
Load Voltage Phase b
Load Voltage Phase c
0 0.2 0.4 0.6 0.8 1
-100
0
100
Time Seconds
A1 3 Phase Currents
A2 3 Phase Currents
Overload
Without Pmax Controller
• When one source is dispatched near its
maximum generation, a load step can result in
overload
• Overload can collapse dc bus of inverters,
stall the synchronous generators, etc.
A Two-Source System
Z1
A1
XLA1
Z2
K
A2
XLA2
(EA1,δA1) (EA2,δA2)
Load 1 Load 2
0 10 20 30 40 50 60 70 8059
59.2
59.4
59.6
59.8
60
60.2
60.4
60.6
Power[kW]
Fre
quency[H
z]
P
max=60kW
Pset-A2
=5kW
Pset-A1
=55kW
PA2
=20kW PA1
=70kW
Without Pmax Controller
-+
mp
Pset
P ++
ω0
+
kppmax+kipmax/s
+
+
-
-+
+
Pmin
0
0
Pmax
P
ω
kppmax+kipmax/s
Δω +
Overload Mitigation Controller:
Change the phase angle between sources: Dd
Scenario 2: Partial Overload
10
0
20
40
60
80
A1 Power kW
A2 Power kW
-500
0
500
Load Voltage Phase a
Load Voltage Phase b
Load Voltage Phase c
0 0.2 0.4 0.6 0.8 1
-100
0
100
Time Seconds
A1 3 Phase Currents
A2 3 Phase Currents
Overload
Without Pmax Controller
With Pmax Controller
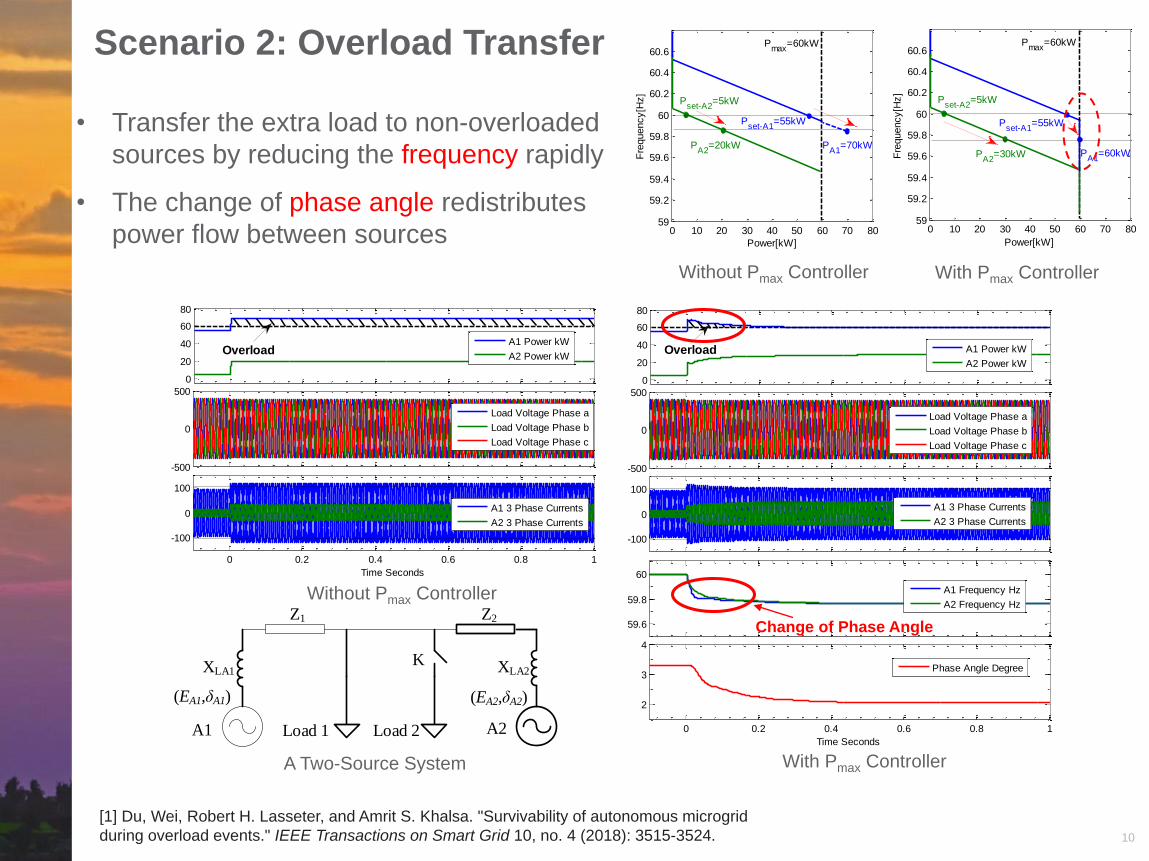
• Transfer the extra load to non-overloaded
sources by reducing the frequency rapidly
• The change of phase angle redistributes
power flow between sources
A Two-Source System
Z1
A1
XLA1
Z2
K
A2
XLA2
(EA1,δA1) (EA2,δA2)
Load 1 Load 2
0 10 20 30 40 50 60 70 8059
59.2
59.4
59.6
59.8
60
60.2
60.4
60.6
Power[kW]
Fre
quency[H
z]
P
max=60kW
Pset-A2
=5kW
Pset-A1
=55kW
PA2
=20kW PA1
=70kW
With Pmax ControllerWithout Pmax Controller
0 10 20 30 40 50 60 70 8059
59.2
59.4
59.6
59.8
60
60.2
60.4
60.6
Power[kW]
Fre
quency[H
z]
P
max=60kW
PA2
=30kW
Pset-A1
=55kW
Pset-A2
=5kW
PA1
=60kW
Scenario 2: Overload Transfer
0
20
40
60
80
59.6
59.8
60
0 0.2 0.4 0.6 0.8 1
2
3
4
Time Seconds
A1 Power kW
A2 Power kW
A1 Frequency Hz
A2 Frequency Hz
Phase Angle Degree
-500
0
500
-100
0
100
Load Voltage Phase a
Load Voltage Phase b
Load Voltage Phase c
A1 3 Phase Currents
A2 3 Phase Currents
Overload
Change of Phase Angle
[1] Du, Wei, Robert H. Lasseter, and Amrit S. Khalsa. "Survivability of autonomous microgrid
during overload events." IEEE Transactions on Smart Grid 10, no. 4 (2018): 3515-3524.

11
How do high-penetration of grid-forming/grid-following
inverters impact the transient stability of distribution-
level networked microgrids?
➢ Comparison of Grid-Following and Grid-Forming
12
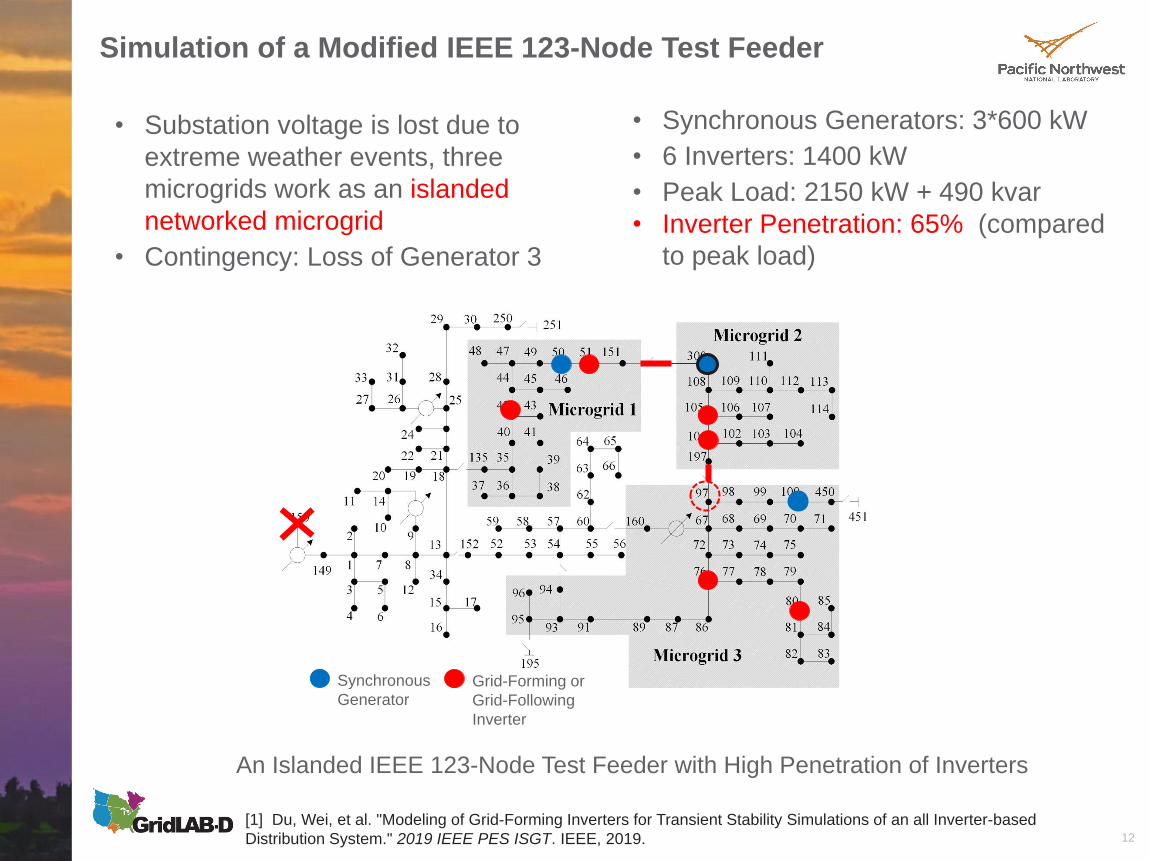
An Islanded IEEE 123-Node Test Feeder with High Penetration of Inverters
• Synchronous Generators: 3*600 kW
• 6 Inverters: 1400 kW
• Peak Load: 2150 kW + 490 kvar
• Inverter Penetration: 65% (compared
to peak load)
• Substation voltage is lost due to
extreme weather events, three
microgrids work as an islanded
networked microgrid
• Contingency: Loss of Generator 3
Simulation of a Modified IEEE 123-Node Test Feeder
Synchronous
GeneratorGrid-Forming or
Grid-Following
Inverter
[1] Du, Wei, et al. "Modeling of Grid-Forming Inverters for Transient Stability Simulations of an all Inverter-based
Distribution System." 2019 IEEE PES ISGT. IEEE, 2019.

13
Grid-Forming (direct voltage control):
measure P & Q, control f & VGrid-Following (PLL + current loop):
measure f & V, control P & Q
Frequency-Power Droop
Voltage-Reactive Power Droop
0.02s 5% droop 0.25s
0.02s 0.2s5% droop
5% droop
Power-Frequency Droop
Reactive Power-Voltage Droop
• Inverter uses voltage source
representation
• Grid-Forming: Internal voltages
are three-phase balanced
• Grid-Following: Inject three-
phase balanced currents
• GridLAB-D: Three-phase,
phasor-based simulation
software developed by PNNL for
unbalanced distribution systems
XLE δa
E ω
XL
E ω
XLE δc
E ω
E δb Distribution
System
Network
Solution
Inverter Controller
Pi,Qi,Vgi
E,ω

14
Grid-Following
Simulation of a Modified IEEE 123-Node Test Feeder
• Grid-Forming inverters can improve frequency stability
• Grid-Forming inverters response to load changes
instantaneously (voltage source)
• Grid-Following inverters respond to frequency change
slowly
Grid-Forming
Major improvement
5% P-f droop for both grid-following and grid-forming

15
Impact on Bulk Power Systems
➢ A Case Study of Hawaiian Island of Oahu

16
Loss of a 200MW generator (1080MW load, 540 MW PV)
Hawaiian island of Oahu
(50% distributed PV)
Total system load
Grid-following: Frequency-Watt (5% droop)
Grid-forming: CERTS inverter (1% droop)
[1] Elkhatib, Mohamed E., Wei Du, and Robert H. Lasseter. "Evaluation of Inverter-based Grid Frequency Support using Frequency-Watt
and Grid-Forming PV Inverters." In 2018 IEEE Power & Energy Society General Meeting (PESGM), pp. 1-5. IEEE, 2018.
• User-written models of grid-forming and grid-following inverters developed in PSS/E
• Assume PV has sufficient headroom
Load trippingFrequency
Major improvement
17
Discussion: How should inverters respond to faults in a
highly-inverter penetrated bulk power system?
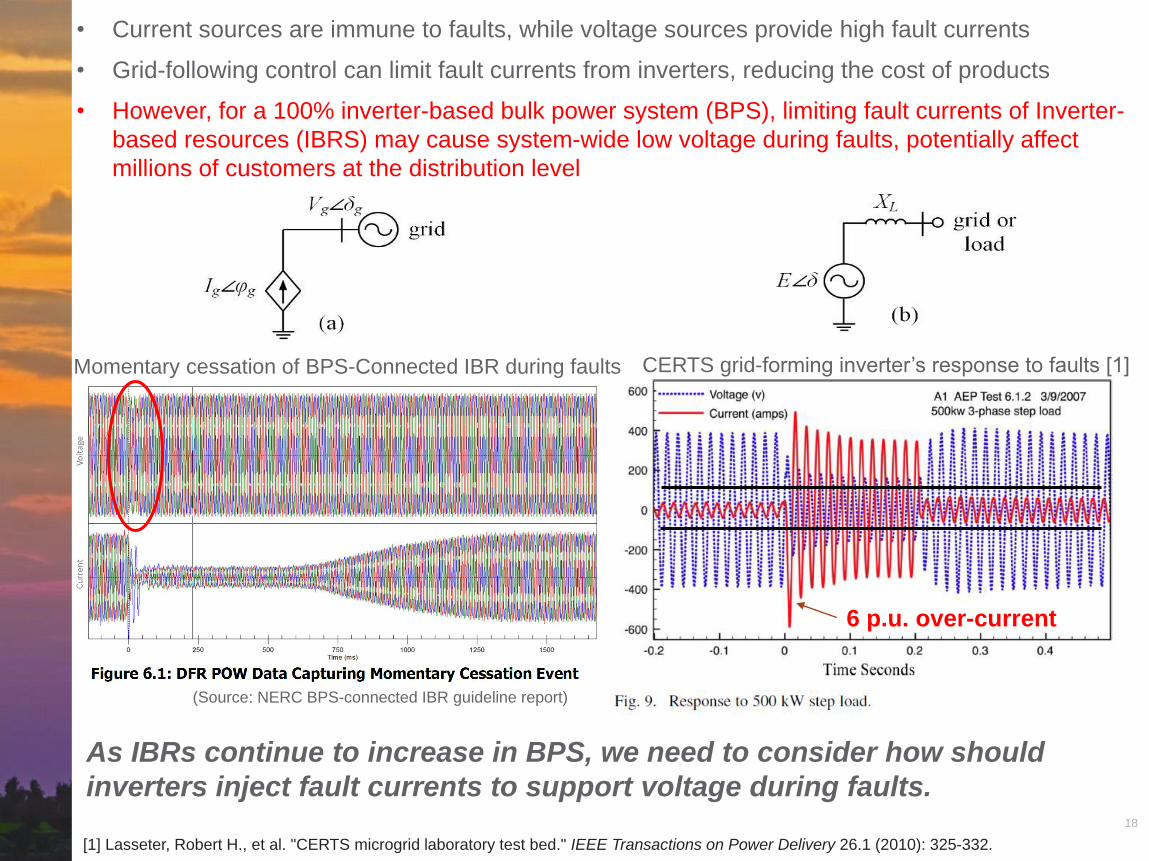
6 p.u. over-current
18
CERTS grid-forming inverter’s response to faults [1]Momentary cessation of BPS-Connected IBR during faults
(Source: NERC BPS-connected IBR guideline report)
• Current sources are immune to faults, while voltage sources provide high fault currents
• Grid-following control can limit fault currents from inverters, reducing the cost of products
• However, for a 100% inverter-based bulk power system (BPS), limiting fault currents of Inverter-
based resources (IBRS) may cause system-wide low voltage during faults, potentially affect
millions of customers at the distribution level
As IBRs continue to increase in BPS, we need to consider how should
inverters inject fault currents to support voltage during faults.
[1] Lasseter, Robert H., et al. "CERTS microgrid laboratory test bed." IEEE Transactions on Power Delivery 26.1 (2010): 325-332.

Thank you
19
This work is partially funded by the Microgrid
R&D program, which is funded by the U.S.
Department of Energy’s (DOE) Office of
Electricity. The Microgrid R&D Program is
managed by Mr. Dan Ton.