a retrospective analysis of local market power …€¦ · a retrospective analysis of local market...
TRANSCRIPT

CAISO/MA&D/LXU May09, 2011 page 1
__________________________________________
A Retrospective Analysis of
Local Market Power Mitigation Enhancements
Lin Xu, PhD
Market Analysis and Development,
California Independent System Operator
May 9, 2011

CAISO/MA&D/LXU May09, 2011 page 2
A Retrospective Analysis of Local Market Power Mitigation Enhancements
1. INTRODUCTION
The ISO proposed a new Local Market Power Mitigation (LMPM) methodology to
To meet the requirements for bid in demand outlined in the September 21, 2006 FERC order1 and
To incorporate changes needed due to the implementation of convergence (virtual) bidding and new demand response products.2
Compared with the current LMPM approach, the new LMPM has several other benefits. The current LMPM process has two runs – the competitive constraints (CC) run and the all constraints (AC) run. Each one of these runs uses system resources and processing time. The new proposal, streamlines the process into one run, providing the opportunity in the future to run the mitigation process more frequently in the real time and thus providing more precision in the mitigation decisions. In addition, this proposal is fully compatible with the future direction of the ISO to implement a dynamic, or inline, competitive path assessment (CPA). What this means is that each time the mitigation is run, the competitive path assessment is performed. Again, this provides more accurate information for the system to make mitigation decisions. As a parallel process, Department of Market Monitoring (DMM) proposed to change the current seasonal CPA into a dynamic CPA.
The performance of overall market power mitigation will be impacted by both the LMPM methodology change and the dynamic CPA change. Stakeholders have requested the ISO to perform analysis to address the impacts in responding to the ISO’s LMPM enhancements straw proposal.3. A comprehensive analysis road map is illustrated in Figure 1 to assess these two changes. The analysis to address the change from current CPA to dynamic CPA was performed by DMM, and is discussed in DMM’s 2010 annual report. The focus of this paper is to address the change from current LMPM to the new LMPM methodology under the current CPA designation. A similar analysis could be performed to address both changes together if a dynamic CPA study for 2011 using the AC results can be prepared. When the dynamic CPA results are available, the ISO can use them as input to address both the LMPM and CPA changes together, to further the analysis roadmap.
1.The webpage containing the September 21, 2006 FERC Order can be found at: http://www.caiso.com/1bbd/1bbd7bf91bcd0.pdf .
2 The webpage containing all the documents related to convergence bidding can be found at http://caiso.com/1807/1807996f7020.html ; demand response at http://caiso.com/1893/1893e350393b0.html
3 The LMPM enhancements straw proposal can be found at http://www.caiso.com/2b45/2b45ceff66c70.pdf

CAISO/MA&D/LXU May09, 2011 page 3
This paper reports a retrospective analysis of the ISO’s new LMPM approach based on current CPA. The proposed new LMPM approach is applied to historical markets to compare its results with the current mitigation approach under the same seasonal CPA designation. The objective of this is to provide better understanding of the new LMPM approach.
FIGURE 1: ANALYSIS ROAD MAP TO ASSESS NEW LMPM AND DYNAMIC RSI
2. DATA AND METHOD
The analysis in this paper is based on two months of actual day-ahead market data, February and March of 2011. For this period of time, the shift factor data was provided to the ISO as part of the convergence bidding release. Because shift factor data is a crucial input, the first step of this analysis is to validate the shift factors in terms of data quality. It was found that there were two days within these two months that the shift factor data was incomplete in the ISO historical data store. These two days have been excluded from the analysis. The remaining 57 days will be referred to as the study period. The study data set consists of 57 days of data from the study period.
The ISO’s preferred mitigation reference bus is the Midway 500 KV bus if path 26 flow is from north to south, and the Vincent 500 KV bus if the path 26 flow is south to north. Unless mentioned otherwise, the default reference bus will be either the Midway or Vincent 500 KV bus. There will be a comparison of using either Midway or Vincent reference bus versus using the load distributed slack bus as the mitigation reference bus in section 3.1.
The first step in the new LMPM method is to run the all constraints (AC) run. Given the mitigation reference bus, the analysis finds the binding constraints in AC run, and decomposes the locational marginal price (LMP) for every location i as follows:
Current LMPM
Current CPA
New LMPM
Current CPA
Current LMPM
Dynamic CPA (RSI)
New LMPM
Dynamic CPA (RSI)
DMM
CAISO
CAISO perform study
Pending DMM to provide RSI
Focus of this paper

CAISO/MA&D/LXU May09, 2011 page 4
Where:
= the energy component of ,
= the loss component of ,
= the congestion component of due to the competitive constraints and;
= the congestion component of the non-competitive constraints.
The ISO has a shift factor effectiveness threshold of 0.02, which means that any shift factor with absolute values less than 0.02 will not be considered in the decomposition.
Every unit with will be flagged for mitigation.
The LMP without the non-competitive congestion component,
, is referred as the competitive LMPi , and will be used as a mitigation price floor.
3. ANALYSIS
3.1 MITIGATION HOURS
In our study period, there are 175 hours with at least one non-competitive constraint binding in the day-ahead AC run. The non-competitive constraints and congested hours are listed in Table 1. The new mitigation will be applied to these 175 hours.
Constraint Type Congested Hours
SDGE_PCT_UF_IMP_BG Flowgate 109
SLIC 1417897_IV_CB_7022_OUT_NG Nomogram 15
36957_MCSN TP1_230_36961_MOCCASIN_230_BR_1 _1 Flowgate 13
32228_PLACER _115_32238_BELL PGE_115_BR_1 _1 Flowgate 10
SLIC 1446790 EGL_SLV_FLTN SOL-1 Nomogram 9
SLIC 1368530_SDGE_IV_CB_7022 Nomogram 6
SSONGS_BG Flowgate 6
SLIC 1434491_Moorpark_Pardee_NG Nomogram 5
22716_SANLUSRY_230_24131_S.ONOFRE_230_BR_3 _1 Flowgate 2
TABLE 1: BINDING NON-COMPEPTITIVE CONSTRAINTS IN DAY-AHEAD MARKET POWER MITIGATION ALL-CONSTRAINT RUN

CAISO/MA&D/LXU May09, 2011 page 5
In contrast, the current LMPM was triggered4 in 644 hours out of total of 1,367 hours. Among them, 163 hours overlap with the non-competitive constraint binding hours. The comparison of mitigation hours is illustrated in Figure 2. There 481 hours when the current mitigation identifies units for mitigation without any non-competitive constraint binding. In other words, the current LMPM produces false positive mitigation results 75% (=481/644) of time. We stress that this analysis only benchmarks the LMPM, but not the CPA. Therefore, the “false positive” and “false negative” discussed in the paper only involve the incorrect results of the LMPM, but not the CPA.5
FIGURE 2: NEW MITIGATION HOURS VS CURRENT MITIGATION HOURS
3.2 NUMBER OF UNITS MITIGATED
Now let’s focus on the 175 hours with non-competitive constraint binding. Within these 175 hours, the new LMPM flags 35.6 units per hour (including different configurations from MSG units) as candidates for exercising local market power. As illustrated in Figure 3, among these 35.6 units, 4.8 units are unavailable for dispatch due to outages; 11.6 units choose to self schedule; 11.8 units already bid under their default energy bids (DEB); and 0.1 units bid below the competitive LMP. Although the new LMPM flags those units, mitigation applied to those units will not result in any market impact.
The remaining 7.2 units are economically withholding some portion of their capacities, and their bids will be changed by the new LMPM. These economic withholding units are further divided into two categories: severe economic withholding and moderate economic withholding. Severe withholding refers to the units that bid more than $200 above its DEB for at least one segment, and moderate withholding refers to the units that bid within $200 of their DEBs. A large portion of these economic withholding units are not committed in the AC run. The economic withholding units could possibly cause market impact if their bids are mitigated and awarded, unless there are other constraints, such as minimum offline time, that prevent the market optimization from
4 The current LMPM is considered triggered if a resource is dispatched in the “all constraint” (AC) run greater than the resource is dispatched in the “competitive constraint” (CC) run.
5 The “false positive” and “false negative” have different meanings in DMM’s reports. DMM uses “false positive” and “false negative” to mean if a constraint is deemed non-competitive correctly in the context of CPA benchmarking.
163 hours12 hours 481 hours
Current mitigation
644 hours
Non-competitive constraint
binding 175 hours
(New mitigation hours)
False positive
hours

CAISO/MA&D/LXU May09, 2011 page 6
committing these units. However, due to the complexity of the market optimization, it is difficult to determine if a mitigated unit can change market outcome without rerunning market optimization with mitigated bid. Rerunning every market to perform this impact test was not feasible due to the limited amount of time to perform the analysis, and was not considered within the scope of this analysis.
In contrast, the current mitigation only flags 1.6 units per hour, half of which overlaps with the units identified in the new LMPM approach, and the other half are false positives. For example, in hour ending 15 on March 27 2011, SDGE_PCT_UF_IMP_BG was binding in AC run with $26/MWh shadow price, and the current LMPM flagged two units for mitigation. One was in the SDGE area, and was also flagged by the new approach. The other unit was in the PG&E area, and is a false positive, because mitigating a PG&E unit would not help alleviate market power in SDGE.6 In this hour, the new LMPM identifies 42 units in SDGE, 3 units having severe economic withholding, and 6 units having moderate economic withholding.
On the other hand, it is difficult to determine if a unit is a false negative for the current approach, because of the difficulty in determining if a mitigated unit will have market impact. In theory, the true false negatives should be a subset of the economic withholding units under the new LMPM approach. However, the current LMPM approach was not able to flag any economic withholding units identified by the new LMPM approach in the study period.
FIGURE 3: NEW LMPM VS CURRENT LMPM IN NON-COMPEPETITIVE CONSTRAINT BINDING HOURS
6 These spurious “false positives” under the current LMPM approach could possibly be caused by modeling differences between the CC run and AC run. This issue may be alleviated by protecting the CC run schedules with negative penalty prices. However, looking forward, when bid-in demands and virtual bids are used in the LMPM process, it is unclear how to properly set the penalty level. Increasing the protection level may cause bid-in demands and virtual bids to be redispatched before the physical bids in the downward direction, which may produce unexpected results, such as dispatching down a DLAP load in order to alleviate local congestion.
severe economic withholding
moderate economic withholding
below competitive
below DEB
self schedule
unavailable
5.8 units
0.1 units
11.8 units
11.6 units
4.8 units
Total 35.6 units
New LMPM flagged
35.6 unitsCurrent LMPM flagged
1.6 units
false positive
0.8 units
overlapping identification
0.8 units
false negative
subset of the economic withholding units
1.5 units
severe: >$200 above DEB
moderate: <=$200 above DEB
CAISO/MA&D/LXU May09, 2011 page 7
3.2 REFERENCE BUS CHOICE
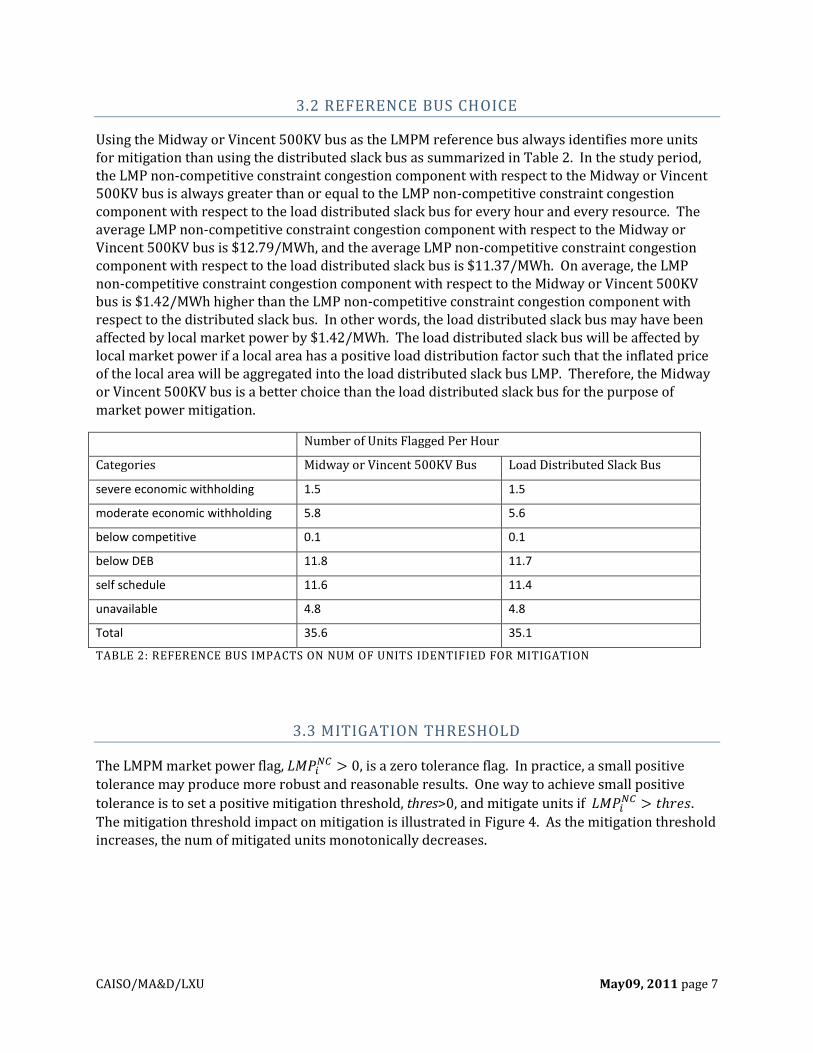
Using the Midway or Vincent 500KV bus as the LMPM reference bus always identifies more units for mitigation than using the distributed slack bus as summarized in Table 2. In the study period, the LMP non-competitive constraint congestion component with respect to the Midway or Vincent 500KV bus is always greater than or equal to the LMP non-competitive constraint congestion component with respect to the load distributed slack bus for every hour and every resource. The average LMP non-competitive constraint congestion component with respect to the Midway or Vincent 500KV bus is $12.79/MWh, and the average LMP non-competitive constraint congestion component with respect to the load distributed slack bus is $11.37/MWh. On average, the LMP non-competitive constraint congestion component with respect to the Midway or Vincent 500KV bus is $1.42/MWh higher than the LMP non-competitive constraint congestion component with respect to the distributed slack bus. In other words, the load distributed slack bus may have been affected by local market power by $1.42/MWh. The load distributed slack bus will be affected by local market power if a local area has a positive load distribution factor such that the inflated price of the local area will be aggregated into the load distributed slack bus LMP. Therefore, the Midway or Vincent 500KV bus is a better choice than the load distributed slack bus for the purpose of market power mitigation.
Number of Units Flagged Per Hour
Categories Midway or Vincent 500KV Bus Load Distributed Slack Bus
severe economic withholding 1.5 1.5
moderate economic withholding 5.8 5.6
below competitive 0.1 0.1
below DEB 11.8 11.7
self schedule 11.6 11.4
unavailable 4.8 4.8
Total 35.6 35.1
TABLE 2: REFERENCE BUS IMPACTS ON NUM OF UNITS IDENTIFIED FOR MITIGATION
3.3 MITIGATION THRESHOLD
The LMPM market power flag, , is a zero tolerance flag. In practice, a small positive
tolerance may produce more robust and reasonable results. One way to achieve small positive
tolerance is to set a positive mitigation threshold, thres>0, and mitigate units if .
The mitigation threshold impact on mitigation is illustrated in Figure 4. As the mitigation threshold increases, the num of mitigated units monotonically decreases.

CAISO/MA&D/LXU May09, 2011 page 8
FIGURE 4: POSITIVE MITIGATION THRESHOLD IMPACTS ON NUMBER OF UNITS MITIGATED
4. SUMMARY
This analysis performed on the day-ahead market from February to March 2011 is to address the impact of the LMPM methodology change. In this analysis, the new LMPM results were compared with the current LMPM results. Given the same set of non-competitive constraints, the new LMPM tends to flag more units for mitigation. One major reason for this is that the current LMPM is designed to filter out the outage units, the self schedule units, uncommitted units, etc., while the new LMPM provides a more thorough examination without filtering out these units. Mitigating these units will not result in any market impact under the new LMPM approach. The economic withholding units that need mitigation are about 7 units per hour per constraint. However, the current LMPM fails to identify any of them.
Another reason for relatively frequent mitigation in the new LMPM is that the current CPA designation methodology is very conservative. The current LMPM is a less discerning approach, and thus it is coupled with a very conservative CPA. The new LMPM is a more discerning approach and better situated to accommodate a more accurate CPA methodology. With the desire to move to a more accurate dynamic CPA replacing the current CPA, the new LMPM is a better fit and fully compatible with the desired direction than the current LMPM method.
The analysis also compared the reference bus choice. In contrast with the load distributed slack bus, the Midway or Vincent 500 KV bus is less impacted by local market power, and is a better choice as a reference for local market power mitigation purpose.
0.0
5.0
10.0
15.0
20.0
25.0
30.0
35.0
40.0
0 1 2 3 4 5 6 7 8 9 10
Ave
rage
nu
me
r o
f fla
gge
d u
nit
s
Mitigation threshold ($/MWh)
Mitigated units vs mitigation threshold
unavailable
self schedule
below DEB
below competitive
moderate economic withholding
severe economic withholding

CAISO/MA&D/LXU May09, 2011 page 9
Another part of the analysis sheds light on mitigation tolerance. The LMPM proposal currently employs a zero tolerance approach, while in practice a small tolerance may be more robust. The analysis illustrates the impact of a non-zero mitigation threshold, and may be viewed as a sensitivity analysis of the mitigation tolerance.
Some stakeholders proposed to test local market power based on shift factor to each individual binding non-competitive constraint. This alternative approach and the ISO’s proposal will produce different results only when there are multiple simultaneously binding looped non-competitive constraints. In our study period, there was exactly one non-competitive constraint binding in each of these 175 hours, so using individual shift factor to test local market power will produce exactly the same results as the ISO proposed approach. We will report our findings on this in future analysis if looped non-competitive constraints congestion is observed in our market.