a resource for the state of florida - national …. girma t. bitsuamlak, peng, assistant professor...
TRANSCRIPT

A Resource for the State of Florida
HURRICANE LOSS REDUCTION
FOR
HOUSING IN FLORIDA:
Fullscale External and Internal Pressure Measurements for a Lowrise Building
A Research Project Funded by The State of Florida Division of Emergency Management
Submitted by:
Dr. Girma T. Bitsuamlak, PEng, Assistant Professor
Amanuel S. Tecle, Graduate Research Assistant
In Partnership with:
The International Hurricane Research Center
Florida International University
September 2009

3 ‐ 1
EXCUTIVE SUMMARY
In this project, a wind induced internal and external pressure in typical low-rise building models
is investigated primarily by using a full-scale wind testing facility generically named Wall of
Wind (WoW). Effect of different dominant openings (representing open door and window
conditions or breaching of a building envelope by wind-borne debris), vents (gable end, goose
neck, turbine, and soffit) and background leakage under different wind angle of attack is carried
out. Prior to performing the full-scale analysis, a three tier approach comprising (i) a less
expensive computer simulation and (ii) small-scale WoW (1:8 replica of the full-scale WoW)
followed by (iii) a confirmatory test using the full-scale WoW is adopted to assess effect of
blockage and proximity to the WoW flow simulator. Computer model of various size are first
simulated to assess the blockage effect and additional simulations are done to assess the
proximity effect by placing a model at different distance from the wall of wind. For the computer
simulation, a commercially available software FLUENT (version 6.2) is utilized. In order to
verify and ascertain the results of the computer simulations, a less expensive small scale physical
experiment was carried out by designing three small WoW model cubes (i.e., scale 1:8 with 5ft,
7ft, and 9.5ft side lengths). The outcomes of the small scale WoW analysis was compared with
the results of the numerical computation (i.e., CFD) and previously carried out researches from
literature. Both the numerical and small scale WoW test results indicated the importance of
blockage and proximity effect and the need for further study at full-scale. Thus, a confirmatory
blockage was carried out using a full-scale WoW. These blockage and proximity effect studies
resulted in the selection of an optimal low-rise building test model dimensions (i.e. 9ft L by 7ft

3 ‐ 2
W and 7 ft H) and testing location (i.e. the test model placed at 12 ft from the WoW) that
provides aerodynamically sound data.
A low-rise building model with interchangeable gable and hip roofs was designed and fabricated.
Detailed multiple dominant openings (doors with secondary openings and windows), ventilation
openings (soffit, goose neck, turbine and soffits), vertical (ceiling) and horizontal (partition wall)
compartments are fabricated. These details have enabled to study (i) the impact of the fluctuation
of external pressure over the internal pressure, (i) the intensity of critical internal pressure that
build up as a consequence of compartmentalization and various opening sizes of dominant
openings (iii) the influence of ventilation openings in dampening the internal pressure excitation
and (iv) the net roof design wind load that generates as a result of coupling of attic internal
pressure and roof external pressure. It is shown that the fluctuation in external pressure is highly
correlated to of the fluctuation in the internal pressure. It is also noticed that partitioning of the
building has a significant impact in the variation of the intensity of internal pressure and hence
the net envelope design wind load. Moreover, the size of dominant openings (i.e., door and
window porosity ratio with respect to windward wall) influences the level of internal pressure
that develops both in the attic and living room of a low-rise building. From the present study it is
concluded that to reduce a potential probability building failure during strong storms, not only
windows and doors needs to be covered with shutters, but also vents (soffit) and ceiling hatches
needs to be covered.

3 ‐ 3
Table of Contents
List of figures .............................................................................................................................. 5
List of tables .............................................................................................................................. 10
1. Introduction ....................................................................................................................... 11
2. Methodology ..................................................................................................................... 14
2.1 Wind tunnel versus WoW........................................................................................... 14
2.2 WoW test building specimen design, construction and detailing ............................... 17
2.3 Equivalent analytical equation approximation for internal pressure .......................... 24
2.4 .Blockage and proximity effect .................................................................................. 28
2.4.1 Numerical assessment for blockage and proximity effect .................................. 29
2.4.2 Experimental assessment for blockage and proximity effect .............................. 35
2.4.2.1 Blockage assessment using small scale 1:8 WoW replica ............................. 35
2.4.2.2 Blockage assessment using full-scale WoW .................................................. 37
2.5 Internal and external pressure for Low-rise building with gable and hip roof ........... 43
2.5.1 Gable roof ............................................................................................................ 43
2.5.2 Hip roof ............................................................................................................... 50
3. Results and discussions ..................................................................................................... 54
3.1 Blockage and proximity effects .................................................................................. 54
3.1.1 Preliminary numerical assessment of blockage and proximity effects ............... 54
Outcomes of the numerical proximity and blockage assessment studies: ................................. 62

3 ‐ 4
3.1.2 Small-scale WoW (1:8) blockage ....................................................................... 62
Outcomes of the small-scale WoW (1:8 scale) and blockage assessment studies: .................... 63
3.1.3 Full-scale WoW assessment of blockage and proximity effects ......................... 64
Outcomes of the full-scale WoW blockage and proximity effect studies: .................................. 65
3.2 Internal and external pressure study ........................................................................... 65
3.2.1 Gable roof ............................................................................................................ 65
Outcomes of internal and external pressure study for the gable roof: ...................................... 78
3.2.2 Hip roof building ................................................................................................. 79
3.2.3 Effect of ventilation openings on attic internal pressure ..................................... 89
3.2.4 Net pressure analysis for wind load design ......................................................... 91
3.2.4.1 Net Pressure on the ceiling compartment ........................................................ 91
3.2.4.2 Net pressure on roof sheathing ........................................................................ 95
Outcomes of internal and external pressure study for the hip roof: ........................................ 103
4. Conclusions ..................................................................................................................... 104
5. Acknowledgments........................................................................................................... 106
6. References ....................................................................................................................... 107

3 ‐ 5
List of figures
Figure 1: Low-rise building with gable roof in front of WoW in a testing position ..................... 16
Figure 2: Hip roof building model in front of WoW apparatus ready for test .............................. 16
Figure 3: Conceptual model design; a & b) 3D model of gable building using SolidWorks, c & d)
details using AutoCAD (dimension in ft) ..................................................................................... 19
Figure 4: Compartmentalization; a) ground floor model, b) Elevation of gable building with
vertical and horizontal partitions (dimensions in ft) ..................................................................... 20
Figure 5: Building model from conceptual design to construction, fabrication and joining
components ................................................................................................................................... 20
Figure 6: Internal partitioning and electrical data acquisition system; ......................................... 21
Figure 7: Hatch construction; a) view from inside, b) dimensions (ft) of the hatch and interior of
building ......................................................................................................................................... 21
Figure 8: Vent opening location; a) Gable roof b) Hip roof ......................................................... 22
Figure 9: Underlayment nailing and shingle layering over roof; a) Gable roof b) Hip roof ........ 22
Figure 10: Hip roof building vent after installation (Left to right: Goose neck, Ridge, Turbine
and soffit) ...................................................................................................................................... 22
Figure 11: Gable end: a) vent openings) Louver window installation for gable end vent ............ 23
Figure 12: Ridge vent opening; a) Overview, b) close view of cut with shingle in place ............ 23
Figure 13: Pneumatic spring-mass-damper system (Nskape Curtesy of Illmari Karonen, 1992) 24
Figure 14: Air Slug Movement through an Opening and its Impression on the Building Envelope
....................................................................................................................................................... 26
Figure 15: Computational Domain (CD) and Boundary Conditions as defined by FLUENT ..... 30

3 ‐ 6
Figure 16: Sizes of test parallelepipeds and wind-fields at the inlet used for blockage assessment
....................................................................................................................................................... 33
Figure 17: Test cube windward face distances from the wind simulator (fans) for different
simulation cases (Hb, 2Hb, 3Hb, 4Hb, and 5Hb for Cases 4, 5, 6, 7 and 8 respectively). .............. 34
Figure 18: Comparison of mean wind pressure coefficients: Experimental measurements and
numerical simulations by using several turbulence models. (Bitsuamlak et al. 2009) ................. 35
Figure 19: Small scale WoW setup: a & b) wind simulator with model cube, c &d) Plexiglas
model setup with pressure tap arrangement. ................................................................................. 36
Figure 20: Blockage study (a) WoW test facility, (b) 5ft cube setup, (c) 7ft cube set up, and (d)
9ft cube model setup. .................................................................................................................... 37
Figure 21: Reference pressure distribution manifold inside one of the cubic building models ... 38
Figure 22: Mechanism of pressure transmission from building surface to data acquisition
computers ...................................................................................................................................... 38
Figure 23: External pressure taps location .................................................................................... 41
Figure 24: Internal pressure taps location ..................................................................................... 42
Figure 25: Exploded plan view of gable roof external pressure tap layout .................................. 45
Figure 26: Exploded view of internal pressure tap layout ............................................................ 46
Figure 27: Gable roof ventilation system pressure tap layout ...................................................... 47
Figure 28: Wooden hip roof model in front of Wall of Wind ..................................................... 51
Figure 29: Hip roof front elevation and roof conceptual design detail ......................................... 51
Figure 30: Exploded view of hip roof external pressure tap layout .............................................. 52
Figure 31: Exploded plan view of hip roof internal pressure tap layout ...................................... 53
Figure 32 Wind velocity contour plots for ABL and WoW simulation (continued). ................... 56

3 ‐ 7
Figure 33 Wind velocity contour plots for ABL and WoW simulation. ...................................... 57
Figure 34 Wind velocity path-lines and recirculation zones. ....................................................... 58
Figure 35 ABL and WoW mean Cp comparisons for Case 2 (4x4x3 m parallelepiped) ............. 59
Figure 36 ABL and WoW mean pressure coefficient comparisons for Case 1 (3x3x3 m cube) .. 59
Figure 37 ABL and WoW mean Cp comparisons for Case 3 (5x5x3 m parallelepiped) ............. 60
Figure 38 ABL and WoW mean Cp comparisons for Cases 4, 5, 6, 7 and 8 with wind tunnel data
from literature. .............................................................................................................................. 61
Figure 39: Comparison between small and full scale WoW tests for the 5ft, 7ft, and 9.5ft cubes
along with data from SILSOE....................................................................................................... 63
Figure 40: Mean pressure coefficients at the vertical center line of 5ft, 7ft and 9.5ft cube models
along with SILSOE data ............................................................................................................... 64
Figure 41: Internal pressure fluctuations inside living room: (a) Maximum, (b) RMS, (c) Mean
and (d) Minimum Cp values for test cases 1-5 ............................................................................. 69
Figure 42: Correlation of internal pressure response to the area averaged external pressure ....... 70
Figure 43: Ventilation openings with building: (a) at 90° and (b) at 15° angle of attack. ............ 70
Figure 44: External Pressure Variation for: (a) Right side gable vent .......................................... 72
Figure 45: Internal pressure fluctuations inside attic floor: (a) Maximum, (b) RMS, (c) Mean and
(d) Minimum Cp values for Test Cases 1-5 .................................................................................. 73
Figure 46: External Pressure Variation for: front soffit vents ...................................................... 74
Figure 47: External pressure coefficient at the openings of the living room)Averaged ............... 74
Figure 48: Power Spectra of Internal pressure for door opening (left) and window opening (right)
....................................................................................................................................................... 77

3 ‐ 8
Figure 49: Hip roof living room coefficient of internal pressure: a) Mean, b) RMS, c) Maximum,
and d) Minimum values. ............................................................................................................... 81
Figure 50: Hip roof model for Test case 3: a) at 15° and b) at 120° wind angle of attack (only
right side window open)................................................................................................................ 82
Figure 51: Maximum internal and external pressure distribution for test cases 2 and 3 .............. 82
Figure 52: Mean Internal and external pressure coefficient for test 2 cases and 3 ....................... 83
Figure 53: Attic floor coefficient of internal pressure: a) Maximum, b) RMS, c) Mean, and d)
Minimum values. .......................................................................................................................... 86
Figure 54: Ventilation openings number and location at 45 degree rotation ................................ 87
Figure 55: External pressure contribution of soffits: a) soffit No.1 & b) soffit No.2 ................... 88
Figure 56: Ventilation openings; a) two sides’ view of soffit mesh & b) top view of turbine,
gooseneck and ridge vent .............................................................................................................. 90
Figure 57: Attic internal pressure with and without ventilation opening ..................................... 90
Figure 58: Net ceiling internal pressure; a) Suction pressure & b) positive pressure on ceiling
compartment ................................................................................................................................. 92
Figure 59: Peak Cpi at ceiling partition a) Peak suction Cpi, and b) Peak positive Cpi ............... 94
Figure 60: Net pressure at roof corners causing severe uplift pressure ........................................ 95
Figure 61: Roof external pressure along the center length of the hip; a) tap location along center
of hip, b) 0 ° c) 45° & d) 90° wind angle of attack ....................................................................... 98
Figure 62: Roof external pressure along the center length of gable; a) tap location along center of
gable, b) 0 ° c) 45° & d) 90° wind angle of attack ........................................................................ 99
Figure 63: Roof internal pressure along the center length of hip; a) tap location along center of
hip, b) 0 ° c) 45° & d) 90° wind angle of attack ......................................................................... 100

3 ‐ 9
Figure 64: Roof internal pressure along the center length of gable; a) tap location along center of
gable, b) 0 ° c) 45° & d) 90° wind angle of attack ...................................................................... 101
Figure 65: Uplift force due to net pressure along: a) the center of the gable, b) the center of the
hip roof ........................................................................................................................................ 103

3 ‐ 10
List of tables
Table 1: Different types of ventilation systems with respect to their opening size Table 2: Building opening position, size and porosity description Table 3: Summary of test cases for gable roof model Table 4: Summary of test cases for hip roof model Table 5: Ventilation openings size and porosity ratio Table 6: Peak suction and positive pressure on the ceiling compartment

3 ‐ 11
1. Introduction
Design wind loads on building envelope (roofs, windows, doors, and walls), are a combination of
external and internal pressure. Internal pressure can contributes a significant portion to the total
design wind load (Irwin and Sifton 1998) depending on the opening size and location, shape of
the building and other aerodynamic factors. Particularly if wind-borne debris breaches a building
envelope it will lead to development of high internal pressure. Although significant work has
been done in boundary layer wind tunnels (BLWT) to assess the external pressure by different
researchers, relatively limited research is carried out to assess internal pressures limited to few
building opening scenarios. Internal pressure coefficients in buildings with openings in one wall
received a lot of attention starting in the 70’s mainly for structural applications. Aynsley et al.
(1977) investigated the impact of wall porosity on internal pressures. Stathopoulos et al. (1979)
carried out BLWT experiments in order to investigate the impact of various opening
configurations on internal pressures for different background leakage values, wall openings and
exposures. State of the art review was reported by Oh et al. (2007). Recently Karava (2008)
studied internal pressure at model scale for a dominant opening for natural ventilation purposes.
The present study will focus on internal and external pressure studies for low rise buildings.
According to ASCE 7-05, low rise-buildings (housing, small commercial and industrial
buildings) are defined as enclosed or partially enclosed buildings with mean roof height (h) less
or equal to 60 ft or roof height (h) not exceeding the least horizontal dimension. The assessment
of wind loads on low-rise buildings involves several factors such geometrical (aerodynamic),
construction method, surrounding buildings, upstream terrain, and geographical (hurricane prone
regions, coastal regions, main land etc). These factors can influence the development of internal
and external pressure on the building. The combined effect of internal and external pressure can

3 ‐ 12
cause minor to major building envelope failures such as roof, walls, shingle or other claddings
and/or structural failures (Holmes 1979; Stathopoulos et al. 1979; Liu and Saathoff 1981; Liu
and Saathoff 1983; Vickery 1986; Oh et al. 2007). The design wind pressure on each envelope
component (whether main wind resisting structural system or cladding and components) depends
on the sum of external and internal pressure that is generated over each component. According
to ASCE 7-05 (Section 6.5.12.1.2), the values of the external and internal pressures are
algebraically combined in order to determine the most critical load. The local peak wind loads
developing at building (roof, wall, soffit corners) and other “hot-spots” usually lead to the
initiation of failure unless properly evaluated by considering both external and internal pressures
into account and subsequently considered during the design process.
Compared to tall buildings, low rise-buildings are immersed within the layer of aerodynamic
roughness on the earth’s surface where the turbulence intensities are high (Holmes, 2001). These
kinds of complexities in aerodynamic conditions that characterize low rise-buildings are often
difficult to analyze due to the extreme fluctuation of wind pressure that develop within the
atmospheric boundary layer. The fluctuations in wind pressure are mainly attributed to two
sources, turbulent velocity fluctuations inducing internal to external pressure variation and local
vortex shedding in the separated flow regions near sharp corners, roof eaves and ridges causing
the formation of unsteady pressure.
Internal pressure: Internal pressure is the pressure that buildup inside a building due to openings
in the building envelope and in response to wind induced external pressure fluctuations. The
change in internal pressure results basically due to the infiltration or exfiltration of air from the
exterior of a building into its interior and vice versa due to the porosity of a building. The
porosity can, often, be due to cracks around doors, windows; openings at soffits, utility ducts and

3 ‐ 13
vents; or wind-borne breach of a building envelope. The inflow of wind through broken doors or
windows commonly leads to over pressurization of the internal dwellings unless otherwise there
is an equivalent opening in the leeward side to compensate the pressure development. Previously
carried out studies have indicated that the contribution of internal pressure to the total load is
very significant (Holmes 1979; Stathopoulos 1979; Irwin and Sifton 1998; Sharma et al. 2003 &
2005). Understanding the basic principles of internal pressure and knowing how it behaves with
different aerodynamic factors involved becomes essential to properly design the main frame
resisting structures, and claddings and components (Davenport and Slurry, 1984), as well as the
computation of infiltration/exfiltration of building systems and the migration of water (moisture)
through building envelopes.
A number of wind engineering tools are available to study wind induced pressure (both external
and internal). These include experimental boundary-layer wind tunnel studies; numerical
modeling based on computational fluid dynamics and other analytical approaches and very
limited full scale field measurements. Several factors affect the internal pressure in a complex
manner making analytical approaches very challenging and approximate. Wind tunnel
experiments and full scale tests on the other hand provide the industry with widely accepted
measurements. Compared to external pressure measurements, internal pressure measurements
are more complex (Liu 1990). Some of the major factors that influence the magnitude of internal
pressure generated in the interior of a building are: a) the fluctuations of external pressure
impacting the building, b) the size and position of dominant openings including background
porosity, c) the distribution of external pressure over the perimeter of the dominant opening, d)
wind direction and turbulence intensity, e) internal volume and compartmentalization, and f)
flexibility of the structure (Holmes 1979; Stathopoulos et al. 1979; Liu & Saathoff 1981, 1983;

3 ‐ 14
Vickery 1986; Vickery and Bloxham 1992; Oh et al. 2007). Simultaneous interactions of
aerodynamic, micro-meteorological, construction details and structural factors play a key role in
generating internal pressure fluctuations in response to the variation in the external pressure.
All of the above studies are based on single internal volume at model-scale, and limited opening
locations. In addition, proper method to convert model-scale data to a full-scale building needs to
be developed. Compartmentalized volume and various opening locations and scale issues
require further investigation using full-scale experiments. There are also inherent scale issues
related to the internal volume, background leakage etc that need to be addressed while studying
internal pressure in a BLWT experiments using small-scale models (1:200, 1:300 scales). These
scale issues are better addressed by using a new-state of the art full-scale testing facility, the
Wall of Wind (WoW) at the IHRC.
2. Methodology
2.1 Wind tunnel versus WoW
Traditionally, experimental investigations of wind/building interactions are performed using low
wind speed boundary layer wind tunnel testing methodology which is widely accepted by the
construction industry. Wind tunnel simulations are carried out on scaled building models that are
commonly scaled to 1:100, 1:200 and 1:400 in order to fit into the win d tunnel test section
without causing blockage. Although wind tunnels are the basis for most of the existing
knowledge, building code and standard provisions there are still some documented shortcomings.
For example, testing wind speeds and test building specimens are small compared to design wind
speeds and the actual building respectively thus violating Reynolds number similarity criteria.
There are additional constraints in wind tunnel while conducting tests for internal pressure

3 ‐ 15
measurement such as internal volume scaling, porosity modeling (for background leakage), and
compartmentalization effects. Furthermore, buildings are composed of various types of building
constructional materials with different wind performance capabilities. It is the interaction of all
such components within the building as a whole system that determines the performance of the
building under the actions of wind. As a result, a number of assumptions are made while
conducting wind tunnel testing.
The present study attempts to address some of these limitations by conducting external and
internal pressure studies on an actual large-scale low-rise building constructed following
prevalent Florida Construction methods. The test building is subjected to mean wind speed
45.26 mph using the full scale testing facility WoW as shown in Figure 1. FIU IHRC’s WoW is
located at Engineering Center is composed of six fans. It can generate a 24 ft wide and 16 ft high
wind field with a mean wind speed of 125 mph and can engulf a small size full-scale low–rise
building. This capability of the current WoW allowed conducting fundamental studies on
internal pressure studies on a low rise building structure built with real construction materials.
The major objective of the study is to evaluate the distribution of pressure fields over the surface
of the building’s envelope (on the gable and hip type roofing), both internally and externally, and
to identify the magnitude and direction of critical wind loads that instigate failure of envelope
components in the presence of various opening scenarios. Since the pre-fabricated model
consists of different background porosities, vents1 (gable end vents, soffit vents, roof vents such
as turbine and goose neck type), partitioning at ceiling level separating ground and attic floor, it
provides realistic opportunities to simulate and evaluate hurricane induced pressures on low -rise
1 Wind loads on the vents and water intrusion through them was the subject of another parallel study by Chowdhury et al. (2009).

3 ‐ 16
buildings and thus obtain valuable data to mitigate hurricane forces and emphasize on some
pressure preparedness measures such as covering windows, vents during hurricane etc.
Figure 1: Low‐rise building with gable roof in front of WoW in a testing position
Figure 2: Hip roof building model in front of WoW apparatus ready for test

3 ‐ 17
2.2 WoW test building specimen design, construction and detailing
Based on the study of blockage and proximity effect discussed in section 3.1.3 optimum size of
the test building specimen was identified. Thus, a 9ft W x 7ft L x 7ft H wooden fabricated model
with shingle roof, proper soffit and goose neck and turbine vents was designed and fabricated.
The building has two interchangeable roofing, gable and hip roof types as shown in Figure 1 and
Figure 2. The doors and the windows were designed to provide several dominant openings for
example by designing a secondary opening inside a door as shown in Figure 3d. Figure 3
describes the design in 3D SolidWorks rendering and 2D AutoCAD working drawings. Each
component of the building is designed and laid out in accordance with locally prevailing
construction methods and was detailed carefully to replicate realistic construction details.
Moreover, since the effect of external pressure in generating fluctuating internal pressure is
highly related to the dominant openings on the walls, properly designed windows and doors were
provided. In order to investigate the impact of dominant opening porosities, three door opening
areas were selected and fabricated accordingly (D1=3.24ft x 1.50ft, D2=2.16ft x 1.50ft and
D3=2.70ft x 0.75ft) as shown in Figure 3 d and Figure 6 a. Besides providing various sizes of
dominant openings, compartmentalization of the internal part of the building was another factor
that was given due consideration. In the design and fabrication process, the building model was
partitioned both vertically and horizontally (Figure 4 and Figure 6). The building was divided
into living room and attic by a ceiling and a folding wall was designed to divide the living room
into two halves along the wider length of the building as shown in Figure 6. A hatch opening
which is a common practice in low rise housing was provided on the ceiling in order to
investigate the transfer of wind load within the living room and the attic in the presence of
ceiling opening as shown in Figure 7. Another opening that was considered in the preparation of

3 ‐ 18
the model was the ventilation mechanism inside the attic floor. Vent openings are aimed at
keeping the attic dry and cool. However they also adversely cause high internal pressure to
develop inside the attic. In order to investigate the impact of vent openings, calculated areas of
openings were provided over the soffit, gable end, ridge and roof surface for both the gable and
hip roof building models (Figure 8 a and b). For both Gable and Hip roofs a representative roof
4:12 slope was selected (i.e. the roof pitch is taken to be 18.8°). Finally the roof envelope was
properly covered with underlayment and shingles. The laying and nailing of the underlayment
and shingles were done in accordance with the guides given by the Florida Building Code of
practice as shown in Figure 9.

3 ‐ 19
Figure 3: Conceptual model design; a & b) 3D model of gable building using SolidWorks, c & d) detailsusing AutoCAD (dimension in ft)

Figure 5:
Figure 4horizon
Building mode
4: Compartmetal partitions (
el from concep
entalization; a(dimensions in
ptual design to
a) ground flon ft)
3 ‐ 20
o construction,
or model, b)
, fabrication an
Elevation of
nd joining com
gable buildin
mponents
ng with vertic
cal and

Figure 7: H
Figure 6: I
Hatch construc
Internal partit
ction; a) view f
ioning and ele
from inside, b)
ectrical data ac
3 ‐ 21
) dimensions (f
cquisition syste
ft) of the hatch
em;
h and interior of building

Figure 8: Vent
Figure 10: Hsoffit)
Figure 9: Un
t opening loca
Hip roof buildi
derlayment na
tion; a) Gable
ing vent after
ailing and shin
roof b) Hip ro
installation (L
ngle layering ov
3 ‐ 22
of
Left to right: G
ver roof; a) Ga
Goose neck, Ri
able roof b) Hip
dge, Turbine a
p roof
and

Figure 11: G
Figure 12: R
Gable end: a) v
Ridge vent ope
vent openings)
ening; a) Overv
) Louver windo
view, b) close
3 ‐ 23
ow installation
view of cut wi
n for gable end
ith shingle in p
d vent
place

2.3
Theoretic
(1981) an
equivalen
analysis.
the follow
The first
through a
losses thr
displacem
of air (eq
their resp
Figure 13:
Equivalen
cal models f
nd Vickery (
ntly can be
Wind dynam
wing differen
term in the
an opening,
rough the op
ment of air s
qn. 1) repres
pective uniqu
Pneumatic sp
nt analytica
for a rigid fu
(1992). Gene
explained by
mic respons
ntial equatio
mass-spring
while the se
pening. The t
slug. Accord
ented by the
ue formulati
pring‐mass‐dam
l equation a
ull scale build
erally the fac
y the non li
e of a simpl
on.
g equation (
econd term d
third term is
ding to Holm
e spring syst
ons (Figure
mper system (
3 ‐ 24
approximati
ding is provi
ctors involve
inear analyti
le mass-sprin
(eqn. 1) desc
describes the
s the spring s
mes (1979), th
tem can be r
13). Thus, th
Nskape Curtes
ion for inter
ided by Holm
ed in the pro
ical formulat
ng damper s
cribes the in
e damping w
stiffness-resi
he differenti
ewritten by
he mass-spri
sy of Illmari Ka
rnal pressu
mes (1979),
opagation of
tion founded
system can b
nertia of the
which accoun
istance of in
al equation o
breaking the
ing equation
aronen, 1992)
re
Liu and Saa
f internal pre
d on mass-s
be represente
[1]
air jet that f
nts for the en
ternal pressu
of motion of
e three terms
n becomes:
athoff
essure
pring
ed by
flows
nergy
ure to
f slug
s into

3 ‐ 25
Δ [2]
It is assumed that a slug of air, of length Le, moves in and out of the opening due to the
compression and expansion of air during external and internal pressure interaction at an opening.
The variable X is, thus, the displacement of the slug of air from its initial or static equilibrium
position.
Helmholtz oscillation and its influence on internal pressure: The study undertaken by Holmes
(1979) on the building model investigated the relation between internal pressure and Helmholtz
resonance. Experimental studies undertaken by Holmes (1979) and Liu and Saathoff (1981) on
wind tunnel models with variable single dominant openings have shown that excitation of peak
internal pressure occurs close to the undamped Helmholtz frequency.
Helmholtz resonance equation derived by Helmholtz is given in eqn. (3) as:
[3]
Where fH represents the Helmholtz frequency; A is the area of the opening; n is the polytropic
exponent (equal to 1.4 for adiabatic air); Po is the reference pressure; ρ is the density of air and
Vie is the internal volume of the room. Holmes (1979) reported that a building with a single room
and single dominant opening behaves like a Helmholtz resonator and the compressibility of the
air in the room causes fluctuation of internal pressure ( Figure 14).

3 ‐ 26
Taking the second derivative of the coefficient of internal pressure with respect to the
displacement given in eqn. (2), according to Holmes (1979) and Vickery (1986), the mass-spring
formulation can be expressed in terms of the coefficient of pressure as:
[4]
Figure 14: Air Slug Movement through an Opening and its Impression on the Building Envelope

3 ‐ 27
Where q is the dynamic pressure; k is the orifice coefficient of the opening and Le is the length
of the air Slug at the opening; Cpi and Cpe represent the coefficient of internal and external
pressure respectively. By employing special form of Bernoulli equation, Liu and Saathoff (1981)
introduced a rigorous derivation of the internal pressure variation as shown in eqn. (5)
[5]
The only difference between eqn. 4 and 5 is the presence of orifice contraction coefficient in the
inertia term of eqn. 5. Moreover, when damping and inertia terms of eqn. (5) are set to zero, it
turns to the original Helmholtz equation with the introduction of k as shown in eqn. (6).
/
/ [6]
Liu and Rhee (1986) undertaken a thorough investigation to compare eqns. (3) and (6) and
ascertain the validity of each by using different flows with varying velocity profiles and
turbulence characteristics. Test was carried out in a boundary layer wind tunnel and the
experimental building model tested was a single room, block type, flat roof with internal
dimensions of 140 mm L x 140 mm D x 290 mm H. Variable sized square window openings
(0,10,20,30 and 40 mm L) were introduced on the windward and leeward walls. The spectral
analysis of the internal pressure fluctuations showed that the value of k varies between 0.75 and
0.99, with the average being 0.88. Unlike the previous experiments performed by (Holmes
(1979), Liu & Saathoff (1981)), in which case, the polytropic exponent was kept fluctuating in
order a fit in the system, an adiabatic condition (n=1.4) was considered during the analysis.

3 ‐ 28
The outcome of the analysis proved that both eqns. (3 and 6) give satisfactory results. However,
comparably, the experiment demonstrated eqn. (5) to be more reasonable since it keeps the factor
n=1.4 for a case of adiabatic process rather than fluctuating it in order to fit into the system as
used by eqn.(1) and that used by Holmes (1979). The experiment also revealed that the
Helmholtz peak resonance gets to be large as the size of the openings increase.
Even though the investigation was thorough, the experiment was performed while the model was
completely sealed in such a case the impact of background leakage to maximize the damping
effect at the Helmholtz peak was undermined. Thus, a further study should be performed to
verify if the results hold for a real building with its inherent porosity.
2.4 .Blockage and proximity effect
Testing larger test specimens within the finite WoW wind field, either to achieve Reynolds
number similarity or to assess performance of full-scale building components under wind, wind-
driven rain, and debris impact resistance, may entail blockage issues. The blockage effect
discussed in the present study is concerned with the size of the test specimen compared to the
finite size of the wind field generated at the inlet. The need to keep the test specimen as close as
possible to the wind simulator in order to subject the test model to strong wind before it diffuses
and loses its strength may also affect the quality of the aerodynamic data. The objectives of this
study are, therefore, to assess computationally (i) the blockage effect as a function of the size of
the test specimens, and develop correction strategies for those cases where those effects are
significant, and (ii) the wind simulator proximity effect for various distances between the wind
simulator and the test building, and develop proper test guidelines to ensure that this effect is
acceptably small.

3 ‐ 29
In the present study, relatively less expensive numerical wind flow simulations around
parallelepipeds of various sizes, and located at various distances from the wind simulator and
engulfed inside the numerical WoW and Atmospheric Boundary Layer (ABL) model have been
carried out. Based on the observations from the numerical confirmatory blockage and proximity
effect experiments were carried out by using the 1:8 scale small WoW replicas in conjunction
with the full-scale WoW. Previous computational blockage assessments for wind tunnels include
studies by Okajima (1997) pertaining to the effect of tunnel walls on various aerodynamic
features as mentioned earlier. In the present blockage and wind simulator proximity effect study,
however, the focus is on the effect of the size of the test buildings with respect to the finite size
of WoW wind field and test building’s proximity to the wind simulator. The WoW wind field
can for practical purpose be considered to be a wind jet generated by an array of fans with
controlled wind-profile characteristics. In the following sections the methodology adopted to
assess the blockage and proximity effects.
2.4.1 Numerical assessment for blockage and proximity effect
Numerical modeling
The commercial software FLUENT 6.2 was utilized for the present numerical simulation, and
the governing equations employed were the Reynolds Averaged Navier-Stokes (RANS)
equations, together with the Renormalization Group (RNG) k-ε turbulence model. For blockage
assessment studies, the upstream (U/S) , top, downstream (D/S), and two sides of the
computational domain (CD) were set to 3.5H, 7H, 10.5H, and 5.5H from the center of the base of
the parallelepiped, respectively, as shown in Figure 15, where H is the parallelepiped height
under investigation, as shown in Fig. 4. For wind simulator proximity assessments, cubical

3 ‐ 30
buildings with windward faces located at H, 2H, 3H, 4H and 5H from the wind source (fans)
were considered, as shown in Figure 17. For wall bounded flow, Fluent 6.2 provides two
different approaches for modeling flows in the inner viscous layer, i.e. use of wall functions or
near-wall modeling based on the non-dimensional wall units. The first grid point yp is placed at
0.01m from the surface of the test specimen and unstructured grids of hexagonal type were used
for the CFD simulation. Considering the computational cost in resolving the inner layer, standard
wall functions has been used in all present simulations by maintaining the wall unit y+ between
30 and 500. In addition, the inlet power law velocity profile with exponent α=0.25, a turbulence
intensity TI = 12%, and a 10 m integral length scale were assumed. The latter is less than the
typical accepted value for suburban terrain, owing to the need to limit to a minimum the
computational domain (CD) size -- assumed to be three times the length scale -- to reduce
computational time. These are reasonable assumptions considering the comparative nature of this
7H
H
5H
3H H
10H
5H
Top and side walls of CD
Symmetry (all cases)
WoW
Velocity
D/S CD face
Pressure outlet
Note: H= Test cube height
U/S CD face out side WoW
Velocity inlet (Cases 1A, 2A and 3A)
Figure 15: Computational Domain (CD) and Boundary Conditions as defined by FLUENT

3 ‐ 31
study. When simulating the ABL, the velocity inlet profile as described above was applied to the
whole upstream face of the computational domain. However, when simulating the WoW flow,
the application of the velocity inlet was limited to the 12 m x 9 m area of the U/S face of the CD
representing the WoW type wind-field condition, as shown in Figure 15; on the remaining inlet
area the atmospheric pressure condition was applied.
A segregated pressure-velocity solver has been used to all the discretization schemes. Pressure
interpolation is standard and second order upwind and third order MUSCL schemes were used
for convection and momentum terms respectively. The convergence criterion has been limited to
10-5.
For blockage assessment studies, computational models mimicking the WoW and the ABL test
model conditions were developed for the three cases shown below. It is to be noted that the
blockage effect discussed in the present study is concerned with the size of the test specimen
compared to the finite size of the wind field generated at the inlet (see Figure 16).
Case 1A - Base case for a 3x3x3 m (height x width x depth) cube placed in ABL wind-field
condition (for this case H=Hb=3m);
Case 1B - Same as Case 1A but placed inside WoW wind-field condition;
Case 2A - A 4x4x3 m (height x width x depth) parallelepiped placed in ABL wind-field
condition (H=1.33Hb);
Case 2B - Same as Case 2A but placed inside WoW wind-field condition;
Case 3A - A 5x5x3 m (height x width x depth) parallelepiped placed in ABL wind-field
condition (H=1.66Hb);

3 ‐ 32
Case 3B - Same as Case 3A but placed inside WoW wind-field condition.
For wind proximity effect studies, computational models mimicking the WoW and the ABL test
model conditions for the 3x3x3 m base cube were developed for the following three cases:
Case 4A – Windward face of base cube located at distance H from the wind simulator and placed
in ABL wind-field condition;
Case 4B - Same as Case 4A but placed inside WoW wind-field condition;
Case 5A - Windward face of base cube located at distance 2H from the wind simulator and
placed in ABL wind-field condition;
Case 5B - Same as Case 5A but placed inside WoW wind-field condition;
Case 6A - Windward face of base cube located at distance 3H from the wind simulator and
placed in ABL wind-field condition (note this case is the same as Case 1A);
Case 6B - Same as Case 6A but placed inside WoW wind-field condition (note this case is the
same as Case 1B);
Case 7A - Windward face of base cube located at distance 4H from the wind simulator and
placed in ABL wind-field condition;
Case 7B - Same as Case 7A but placed inside WoW wind-field condition;
Case 8A - Windward face of base cube located at distance 5H from the wind simulator and
placed in ABL wind-field condition;
Case 8B - Same as Case 8A but placed inside WoW wind-field condition;

3 ‐ 33
Figure 16 describes the relative size of the parallelepipeds relative to the WoW wind-field
(5Hbx3Hb) and the ABL wind-field (11H x 7H) for Cases 1 to 8, where Hb represents the height
of the base cube (Hb= 3m) and H represents the height of the study building for each case. Note
that the depth (along the wind flow direction) of all the parallelepipeds considered in the present
study is 3 m. Figure 17 describes the distances from the windward face of the study base cube
(3x3x3 m) from the wind simulator used for cases 4, 5, 6, 7 and 8. In all simulations the wind
direction was perpendicular to the upwind face of the parallelepiped. Although the parallelepiped
has simple geometry, it represents the complex bluff-body aerodynamic characteristics of a real
building. In addition, several experimental studies and results are available for parallelepipeds,
which allow the validation of results from the present study against values available in the
literature.
Computational Domain U/S face:
(also same as ABL wind‐field size:
WoW wind‐field size:
(Cases 1B, 2B and 3B)
Par.: Case 1
Par.: Case 2
Par.: Case 3
Hb
1.33Hb 1.66Hb
3Hb
7H
5Hb
11Hb
Figure 16: Sizes of test parallelepipeds and wind‐fields at the inlet used for blockage assessment

3 ‐ 34
Computational Domain U/S face:
(also same as ABL wind‐field size:
WoW wind‐flied size:
(Cases 4B, 5B, 6B, 7B, and 8B)
Cube: Case 7
Cube: Case 5
Cube: Case 4
Hb
3Hb
7Hb
2Hb 3Hb
4Hb 5Hb
Cube: Case 6
Cube: Case 8
Wind simulator
Figure 17: Test cube windward face distances from the wind simulator (fans) for different simulation cases (Hb, 2Hb, 3Hb, 4Hb, and 5Hb for Cases 4, 5, 6, 7 and 8 respectively).

3 ‐ 35
2.4.2 Experimental assessment for blockage and proximity effect
2.4.2.1 Blockage assessment using small scale 1:8 WoW replica
To verify the numerical assessment of blockage, a small scale study was carried out to study the
blockage and proximity effects experimentally using a small WoW (Figure 19) which is 1:8 scale
replica of the full-scale WoW.
Figure 18: Comparison of mean wind pressure coefficients: Experimental measurements and numerical simulations by using several turbulence models. (Bitsuamlak et al. 2009)

Three mo
cubes use
16 pressu
Plexiglas
Pressure
Figure 19: pressure ta
odel cubes w
ed in the ful
ure taps of
s with one en
measuremen
Small scale Wap arrangemen
were fabricat
ll scale study
0.39in long
nd of the tap
nts were carr
WoW setup: a &nt.
ted using Ple
y (i.e., a 1:8
g having 0.0
p being kept
ried out by u
& b) wind sim
3 ‐ 36
exiglas. Each
scale of 5ft
039in interna
t flush with t
using Scaniv
mulator with m
h model size
t. 7ft and 9.5
al diameter
the external
valve having
model cube, c &
e was a direc
5ft cubes). In
tubes were
envelope of
g a 16 port pr
&d) Plexiglas m
ct replica of
n the experim
inserted int
f the cube m
ressure scann
model setup w
those
ment,
o the
model.
ner.
with

2.4.2
In order
three cub
and were
Figure 20: Bsetup.
.2 Block
to investiga
bes (i) 5ft by
e instrumente
Blockage study
kage assessm
ate the size
y 5 ft by 5 ft
ed with inte
y (a) WoW te
ment using f
and proxim
, (ii) 7ft by 7
ernal and ext
est facility, (b)
3 ‐ 37
full-scale W
mity effects o
7ft by 7ft, an
ternal pressu
5ft cube setu
WoW
on the aerod
nd (iii) 9ft b
ure transduce
up, (c) 7ft cub
dynamic dat
y 9ft by 9ft
ers as shown
be set up, and
ta with certa
were constru
n in Figure 20
(d) 9ft cube
ainty,
ucted
0.
model

The inte
transduce
model. In
was plac
Pressure
Figure 2
eraction of t
ers located o
n analyzing t
ced at 12ft a
taps were
21: Reference p
Figure 22: Mecomputers
the building
on both of t
the effect of
and 16ft aw
constructed
pressure distri
echanism of pr
g envelope
the longitud
f the distance
way and rota
using copp
ibution manifo
ressure transm
3 ‐ 38
with the w
dinal and the
e between th
ated for a w
per tubes pa
old inside one
mission from bu
wind generat
e transversal
he building a
wind attack
assing throu
of the cubic b
uilding surface
ted is captu
l center line
and the WoW
angles of 0
ugh specific
uilding models
e to data acqu
ured by pre
s of the bui
W fans, each
0°, 45°, and
locations o
s
isition
essure
ilding
cube
d 90°.
of the

3 ‐ 39
building envelope. Pressure signal captured at the spot of typical copper tube is transmitted
pneumatically to the transducers through plastic tube (Figure 22). The length of the plastic tube
that connects the transducer to the copper tube varies between 4in and 8in. A centrally located
manhole is used to supply baseline pressure to each transducer (reference pressure). The manhole
is located at a distance sufficiently far from the WoW flow field in order to prevent disturbances
to the baseline pressure. The data is then transferred to a computer storage using a data
acquisition system.
Each cube model is aerodynamically tested by placing it at a distance of 12ft and 16ft in front of
the WoW . In order to capture the overall fluctuation of flow, separation and reattachment, each
building is tested for 0°, 45° and 90° wind angle of attack. The building models were secured
with hooks centrally so as to prevent the movement of the model during turbulent flow of wind.
A total of 32 SETRA transducers were allocated over the center line of the envelope of each
model. The pressure signals from all taps were low-pass filtered at 210Hz and sampled at a rate
of 100Hz for 60seconds.
On the 7ft cube model, additional internal pressure study was carried out in the presence of
dominant openings to determine the test duration and assess signal strength prior to the planned
internal pressure tests for low-rise buildings with gable and hip roofs. A dominant door opening
was provided on the windward side of the cube model and has a size of 13.5in x 54.8in making
10% of the windward wall area.
The entire model cubes were constructed to be air tight except for the minor porosities at
connections, door and window frame openings that make up the natural background leakages.

3 ‐ 40
In order to capture pressure data over the surfaces of the 7ft cube model, 68 transducers were
uniformly placed as shown in the external and internal tap layout sketch, (Figure 23 & Figure
24). Pressure transducers were placed both longitudinally and transversally along the center line
of the building to capture turbulent fluctuations, separation and reattachment of the external flow
(Figure 23). Moreover, in order to estimate the pressure fluctuations at the entrance of the
dominant openings, pressure taps were placed at the periphery of each opening so that the
average area is considered for analysis. More pressure taps were also placed internally to capture
the pressure fluctuations inside the building envelope.
External and internal pressures measured on the surfaces of the building model were used to
assess the net design pressures on the envelopes. For this purpose, two representative cases of
porosity were tested. These two cases are:
Case 1: Nominally sealed building wherein which the impact of background leakage
from cracks, fractures and other construction openings in generating fluctuation in
internal pressure is tested
Case 2: 10% door opening wherein which the impact of dominant opening is tested

3 ‐ 41
Each of the above mentioned cases were tested for wind direction 0≤θ≤90° at every 15° wind
angle of attack
Figure 23: External pressure taps location

3 ‐ 42
Figure 24: Internal pressure taps location

3 ‐ 43
2.5 Internal and external pressure for Low-rise building with gable and hip roof
The main objective of the present study, the internal and external pressure investigation for gable
and hip roof buildings, was performed using large low-rise building models as shown in Figures
9 to15. Design and fabrication details are discussed in Section 2.2. A low-rise building model of
size 9ft W x 7ft L x 7ft H with interchangeable roof was placed at 12ft distance from the WoW
front engines and secured with hooks centrally. The test model had gable and hip roof with a
slope ratio of 4:12. The internal volume of the building is divided into two compartments (attic
and living room) at ceiling level with a wood panel (7ft from the ground) and each compartment
volume is treated separately in evaluating the internal pressure that develop in it.
The building has two dominant openings: a door with size 3.15ft by 1.50ft and a window with
size 1.70ft by 1.40ft. These door and window openings make up 7.5% and 3.75% of the area of
the windward wall, respectively. A hatch opening that connects the attic with the living room, a
square hatch window, with size 1.5ft x 1.54ft was provided. The model was constructed in such a
way that it represents a house with tight connections except for nominal porosities. Rubber pads
were provided to all door and window jambs in order to reduce the leakage of air into the
building premises.
2.5.1 Gable roof
In order to capture pressure data over the surfaces of the gable house model, 68 SETRA
transducers were uniformly placed as shown in the external and internal tap layout sketch, Figure
25 & Figure 26 respectively. A total of 34 Pressure transducers were allocated both
longitudinally and transversally along the center line of the building envelopes to capture
external pressure fluctuations, separation and reattachment of flows externally (Figure 25).

3 ‐ 44
Moreover, In order to evaluate the pressure fluctuations at the entrance of the dominant
openings, pressure taps were placed at the periphery and center of each opening (a middle door
and an upstream edge window with 7.5% and 3.75% porosity respectively) so as to have
representative measurements for the respective area average analysis. A total of 31 pressure
transducers were allocated internally throughout the inside of the building at the living room and
the attic to capture the overall internal pressure fluctuations inside the building as shown in
Figure 26. Generally, external and internal pressures measured on the surfaces of the building
model were used to assess the net design pressures on the envelopes. The pressure signals from
all taps were sampled at a rate of 100Hz for 180 seconds.

3 ‐ 45
Figure 25: Exploded plan view of gable roof external pressure tap layout

3 ‐ 46
Figure 26: Exploded view of internal pressure tap layout

3 ‐ 47
As shown in Figure 27, the pressure fluctuation, both internal and external, around the
ventilation system was recorded by allocating transducers around each vent.
Regarding the configuration of the model geometry and transducer layout, the flow of wind is
said to be at right angle when the wall, onto which the door and the windows are fixed, is facing
the wind generated by the WoW. It is noteworthy to mention that the rotations of the models
were performed in a counterclockwise sequence. The mean wind speed generated by the WoW at
12ft distance away and mean ridge height of 7.16ft is 45.61mph (i.e., 20.39m/s).
As a common practice, most buildings are equipped with ventilation systems in order to provide
proper indoor air quality. Building performance guides such as Florida Building Code (FBC),
ASHRAE, Canadian Mortgage and Housing Corporation (CMHC) require the provision of
HVAC openings on the surface of roofing envelopes so as to effectively cross-ventilate attic
space between ceiling joists and roof rafters. FBC R4409.13.3.2, for instance, entail the
Figure 27: Gable roof ventilation system pressure tap layout

3 ‐ 48
provision of approved mechanical ventilation systems having a total opening area of at least
1/150th of that of the attic floor. To satisfy this requirement, the building model in our case was
equipped with soffit, roof and gable-end ventilation scheme. The roof ventilation system consists
of ridge, wind turbine and goose neck opening vents. The size of each ventilation opening and its
respective porosity ratio is as shown in Table 1. Commercially available Miami Dade County
approved ventilation systems (Goose neck, Turbine and Vent II-ridge) were used for the top roof
openings. For the soffit openings, a bird/insect screen with mesh sizes of ¼’’ were installed; two
at each side of the eave of the wooden building.
In undertaking the differential pressure analysis of the gable roof building, five test
configurations were setup as shown in Table 2 . Test case 1 is an arrangement of the model with
all of the openings closed except for the natural leakage. It is basically a nominally sealed
building scenario wherein which the impact of background leakage from cracks, fractures and
other construction openings in generating fluctuation in internal pressure is tested. Test case 2 is
a dominant door (D1) opened arrangement wherein which the door is located at the center of the
Table 1: Different types of ventilation systems with respect to their opening size

3 ‐ 49
windward wall having a porosity of 7.5%. Test case 3, on the other hand, is a pattern in which
case the dominant opening is a window (W1) instead of door. Unlike Test case 2, the W1 is
located at the upstream edge of the windward wall and its center line at a level (2/3)h from the
ground (apparently coinciding with the stagnation point). As shown in Table 2 , the porosity ratio
of the window opening is 3.75% with respect to the windward wall. Test case 4 is basically a
combination of windward door (D1) and hatch opening scenario. The hatch is located at the
ceiling partition that connects the attic with the living room. Similarly, Test case 5 is a
combination setup between windward window (W1) and hatch at the ceiling. The test cases and
configuration setups are given in Table 3 for the gable roof and Table 4 for the hip roof model.
Table 2: Building opening position, size and porosity description

3 ‐ 50
2.5.2 Hip roof
The full scale experiment on hip roof model was performed using the demountable building by
removing the gable roof and changing it by hip roof as shown in Figure 29 and Figure 28. The
overhang ratio (overhang length divided by eave height) of the building is 0.14 while the aspect
ratio (eave height/base width) is 0.77 on one side and 1 on the other side since it is rectangular.
A total of 69 SETRA transducers were used to capture both the internal and external pressure
distributions as shown in Figure 30 and Figure 31. In order to simulate the impact of external
opening area on internal pressure, two dominant openings (3% door and 7.5% window openings)
were incorporated in the experiment along with background leakage. Measurements of Test 1
(background leakage case), Test 4(door and hatch opening case) and test 5(Window and hatch
opening case) were obtained for five wind angle attack ranging from 0° to 90° at an increment of
15°. For Test 2(door opening case) and Test 3(window opening case), four more wind angles
were added from 105° to 180° as shown in Table 4 Similar to Gable roof orientation, the wind
direction is defined to be 90° when the wall of the building containing the dominant openings is
normal to it.
Table 3: Summary of test cases for gable roof model

3 ‐ 51
Figure 28: Wooden hip roof model in front of Wall of Wind
Table 4: Summary of test cases for hip roof model
Figure 29: Hip roof front elevation and roof conceptual design detail

3 ‐ 52
Figure 30: Exploded view of hip roof external pressure tap layout

3 ‐ 53
Figure 31: Exploded plan view of hip roof internal pressure tap layout

3 ‐ 54
3. Results and discussions
3.1 Blockage and proximity effects
3.1.1 Preliminary numerical assessment of blockage and proximity effects
Following the comparisons of the numerical simulations with results from the literature to
validate the accuracy of the numerical approach (as discussed in section 2.4.2.1), the blockage
assessments were pursued. The velocity contours for Case 1 are shown in Figure 32 a and Figure
33 b shows the contours on a horizontal plane at mid-height of the cube. Similarly, 33 (a) and
31(b) shows the contours on a vertical plane passing through the center of the cube. Figure 34
shows the path-lines for the recirculation zones for Case 1. Qualitatively, there is a general good
agreement in terms of size of recirculation length behind the parallelepipeds. Quantitatively,
Figure 36 shows mean pressure coefficient comparisons for Cases 1A (ABL) and 1B (WoW). As
can be seen from the figure, there is a very good agreement between the two cases. This confirms
the viability of using a proper wind-jet flows generated using the WoW system with proper
turbulence and boundary layer generation schemes representing the ABL conditions. Figure 35
and Figure 37 show similar results for Cases 2 and 3, respectively. Slight differences in mean
pressure coefficients (Cp values) were observed for Cases 2 and Case 3 at the roof and the
leeward wall. These differences could be due to blockage or inadequacy of the basic type of
turbulence model used in the present study. Finally, the wind simulator proximity assessments
were pursued. Similar to the blockage assessments, mean Cp values extracted from the center
vertical lines at U/S and D/S faces of the parallelepiped (i.e., AB and CD) and the center
horizontal line of the roof (i.e., BC) were used for comparison purposes. The mean Cp values for
Cases 4, 5, 6, 7, and 8 were compared with the wind tunnel data obtained from the literature as

3 ‐ 55
shown in Figure 38. There is a general good agreement between the CFD and the wind tunnel
data for Cases 5, 6, 7, and 8. For Case 4, however, the comparison reveals exaggerated Cp values
in the windward wall. This means that the pressure coefficients at the windward wall were
created by higher wind speed than the wind speed used to obtain the pressure coefficients. It is to
be recalled that the wind speed measured at H ft from ground (H= cube height) before placing
the cube in the testing position has been used to obtain the pressure coefficients. This is believed
to be due to the close proximity of the test cube to the wind simulator blocking the flow before it
expands upwards and to the sides. Because of this, a higher velocity created the pressure system
compared to the velocity used for obtaining the pressure coefficients. Compared to windward
wall, the roof Cp values were less sensitive to test building proximity to the wind simulator as
can be seen in Figure 38. The insensitivity of the roof pressures to the proximity of the wind
simulator is believed to be due to localized flow effects such as flow separation at the roof level,
which is less independent of the proximity parameter. For Cases 5, 6, 7, and 8, where the test
cube was placed at >2H distance from the wind simulator, the exaggerated positive pressure
disappeared. Thus, it may be concluded that in order to obtain a good quality aerodynamic data
on walls, the models needs to be placed at a distance of more than 2H from the wind simulator or
conduct detail blockage correction factor studies. However, for roof or roof top equipment tests
the aerodynamic data are less sensitive to the proximity of the test-specimen to the wind
simulator.

3 ‐ 56
(a) Case 1A (ABL) – Horizontal plane at mid‐height of the parallelepiped.
(b) Case 1B (WoW) – Horizontal plane at mid‐height of the parallelepiped.
Figure 32 Wind velocity contour plots for ABL and WoW simulation (continued).

3 ‐ 57
(c) Case 1A (ABL) – Vertical plane at the center of the parallelepiped.
(d) Case 1B (WoW) – Vertical plane at the center of the parallelepiped
Figure 33 Wind velocity contour plots for ABL and WoW simulation.

3 ‐ 58
Case 1A (ABL)
Case 1B (WoW)
Figure 34 Wind velocity path‐lines and recirculation zones.

3 ‐ 59
-2
-1.5
-1
-0.5
0
0.5
1
1.5
2
0 0.5 1 1.5 2 2.5 3
Cp
Case 1A (ABL)
Case 1B (WoW)
A B C DFigure 36 ABL and WoW mean pressure coefficient comparisons for Case 1 (3x3x3 m cube)
-2
-1.5
-1
-0.5
0
0.5
1
1.5
2
0 1 2 3 4 5 6 7 8 9 10 11
Cp
Case 2A (ABL)
'Case 2B (WoW)
A B C D
Figure 35 ABL and WoW mean Cp comparisons for Case 2 (4x4x3 m parallelepiped)

3 ‐ 60
Figure 37 ABL and WoW mean Cp comparisons for Case 3 (5x5x3 m parallelepiped)
-2
-1.5
-1
-0.5
0
0.5
1
1.5
2
0 1 2 3 4 5 6 7 8 9 10 11 12 13
Cp
Case 3A (ABL)
Case 3B (WoW)
A B C D

3 ‐ 61
-2
-1.5
-1
-0.5
0
0.5
1
1.5
2
Cp
Case 4A (ABL)
Case 4B (WoW)
Case 5A (ABL)
Case 5B (WoW)
Case 6A (ABL)
Case 6B (WoW)
Case 7A (ABL)
Case 7B (WoW)
Case 8A (ABL)
Case 8B (WoW)
Wind tunnel (Holscher et al., 1998)
Wind tunnel (Richards et al.,2007)
Full-Scale (Richards et al.,2007)
A B DC
Figure 38 ABL and WoW mean Cp comparisons for Cases 4, 5, 6, 7 and 8 with wind tunnel data from literature.

3 ‐ 62
Outcomes of the numerical proximity and blockage assessment studies:
• WoW flows can replicate atmospheric boundary flows.
• For large test models, i.e. for cases where the height of the test model is larger than one third
of the wind field height, carrying out proper blockage assessments is necessary.
• Test buildings shall be preferably located at least 2H from the wind source (fans). If the
model is placed closer than 2H, the quality of the aerodynamic data particularly in the
windward wall can be compromised and appropriate correction needs to be applied. The roof
aerodynamic data appears less sensitive compared to the windward wall.
3.1.2 Small-scale WoW (1:8) blockage
Based on the observations from the numerical simulation a blockage assessment using the small-
scale WoW (1:8 scale) was pursued to experimentally assess and ascertain the blockage effects.
The mean external pressure distribution obtained along the center line of the small scale models,
i.e. 1:8 scaled models of the corresponding full-scale WoW models is shown Figure 39. The
comparison of results among (i) SILSOE Cube test from literature (Richards et al. 2007), (ii) the
present small-scale WoW tests (i.e. 1:8 scale replica of a 5ft, a 7ft, and 9.5 ft cubes), and (iii)
full-scale WoW tests (i.e. for 5ft, a 7ft, and 9.5 ft cubes) shown in Figure 39 indicate the
following: the overall mean external pressure distribution along the center line of the cube
model is similar to that of the full scale WoW data; of the three models tested, the 7ft and 5ft
cube models show the same pattern of flow field in both the small and full scale WoW
experiment; and the 9.5 ft cube results deviates both from the other cubes as well as the SILSOE
cube results.

3 ‐ 63
Outcomes of the small-scale WoW (1:8 scale) and blockage assessment studies:
• Experimental (at low Reynolds number) and numerical simulation results consistently
indicated the need to carefully select the size of the test specimen
• The 7ft cube model was identified to be a good size for further study using the current 6-fan
WoW.
Figure 39: Comparison between small and full scale WoW tests for the 5ft, 7ft, and 9.5ft cubes along with data from SILSOE

3 ‐ 64
3.1.3 Full-scale WoW assessment of blockage and proximity effects
In this section blockage and proximity effect results obtained experimentally by using the full-
scale WoW is presented. The objective of this experiment is determining the appropriate size
(with less blockage effects) of the test specimen and the distance of the test specimen form the
wall of wind (with less proximity effects) to be used for the proposed internal and external
pressure investigation. The external pressure data obtained for each of the 5ft, 7ft, and 9.5ft
cubes were compared among each other and with the results obtained from SILSOE full-scale
measurements (Richards et al 2007). Figure 40 shows the mean external pressure distribution
comparisons along the center line of each of the cubes when the wind angle of attack is 90°. It is
observed that the external pressure on the windward wall is equivalent to that of the SILSOE
data particularly for the 5ft and 7ft cubes at 12ft distance while the results for the 9.5 ft cube
Figure 40: Mean pressure coefficients at the vertical center line of 5ft, 7ft and 9.5ft cube models along with

3 ‐ 65
deviated from SILSOE. On the roof and leeward side, however, the mean external pressure on
the cubes undergoes early reattachment as compared to that of SILSOE test. This difference
might be due to the higher turbulence use for the case of the flow field of the cube models
compared to the SILSOE model which is located in open field. It is also noteworthy to mention
that SILSOE measurements provide higher Cp values on the lee-ward walls compared to
literature values such as those observed from Texas Tech full-scale measurements (Levitan et al.
1991).
Outcomes of the full-scale WoW blockage and proximity effect studies:
• A model size with a representative 7ft dimension located at 12 ft from the WoW is finally
selected for the internal and external pressure study.
• More specifically a low-rise building model of size 9ft W x 7ft L x 7ft H with
interchangeable gable and hip roofs placed at 12ft distance from the WoW was identified to
be an optimum size that for further study using the current 6-fan WoW.
3.2 Internal and external pressure study
3.2.1 Gable roof
Internal pressure in the living room: The internal pressure study inside the living room of the
gable building model were carried out by using multiple transducers ( a total of ten) uniformly
distributed inside the interior of the building. As shown in Table 4, a total of 5 test cases were
performed. All of the five cases were tested for wind attack angles of 0°, 15°, 45°, 75°, and 90°.
In addition, test cases 1, 3, and 5 were tested for two more additional attack angles (105° and
120°) included mainly due to the window’s (W1) off-center location. The results from the test

3 ‐ 66
(Figure 41) show that the coefficient of internal pressure (Cpi) reaches peak value when the wider
face of the building is almost normal to the direction of the wind flow.
Internal pressure coefficients for test case 1, where all of the dominant openings are closed and
the coefficient of internal pressure fluctuation developed only due to background leakage, are
relatively small compared to all other cases studied. Since most of the nominal background
leakage took place through the wall that contains the door and windows (inside the living room),
considerable internal suction pressure develops when this wall is parallel with the direction of
wind( wall with door and windows is arranged as side wall for an angle of attack of 0°).
Moreover, increased positive internal pressure coefficient is observed as the building is rotated to
90° location (i.e. the wall with a door and windows on windward side ) and this is mainly due to
the fact that background infiltration in the windward wall coupled with literally no exfiltration in
the leeward side of the building envelope which leads to some positive pressurization inside the
building. The impact of the background leakage alone on internal pressure relatively is not
significant.
It is observed that the peak values of the coefficients of internal pressure occur when the
dominant openings of the building face the WoW for a wind attack angle of about 75°. It was
observed that the maximum internal pressure coefficient for open door case is in the order of
500% higher compared to the closed case (i.e. only with background leakage). This explains the
importance of proper covering doors and windows with shutters (or other means) during storms
is not only to protect the doors and windows themselves but also to avoid a potential failure the
property due to high internal pressure developments.

3 ‐ 67
Comparing the various test cases among each other, test case 3 (3.5% window opening)
produced the highest positive and suction (i.e. negative) internal pressure fluctuations as shown
in Figure 41 (a) and (d) respectively. Even though the door opening with a higher porosity of
7.5% (test Case 2) was expected to result in a peak Cpi value compared to the window case, the
measured data show comparatively lower value for all of the analyses. This is believed to be due
to the location of the two openings on the wall. The following observation is made with regard to
the increased positive pressure, The door is located at a lower elevation while the window,
although the size is smaller (3.5% versus 7.5%), is located at higher level coinciding with the
point of stagnation where the maximum external pressure develops, and the internal pressure
responds to this peak fluctuations almost instantaneously as shown in Figure 26. This was also
deduced by examining the coefficient of external pressure that develops over the periphery of the
window and the door as shown in Figure 42. In order to properly capture representative external
pressure data from the dominant openings, the area-averaged pressure was adopted by installing
six pressure transducers at the periphery of the door and two pressure transducers for the
window. Beyond the 90° rotation, the positive internal pressure coefficient for window opening
decreased compared to that of the door opening. The following observation is made with regard
to the increased suction (i.e. negative pressure) due to the distance of these two dominant
openings from the upstream wall corner when the wall containing the door and the window is
tested as a side wall (i.e. 0° angle of attack). The window is closer to the upstream edge of the
windward wall (0.95 ft from upwind wall corner) and this is aerodynamically higher suction
zone compared to the location of the door which is 3.7 ft away from the edge.
Another observation is the decrease of the internal pressure inside the living room as the hatch is
opened along with the door (test case 4) or the window (test case 5). When the partition that

3 ‐ 68
separates the living room from the attic is removed (i.e., opening the hatch), the volume of the
living room increases. The size of the dominant door or window opening, however, is kept the
same for all cases. With the blockade of the ceiling partition, the volume of the living room is Vl
= 609126.91 in3 while the attic floor accounts for a volume of approximately Va = 95992 in3.
This represents a 15.75 % volume increase when the ceiling hatch is opened. The major impact
from the additional attic volume is the increase in damping effect inside the living room as
compared to that of the closed hatch cases. The results obtained from the experiments reflect the
effect of partitioning with respect to different types of openings as shown in Figure 41 (a-d). For
example the maximum internal pressure coefficient in the living room for open door case with
open ceiling hatch case is 26% lower compared to a similar case but with a closed ceiling hatch.
It is also noteworthy to mention that the instantaneous response of the internal pressure to the
area averaged external pressure over the dominant openings (door and window) is closely
correlated as expected, as shown in Figure 42. As depicted in Figure 42 the correlation between
the internal and external pressures as a result of the door opening (7.5%) is lower than that of the
window opening (3.5%).

3 ‐ 69
Figure 41: Internal pressure fluctuations inside living room: (a) Maximum, (b) RMS, (c) Mean and (d) Minimum Cp values for test cases 1‐5

F
Figure 4
Figure 43: Ven
a
42: Correlation
ntilation openi
n of internal pr
ngs with build
ressure respon
ding: (a) at 90°
3 ‐ 70
nse to the area
and (b) at 15°
b
a averaged ext
angle of attac
ternal pressure
ck.
e

3 ‐ 71
Attic floor: Unlike the internal pressure fluctuations inside the living room, the pressure
distribution inside the attic is composed of two peak points. As shown in Figure 45(a-d). The
peak positive internal pressure coefficient occurs at about 45° angle of attack when only door or
window is opened (i.e., test cases 2 & 3). The occurrence of the peak value shifts to 75° angle of
attack when both the door and ceiling hatch or window and ceiling hatch are opened at the same
time (i.e., test cases 4 and 5, respectively). The results obtained clearly show the impact of
compartmentalization on both positive and negative internal pressures inside attic floor. The
internal pressure in the attic floor is affected by ventilation openings (such as gable end, turbine,
goose neck and soffit vents) and the ceiling hatch as shown in Figure 43 coupled with the
different wind angles of attack. For test case 2 (where only door is opened) and test case 3
(where only window is opened), the internal pressure generated inside the attic floor is governed
by the infiltration of air through the front and rear soffit, right and left side gable end ventilation
system, and the background leakage through the ceiling partition. The contribution of the right
side Gable end ventilation system is significant when the building model is at 0° angle of attack
(i.e. wind is perpendicular to the vent opening). However, as the wind changes to other oblique
directions, its impact reduces gradually as shown in Figure 45. At the same time, the contribution
of the front soffit begins to build up (Figure 46) as the model is rotated in which case the wall
containing the dominant openings and the front soffit vent faces the WoW. On the other hand,
the magnitude of the suction inside the living room as a consequence of the external pressure
averaged over the dominant openings (either door or window) is significantly higher at 0° angle
of attack a Cpi of -1.5 for test case 2 (open door) and -2.2 for test case 3 (open window). The
magnitude decreases to a Cpi of -0.75 when the building is rotated to 45° and it peaks up for wind
angles of attack beyond the 45°, forming a bell shaped curve as shown in Figure 47

3 ‐ 72
Figure 44: External Pressure Variation for: (a) Right side gable vent

3‐73
Figure 45: Internal pressure fluctuations inside attic floor: (a) Maximum, (b) RMS, (c) Mean and (d) Minimum Cp values for Test Cases 1‐5

3‐74
Figure 47: External pressure coefficient at the openings of the living room)Averaged
Figure 46: External Pressure Variation for: front soffit vents

3‐75
The pattern of positive internal pressure test i.e. test cases 2 (open door) and 3 (open window)
inside the attic are related to the suction pressure inside the living room, when the attic positive
pressure surges as the suction pressure weaken.
For test cases 4 (open door and open hatch) and 5 (open window with open hatch), the trend of
attic internal pressure differs from that of test cases 2 (open door only) and 3 (open window
only) due to the opening of the ceiling hatch. While the opening of the ceiling hatch results in
dampening of the internal pressure in the living room due to the increase in the volume, however,
inside the attic the internal pressure increases since the fluctuation in external pressure around
the dominant openings is propagated into the attic through the open ceiling hatch. Since the peak
external pressure at the windward wall occurs at a 750 angle of attack the attic internal pressure
also follows the same trend and reaches its peak value at the same wind angle of attack.
The peak value of positive internal pressure inside the attic is comparatively less when the hatch
is closed. In this case the internal pressure development is mainly due the ventilation systems
(gable end, goose neck, turbine, soffit vents) and other nominal background leakages. The hatch
opening causes the propagation of the pressure from the living room to the attic resulting in a
higher internal pressure in the attic while dampening the internal pressure in the living room. The
dampening of internal pressure inside the living room is shown in Figure 41 a, where opening of
the door and ceiling hatch or window and ceiling hatch leads to a reduction of peak Cpi from 3.0
to 2.25 and from 2.4 to 1.6 respectively. For the attic floor, however, similar conditions cause an
increase in Cpi from 0.5 to 0.75 for the opening of the door and ceiling hatch case and from 0.9 to
1.0 for the window and ceiling hatch case as shown in Figure 45 a.

3‐76
From net design wind load (i.e. combined external and internal pressure) point of view, the
magnitude of the internal pressure that develops inside the attic roof is significant as it might lead
to an increased peak wind load on roof sheathing. Thus, it is preferable to seal ceiling hatch
during strong storms. For example, the opening of the window together with ceiling hatch led to
45%increason the net wind load on the windward side of the gable roof. This reinforces the need
for keeping doors and windows covered with shutters during strong storms.
Helmholtz resonance: Computing the Helmholtz resonance using the numerical equation given
in eqn. (3) also presented here for completeness:
The values of the parameters for the Gable roof low-rise building considered in this section are
as follows:
γ = 1.4 ratio of specific heat for air (adiabatic condition is considered)
A = 0.439 m2 for door and 0.219 m2 for window
Po = 101284.6 Pa in Miami area
ρ = 1.25 Kg/m3, air density
Le = Lo + 0.89√ = 0.6913 m (door) and 0.5181 m (window)
Vie = 9.982 m3 (living room only)
Therefore, the measured Helmholtz frequency is
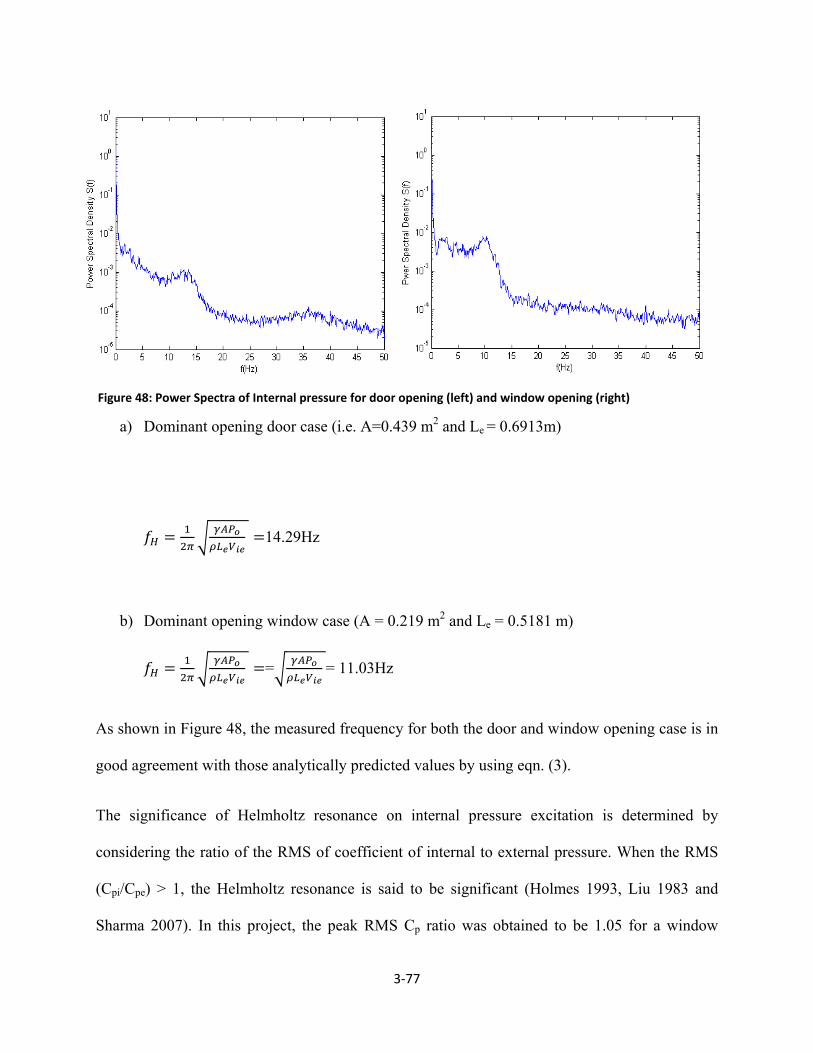
3‐77
a) Dominant opening door case (i.e. A=0.439 m2 and Le = 0.6913m)
14.29Hz
b) Dominant opening window case (A = 0.219 m2 and Le = 0.5181 m)
= = 11.03Hz
As shown in Figure 48, the measured frequency for both the door and window opening case is in
good agreement with those analytically predicted values by using eqn. (3).
The significance of Helmholtz resonance on internal pressure excitation is determined by
considering the ratio of the RMS of coefficient of internal to external pressure. When the RMS
(Cpi/Cpe) > 1, the Helmholtz resonance is said to be significant (Holmes 1993, Liu 1983 and
Sharma 2007). In this project, the peak RMS Cp ratio was obtained to be 1.05 for a window
Figure 48: Power Spectra of Internal pressure for door opening (left) and window opening (right)

3‐78
opening case at 90° wind angle of attack. This shows that, for the above specified living and attic
volume and the area of the dominant openings, the Helmholtz resonance is barely significant to
cause internal pressure amplification.
Outcomes of internal and external pressure study for the gable roof:
• Peak positive internal pressure occurs when a dominant opening of the building faces the
incoming wind flow.
• Peak negative internal pressure occurs when a dominant opening of the building are in
parallel to the incoming wind flow.
• Dominant openings resulted in an increase internal pressure. For example, the opening of
the window together with ceiling hatch led to 45%increason the net wind load on the
windward side of the gable roof. This reinforces the need for keeping doors and windows
covered with shutters during strong storms.
• Opening of a hatch along with the window and door causes an increase in the internal
pressure of the attic roof which reveals the importance of sealing ceiling hatches during
strong storms to protect the roof and the building.

3‐79
3.2.2 Hip roof building
Internal pressure in the living room: The internal pressure study inside the living room of the
hip roof low-rise building model were carried out, similar to the gable roof, by using multiple
transducers ( a total of ten) uniformly distributed inside the interior of the building. As shown in
Table 5, a total of 5 test cases were performed. The test cases applied to the hip roof building are
similar to those explained in section 3.2.1 for gable roof. In Figure 49, the mean, RMS,
maximum, and minimum coefficients of internal pressures are plotted for all test cases for
multiple wind angle of attack. As shown in Figure 49 a and c, the mean and maximum positive
internal pressure coefficients (Cpi) both for test cases 2 (door opening) and 3 (window opening)
reach their peak values when the incoming wind is perpendicular to the opening. Unlike the
gable roof building, the internal pressure inside the living room is comparatively higher for
opened door case compared with open window case for wind angle of attack ranging between 0°
and 90°. Beyond 90° angle of attack (i.e. the windows and doors becomes parallel to the wind
and negative pressure –suction-- develops inside the building), the living room Cpi for open
window case becomes larger over that of the door. This is believed to be due to wind flow
separation closer to the leading edge of the wall where the windows are located. As depicted in
Figure 50 a, for instance, the opened window (right side) is located at upstream corner of the
building compared to the door and the separation of the flow that develops over this region can
easily be observed. Beyond the 90° wind angle of attack, the right side window becomes part of
the flow reattachment region as compared to the door. The same pattern of flow condition was
observed for external pressure captured at the periphery of the door and window (Figure 51 ).
For the external pressure at the dominant door, a total of six pressure taps (five at the periphery
and one at center) was used to determine the area averaged external pressure at the door. The

3‐80
external pressure data at the center of the door was obtained while undertaking closed door cases.
For the window opening case, area averaged external pressure is obtained by allocating two
pressure taps at the periphery as shown in Figure 30.
Another observation is that the peak positive internal pressure tends to occur at about 45° and
105° angle of attack for the door opened case and at about 15° and 135° angle of attack for the
window opened case (Figure 51). For all of the simulations undertaken, the minimum mean
internal pressure (Cpi) and area averaged external pressure (Cpe) is measured at about 75° angle
of attack for test case 3 (for opened window only) and at about 90° angle of attack for test case 5
(window and hatch), as shown in Figure 49.
Table 5: Ventilation openings size and porosity ratio

3‐81
Figure 49: Hip roof living room coefficient of internal pressure: a) Mean, b) RMS, c) Maximum, and d) Minimum values.

3‐82
Figure 50: Hip roof model for Test case 3: a) at 15° and b) at 120° wind angle of attack (only right side window open)
a b
Figure 51: Maximum internal and external pressure distribution for test cases 2 and 3

3‐83
Attic floor internal pressure Similar to the gable roof building described in section 3.2.1, the hip roof building is
compartmentalized by separating the living room from the attic using a ceiling partition. A
ceiling hatch of size (18 in by 18.5 in) is also provided. The effect of the load transfer to the attic
floor is twofold. In one hand, it allowed the internal pressure to propagate the internal pressure to
from the living room to the attic floor resulting in high internal pressure inside the attic. On the
other hand the internal pressure inside the living room decreases due to the dampening effect of
the increased volume created due to the opening of the ceiling hatch (livening room volume +
attic volume). The reduction in internal pressure fluctuation that results from opening of a hatch
is governed by the volume of the attic floor and the opening area of the hatch itself. However
Figure 52: Mean Internal and external pressure coefficient for test 2 cases and 3

3‐84
since roofs are the most vulnerable component of residential buildings, the increase in internal
pressure is more critical and needs to be avoided by closing the ceiling hatches during strong
storms.
Attic floor internal pressure distribution analysis was performed by taking the average pressure
obtained from the three center line transducers along the length of the building located
underneath the roof sheathing (i.e., taps number 02, 06, and 10 as shown in Figure 31). As
described previously, the attic floor contains ventilation systems (i.e., soffit, ridge, turbine, and
goose neck vents). The presence of these ventilation openings have significant influence on the
level of internal pressure that generate inside the attic floor depending on the location of the
vents and the direction of the wind. Figure 53 depicts the effect of the internal pressure inside
the attic floor. Generally, it is observed 45° angle of attack generates peak positive coefficient of
internal pressure (0.43) for both door and window opened case with ceiling hatch. The mean
internal pressure inside the attic floor is below zero for all of the wind angles of attack simulated
and goes to lowest minimum value (suction) when the building is positioned at a 75° wind angle
of attack. For test cases 2 (open door only) and 3(open widow only), the peak positive internal
pressure fluctuation ranges between 0.25 and 0.35 as shown in Figure 53a. Figure 53 b shows the
negative internal pressure inside the attic is significant for the door or window opened case
without hatch and goes to lowest a minimum value of -0.56 between 15° and -45° wind angles of
attack.
The peak attic internal pressure measured at oblique 45° angle of attack is due to the result of the
wide surface area of the wind sees for hip roof building at this orientation coupled with the
positive pressure contribution that the roof gains from the four soffit vents (No.1,2,3, and 4) as
shown in Figure 54 and Figure 55. The same pattern of flow condition is observed when the

3‐85
building is positioned at about 135° where the soffit vents (No. 1, 2, 7, and 8) play a significant
role in generating positive pressure fluctuations inside the attic floor.

3‐86
Figure 53: Attic floor coefficient of internal pressure: a) Maximum, b) RMS, c) Mean, and d) Minimum values.

3‐87
Figure 54: Ventilation openings number and location at 45 degree rotation

3‐88
Figure 55: External pressure contribution of soffits: a) soffit No.1 & b) soffit No.2

3‐89
3.2.3 Effect of ventilation openings on attic internal pressure
Most low-rise buildings are equipped with ventilation systems for the purpose of keeping the
attic floor cool and dry. A properly installed venting system provides comfort to the ventilated
rooms and improves the durability of the structural members. Improperly fixed vent systems also
become a cause for the accumulation of moisture and wind driven rain entry point that can
eventually lead to the formation of molds and other health hazards. In this project, the effect of
the ventilation openings on the attic internal pressure is studied by undertaking two separate tests
on the hip roof building model: one with complete ventilation system (ridge vent, soffit, turbine
and goose neck) and the other with blocked vent openings. A companion study by Chowdhury et
al. (2009), funded by FL DEM, has investigated the water intrusion through the vents. Detail
discussion on the application of WoW for water intrusion study is presented by Bitsuamlak et al.
2009.
As shown in Table 5, the soffit porosity ratio is comparatively larger than the other vents on the
roof surface. Two rectangular openings with size 4.375 in by 14.375 in were used in each
overhang (total eight) as shown in Figure 56. As shown in Figure 57, the presence of the
ventilation slightly increased the positive internal pressure that develops inside the attic floor and
significant increase on the negative pressure. Due to the location of the vents which is mostly on
the part of the buildings that sees significant negative external pressure explains why the vents
caused relatively higher negative internal pressure compared to their effect on the positive
pressure.

3‐90
Figure 57: Attic internal pressure with and without ventilation opening
Figure 56: Ventilation openings; a) two sides’ view of soffit mesh & b) top view of turbine, gooseneck and ridge vent
a b

3‐91
3.2.4 Net pressure analysis for wind load design
The relationship between the peak internal and external pressures is necessary in the assessment
of design wind loads for buildings. The combined effect of the external and internal wind
pressure acting in the same direction simultaneously may cause overloading of the envelopes and
hence could initiate failure under strong storms.
3.2.4.1 Net Pressure on the ceiling compartment
The net pressure on hip roof produces resulting from the simultaneous pressure fluctuation inside
the attic and the living room causing stress over the ceiling surface. When positive and suction
pressures occur concurrently on the ceiling member that separates the attic from the living room,
critical pressure combination may develop over the ceiling compartment as indicated by Figure
58 a & b. During the construction of low-rise buildings, it is a common practice to build ceiling
partitions from aluminum frames or metal strips and loose box panels hooked to roof members.
This practice would facilitate the malfunctioning of the ceiling compartment in the presence of
net critical coupled pressure. The net pressure can be used as design wind load, should the
designer decided to make firm ceilings. It is also worth noting during the present study (see
Figure 53), the presence of ceiling hatch (18 in x18.5 in) has caused a surge in attic internal
pressure which needs to be avoided to decrease the total net pressure on the roof sheathing.

3‐92
In order to investigate the probable peak pressure that develops on the ceiling compartment due
to the net effect of pressure inside the attic floor and living room (ceiling), net internal pressure
computation is performed as follows
[7.a]
[7.b]
Figure 58: Net ceiling internal pressure; a) Suction pressure & b) positive pressure on ceiling compartment

3‐93
Equation 7 a represents the downward force exerted onto the ceiling partition as shown in Figure
58 a while equation 7b represents an upward force as shown in 58 b.
Table 6 depicts the results of the net internal pressure computation for each test case simulated
with its respective angle of attack. Since the analysis is based on the coupling of critical peak
internal pressures, the advantage of the computation is twofold. It helps to evaluate which
simulation scenario (i.e., tests with various dominant openings) leads to severe the net loading
and at the same time it gives an indication to which angle of attack will be critical for the peak
net wind loading. Figure 59 (a) shows the net suction internal pressure over the ceiling partition.
It is observed that the peak suction pressure for test case 8 (window opening with all roof vents
blocked) is critical at 0° angle of attack
Table 6: Peak suction and positive pressure on the ceiling compartment

3‐94
Figure 59: Peak Cpi at ceiling partition a) Peak suction Cpi, and b) Peak positive Cpi

3‐95
3.2.4.2 Net pressure on roof sheathing
Similar to the net pressure that develop over the ceiling compartment, the external pressure that
builds up over the roof envelope coupled with the positive internal pressure that acts in the same
direction as that of the external (Figure 60) pressure generates a worst net pressure that can
undermine the strength of the roof components. The dominant factors that govern the uplift force
over the surface of low rise buildings are wind velocity, degree of inclination of the roof, the
wind angle of attack, turbulence intensity, roof shape and location of the structure.
Common experience and post hurricane observations (FEMA 2005 &2006) have shown that the
severe local suction pressure that develops at the top corner of roof perimeter when coupled with
positive internal pressure on the same surface leads to excessive pressure fluctuations that
instigate extraordinary high uplift pressure. According to post hurricane studies undertaken by
Figure 60: Net pressure at roof corners causing severe uplift pressure

3‐96
FEMA 2005 &2006, the removal of roof sheathings is considered to be the primary failure
mechanism. Moreover, the failure of roof sheathings due to excessive net pressure generally
exacerbates the progressive failure of the roof structures such as trusses and walls. This kind of
failure would allow the intrusion of wind driven rain into the interior of the building which
consequently damages the building and the internal contents. In this project, the investigation of
net pressure coefficient on the hip roof envelope was performed by analyzing the peak external
suction roof pressure synchronized with the peak attic positive internal pressure. Internal and
external pressure taps allocated along the center of the roof longitudinally and transversally were
used to compute the pressure values. As stated above, wind angle of attack is one of the
governing factors in the study of critical net pressure and in order to address this issue wind
angles of attack (0°, 45° and 90°) were considered in analyzing the internal and external pressure
coefficients as shown in Figure 51-61. Even though various combination of peak internal and
external pressure can be observed, the most critical one is the uplift pressure that results from the
combination of external suction and internal positive pressure. Figure 61 depicts the statistical
external pressure variation along the longitudinal length of the hip roof for wind angle of attack
between 0°, 45° and 90°. The worst wind direction that caused the instigation of peak suction
pressure coefficient is 45°. A peak value of -2.71 is measured at the left corner of the gable ridge
which is the downwind side of the gable with respect to the wind flow. The wind flow condition
for the 45° wind angle of attack being diagonal, it initiates the formation of strong vortices along
the windward edges. The diagonal wind flowing across the roof eventually generates severe
uplift force at the corner overhangs. The external suction pressure excited along the transversal
direction (across the gable roof) was observed to be critical when the wind flow position is

3‐97
diagonal (i.e., 45°) to the building which is as shown in Figure 61(c), the peak suction pressure
coefficient is estimated to be about -2.0 and occurs on the downwind side of the gable ridge.
As a general observation of the results of external pressure analysis (Figure 61 and Figure 62),
each wind angle of attack produces peak external suction pressure and this peak pressure
consistently happens to occur just behind the windward hip ridge or roof ridge depending on the
direction of the wind with respect to the position of the roof. This is basically related to the
formation of separation bubble right after the windward ridges creating high suction pressure and
the intensity depends on the degree of inclination of the roof under consideration.
Considering the internal pressure inside the attic floor, it is the positive pressure coefficient that
contributes towards exacerbating the uplift force is shown in Figure 60. Unlike the external
suction pressure, the positive internal pressure doesn’t show local crests. Generally the positive
internal pressure coefficients are distributed in the range of 0.4 and 0.6 as depicted in Figure 63
and Figure 64.

3‐98
Figure 61: Roof external pressure along the center length of the hip; a) tap location along center of hip, b) 0 ° c) 45° & d) 90° wind angle of attack

3‐99
Figure 62: Roof external pressure along the center length of gable; a) tap location along center of gable, b) 0 ° c) 45° & d) 90° wind angle of attack

3‐100
Figure 63: Roof internal pressure along the center length of hip; a) tap location along center of hip, b) 0 ° c) 45° & d) 90° wind angle of attack

3‐101
Figure 64: Roof internal pressure along the center length of gable; a) tap location along center of gable, b) 0 ° c) 45° & d) 90° wind angle of attack

3‐102
In order to have better visualization on the critical uplift forces, the net pressure that develops on
the roof envelop when the building is at 45° to the wind flow direction is organized as shown in
Figure 65 a and b. Computing the critical uplift pressure for each case:
Critical uplift pressure across gable
= 0.433-(-1.89)
= 2.323
Critical uplift pressure along hip center
= 0.433-(-2.71)
= 3.143
It is observed that the critical uplift pressure occurs immediately behind the windward ridge. In
our case, since the positive internal pressure was more or less uniform, the suction pressure that
develops on the downwind side of the roof ridge or hip is dominant and plays crucial role
towards generating critical uplift force.

3‐103
Outcomes of internal and external pressure study for the hip roof:
• Peak positive internal pressure occurs when a dominant opening of the building faces the
incoming wind flow.
Figure 65: Uplift force due to net pressure along: a) the center of the gable, b) the center of the hip roof

3‐104
• Peak negative internal pressure occurs when a dominant opening of the building are in
parallel to the incoming wind flow.
• Dominant openings resulted in an increase internal pressure. For example, the opening of
the window together with ceiling hatch led to 20% increase on the net wind load on the
windward side of the hip roof. This reinforces the need for keeping doors and windows
covered with shutters during strong storms.
• Opening of a hatch along with the window and door causes an increase in the internal
pressure of the attic roof which reveals the importance of sealing ceiling hatches during
strong storms to protect the roof and the building.
• Relative increase both in the negative and positive pressure has been observed due to the
presence of vents (gable end, ridge, turbine, goose neck and soffits).
• Similar to literature values lower external pressure values for hip roof were observed
compared to the gable roof.
4. Conclusions
An optimal size of the full-scale building specimen and its respective location from the wind
generator WoW without compromising the aerodynamic data collected is identified by
performing numerical computation and small scale model analysis which was later confirmed
with detail full-scale WoW study.
The current study considered actual opening and porosities that are found in typical low rise
buildings and used high wind speeds that resulted in accurate assessment of internal pressures
circumventing the shortcomings in traditional wind tunnel tests.

3‐105
The internal pressure that develops inside the building is shown to have a significant effect on
the overall design wind loading.
The intensity of internal pressure is directly related to the size of dominant openings and their
location with respect to the direction of wind angle of attack. Moreover, the intensity of internal
pressure is highly dependent on compartmentalization and the presence of opening on the
partitioning wall.
• Peak positive internal pressure occurs when a dominant opening of the building faces the
incoming wind flow.
• Peak negative internal pressure occurs when a dominant opening of the building are in
parallel to the incoming wind flow.
• Dominant openings resulted in an increase internal pressure. For example, the opening of
the window together with ceiling hatch led to 45% increase on the net wind load on the
windward side of the gable roof and 20 % increase for hip roofs. This reinforces the need
for keeping doors and windows covered with shutters during strong storms.
• Relative increase both in the negative and positive pressure has been observed due to the
presence of vents (gable end, ridge, turbine, goose neck and soffits).
• Similar to literature values lower external pressure values for hip roof were observed
compared to the gable roof.
• Opening of a hatch along with the window and door causes an increase in the internal
pressure of the attic roof which reveals the importance of sealing ceiling hatches during
strong storms to protect the roof and the building.

3‐106
5. Acknowledgments
The financial support from Florida Department of Emergency Management (FDEM) is gratefully
acknowledged. We acknowledge the help received from FIU graduate students – Agerneh
Dagnew, Huma Khan and Dhawal Sambare, Tuan-Chun Fu, Workamaw Warisdo, Ruilong Li
and the following FIU under graduate students Francis Bian, Zak Lata, Alvaro A. Quinonez, and
to our WoW lab manger Walter Conklin and WoW Research Scientists James Erwin, Roy Liu
and Ali Masoud.

3‐107
6. References
1. Bitsuamlak, G.T., Dagnew, A., and Chowdhury, A., (2009) “Computational assessment
of blockage and wind simulator proximity effects for a new full-scale testing facility”,
Wind and Structure, In Press.
2. Bitsuamlak, G.T., Gan Chowdhury, A., Sambare, D. (2009), “Application of a Full-Scale
Testing Facility for Assessing Wind-Driven-Rain Intrusion,” Building and Environment,
44 (12), pp. 2430-2441.
3. Chowdhury, A.G., Kawade, P. and Fu, T.H., (2009), “Roof and Wall Vents Study under
Simulated Hurricane Winds,” Report submitted to IHRC, Research Project funded by
The State of Florida Department of Community Affairs.
4. Davenport, A.G., Surry, D., Stathopoulos, T. (1978). Wind loads on low rise buildings:
Final report of phase I and II. Boundary Layer Wind Tunnel Report BLWT-SS4,
University of Western Ontario, Canada.
5. FEMA (2005a). Mitigation, Assessment, Team. Hurricane Ivan in Alabama and Florida:
Observations, Recommendations and Technical Guidance.
6. FEMA (2005b) Mitigation, Assessment, Team. Mitigation Assessment Team Report:
Hurricane Charley in Florida.

3‐108
7. FEMA (2006). Mitigation, Assessment, Team. Hurricane Katrina in the Gulf Coast:
Mitigation Assessment Team Report, Building Performance Observations,
Recommendations, and Technical Guidance.
8. FEMA (2007a). Debris Management Guide. FEMA Publication 325. 06 June 2008.
<http://www.fema.gov/government/grant/pa/demagde.shtm>.
9. Holscher, N., Niemann, H.J. (1998), “Towards quality assurance for wind tunnel tests: A
comparative testing program of the Windtechnologische Gesellschaft”, Jnl. of Wind Eng.
Ind. Aerod., 74, 599-608.
10. Holmes, J.D. (1979). “Mean and fluctuating internal pressures induced by wind,” Proc.
5th Int. Conf. on wind engineering. Vol.1, Colorado, USA, pp. 435-450.
11. Holmes, J.D. (1993). “Wind loads on low rise buildings-a review,” CRISO. Division of
Building Research. Highett, Victoria, Australia.
12. Holmes, J.D. (2001). Wind Loading of Structures. Spon Press, Chapter 6: p128-138.
13. Lim, C.H., Thomas, T.G., Castro, I.P. (2009), “Flow around a cube in a turbulent
boundary layer: LES and experiment”, Jnl. of Wind Eng. Ind. Aerod., 97, 96-109.

3‐109
14. Levitan, M.L., J.D. Holmes, K.C. Mehta and W.P. Vann, Field measurements of
pressures on the Texas Tech building. J. Wind Eng. Ind. Aerodyn. 38 (1991), pp. 227–
234
15. Liu, H. (1990). Wind Engineering: A Handbook for Structural Engineers. Prentice Hall,
USA.
16. Liu, H., Rhee, K.H. (1986) Helmholtz oscillation in building models. J. Wind Eng. Ind.
Aerodyn. 24, 95-115.
17. Liu, H., Saathoff, P.J. (1982). “Internal pressure and building safety,” J.Struct. Div.,
ASCE, 108(10), 2223-2234
18. Liu, H., Saathoff, P.J., (1983) “Internal pressure of multi-room buildings,” ASCE J.
Engineering Mechanics Division, Vol. 109, No. EM3, p908-919.
19. Karava, P. (2008), “Airflow Prediction in Buildings for Natural Ventilation Design: Wind
Tunnel Measurements and Simulation”, PhD. Thesis, Concordia University, Montreal,
Canada.
20. Okajima, A., Yi, D., Sakuda, A., Nakano, T. (1997), “Numerical study of blockage
effects on aerodynamic characteristics of an oscillating rectangular cylinder”, J. Wind
Eng. Ind. Aerodyn. 67&68, 91-102

3‐110
21. Richards, P.J., Hoxey, R.P., Connell, B.D., Lander, D. P. (2007), “Wind-tunnel
modelling of the Silsoe Cube”, Jnl. of Wind Eng. Ind. Aerod., 95, 1384–1399.
22. Sharma, R.N. (2007). “Internal and net envelope pressures in a building having quasi-
static flexibility and a dominant opening,” J. Wind Eng. Ind. Aerodyn. 91, 807-828.
23. Sharma, R.N., Richards, P.J. (2003). “The influence of Helmholtz resonance on internal
pressures in a low-rise building,” J. Wind Eng. Ind. Aerodyn. 91, 807-828.
24. Sharma, R.N., Richards, P.J. (2005). “Net pressure on the roof of a low-rise building with
wall openings.” J. Wind Eng. Ind. Aerodyn. 93, 267-291.
25. Sharma, R.N., Richards; P.J. (1997). “The effect of roof flexibility on internal pressure
fluctuations,” J. Wind Eng. Ind. Aerodyn. 72, 175-186.
26. Vickery, B.J. (1986). “Gust factors for internal pressures in a low rise buildings,” J. Wind
Eng. Ind. Aerodyn. 23, 259-271.
27. Vickery, B.J., Bloxham, C. (1992). “Internal pressure dynamics with a dominant
opening,” J. Wind Eng. Ind. Aerodyn. 41, 193-204.
28. Vickery, B.J., (1986). “Gust factors for internal pressures in low-rise buildings,” J. Wind
Engineering and Industrial Aerodynamics, Vol. 23: p259-271.

3‐111
29. Vickery, B.J. (1994). “Internal pressures and interactions with building envelope,” J.
Wind Eng. Ind. Aerodyn. 53, 125-144.
30. Wright, N.G., Easom, G.J. (2003), “Non-linear k–ε turbulence model results for flow
over a building at full-scale”, Applied Mathematical Modeling, 27(12), 1013-1033.