a research report presented to the graduate school of
TRANSCRIPT

i
AN INVESTIGATION INTO THE STRATEGIC CHALLENGES FACING DIGITAL BANKING
CHANNELS IN SOUTH AFRICA, A CUSTOMER CENTRIC APPROACH
BENJAMIN APPALSAMY
70250766
A Research Report presented to the
Graduate School of Business Leadership
University of South Africa
Submitted in partial fulfillment of the requirements for the
MASTERS DEGREE IN BUSINESS ADMINISTRATION
Promoter: Dr R. Erasmus
07 May 2012

ii
DECLARATION
“I, Benjamin Appalsamy, hereby declare that:
� The work in this paper is my original work;
� All sources used or referred to have been documented and recognised,
and;
� This research report has not been previously submitted in full or partial
fulfillment of the requirements for an equivalent or higher qualification at
any other recognised educational institution.”
Benjamin Appalsamy 30 April 2012
Student number: 70250766

iii
ACKNOWLEDGEMENTS
My sincere thanks are extended to all those persons who have been instrumental
in assisting me to the successful conclusion of the MBA. The journey has been a
demanding one and without the help of key individuals, the road would have
been much more arduous. In particular, the help of the following individuals are
acknowledged:
� My family for their unselfish support, patience, love and encouragement
over the last three years;
� My colleagues at First National Bank for their willingness to sacrifice their
time and share their knowledge unconditionally. FNB is also
acknowledged for their partial financial support and flexibility in allowing
me the time and space that was necessary for the completion of the MBA;
� My MBA syndicate members who provided both moral and intellectual
support;
� The UNISA tutors for their coaching, advice and intellectual stimulation
which enabled self reflection and academic growth.
iv
ABSTRACT
Electronic banking (hereafter referred to as digital banking), has not been fully
embraced by local South Africans, in comparison to larger more established
banking industries of the world. Despite the research literature available on e-
commerce, much is still unknown about digital banking drivers in developing
countries such as South Africa. In particular how clients feel about this form of
banking and what the strategic challenges that require resolution for local
consumers and banks to both benefit from this symbiotic relationship.
Arguably, digital channels are the future of banking globally as the autocatalytic
nature of the internet and mobile devices continue to fuel digital transformation.
In order for local banks to leverage this area of technological evolution, customer
perceptions about this service platform, particularly the areas that were targeted
for this investigation need to be prudently considered from a customer
perspective for future corrective measures that need to be undertaken and
ultimately solve for customer satisfaction.
Many South Africans have been early adopters of digital banking services,
however many are still wary of this form of banking. A “magic pill” for
implementation was not sought after, but rather a learning approach to embrace
the opinions and perceptions of consumers.
The research approach for this study primarily followed a qualitative approach
and the primary data was collected using a single measuring instrument in the
form of a self-administered web questionnaire. This comprised of a series of
open and closed questions and other prompts for the purpose of gathering
information from respondents.
The research effort focused on specifically analyising the following problems/
objectives:

v
� To determine what customers primarily want from digital banking
channels, in terms of the core themes identified.
� To establish the drivers which are most important to customers.
� To investigate the perceptions of service via digital banking channels.
The study was therefore aimed at identifying customer satisfaction determinants
that will result in an increase in adoption and usage of digital banking channels in
South Africa.
The primary data gathered indicates that banks need to make sure that the
fundamentals such as fraud prevention security are in place to ensure that
objectives are met. Thereafter, customer satisfaction can be achieved through
various other secondary drivers such as incentivisation and education which can
also influence an increase in adoption and usage. However, it also appears that
there are uncontrollable macro dependencies e.g. cost and accessibility of the
internet which will aid the evolution of the digital banking industry in South Africa.
Undoubtedly consumers are seeking more innovative solutions from their
bankers given the growing nature of consumerism and it becomes a case of
survive and thrive or become extinct in an industry that is highly competitive
given the borderless boundaries of the financial services sector on the digital
banking global stage.

vi
TABLE OF CONTENTS
Title page i
Declaration ii
Acknowledgements iii
Abstract iv-v
Table of contents vi-viii
List of figures and tables ix-xii
1. Problem in context, Problem statement and Objectives
1.1 Introduction 1-2
1.2 Background and problem in context 2-6
1.3 Problem review 7-19
1.4 Research/ Problem statement 19-20
1.5 Research objectives 20-21
1.6 Limitations and delimitations 21
1.7 Delineation 22
1.8 Value and importance of the study 22
1.9 Summary 23
2. Problem analysis
2.1 Introduction 24
2.2 Risk management landscape 25-30
2.3 Customer centric convenience and Simplicity of the 31-37
experience
2.4 Summary 37

vii
3. Literature review
3.1 Introduction 38-39
3.2 Risk management landscape 40-41
3.3 Customer centric convenience 42-44
3.4 Simplicity of the experience 45-47
3.5 Key South African challenges 47-48
3.6 Summary 49
4. Research Methodology and Design
4.1 Introduction 50
4.2 Aim of the research 51
4.3 Research approach and design choice 51-53
4.4 Data gathering tool and procedures 54-59
4.5 Characteristics and scope of the sample 59-61
4.6 Data analysis approach 62-63
4.7 Technical and quality issues 63-66
4.8 Summary 67
5. Research results
5.1 Introduction 68
5.2 Presentation of biographical information 68-70
5.3 Primary results analysis and findings 70-88
5.4 Secondary data analysis 89-96
5.5 Summary 97-98
viii
6. Recommendations and conclusion
6.1 Introduction 99
6.2 Comparison of findings to literature reviewed 99-100
6.3 Research statement reflection 100-101
6.4 Problems encountered in the study 101
6.5 Recommendations 102
6.6 Conclusion 103
References 104-113
Annexure A: Web based research questionnaire 114-119
ix
LIST OF FIGURES AND TABLES
Figure number 1.1 Local Industry fraud trends for 2011 (Source: SABRIC, 2011) 3
1.2 Service comparatives for Online banking amongst local banks 4
(Source: Consulta Research, 2011)
1.3 Movement of banking transactions (Source: SA Reserve 5
Bank, Q 1 2011)
1.4 Major drivers of change (Source: PWC Strategic & Emerging 6
Issues in South African Banking, 2007 Edition)
1.5 FNB fraud payout trends for 2010/2011 (Source: FNB Online 10
internal secondary data, 2011)
1.6 FNB phishing trends for 2010/2011 (Source: FNB Online 11
internal secondary data, 2011)
1.7 YOY new customer acquisition sales trend vs. customers 14
availing of debit order switching option (Source: FNB internal
secondary data, 2011)
1.8 Screen shot of a tab within Online banking (Source: FNB 15
Online internal secondary data, 2011)
1.9 Four Year Market Share trend (Source: SA Reserve Bank BA 900 16
and FNB internal secondary data, 2011)
1.10 Digital banking channel – Call centre statistics (Source: FNB 17
Online internal secondary data, 2011)
1.11 FNB Digital channel Activations vs. Registrations (Source: FNB 18
Online internal secondary data, 2011)
1.12 Overall FNB. Co.za usability survey (Source: FNB Online internal 19
usability studies, March 2011)
2.1 Macro-environment influences (Source: adapted from Fahey 25
and Narayanan, 1986)

x
2.2 Appropriation of value, who gets the benefit from innovation? 29
(Source: adapted from Grant, 2010)
2.3 The service quality gap model (Source: adapted from 31
Parasuraman, Zeithaml & Berry, 1985)
2.4 Example of an error message for new account opening 32
(Source: FNB Online internal secondary data, 2011)
2.5 Example of education parameters in digital banking channels 33
(Source: FNB Online internal secondary data, 2011)
2.6 Average account opening time via digital channels (Source: FNB 35
Online internal secondary data, 2012)
2.7 Best South African Banking Brands (Source: TNS research 36
surveys - Sunday Times, August 2011)
2.8 Service comparatives for Online banking amongst local banks 36
(Source: Consulta Research, 2011)
4.1 Conceptual model for research framework (Source: adapted 62
from Yap, Wong, Loh & Bak, 2009)
5.1 Overall security analysis 71
5.2 Fraud perpetration 72
5.3 Compromise of personal information 72
5.4 Perceptions of changes in security 73
5.5 Fraud prevention education 73
5.6 Frequency of significant security drivers 74
5.7 Approximated dispersion of security drivers 75
5.8 Overall convenience analysis 76
5.9 Value for money 77
5.10 Usage behavior based on reward 77
5.11 Usage education of digital channels 78
5.12 Frequency of significant convenience drivers 79

xi
5.13 Approximated dispersion of convenience drivers 80
5.14 Overall simplicity analysis 81
5.15 Usage enablers 82
5.16 Services available between conventional and digital 82
channels
5.17 Satisfaction levels of electronic banking services 83
offered
5.18 Frequency of significant simplicity drivers 84
5.19 Approximated dispersion of simplicity drivers 85
5.20 Prioritisation of drivers 86
5.21 Prioritisation mix of drivers 87
5.22 Relationship intensity of customer drivers to customer 88
satisfaction
5.23 Internal customer service survey (Source: FNB Online Survey, 90
November 2011)
5.24 Defects in new functionality deployed (Source: FNB Online 91
internal secondary data, 2011)
5.25 Internal customer service survey (Source: FNB Online Survey, 92
February 2012)
5.26 Usability enhancements and impact on transactional 93
volumes (Source: adapted from FNB Online internal secondary
data, 2012)
5.27 Usability enhancements and impact on new online enrolments 94
and activations (Source: adapted from FNB Online internal
secondary data, 2012)
5.28 FNB Fraud volume impact 2010-2011 (Source: adapted from FNB 95
Online internal secondary data, 2012)

xii
Table number
1.1 Potential customer satisfaction drivers (Source: FNB results 7
from internal organisation brainstorming discussions, 2011)
1.2 FNB compliance to digital banking relevant legislation 12
(Source: FNB Online internal secondary data, 2011)
2.1 Levels of security (Source: adapted from Amtul, 2011:4) 27
2.2 The spectrum of industry structures (Source: adapted from 28
Grant, 2002)
2.3 FNB compliance to digital banking relevant legislation 30
(Source: FNB Online internal secondary data, 2011)
4.1 Questions used in the web based survey instrument 55-57
(Source: adapted from literature review, 2011-2012)
5.1 Biographical mix 69
5.2 Driver prioritisation 86

1
CHAPTER 1
1. Problem in context, Problem statement and Objectives
1.1 Introduction
Electronic banking (hereafter referred to as digital banking), has not been fully
embraced by local South Africans, in comparison to larger more established
banking industries of the world that has experienced explosive growth (Akinci,
Akoy & Atilgan, 2004). Despite the research literature available on e-commerce,
much is still unknown about digital banking in developing countries such as
South Africa (Auta, 2010: 215). In particular, how clients feel about this form of
banking and what the strategic challenges that requires resolution for consumers
and banks to mutually benefit from this symbiotic cost saving relationship
(Sathye, 1999).
Arguably, digital channels are the future of banking globally as the autocatalytic
nature of the internet and mobile devices continue to fuel digital transformation.
A fundamental shift is occurring from conventional banking to digital banking
powered primarily by the internet (Basel Committee – Electronic Banking Group,
2000: 11). In order for First National Bank (FNB) to leverage this area of
technological evolution, customer perceptions about this service platform, in
particular the targeted areas for investigation should be prudently considered
from a customer perspective for future corrective measures that need to be
undertaken and ultimately solve for customer satisfaction (King, 2010).

2
South Africans have been early adopters of digital banking, however many
consumers are still wary of this form of banking. This security consciousness of
consumers across the globe is awakening the banking giants to take notice of the
evolving nature of consumerism relevant to technology and innovation that is
metamorphosing the financial services industry (Lee and Turban, 2001).
1.2 Background and problem in context
Digital banking has become a popular alternative of conducting banking in the
twenty first century. Technology and innovation in many industries as well as
banking is what drives daily business activities. This alternative platform has
revolutionised the financial services industry in recent times both locally as well
as internationally (Kerem, Lustsik, Sorg & Vensel, 2003). By definition, digital
banking is an electronic connection between bank and customer to prepare,
manage and control financial transactions (Salehi and Zhila, 2008).
Arguably, whilst customers have become accustomed to the convenience of
digital banking channels as suggested by Nath, Schrick & Parzinger (2001) , so
to have the fraudsters in wanting to penetrate this new found area of exploitation
with phishing scams being at the heart of loopholes. Phishing (also referred to
as brand spoofing) can be described as a scam whereby phishers send out e-
mails to random databases to deceive consumers into divulging sensitive
information e.g. user names and passwords under the pretence that it is
originating from the legitimate source (Singh, 2007). This is evident in the local
industry analysis reflected in figure 1.1.

3
Figure 1.1: Local Industry fraud trends for 2011 (Source: SABRIC, 2011)
Online banking within FNB as with most local banks is still embryonic, and is
directed at copying local strategies to ensure technological and heuristic
relevance in the quest for competitiveness. This typically is aimed at getting the
basic digital functionality right, aligned to what competitors are doing e.g. cancel
and order a new credit card online with courier delivery tracking i.e. a customer
being fully empowered to fulfill banking requests by themselves.
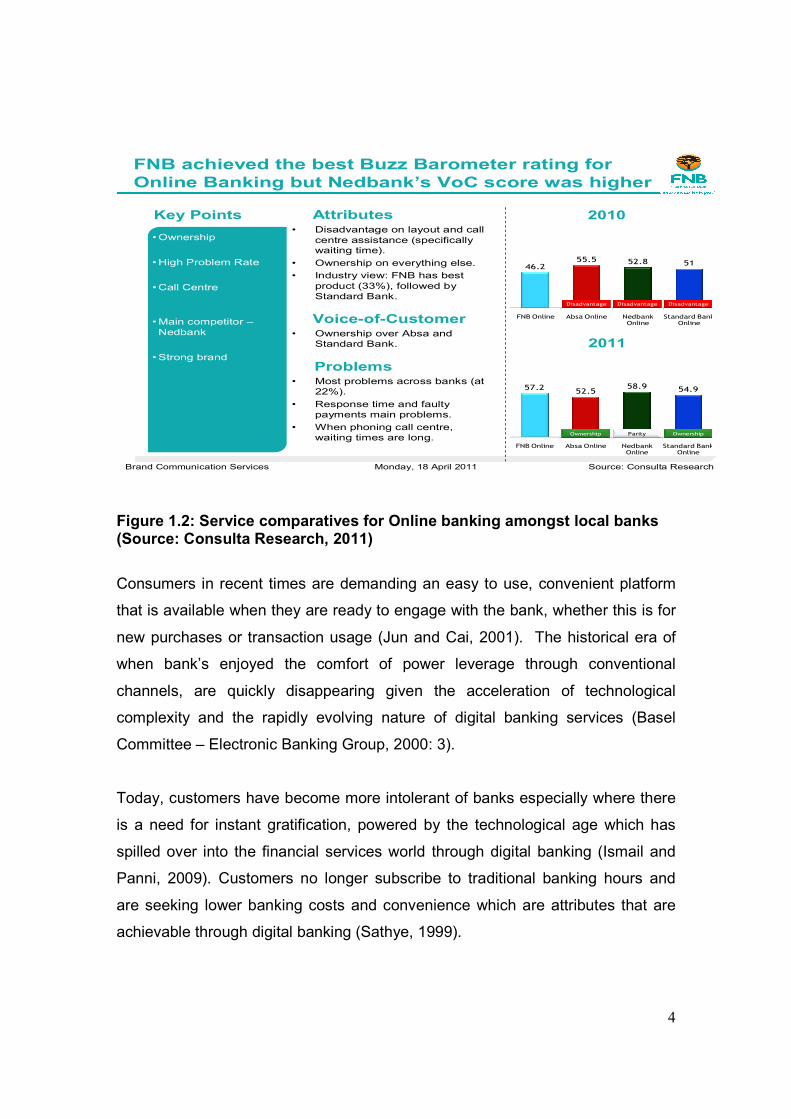
Whilst this laggard strategy is maintaining local banks on a pendulum swinging
par (figure 1.2), it is not necessarily delivering competitive differentiating services
which are core to success (Parasuraman, Zeithaml & Berry, 1985; 1988). This is
typically aligned to perceptions based on the platforms layout and relevance of
information, aesthetics, navigation, speed of transaction processing which are
key service differentiators (Yang, Peterson & Cai, 2003).
4
Key Points• Disadvantage on layout and call
centre assistance (specifically
waiting time).
• Ownership on everything else.
• Industry view: FNB has best
product (33%), followed by
Standard Bank.
• Ownership
• High Problem Rate
• Call Centre
FNB achieved the best Buzz Barometer rating for
Online Banking but Nedbank’s VoC score was higher
Attributes
Problems• Most problems across banks (at
22%).
• Response time and faulty
payments main problems.
• When phoning call centre,
waiting times are long.
Voice-of-Customer• Ownership over Absa and
Standard Bank.
• Main competitor –
Nedbank
• Strong brand
2010
2011
57.252.5
58.9 54.9
FNB Online Absa Online Nedbank Online
Standard Bank Online
46.255.5 52.8 51
FNB Online Absa Online Nedbank Online
Standard Bank Online
Parity
Disadvantage
Ownership
Disadvantage Disadvantage
Ownership
Monday, 18 April 2011Brand Communication Services Source: Consulta Research
Figure 1.2: Service comparatives for Online banking amongst local banks (Source: Consulta Research, 2011)
Consumers in recent times are demanding an easy to use, convenient platform
that is available when they are ready to engage with the bank, whether this is for
new purchases or transaction usage (Jun and Cai, 2001). The historical era of
when bank’s enjoyed the comfort of power leverage through conventional
channels, are quickly disappearing given the acceleration of technological
complexity and the rapidly evolving nature of digital banking services (Basel
Committee – Electronic Banking Group, 2000: 3).
Today, customers have become more intolerant of banks especially where there
is a need for instant gratification, powered by the technological age which has
spilled over into the financial services world through digital banking (Ismail and
Panni, 2009). Customers no longer subscribe to traditional banking hours and
are seeking lower banking costs and convenience which are attributes that are
achievable through digital banking (Sathye, 1999).

5
As tough economic pressures and competitive differentiation continue to rise in
the battle for customers through the most cost effective manner, banks both
locally and internationally are looking at leveraging their self service channels to
improve profitability by reducing reliance on costly conventional distribution
channels i.e. branches, both in terms of transactability and new customers (Reid
and Levy, 2008). This swing toward electronic channels was evident locally
(figure 1.3) which revealed a noticeable improvement in overall banking
transactions fueled primarily by increases in credit card and electronic payments
(Ernst & Young – Financial Services Index, Quarter 1 2011).
Figure 1.3: Movement of banking transactions (Source: SA Reserve Bank, Q 1 2011)
Safeguarding the privacy of a customer’s financial information and profile are
essential ingredients in the recipe for acceptance and adoption of digital banking
channels (Nath, et al., 2001). This was evident with the .com and internet bubble
burst experienced in the late 1990’s by the likes of eBay and Amazon which gave
rise to public key cryptography and fueled the digital encryption age. There are
various local legislative interventions such as the Consumer Protection Act 68 of
2008, Electronic Communications Act and Protection of Personal Information Act
1 April 2005, which are examples of relevance that aim to address shortcomings.
6
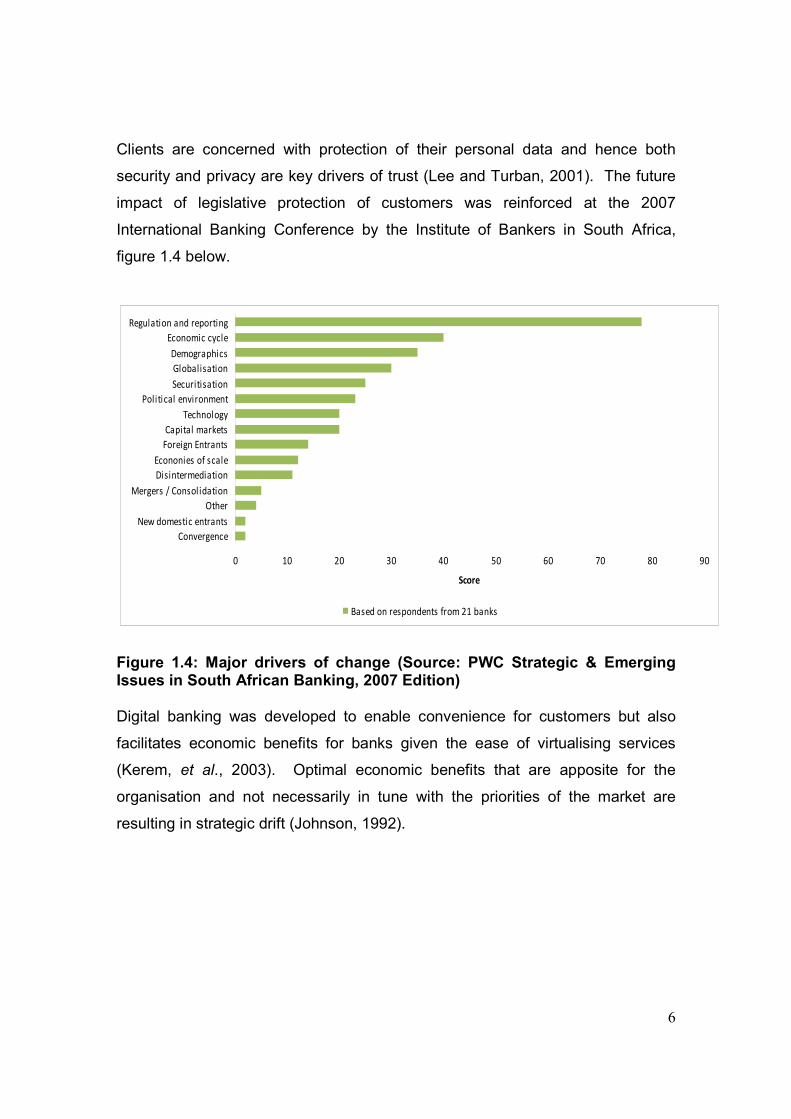
Clients are concerned with protection of their personal data and hence both
security and privacy are key drivers of trust (Lee and Turban, 2001). The future
impact of legislative protection of customers was reinforced at the 2007
International Banking Conference by the Institute of Bankers in South Africa,
figure 1.4 below.
0 10 20 30 40 50 60 70 80 90
Convergence
New domestic entrants
Other
Mergers / Consol idation
Disintermediation
Econonies of scale
Foreign Entrants
Capital markets
Technology
Political environment
Securitisation
Globalisation
Demographics
Economic cycle
Regulation and reporting
Score
Based on respondents from 21 banks
Figure 1.4: Major drivers of change (Source: PWC Strategic & Emerging Issues in South African Banking, 2007 Edition) Digital banking was developed to enable convenience for customers but also
facilitates economic benefits for banks given the ease of virtualising services
(Kerem, et al., 2003). Optimal economic benefits that are apposite for the
organisation and not necessarily in tune with the priorities of the market are
resulting in strategic drift (Johnson, 1992).

7
1.3 Problem review
There is a myriad of challenges that the financial services industry faces as the
digital banking platform matures. Chuang and Hu (2011: 3) suggest that there
are six key dimensions, namely; transaction technicalities, decision-making
convenience, interactive interrogation, speciality information, security and
exploration. In an attempt to unpack the local nuances further from a customers’
standpoint, brainstorming sessions were conducted within the organisation. The
potential key drivers and common constructs that will lead to optimal customer
satisfaction are reflected in table 1.1;
Table 1.1: Potential customer satisfaction drivers (Source: FNB results from internal organisation brainstorming discussions, 2011)
Challenges Drivers Themes
What is needed to increase the activation rate of
online banking relative to registrations?
� Fraud prevention
� Protection of personal information
� Ease of activating online banking
� Education
� Incentivisation/Reward
Security
Security
Simplicity
Convenience
Convenience
Is the customer experience intuitive? � Relevance of information
� Availability of information
� Easy of use
� Visual appeal
Simplicity
Convenience
Simplicity
Simplicity
Can the organisation improve acquisition volumes of
new customers via digital channels?
� Process efficiency
� After sales service
Simplicity
Convenience
What are the key legislative impacts on digital
channels?
� Confidentiality of customer data Security
Is the functionality adequate relative to conventional
channels?
� Enhanced cost efficiencies Convenience
The common themes from a customers’ perspective that emerged which require
further exploration, gravitates toward security, convenience and simplicity. In
embracing the customer centric approach, understanding the challenges faced
by digital banking channels which need to be prioritised for resolution as to what
the drivers are moves from an output/ organisational approach to understanding
the key inputs/ customers’ views that will ultimately deliver on the desired
outcome of optimal customer satisfaction via digital banking channels .

8
In a nutshell, the investigation was aimed at understanding the key drivers for
customers (in order of priority) that will lead to optimal customer satisfaction and
result in an increase in adoption and usage of digital banking, thereby solving for
the strategic challenges of the organisation as well as the customer. The critical
drivers were as follows:
� Security
o Fraud Prevention
o Protection of personal information
o Confidentiality of customer data
� Convenience
o Education
o Process efficiency for new account opening
o Relevance of information
o Incentivisation/ reward
o After sales service
o Enhanced cost efficiencies
� Simplicity
o Ease of activating online banking profiles
o Availability of information
o Ease of use/ navigation
o Visual appeal
9
1.3.1 Risk Management Landscape
Fraud Prevention
The custodians of corporate governance for risk management on behalf of FNB,
a division of the First Rand Group lies with the Legal Risk and Compliance
Department (LRCD) of FNB Online. The group dictates the core parameters of
acceptable governance; however it is the role of LRCD within online to
operationalise risk management alignment with elements of customisation given
the uniqueness of electronic channels.
In the context of digital banking, the core responsibilities include prevention of
electronic fraud, protection of customer information/ confidentiality of data,
management of third party commercial agreements, business continuity and
information technology general controls/ infrastructure control.
Locally in S.A, banks are only now embracing strategies such as PKI (Public Key
Infrastructure) and theory aligned to privacy of personal information was explored
further as well as ethical linkages aligned to invasion of customer privacy (April
and Cradock, 2000). The key aspect here is that whilst business strategies such
as fraud prevention are key economic drivers for the business, a greater threat is
aligned to reputation risk if fraudsters were to hack into databases, functionality
etc. (Singh, 2007). In terms of FNB, there has been an increase of 25% from
2010 to 2011 of fraud grievance cases against the bank that have been
submitted to the ombudsman. This presents a material problem for the
organisation if there is a ruling against the bank for negligence either by way of
process or system compromise. In most instances thus far (cases still pending),
FNB has prevented this through negotiated settlements.

10
The introduction to stop paying for fraudulent phishing claims was implemented
in April 2010 and the bank now faces a potential reputational backlash if cases
are not resolved with benefit to customers and hence the continued impact of
fraud write-off’s as is evident in figure 1.5 below and currently is 3% of total
operational costs.
FNB Customer Data Compromised
0
50
100
150
200
250
300
Jul-10 Aug-10 Sep-10 Oct-10 Nov-10 Dec-10 Jan-11 Feb-11 Mar-
11
Apr-11 May-
11
Jun-11 Jul-11 Aug-11 Sep-11 Oct-11 Nov-11 Dec-11
Fraud count
Simswaps
Figure 1.5: FNB fraud payout trends for 2010/2011 (Source: FNB Online internal secondary data, 2011)
In considering aspects such as the PKI imperative, it emerges that deployment of
this functionality at FNB is dependant on other departments/ segments
“sponsoring” the cost and prioritisation of development. This is primarily due to
the federal organisational structure that FNB operates under and digital banking
channels are regarded as “cost recovery” centres and hence if security solutions
are not a priority of other departments/ segments, cutting edge solutions are not
implemented given the lack of resource support. This is a key bottleneck in the
system of deploying prioritised customer centric security solutions.
11
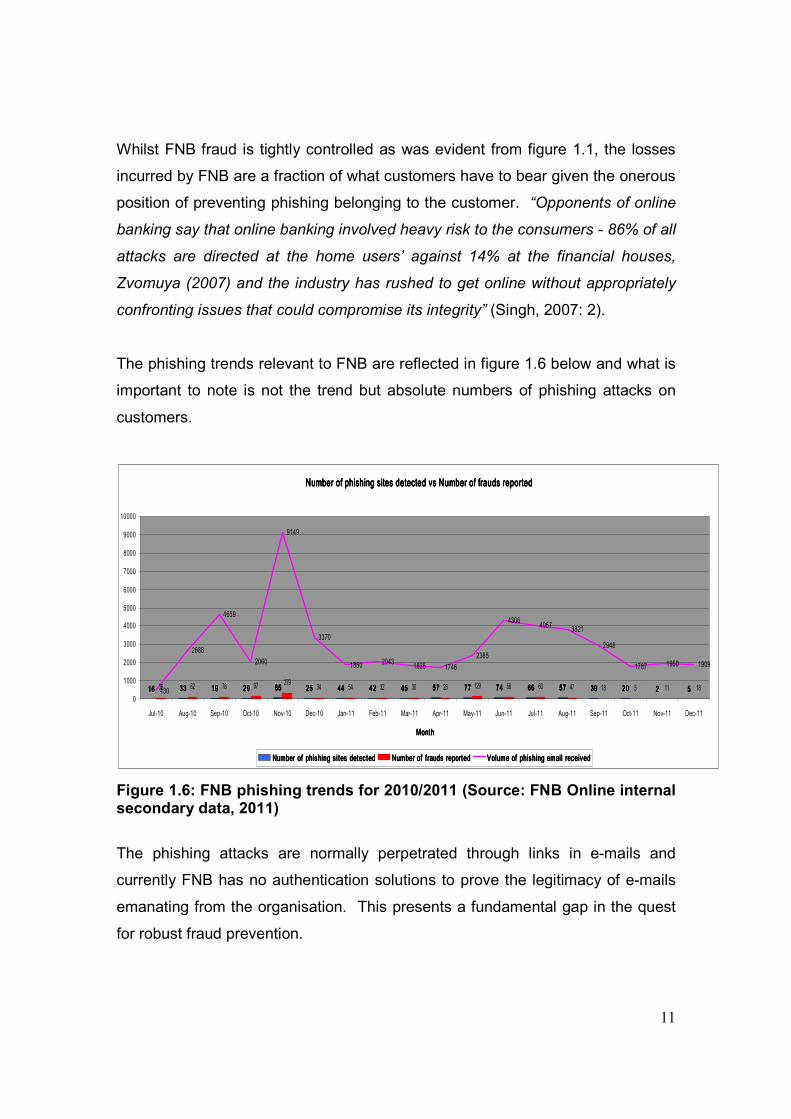
Whilst FNB fraud is tightly controlled as was evident from figure 1.1, the losses
incurred by FNB are a fraction of what customers have to bear given the onerous
position of preventing phishing belonging to the customer. “Opponents of online
banking say that online banking involved heavy risk to the consumers - 86% of all
attacks are directed at the home users’ against 14% at the financial houses,
Zvomuya (2007) and the industry has rushed to get online without appropriately
confronting issues that could compromise its integrity” (Singh, 2007: 2).
The phishing trends relevant to FNB are reflected in figure 1.6 below and what is
important to note is not the trend but absolute numbers of phishing attacks on
customers.
Figure 1.6: FNB phishing trends for 2010/2011 (Source: FNB Online internal secondary data, 2011)
The phishing attacks are normally perpetrated through links in e-mails and
currently FNB has no authentication solutions to prove the legitimacy of e-mails
emanating from the organisation. This presents a fundamental gap in the quest
for robust fraud prevention.
Number of phishing sites detected vs Number of frauds reported Number of phishing sites detected vs Number of frauds reported Number of phishing sites detected vs Number of frauds reported Number of phishing sites detected vs Number of frauds reported
16161616 33333333 19191919 29292929 85858585 25252525 44444444 42424242 45454545 57575757 77777777 74747474 66666666 57575757 39393939 20202020 2222 555536 82 78 97279
34 54 32 30 28 129 56 60 47 18 5 11 18430
2688
4659
2060
9149
3370
1850 2043 1826 17462385
4306 4057 3821
2948
1787 1950 1909
0
1000
2000
3000
4000
5000
6000
7000
8000
9000
10000
Jul-10 Aug-10 Sep-10 Oct-10 Nov-10 Dec-10 Jan-11 Feb-11 Mar-11 Apr-11 May-11 Jun-11 Jul-11 Aug-11 Sep-11 Oct-11 Nov-11 Dec-11
MonthMonthMonthMonth
Number of phishing s i tes detec tedNumber of phishing s i tes detec tedNumber of phishing s i tes detec tedNumber of phishing s i tes detec ted Number of f rauds reportedNumber of f rauds reportedNumber of f rauds reportedNumber of f rauds reported Volume of phishing email receivedVolume of phishing email receivedVolume of phishing email receivedVolume of phishing email received

12
Protection of personal information and confidentiality of customer data
The prevention of fraud, specifically through compliance with the protection of
personal information given the intensity of legislative enhancements as well as
consumerism which fuels the pace for secure digital banking systems, remains a
key objective of FNB. FNB is cognisant of this and are ready to embrace the
evolution however, when it comes to proactive embracement of legislation, the
organisations’ appetite appears to be lagging. This is primarily due to the
magnitude of re-aligning legacy systems to conform to requirements such as
records management of electronic data aligned to ECT Act of 2002. This
coupled with compliance and risk mitigation to relevant legislation as a business
imperative also appears to be secondary to the strategic agenda of digital
banking channels. It must however be re-enforced that the company is not
adverse to the need for change but rather the timing to implement the change,
given other business priorities and resource constraints. FNB’s alignment to the
regulatory universe is reflected in the table below;
Table 1.2: FNB compliance to digital banking relevant legislation (Source: FNB Online internal secondary data, 2011)
Applicable laws and regulations Impact Control
Effectiveness
Electronic Communications and Transaction Act 25 of 2002 H R
National Payment System Act 78 of 1998 H A
Protection of personal information Bill 9 of 2009 H R
Consumer Protection Act of 2008 H R
Key:
H High
M Medium
L Low
A Acceptable
R Room for improvement
U Unacceptable

13
1.3.2 Customer Centric Convenience
Education
Arguably, all local banks are pursuing similar strategies to migrate customers to
digital channels. In the context of FNB as well as with the industry there is
currently no self help tutorials/ education that assists customers in understanding
exactly what the digital banking capability is or how to perform certain
transactions. Banks are skeptical on divulging the exact parameters of their
digital banking operations for two main reasons, namely, competitor piracy and
fraud. This creates a gap in that whilst the intent for migration of customers is
clear, educating customers on the use of functionality is a manual process
whereby a customer is required to contact a call centre for assistance.
Process efficiency for new account opening
Acquisition of new clients via digital channels shows improvement as reflected in
figure 1.7 which has primarily been achieved through aggressive marketing as
well as efficiencies in the online account opening processes, however the
channel still only contributes 5% within the overall distribution mix. Whilst
elements of straight through processing are available for new accounts, there are
still manual interventions in the overall process, which detracts from the
convenience of account opening online. An example of this is that all supporting
documentation for a new account still needs to be faxed into the bank for
finalisation of the new account purchase with no document uploading capability.
Other elements such as debit order switching is a function that is provided online
to simplify the account opening process, but still involves a manually driven back
end process. Relative to the number of new accounts that are being opened
online, it becomes evident that customers are still being inconvenienced by
having to either call at a branch to verify documents or fax these to the bank.
This is evident in figure 1.7 below.

14
Figure 1.7: YOY new customer acquisition sales trend vs. customers availing of debit order switching option (Source: FNB internal secondary data, 2011)
Relevance of information
A further potential contributing factor to low acquisition via the digital channels for
FNB could be as a result of the relevance of information provided via the
channel. This is typically aligned to a strong product push methodology adopted
by the organisation which sometimes becomes an information overload (figure
1.8). In addition, for this particular example, application for the account is deeper
within the navigational structure and not easily accessible for the client.

15
Figure 1.8: Screen shot of a tab within Online banking (Source: FNB Online internal secondary data, 2011)
Incentivisation/ Reward
FNB, as with most other local banks offer their digital banking services as a free
product. In reality, the cost pertaining to these channels are embedded in other
core product banking fees. In addition, there is no incentive mechanism that
encourages the increased usage via digital channels as is the case with other
core products such as credit cards whereby customers are rewarded through
various reward programmes such as eBucks, ABSA rewards etc. This could also
be a contributing factor which has resulted in a fairly static 20% market share
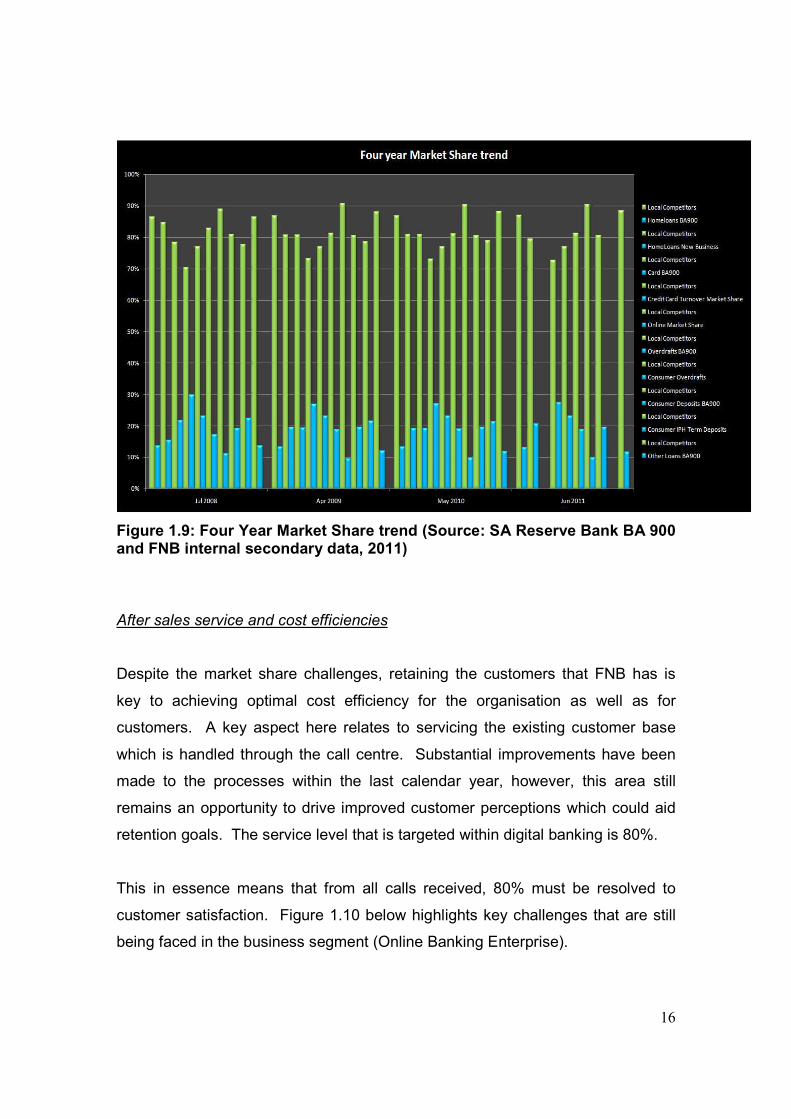
gain for FNB’s digital channels as can be seen in figure 1.9 below.
16
Figure 1.9: Four Year Market Share trend (Source: SA Reserve Bank BA 900 and FNB internal secondary data, 2011)
After sales service and cost efficiencies
Despite the market share challenges, retaining the customers that FNB has is
key to achieving optimal cost efficiency for the organisation as well as for
customers. A key aspect here relates to servicing the existing customer base
which is handled through the call centre. Substantial improvements have been
made to the processes within the last calendar year, however, this area still
remains an opportunity to drive improved customer perceptions which could aid
retention goals. The service level that is targeted within digital banking is 80%.
This in essence means that from all calls received, 80% must be resolved to
customer satisfaction. Figure 1.10 below highlights key challenges that are still
being faced in the business segment (Online Banking Enterprise).

17
Calls Handled
MONTH
Online Banking
Enterprize™
Online
Banking
Sep-2011 21,580 100,888
Oct-2011 21,159 94,684
Calls Received
MONTH
Online Banking
Enterprize™
Online
Banking
Sep-2011 22,709 105,136
Oct-2011 26,546 97,191
Figure 1.10: Digital banking channel – Call centre statistics (Source: FNB Online internal secondary data, 2011)
1.3.3 Simplicity of the experience
Ease of activating online banking profiles
A customer is fully empowered to register for online banking via the website.
However, when it comes to activating the Online profile, this moves from a self
service function to a manual process i.e. a customer has to phone into a call
centre prior to utilising the functionality available via digital banking channels.
This process has primarily been instituted for verification processes in an attempt
to curb fraud. However, it could also be resulting in lower take up and leverage
via digital banking channels as is evident in the drop off from registration/
enrolment to activation depicted in figure 1.11 below.
0%
10%
20%
30%
40%
50%
60%
70%
80%
90%
No
ve
mb
er 2
01
0
De
ce
mb
er 2
01
0
Jan
ua
ry 20
11
Feb
rua
ry 20
11
Ma
rch 2
01
1
Ap
ril 20
11
Ma
y 20
11
Jun
e 2
01
1
July 2
01
1
Au
gu
st 20
11
Sep
tem
be
r 20
11
Octo
be
r 20
11
0
100
200
300
400
500
600
700
Online Banking SL Online Banking Enterprize™ SL OB AHT OBE AHT

18
Figure 1.11: FNB digital channel Activations vs. Registrations (FNB Online internal secondary data, 2011)
Availability of information, navigation and visual appeal
No robust customer centric studies have been conducted and new functionality is
normally deployed with an economic mindset. This generally is as a result of
high level SWOT’s that are conducted amongst the local banks and new
functionality is deployed to ensure industry competitiveness. The previous
usability studies completed were targeted specifically at the home page and not
the banking component. The sample used for this study was small (32
participants) with no specific targeted parameters such as a demographically
representative sample. The previous study depicted in figure 1.12 below,
indicates that there is misalignment to customer needs versus what the
organisation believes is adequate and relevant.
FNB Digital Channels Activations v Registrations
0
5000
10000
15000
20000
25000
Jul Aug Sep Oct Nov Dec
Registered/enrolled
Activated

19
Figure 1.12: Overall FNB. Co.za usability survey (Source: FNB Online internal usability studies, March 2011)
The findings reveal fairly average results specifically in terms of overall ease of
use, terminology, navigation and information layout. The key deficiency exists in
the navigation through the site and whilst this does not pertain to ease of use
inside banking, it is a leading indicator for the need to simplify the site structure
overall. In addition, the results show evidence of the misalignment from an
information perspective, specifically in the context of terminology as well as the
layout of information.
1.4 Research/ Problem statement
Digital banking has been a widely researched topic for many years and
undoubtedly will continue into the future given the link between technology and
innovation. However, the literature on strategic challenges facing South African
banks is limited.
Hence, this study focused on the key drivers of customer satisfaction which must
be addressed in order of priority that will increase adoption, usage and
acquisition through digital banking channels.
Overall site ratings
0
1
2
3
4
5
6
7
8
9
10
Overall ease of use
Terminology Used
Navigation
Content
Visual Appeal
Information Layout
Level of Detail
20
The problem statement is:
Customer satisfaction can be achieved by implementing the key drivers which
will lead to an increase in adoption and usage of digital banking channels in S.A.
1.5 Research objectives
The data for this study was collected using a measuring instrument in the form of
a self-administered web questionnaire which comprised of a series of questions
and other prompts for the purpose of gathering information from respondents and
adopted a five-point Likert scale proposed by Cant, Gerber-Nel, Nel & Kotze
(2003: 113), ranging from strongly disagree to strongly agree .
The survey was targeted at collecting significant, accurate and relevant data and
was completed within a month from commencement. The primary data collected
was targeted at obtaining customer’s opinions and perceptions about the key
drivers and themes discussed above. The aim was also to establish if there is a
relationship between the independent and dependant variables in the population.
For this study the dependant variable was digital banking customer satisfaction
and the independent variables included the following;
� Fraud prevention
� Privacy of personal information
� Speed of transaction processing
� Simplicity in purchasing banking products online
� Usability and functionality
� Accessibility
� Incentivisation

21
The research objectives were as follows;
� To determine what customers primarily want from digital banking channels
in terms of the themes identified.
� To establish the drivers which are most important to customers.
� To investigate the perceptions of service via digital banking channels.
1.6 Limitations and delimitations
The primary limitation anticipated was obtaining a fair representation in
demographical mix of the responses for the questionnaires that was sent out,
specifically gender and age. A further limitation that was expected was a biased
view of the respondents given the fact that most participants would be existing
First National Bank clients that avail of digital banking services. In an attempt to
overcome the obstacles such as the one’s mentioned above, secondary research
such as literature and data that is already in existence was also explored. In
addition, to overcome the bias, a research house was employed with the specific
intent to sample customers and obtain their views from all four major banks
across the industry as well as ensuring a prudent mix in terms of demographics.
This was purely for the distribution to the research company’s networks, at the
writers own cost, in attempting to obtain a fair representative sample.
The analysis and interpretation of findings was undertaken by the writer. In
addition a further key limitation that was anticipated was the randomness of the
sample as the population that was surveyed was targeted at clients that avail of
digital banking services and hence only a small proportion of the banking
community was assessed. To overcome this challenge the questions were
constructed with a view of understanding what will increase usage of existing
consumers as well as what will increase adoption for new customers.

22
1.7 Delineation
The purpose of the study was not to review risk management, heuristics or
enhanced functionality in its totality, but rather to test for key drivers of consumer
satisfaction with a view of presenting the facts from a customer standpoint. In
addition the intent was not to seek out a “magic pill” for implementation for the
primary drivers but rather a learning approach to embrace what S.A customers
perceive is important.
1.8 Value and importance of the study
Unraveling the concerns of clients regarding digital banking channels will help
FNB prioritise, develop and improve technologies to ensure that customer
satisfaction is informed by quality banking services of what customers want and
need. This is aligned to learning that can be deployed from the investigation in
the organisation to compliment the strategic goals of FNB such as increasing
adoption and usage of digital banking channels as well as to drive increased
acquisition through self-service channels.
Despite the findings, some of which may be practical for implementation and
other findings which may not be, the enrichment through the journey was
applicable to both the organisation as well as customers. Hence, it is plausible to
accept that the risk of undertaking this investigation was low from the context of
findings that may or may not contribute to resolving challenges, but rather
highlighted a diverse view of issues that are of relevance in an emerging digital
banking economy such as South Africa.
23
1.9 Summary
The main purpose of this chapter was to identify and unpack the strategic
challenges facing digital banking channels in South Africa with specific emphasis
on the industry in general. The problem statement, main objectives as well as
other key concepts were presented. Chapter two focuses on the organisation
and unraveling the strategic challenges with specific emphasis on FNB through
the use of business models and theory.

24
CHAPTER 2
2. Problem analysis
2.1 Introduction
Chapter one provided an explanation of the key themes and concepts that was
used in the study. The research statement, objectives, significance of the
research as well as limitations and delineation was presented. The main
purpose of the study was to identify the key customer satisfaction drivers and
themes (in order of priority) that will lead to increased usage and adoption of
digital banking channels in South Africa.
In this chapter the key constructs and concepts identified will be explored in more
depth through the use of applicable business models and theory to determine the
route causes of the phenomena within the organisation discussed in chapter one.
It is worth noting at this point that the management theory/ models which have
been used, overlaps across the constructs and have been applied holistically
across the themes where appropriate.
Cant, Brink & Brijball (2002) propose that customer satisfaction leads to loyalty,
which in turn increases the likelihood of retention through a perception of value.
The focus on relationships between digital banking channels and customers via
the internet is critical given the intensity of competition in this environment both
locally and internationally.

25
2.2 Risk management landscape
On reflection of the analysis through the various detailed discussions with peers
that are accountable for this function/ department within FNB Online as well as
dialogue with colleagues across the broader group, what emerges is a sound
foundation of corporate governance within digital banking channels. However,
there is certain hygiene management deficiencies identified which are hampering
cohesive and synchronised momentum.
The three environments model suggested by Stapleton (2003: 85) with
assessment of external/ far environment, specifically the uncontrollable STEEP
factors (social, technological, economic, environmental, political) has been
reviewed in conjunction with the macro-environment model of Fahey and
Narayanan (1986) as cited in the text by Bakhru (2010: 10), to unpack some of
the far environmental factors that are infused with the near environment and has
both a direct and indirect influence on digital banking at FNB, figure 2.1. This in
essence suggests that the evolution of digital banking is ultimately influenced and
propelled by technological, regulatory, economic and social factors.
Figure 2.1: Macro-environment influences (Source: adapted from Fahey and Narayanan, 1986)
SOCIOLOGICAL FACTORS � Demographics � Life styles � Social value
POLITICAL FACTORS � Political influence � Regulatory environment
influence
ECONOMIC FACTORS � Interest rate
movement � Debt to disposable
income cycles
TECHNOLOGICAL FACTORS � Increase in security risks via
the internet � Evolution of security solutions
for digital banking � Cost and accessibility of the
internet

26
The value in the model from a strategic perspective is that solving for sociological
factors such as lifestyles aligned to consumer needs and wants e.g.
convenience, cannot be initiated in isolation without considering interdependent
macro factors such as the technological factors or regulatory environment. The
model reveals linkages between the far environmental factors and according to
Fahey and Narayanan (1986) the far environment and its influence on the
organisation can only be unraveled with a systems view i.e. the
interconnectedness on the factors.
In reflecting on FNB, it is plausible to deduce that there is some form of common
ground. Customers, given their fast paced lifestyles require convenience for their
banking engagement. FNB wants to migrate customers to self service channels
and leverage of efficiencies offered through the technological environment. The
misalignment exists at a deeper level i.e. customers want to achieve their lifestyle
objectives, but concerns related to safety of their money, simplicity of the
experience and convenience are infused with high level sociological needs. FNB
wants to leverage efficiencies through this channel to satisfy shareholder returns
and hence satisfying customer needs optimally appears to be a secondary
objective. An example of this is through the deployment of minimal functionality
to contain costs and result in optimal profitability. This is where the ‘system’ is
out of sync.
2.2.1 Increase in security risks via the internet and evolution of
security solutions
Amtul (2011: 3-6) suggests that there are four key levels of security to protect
banks against vulnerabilities, namely; identification and authentication, digital
certification, encryption, and biometrics. In reflecting on the current FNB
scenario in terms of security measures in place (table 2.1), it becomes apparent
that there is room for improvement.

27
Table 2.1: Levels of security (Source: adapted from Amtul, 2011:4)
LEVEL OF SECURITY IMPLEMENTATION STATUS
1. Identification and authentication �
2. Digital certification x
3. Encryption x
4 Biometrics x
Key:
� Yes
x No
FNB has other security mechanisms in place that are an enhancement to level 1
(user name and password) and this is behavioural tracking/ smart block. In
essence, behavioral tracking identifies a number of variables which are unique to
a user e.g. IP address and if there is a high failure rate of matching variables,
transactions are not allowed to proceed. In considering aspects such as the
PKI imperative, it emerges that deployment of this functionality at FNB is
dependant on other departments/ segments “sponsoring” the cost and
prioritisation of development. The federal structure and the nuances related to
the online cost recovery model were discussed in chapter 1.
Each segment/ product house negotiates a budget for development capacity
annually based on the projects they envisage deploying through the digital
channels. This capacity in development weeks is then converted into a cost
budget and once this is exhausted, no further development is undertaken for that
particular stakeholder. This in essence means that if a project such as the PKI
solution is outside the scope of projects planned, this is not implemented as it
would erode into existing development capacity for planned projects, which
would require certain trade-off’s on revenue generating iniatives. The key
constraint relates to scarce resources i.e. there is only so much of development
that the IT team can produce and there is a limited cost allocation by product
houses/ segments within a given fiscal year.
28
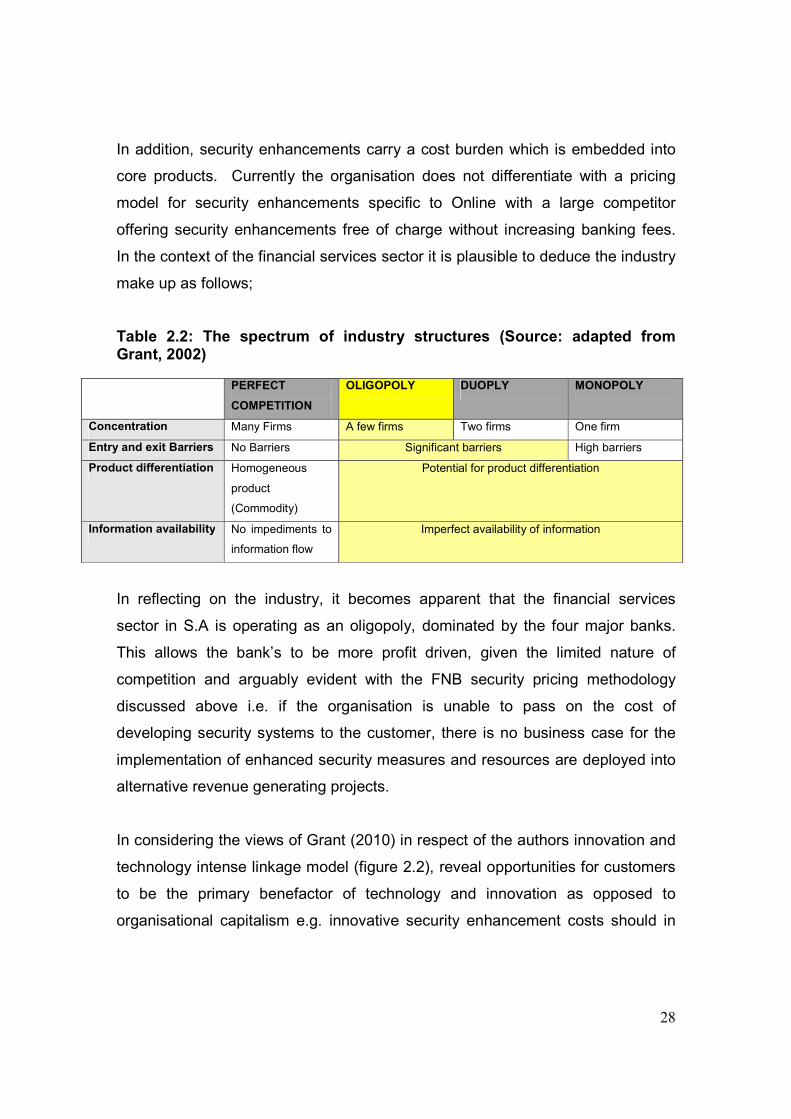
In addition, security enhancements carry a cost burden which is embedded into
core products. Currently the organisation does not differentiate with a pricing
model for security enhancements specific to Online with a large competitor
offering security enhancements free of charge without increasing banking fees.
In the context of the financial services sector it is plausible to deduce the industry
make up as follows;
Table 2.2: The spectrum of industry structures (Source: adapted from Grant, 2002)
PERFECT
COMPETITION
OLIGOPOLY DUOPLY MONOPOLY
Concentration Many Firms A few firms Two firms One firm
Entry and exit Barriers No Barriers Significant barriers High barriers
Product differentiation Homogeneous
product
(Commodity)
Potential for product differentiation
Information availability No impediments to
information flow
Imperfect availability of information
In reflecting on the industry, it becomes apparent that the financial services
sector in S.A is operating as an oligopoly, dominated by the four major banks.
This allows the bank’s to be more profit driven, given the limited nature of
competition and arguably evident with the FNB security pricing methodology
discussed above i.e. if the organisation is unable to pass on the cost of
developing security systems to the customer, there is no business case for the
implementation of enhanced security measures and resources are deployed into
alternative revenue generating projects.
In considering the views of Grant (2010) in respect of the authors innovation and
technology intense linkage model (figure 2.2), reveal opportunities for customers
to be the primary benefactor of technology and innovation as opposed to
organisational capitalism e.g. innovative security enhancement costs should in

29
certain circumstances be absorbed by the business for long term profitability
leverage, which is currently not the case at FNB.
Figure 2.2: Appropriation of value, who gets the benefit from innovation? (Source: adapted from Grant, 2010)
In the context of digital banking channels, arguably, whilst innovation is core to
the culture at FNB, new security strategies are focused toward economic goals
i.e. the mitigation of fraud/ losses from an organisation commercial perspective
as opposed to implementing prudent customer centric security solutions.
2.2.2 Legislative influence on digital banking channels
Aldas-Manzano, Lassala-Navarre, Ruiz-Mafe & Sanz-Blas (2009), proposes that
violation of consumer privacy is an important barrier to electronic transactions
that requires focus. Locally, the key legislative impacts of data confidentiality that
relate to digital banking directly are the following; Protection of personal
information bill 9 of 2009 and the Consumer protection act of 2008.
CUSTOMERS
SUPPLIERS INNOVATOR
IMITATORS AND OTHER
FOLLOWERS
30
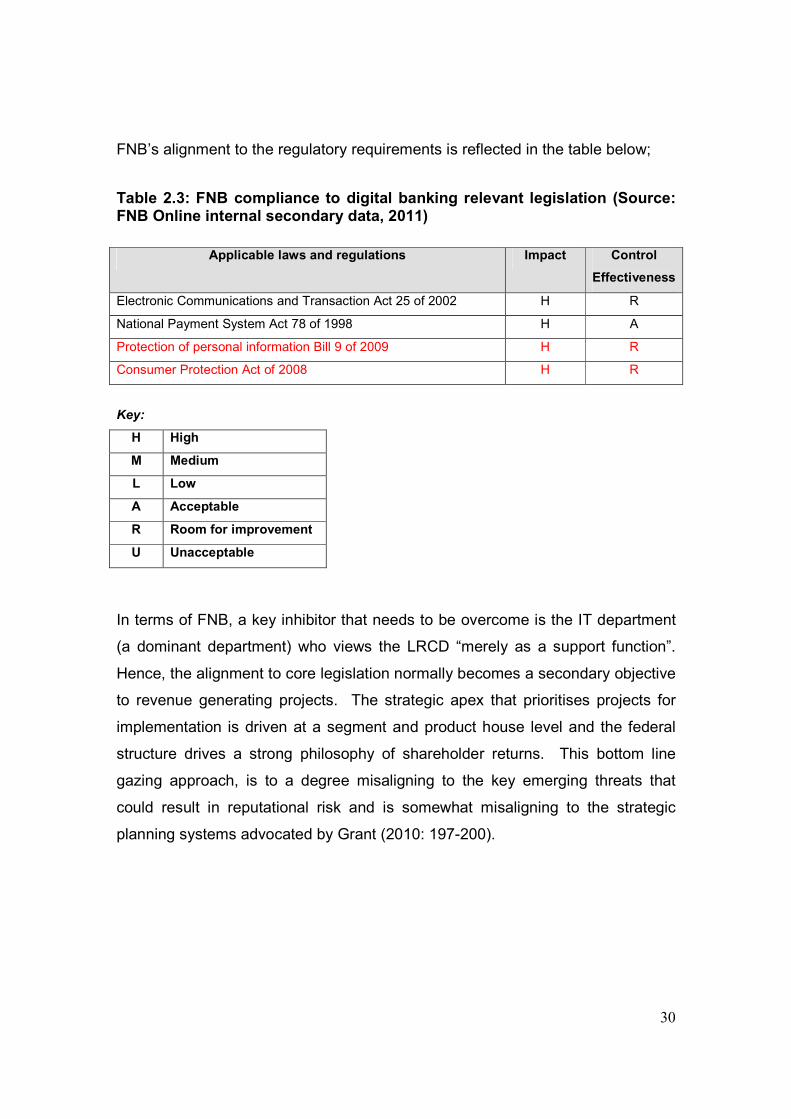
FNB’s alignment to the regulatory requirements is reflected in the table below;
Table 2.3: FNB compliance to digital banking relevant legislation (Source: FNB Online internal secondary data, 2011)
Applicable laws and regulations Impact Control
Effectiveness
Electronic Communications and Transaction Act 25 of 2002 H R
National Payment System Act 78 of 1998 H A
Protection of personal information Bill 9 of 2009 H R
Consumer Protection Act of 2008 H R
Key:
H High
M Medium
L Low
A Acceptable
R Room for improvement
U Unacceptable
In terms of FNB, a key inhibitor that needs to be overcome is the IT department
(a dominant department) who views the LRCD “merely as a support function”.
Hence, the alignment to core legislation normally becomes a secondary objective
to revenue generating projects. The strategic apex that prioritises projects for
implementation is driven at a segment and product house level and the federal
structure drives a strong philosophy of shareholder returns. This bottom line
gazing approach, is to a degree misaligning to the key emerging threats that
could result in reputational risk and is somewhat misaligning to the strategic
planning systems advocated by Grant (2010: 197-200).

31
2.3 Customer centric convenience and Simplicity of the experience
Casala, Flavian & Guinaliu (2008) suggests that banks offer more or less
standardised services and are increasingly seeking out differentiation strategies
that can influence customer satisfaction and loyalty. This view is supported by
Hallowell (1996) whereby the author affirms the importance and link of customer
satisfaction and an organisations performance in the long run. The service
quality dimensions in respect of convenience and simplicity was assessed in the
context of the service-quality gap model developed by Parasuraman, Zeithaml &
Berry (1985) which is reflected in figure 2.3 below.
Figure 2.3: The service quality gap model (Source: adapted from Parasuraman, Zeithaml & Berry, 1985)
GAP 2
Word of mouth communications
Personal Needs Past experience
Expected service
Perceived service
Service delivery (including pre-and post-
contacts)
Translation of perceptions into service quality
specifications
Management perceptions of consumer expectations
External communications to consumers
CONSUMER
MARKETER
GAP 1
GAP 3
GAP 5
GAP
4
GAP 2

32
2.3.1 Gap 1
Education, information and ease of use
FNB is structured as a federal model, with each segment and product house
having its own CEO. Each of these business units has its own marketing
department with the resultant approach of marketing being singular product focus
as apposed to a broader customer pull strategy. The information available via
digital banking channels reflects this silo approach. A strong product push
methodology is adopted and information related to products is somewhat
cumbersome with a 4-5 step process/ clicks to get to the core information in
terms of attributes of products. There is also a re-direct mechanism out of core
product pages to access information such as pricing parameters. The complexity
aligned to finding information could be a frustrating experience for customers
who would expect simplicity and convenience during engagement with this
channel. This is a critical barrier to overcome as this is the initial phase of
research by a customer prior to the purchase of a product.
Bank jargon and improper language remains at the heart of the problem in
respect of information. An example of this is when errors are encountered for
new account opening reflected in figure 2.4 below;
Figure 2.4: Example of an error message for new account opening (Source: FNB Online internal secondary data, 2011)

33
The content currently on the website is also strongly aligned to business
requirements primarily influenced by the product push methodology. This often
results in a reactive approach by digital channels to eliminate redundant or
conflicting/ stale information. The site also lacks education on usage of products,
including online banking, together with education on aspects such security being
at a very high level as can be seen in figure 2.5 below.
Figure 2.5: Example of education parameters in digital banking channels (Source: FNB Online internal secondary data, 2011)
2.3.2 Gap 2
Ease of activating online profiles, after sales service and enhanced cost
efficiencies
The call centre servicing online banking receives approximately 120 000 calls per
month. Recently the business has implemented a substantial charge for
customers that require their passwords to be re-set.

34
This has been implemented to primarily reduce the number of calls pertaining to
this category and drive customers toward the self help functionality available
online. This punitive measure has been instituted with a view of managing the
strained capacity within the call centre environment. The lack of reliable tracking
i.e. numbers pertaining to call categories and the accuracy of the information is
key to this dilemma. Hence, the appropriate staffing of the call centre is not
possible until the business intelligence is improved. This has a direct impact on
customer perceptions in terms of call holding times, costs incurred and simplicity
when the need arises to engage “physically” with the channel.
The resolution of customer enquiries with regard to the consumer segment is
sound as was evident in figure 1.10, however the after sales service pertaining to
the business segment is still significantly low. This is due to the complex nature
of business segment enquiries. Given the focus on cost reduction/ cost
containment, low skilled and temporary staff are employed to manage this
segment and is resulting in negative customer sentiment.
2.3.3 Gap 3 and Gap 4
Process efficiency for new account opening
Much has been done by the organisation in recent times to improve the account
opening process via online and the company has capitalised on efficiencies
through above the line advertising namely “open an account online in under 10
minutes”. Gronroos (1984) as cited in the text by Lindridge, Woods, Ali & Dibb
(2008: 38), suggests that there are two key service expectation dimensions,
namely the technical quality (service outcome) and the functional quality (service
process). The author further advocates that functional quality is highly important
to consumers.

35
In considering the online account opening process, what emerges is that the
technical quality of account opening lives up to promises by the organisation as
can be seen in the evidence presented in figure 2.6 below.
Figure 2.6: Average account opening time via digital channels (Source: FNB Online internal secondary data, 2012)
The bottleneck emerges in the manual fulfillment processes post the online
interaction. Advertising standards authority (ASA) complaints have recently been
escalating where customers are challenging the advertising pertaining to account
opening. What emerges is that the fulfillment processes such as debit order
switching and support documentation is manually driven through product houses
and is out of the sphere of control by online. These manual service breakdowns
are resulting in service failures and negative perceptions of the overall process.
2.3.4 Gap 5
Expected versus perceived service
FNB online was recently voted as “number one in online banking” by competitors
within the industry (PwC – Strategic and emerging issues in South African
banking - June, 2011) and whilst this is an excellent accolade for the
organisation, the company has also fallen prey to the “voice of customers”.
36
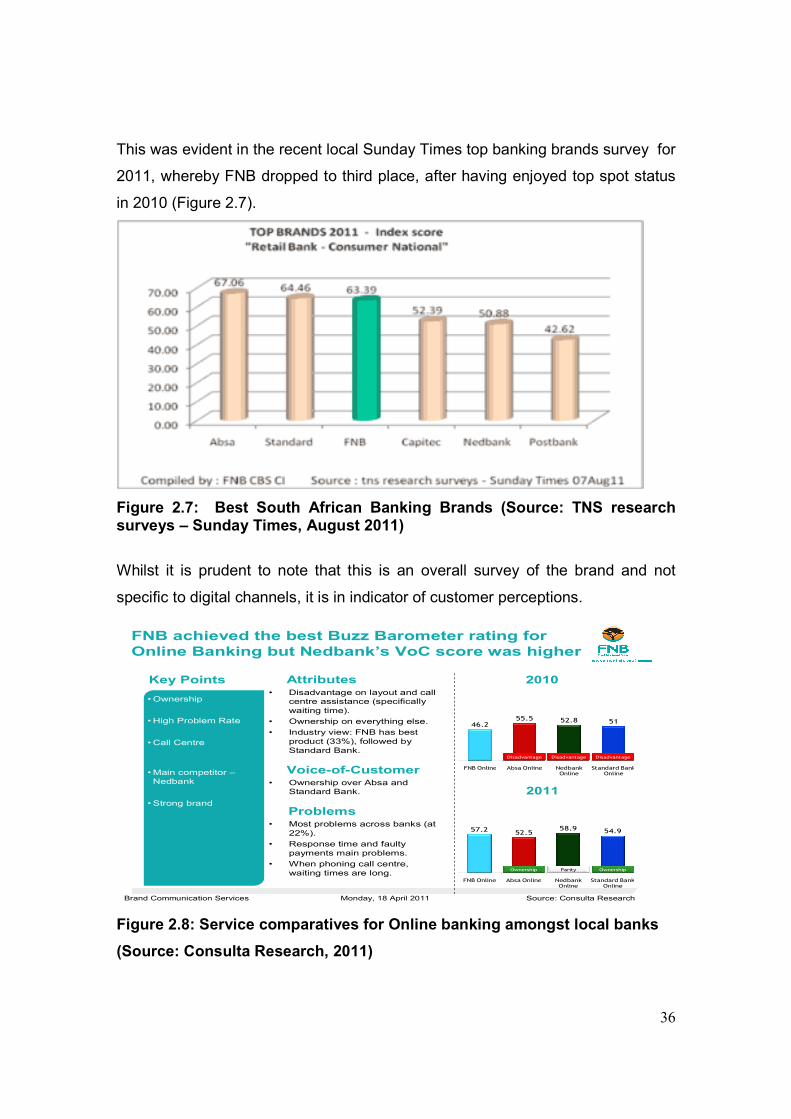
This was evident in the recent local Sunday Times top banking brands survey for
2011, whereby FNB dropped to third place, after having enjoyed top spot status
in 2010 (Figure 2.7).
Figure 2.7: Best South African Banking Brands (Source: TNS research surveys – Sunday Times, August 2011)
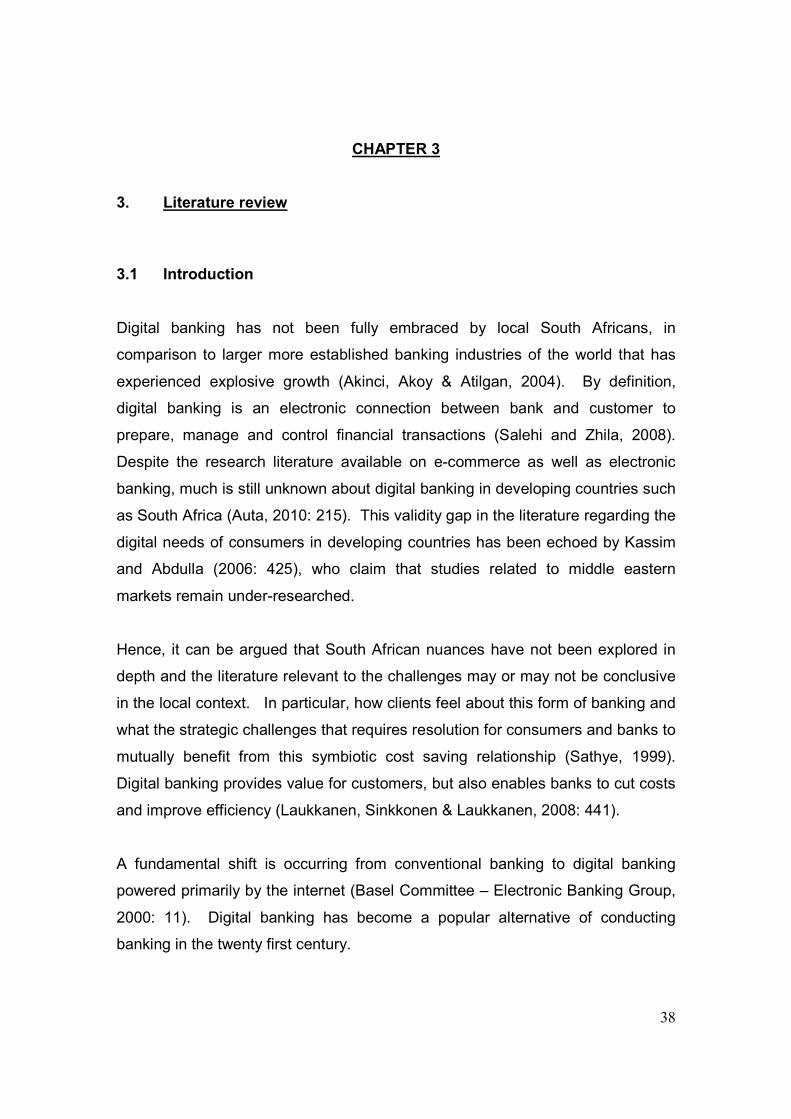
Whilst it is prudent to note that this is an overall survey of the brand and not
specific to digital channels, it is in indicator of customer perceptions.
Key Points• Disadvantage on layout and call
centre assistance (specifically
waiting time).
• Ownership on everything else.
• Industry view: FNB has best
product (33%), followed by
Standard Bank.
• Ownership
• High Problem Rate
• Call Centre
FNB achieved the best Buzz Barometer rating for
Online Banking but Nedbank’s VoC score was higher
Attributes
Problems• Most problems across banks (at
22%).
• Response time and faulty
payments main problems.
• When phoning call centre,
waiting times are long.
Voice-of-Customer• Ownership over Absa and
Standard Bank.
• Main competitor –
Nedbank
• Strong brand
2010
2011
57.252.5
58.9 54.9
FNB Online Absa Online Nedbank Online
Standard Bank Online
46.255.5 52.8 51
FNB Online Absa Online Nedbank Online
Standard Bank Online
Parity
Disadvantage
Ownership
Disadvantage Disadvantage
Ownership
Monday, 18 April 2011Brand Communication Services Source: Consulta Research
Figure 2.8: Service comparatives for Online banking amongst local banks
(Source: Consulta Research, 2011)

37
In respect of digital banking specifically (figure 2.8), there is a strong link to
overall brand perceptions. This coupled with evidence presented in chapter one,
it is plausible to acknowledge that there are areas of improvement for optimal
customer satisfaction to become an enabler and achieve the objectives set out
for the research of this paper.
2.4 Summary
The causes and consequences of customer satisfaction within digital banking
channels remains a complex ecosystem. Throughout this chapter it becomes
clear what is required to improve the overall experience of the customer,
however the glue that binds these components remains customer centricity. It is
only through this buy-in from the organisation that will result in the attainment and
support of strategic goals of the company.
There are some key issues that have emerged from the analysis and these are
as follows;
� There is a misalignment to customer expectations in terms of service
quality solutions, processes and organisational drivers.
� Innovation is core to the culture of the company but cutting edge solutions
are lagging.
� Scarce resources are impeding momentum and traction of virtual banking
channels.
A critical paradigm shift is needed by FNB from traditional service and solution
quality in the fast evolving digital era.
38
CHAPTER 3
3. Literature review
3.1 Introduction
Digital banking has not been fully embraced by local South Africans, in
comparison to larger more established banking industries of the world that has
experienced explosive growth (Akinci, Akoy & Atilgan, 2004). By definition,
digital banking is an electronic connection between bank and customer to
prepare, manage and control financial transactions (Salehi and Zhila, 2008).
Despite the research literature available on e-commerce as well as electronic
banking, much is still unknown about digital banking in developing countries such
as South Africa (Auta, 2010: 215). This validity gap in the literature regarding the
digital needs of consumers in developing countries has been echoed by Kassim
and Abdulla (2006: 425), who claim that studies related to middle eastern
markets remain under-researched.
Hence, it can be argued that South African nuances have not been explored in
depth and the literature relevant to the challenges may or may not be conclusive
in the local context. In particular, how clients feel about this form of banking and
what the strategic challenges that requires resolution for consumers and banks to
mutually benefit from this symbiotic cost saving relationship (Sathye, 1999).
Digital banking provides value for customers, but also enables banks to cut costs
and improve efficiency (Laukkanen, Sinkkonen & Laukkanen, 2008: 441).
A fundamental shift is occurring from conventional banking to digital banking
powered primarily by the internet (Basel Committee – Electronic Banking Group,
2000: 11). Digital banking has become a popular alternative of conducting
banking in the twenty first century.

39
Technology and innovation in many industries as well as banking is what drives
daily business activities. This alternative platform has revolutionised the financial
services industry in recent times both locally as well as internationally (Kerem,
Lustsik, Sorg & Vensel, 2003). This evolution has been endorsed by Amato-
McCoy (2005) who claims that digital banking has become the primary
distribution channel for banks to market their products and services and is
considered a critical profit and success lever (Gan, Clemes, Limsombunchai &
Weng, 2006). Ganguli and Roy (2010: 168), affirms the shift from traditional
channels that are becoming more redundant which is being fueled by the
intensity of competition within the banking industry and organisations are seeking
technology leverage to deliver virtual banking services. These new technologies
have in the last decade or so, contributed significantly to the tremendous growth
experienced in the industry (Barwise and Farley, 2005).
The gap between local competitors is negligible as banks offer similar products
and services, hence the need for differentiation on specific criteria becomes
crucial ingredients for influencing customer satisfaction and loyalty (Ganguli and
Roy, 2010). This can only be achieved by a clear understanding of the priorities
of consumers. Understanding the key drivers that are impacting on adoption has
become a topical issue in the banking sector (Aldas-Manzano, Lassala-Navarre,
Ruiz-Mafe & Sanz-Blas, 2009: 54). According to Rotchanakitumnuai and Speech
(2003), the authors argue that historical studies have focused on positive aspects
of digital banking, but limited research has been undertaken to establish the
barriers of adoption.
Despite heavy investment by banks to improve their digital presence, many
consumers are inactive or engage with this channel on a limited basis (Sarel and
Marmorstein, 2003). Arguably, long term profitability and shareholder value
through this medium can only be achieved through customer satisfaction which is
the glue that galvanizes this recipe (Anderson, Fornell & Mazvancheryl, 2004).
40
3.2 Risk management landscape
Arguably, whilst customers have become accustomed to the convenience of
digital banking channels as suggested by Nath, Schrick & Parzinger (2001) , so
to have the fraudsters in wanting to penetrate this new found area of exploitation
with phishing scams being at the heart of loopholes. Clients are concerned with
protection of their personal data and hence both security and privacy are key
enablers of trust (Lee and Turban, 2001). Wang, Wang, Lin & Tang (2003), are
of the opinion that consumer perceptions about security and privacy could erode
usage intention if customers are skeptical about credibility issues. Trust as a
catalyst of customer commitment is key when engaging through digital channels
as clients are aware of the risks aligned to this channel and even if the risk is low,
perceived risk will negatively influence channel engagement (Kassim and
Abdhulla, 2006: 429).
The secondary agenda by banks in developing countries in terms of data privacy
and protection of information is re-enforced in the work done by Amtul (2011),
whereby the author asserts a need for better protection of customer information
and ethical linkages aligned to invasion of customer privacy is echoed by April
and Cradock (2000). The key aspect here is that whilst business strategies such
as fraud prevention are key economic drivers for the organisation, a greater
threat is aligned to reputation risk if fraudsters were to hack into databases,
functionality etc. (Singh, 2007).
Previous research on electronic banking reveals a direct relationship between
perceived reputation and the foundation of trust (Casalo, Flavian & Guinaliu,
2008). Reduction in risk perception is key to adoption and usage and has been
endorsed by Yoon (2002) who suggests that this fear of hackers and privacy
compromises compounds the uncertainty for clients. Conversely, Gerrard,
Cunningham & Devlin (2003), insinuates that the perpetuation of security and
41
data privacy risk in the news is what is distorting customer perception and the
continued persistence of mistrust that is plaguing digital banking channels.
“Opponents of online banking say that online banking involved heavy risk to the
consumers - 86% of all attacks are directed at the home users’ against 14% at
the financial houses, Zvomuya (2007) and the industry has rushed to get online
without appropriately confronting issues that could compromise its integrity”
(Singh, 2007: 2).
This accusation by Singh (2007) of not unpacking and identifying the risk
dimensions clearly is echoed in the work done by Littler and Melanthiou (2006)
wherein the authors support the inadequate nature of work done in this context.
Hence, the fear of customers with scrupulous characters obtaining sensitive
information such as pin codes persists and is impacting on adoption and usage
(Poon, 2008).
Mukherjee and Nath (2003), point out that ethics around data privacy and
security has to do with shared value between consumer and organisation and is
a vital component in digital banking uptake. This undoubtedly is a key pillar of
success for digital banking and whilst this should be considered a non-
negotiable, the key constraint in implementing customer centric security solutions
is impeded by scarce resource as is the case with FNB. Pearce and Robinson
(2003: 128) states that scarce resources are a function of the limited nature of
resources and should be deployed in fulfilling customer needs.
IT resources within the organisation is aimed at this objective, however the
tradeoff for security enhancements is directed at revenue generating projects.
The ability to prudently deploy resources to gain competitive advantage through
seeking out the most appropriate needs of customers’ and maintaining a market
focus as apposed to the primary thrust of internal objectives, is critical for
success (Segal-Horn, 2004: 177-183).
42
3.3 Customer centric convenience
Online banking within FNB as with most local banks is still embryonic.
Consumers in recent times are demanding an easy to use, convenient platform
that is available when they are ready to engage with the bank, whether this is for
new purchases or transaction usage (Jun and Cai, 2001). Today, customers
have become more intolerant of banks especially where there is a need for
instant gratification, powered by the technological age which has spilled over into
the financial services world through digital banking (Ismail and Panni, 2009).
Speed and convenience remains at the heart of this innovation and has been
accepted by consumers as an evolutionary service platform (Klopping and
McKinney, 2004). This alternative service delivery mechanism is available to
consumers to carry out their banking transactions in addition to traditional
banking channels (Akinci, et al., 2004). The channel facilitates 24 hour
accessibility at a lower cost with easier access (Ismail and Panni, 2009; Lee, Lee
& Eastwood, 2003). Digital banking was developed to enable convenience for
customers but also facilitates economic benefits for banks given the ease of
virtualising services (Kerem, et al., 2003).
Chuang and Hu (2011) propose that an understanding of what produces
customer satisfaction through this service medium can result in higher levels of
retention and attraction via this channel. Wong, Rexha & Phau (2008) argues
against this view and embraces the perspective that traditional and digital
banking channels should be viewed as complimentary. The authors suggest that
customer trust in digital banking is a function of service experience within
traditional channels and thus has a direct bearing on digital banking adoption and
usage. There is further evidence to support this notion of acceptance of
alternative delivery channels based on the research findings by Patricio, Fisk &
Cunha (2003).

43
There is a myriad of challenges that the organisations face as the digital banking
platform matures in the quest for optimal convenience. Chuang and Hu (2011: 3)
suggest that there are six key dimensions, namely; transaction technicalities,
decision-making convenience, interactive interrogation, specialty information,
security and exploration. Laukkanen, et al., (2008: 440) proposes a more basic
stumbling block to digital banking embracement i.e. resistance to innovation.
The authors observe that adoption of innovation has been the focus of past
studies whilst resistance of innovation as a barrier to adoption and usage is
somewhat neglected and that through ignoring the non-adopter feedback,
valuable information to overcome obstacles of resistance are being ignored. This
is also advocated by Parasuraman (2000) who remarks that customers may not
be ready and confident to embrace technology and that there is growing
frustration amongst customers who are availing of technology driven service
mediums. The greater the impact of change of an innovation on a consumer, the
greater the likelihood of resistance will be (Ram and Sheth, 1989).
Gronroos (1984) suggests that there are two key service expectation dimensions,
namely the technical quality (service outcome) and the functional quality (service
process). The author further advocates that functional quality is highly important
to consumers. The service received in the end to end process during customer
engagement with digital channels is a critical aspect of e-service quality (Collier
and Bienstock, 2006).
This implies aspects such as after sales service through call centres as well as
the efficiency achieved through service processes and the successful conclusion
of a transaction such as account opening via digital banking channels are of
paramount importance.
44
The dilemma of managing customers’ expectations throughout the value chain
creates an interesting dichotomy for banks according to Yap, Wong, Loh & Bak
(2009). The authors propose that whilst digital banking creates convenience for
customers, the extent of physical interaction with the bank decreases as well as
switching costs which may ultimately erode customer commitment (Sarel and
Marmorstein, 2003).
To ensure the prudent management of service quality, Parasuraman, Zeithaml &
Berry (1985) propose the ‘gap model’ which was discussed in chapter two, for
identifying deficiencies in the service delivery chain. The authors propose that in
the quest for high-quality service, these gaps must be closed in an attempt to
facilitate positive behavior such as repeat patronage and positive word of mouth
(Lindridge, Woods, Ali & Dibb, 2008: 18).
Digital banking presents clear benefits for clients who have the desire to reclaim
independence over their financial affairs (Jayawardehena and Foley, 2000;
Laukkanen, 2006). This presents a challenging environment for bankers where
instantaneous feedback is not available regarding service quality and service
failures remain trapped in the mind of customers who exit organisations if they
are dissatisfied and not prepared to complain about the quality of service but
rather exercise the power of choice. Service quality remains an essential
ingredient in the recipe to exploit mutual benefits for banks and consumers in
terms of time, cost and getting closer to the customer through this servicing
mechanism (Natarajan, Balasubramanian & Manickavasagam, 2010: 2).
45
3.4 Simplicity of the experience
As tough economic pressures and competitive differentiation continue to rise in
the battle for customers through the most cost effective manner, banks both
locally and internationally are looking at leveraging their self service channels to
improve profitability by reducing reliance on costly conventional distribution
platforms i.e. branches, both in terms of transactability and new customers (Reid
and Levy, 2008). Cristopher, Mike & Amy (2006) assert the importance of digital
channels in the distribution mix of marketing and selling an organisations
products in the quest for profitability.
This is typically aligned to perceptions based on the platforms layout and
relevance of information, aesthetics, navigation, speed of transaction processing
which are key service differentiators (Yang, Peterson & Cai, 2003). This view of
understanding a users’ experience and needs is re-enforced in the work done by
Pyun, Scruggs & Nam (2002). The readiness of consumers to embrace digital
banking channels may differ from user to user. Meuter, Ostrom, Bitner &
Roundtree (2003), suggest that this may be as a result of technophobia with
customers feeling uncomfortable with technology engagement for their banking
affairs. This is primarily fueled by the complexity of the interaction which
involves no personal engagement through this intangible service and has a direct
bearing on adoption of digital banking services (Aldas-Manzano, et al., 2009: 54).
The authors further note that the profile of the consumer is also a key aspect of
adoption. Consumer idiosyncrasies aligned to the individual dependencies such
as capability and capacity has an influence on digital banking usage (Walker and
Johnson, 2006).
This presents the challenge for banks to ensure an intuitive customer experience
and to overcome concerns that consumers may have when engaging with digital
banking channels from the comfort of their homes (Chuang and Hu, 2011).

46
Exploration is arguably the starting point of customer engagement in seeking
specific information to fulfill certain needs. The research undertaken by Chuang
and Hu (2011) revealed a link between the provision of easy to find specialty
information and customer satisfaction. This pertains to usability and availability
of information to facilitate customer empowerment, the former which is a crucial
factor of digital banking maturity (Flavian, Guinaliu & Gurrea, 2006). Littler and
Melanthiou (2006), asserts that despite the lower cost associated with digital
banking, consumers also incur time costs associated with the effort of not being
able to find relevant and useful information easily and this could be a further
source of frustration.
In addition to the cognitive strain on consumers, a further area of frustration that
is constraining digital banking adoption is website download speed (Aldas-
Manzano, et al., 2009). The South African paradox is detailed below. This is
primarily due to banks wanting to aggressively capitalise on marketing iniatives
via this channel which results in high resolution graphics and marketing
messages in an attempt to acquire new consumers or cross sell to existing
customers. Hence, it is plausible to deduce that effort expended when engaging
with a banks website can influence a customers confidence in the channel
(Casalo, Flavian & Guinaliu, 2008). Ease of use as one of the barriers of
adoption has been validated in the work done by Ram and Sheth (1989).
The visual appearance of a banks website is also an important driver of usage
and adoption, in particular the appearance of the website (Madu and Madu,
2002). The authors suggest that it is a key dimension of service quality and a
driver of satisfaction. Casalo, et al., (2008: 400) concluded in their research that
usability is a core determinant of customer satisfaction, loyalty and positive word
of mouth.

47
It becomes apparent that the intuitive experience and perceived ease of use has
a profound impact with behavioural intention to embrace and adopt self service
channels (Wang, et al., 2003).
3.5 Key South African challenges
The South African context of digital banking adoption presents an interesting
technology and financial services paradox. In 2009, the estimated South African
internet users was about 4.6 million (about 10% of the population) and a key
inhibitor of internet uptake is a function of accessibility through enablers such as
fixed line and wireless broadband options (World Wide Worx, 2009). These low
levels of internet penetration caused by limited/ lagging communication
infrastructures are a key reason that is compounding e-commerce challenges in
Africa (Mensah, Bahta & Mhlanga, 2005). South Africa considers access to
communication as a fundamental right of all of its citizens (South Africa.
Department of Communications, 2009).
According to the draft broadband policy for South Africa (September 2009), the
government has re-enforced that accessibility is an essential component of social
development (South Africa. Department of Communications, 2009). The
conflicting agenda of this draft bill manifests with the risk that emerges with
increasing broadband and the government acknowledges the need for a robust
policy against cyber security risks as part of national security (South Africa.
Department of Communications, 2009). This dichotomous relationship between
speed and software piracy rate is resulting in procrastination of rollout plans (IT
news Africa, 2009). This presents an interesting challenge for the local South
African Government who has clear societal objectives but are cautious about the
pervasive influences and security challenges that the internet may bring to local
shores. In addition, to the security challenges, cost is also a key factor in
developing countries (Brown, Letsididi & Nazeer, 2009).

48
Brown, Cajee, Davies & Stroebel (2003) assert that the high cost associated with
access is the core reason for stagnation and low growth of internet users in
South Africa. The options and variety of internet access mechanisms available
to South African home users have been on the rise in recent years according to
Brown, et al., (2009), however the high telecommunication costs in South Africa
is a primary inhibitor to an equitable spread of access across the local socio-
economic groups.
Despite free market principles of competition by more than 200 Internet Service
Providers (ISP’s), the stagnation of the internet sector is primarily due to the
expensive operating environment created by Telkom SA’s dominance in the fixed
line and bandwidth markets (The Internet Society of SA – ISOC-ZA, 2004).
Whilst the launch of wireless broadband services in 2004 has aided modest
growth, cost remains a key driver of access that has limited accessibility to the
fortunate few and not really addressing the needs of the broader South African
community which could be argued mostly live in rural areas (Brown, et al., 2009).
Brown, et al., (2003) further propose that higher speed and therefore
convenience is a key influencer of access choices with the resultant outcome of
user compatibility. Speed of access is therefore a key consideration for most
internet users (Brown, et al., 2009). The greater the compatibility between the
user and the technology, the more likely it is to be adopted (Tan and Teo, 2000).
One of the influences for embracing electronic banking in South Africa was found
to be compatibility (Brown, et al., 2003).
Hence, it is plausible to deduce that internet access mechanisms will be a key
leading indicator on behavioural influence to adopt digital banking (Ifinedo, 2006).
Local banks are therefore faced with uncontrollable influences in the external
environment which further compounds their digital banking objectives and to
achieve these goals a mindset shift is needed to provide consumers with
innovative products and services at lower costs and better value (PwC – The
new digital tipping point, 2012: 3).

49
3.6 Summary
Given the technological pace and methods of conducting business in the twenty
first century through mediums such as the internet, it can be assumed that digital
banking will change the future of the financial services industry (King, 2010).
Through embracing these aspects, service providers will be poised to increase
their digital banking base in the future (Nath, et al., 2001). The primary challenge
is how banks will meet the demands of consumerism in a digitally evolved
environment where there is no personal interaction and increased risk with a
potential total restructure of the industry fueled by the internet (Basel Committee
– Electronic Banking Group, 2000: 3).
Howcroft and Durkin (2000) argue that digital banking will never fully replace
traditional banking, and whilst this is plausible to acknowledge, the benefits for
both banks and consumers far outweigh any thoughts of procrastination in
solving for optimal customer satisfaction through this medium.

50
CHAPTER 4
4. Research Methodology and Design
4.1 Introduction
Chapter two resulted in the interrogation of the business problem and unpacking
the key determinants of customer satisfaction within the organisation that may
facilitate increased adoption and usage of digital banking channels in South
Africa. Chapter three focused on the theoretical nature of academic views with
the intention to further explore what customers want from this channel, the critical
drivers of customer satisfaction as well as perceived nuances relating to service
via traditional banking versus digital banking channels.
The purpose of this chapter is to present the framework of the research that was
undertaken and specifically addresses the rationale for the choice of approach,
critical components of the design as well as the methodology. The research
methodology for this study primarily followed a qualitative approach. However,
the quantitative approach was also used to compliment the qualitative method as
they are not necessarily mutually exclusive (Lewis and Charlesworth, 2003: 23).
Bryman (1989: 24-25) describes the emphasis of an individuals perspective
which is the key differentiator between qualitative and quantitative approaches.
The analysis and interpretation for the results of this study is primarily presented
through the descriptive statistical approach proposed by Taylor (2002) to identify
trends/ frequency distribution regarding the themes and drivers of customer
satisfaction.
51
4.2 Aim of the research
The research was undertaken through a survey that was targeted at collecting
significant, accurate and relevant data and was completed approximately a
month from commencement. The research effort focused on specifically
analyising the following problems/ objectives:
� To determine what customers primarily want from digital banking
channels, in terms of the core themes identified.
� To establish the drivers which are most important to customers.
� To investigate the perceptions of service via digital banking channels.
The study was therefore aimed at identifying customer satisfaction determinants
that will result in an increase in adoption and usage of digital banking channels in
South Africa.
4.3 Research approach and design choice
Coldwell and Herbst (2004: 35) describe ‘research design as the glue that holds
the research project together’ and advocate that the design forms the structural
framework of the research to be carried out. According to Zikmund (2006),
conducting a research design provides a detailed plan which will guide and
provide focus of a study. The two main research methods that are available to
researchers are quantitative and qualitative.
The quantitative approach is based on scientific outcomes through statistical/
mathematical analysis. Lewis and Charlesworth, (2003: 20) suggest that in
opting for this method, it is imperative to ensure that the appropriate variables are
chosen which will enable the researcher to prove or disprove a particular
hypothesis through logic and reason.

52
Verma and Beard (1981: 184) asserts the constraints of this method and
advocate that hypothesis testing is normally a guide for validation as it is
generally based on a ‘gut feeling’ of the researcher. The qualitative approach
leans more toward a behavioral understanding of a certain phenomena and is
descriptive in nature but as pointed out by Lewis and Charlesworth (2003: 21),
people’s opinions and attitudes can change.
The research approach for this study primarily followed a qualitative approach
but also incorporated methodological as well as investigative triangulation
principles and is descriptive in nature (Saunders, Lewis & Thornhill, 2003).
Triangulation emerges as a concept specifically to address issues whereby there
is a threat to reliability or validity, (Saunders,et al., 2003). Lewis and Thornhill
(2003), further suggest that through combining multiple methods e.g. the use of
qualitative and quantitative methods with primary or secondary data gives rise to
triangulation principles.
The quantitative methodology was used as a supplementary approach to the
qualitative method. The intent was to interrogate the primary data, specifically to
leverage off the inductive approach as suggested by Saunders, et al., (2003: 85-
87). The authors advocate that through the collection of data, a theory can be
formed through the analysis and interpretation, which is an inverse approach of
summarising what data is to be collected versus what the data could possibly
reveal.
The aim was to establish if there is indeed a relationship between the
independent and dependant variables discussed in chapter one through viewing
consumers in a humanistic way (Saunders, et al., 2003: 87).
53
The primary data for this study was collected using a measuring instrument in the
form of a self-administered web questionnaire which comprised of a series of
questions and other prompts for the purpose of gathering opinions and
perceptions from respondents regarding the themes and adopted a five-point
Likert scale to facilitate frequency analysis (Cant, Gerber-Nel, Nel & Kotze, 2003:
113).
The secondary data that is available within the organisation was aimed at further
unpacking the problems identified to support the validity of the results obtained
from the qualitative study. This typically incorporated historical behavioral trends
that produced quantitative data analysis opportunities for trend analysis, to gain
deeper insights regarding customer satisfaction levels, specifically to FNB. This
was achieved through comparative variable analysis such as fraud trends versus
new functional deployment of fraud prevention measures (Saunders, et al., 2003:
350). In addition, historical customer uptake was analysed in relation to new
functionality deployment such as heuristic enhancements to establish if there
were any links between these variables.
The nature of the organisation, given the stringent requirement of shareholder
return expectations as well as resource scarcity, demands a sound business
case for project implementation trade-offs and hence the combined research
approach to facilitate a factual presentation of the findings.

54
4.4 Data gathering tool and procedures
The primary data for this study was collected using a single measuring
instrument in the form of a self-administered web questionnaire. This comprised
of a series of open and closed questions and other prompts for the purpose of
gathering information from respondents and adopted the five-point Likert scale as
proposed by Cant, Gerber-Nel, Nel & Kotze (2003: 113) that varied from strongly
disagree to strongly agree (Annexure A). The choice for the survey method was
mainly due to the mix of the approaches chosen which in addition to providing
insights on opinions this also generated some data that was used for the
inductive hypothesis analysis (Saunders, et al., 2003: 85).
In addition, the survey method was appropriate given the constraint of tight
timelines for the completion of the study as well as work pressures and
commitments. Whilst the web based questionnaire resulted in certain direct
costs, the time management demands outweighed alternative methods such as
interviews. The secondary data was obtained from corporate records within the
organisation. The intention was to use existing relevant information to assist with
providing supporting evidence around the chosen study, where applicable.
Cognisance to the main disadvantage of the possible low response rate that
normally results from surveys as suggested by Taylor (2001: 49) was considered.
However, follow up activities such as reminder e-mails were used to overcome
potential low response rates (Taylor, 2001). In an attempt to further overcome
response bias through the use of the Likert rating scale suggested by Cant,
Gerber-Nel, Nel & Kotze (2003: 113), the scale was also inversed starting with
strongly disagree and ending with strongly agree, incorporating the views
advocated by Taylor (2003: 57). The choice for a rating scale was also embraced
to aid frequency as well as inductive hypothesis analysis (Saunders, et al., 2003:
85; 354).

55
4.4.1 Data gathering tool design
In formulation and construction of the questionnaire, aspects from chapter three
was reviewed in particular the work done by Ganguli and Roy (2010: 174-175) as
well as Casalo, Flavian & Guinaliu (2008). The literature of Ganguli and Roy
(2010) was chosen given the close alignment to this particular study whereby the
authors were testing technology based service quality dimensions of banking in
India and the resultant impact on customer satisfaction and loyalty. The work
done in respect of website usability as a driver of customer satisfaction was also
of particular importance (Casalo, et al., 2008: 404).
The survey questions were adapted by leveraging of the advice provided by
Laxton (2004) as cited in the text by Coldwell and Herbst (2004: 25-91) to ensure
relevance within the local banking sector. The full adaptation and customisation
of specific questions derived from the literature are reflected in table 4.1 below, in
no particular order or categorisation as this was structured based on additional
pilot studies and input received (Annexure A). In an attempt to ensure simplicity
and understanding of the questions, an additional pilot study was re-conducted
with a small sample of 10 individuals outside the organisation to ensure that the
questions were clearly understood by non-bank employees and no significant
need for revision of the questions were noted.
Table 4.1: Questions used in the web based survey instrument (adapted from literature review, 2011-2012)
Question Theme Key Literature Reference � If I was a victim of bank fraud i.e.
a loss of funds without consent, I would continue to make use of electronic channels.
� Security (Singh, 2007); (Yoon, 2002); (Wang, Wang, Lin & Tang, 2003)
� There is good security offered through electronic banking channels.
� Security (Kassim and Abdhulla, 2006)
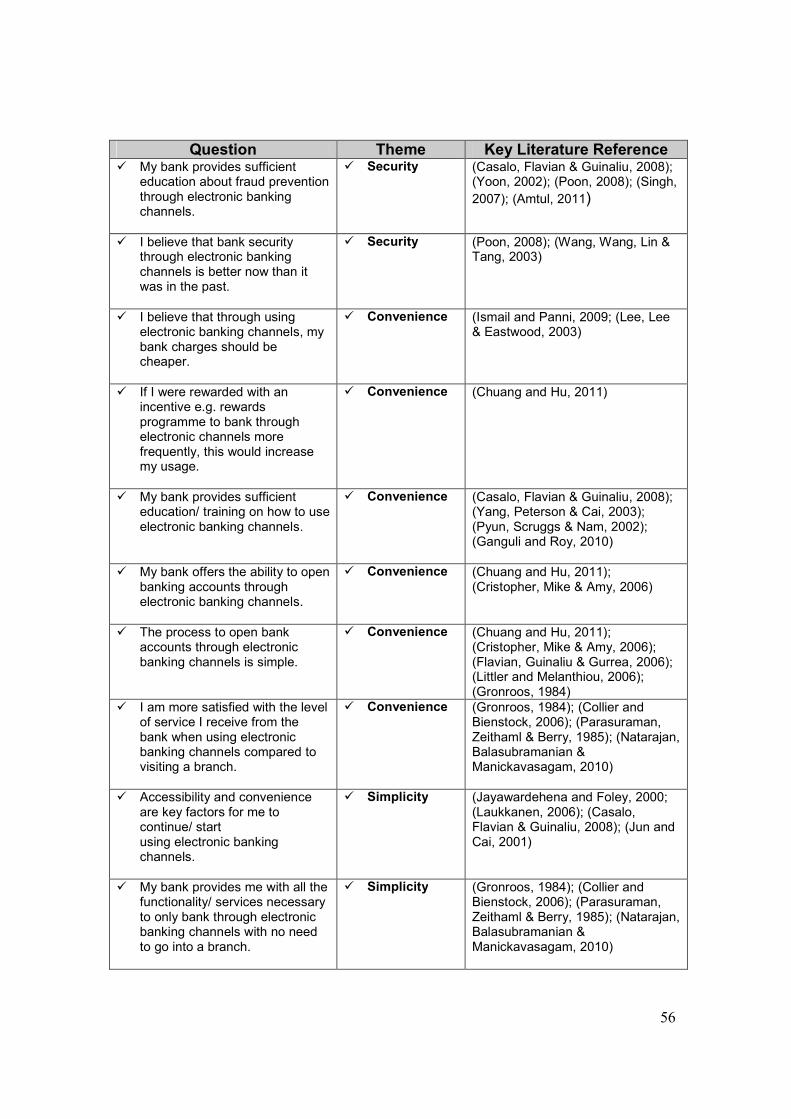
56
Question Theme Key Literature Reference � My bank provides sufficient
education about fraud prevention through electronic banking channels.
� Security (Casalo, Flavian & Guinaliu, 2008); (Yoon, 2002); (Poon, 2008); (Singh,
2007); (Amtul, 2011)
� I believe that bank security through electronic banking channels is better now than it was in the past.
� Security
(Poon, 2008); (Wang, Wang, Lin & Tang, 2003)
� I believe that through using electronic banking channels, my bank charges should be cheaper.
� Convenience (Ismail and Panni, 2009; (Lee, Lee & Eastwood, 2003)
� If I were rewarded with an incentive e.g. rewards programme to bank through electronic channels more frequently, this would increase my usage.
� Convenience (Chuang and Hu, 2011)
� My bank provides sufficient education/ training on how to use electronic banking channels.
� Convenience
(Casalo, Flavian & Guinaliu, 2008); (Yang, Peterson & Cai, 2003); (Pyun, Scruggs & Nam, 2002); (Ganguli and Roy, 2010)
� My bank offers the ability to open banking accounts through electronic banking channels.
� Convenience (Chuang and Hu, 2011); (Cristopher, Mike & Amy, 2006)
� The process to open bank accounts through electronic banking channels is simple.
� Convenience
(Chuang and Hu, 2011); (Cristopher, Mike & Amy, 2006); (Flavian, Guinaliu & Gurrea, 2006); (Littler and Melanthiou, 2006); (Gronroos, 1984)
� I am more satisfied with the level of service I receive from the bank when using electronic banking channels compared to visiting a branch.
� Convenience
(Gronroos, 1984); (Collier and Bienstock, 2006); (Parasuraman, Zeithaml & Berry, 1985); (Natarajan, Balasubramanian & Manickavasagam, 2010)
� Accessibility and convenience are key factors for me to continue/ start using electronic banking channels.
� Simplicity (Jayawardehena and Foley, 2000; (Laukkanen, 2006); (Casalo, Flavian & Guinaliu, 2008); (Jun and Cai, 2001)
� My bank provides me with all the functionality/ services necessary to only bank through electronic banking channels with no need to go into a branch.
� Simplicity (Gronroos, 1984); (Collier and Bienstock, 2006); (Parasuraman, Zeithaml & Berry, 1985); (Natarajan, Balasubramanian & Manickavasagam, 2010)

57
Question Theme Key Literature Reference � The information available
through electronic banking channels is easy to understand.
� Simplicity
(Casalo, Flavian & Guinaliu, 2008); (Yang, Peterson & Cai, 2003); (Pyun, Scruggs & Nam’ 2002); (Ganguli and Roy, 2010)
� The information available through electronic banking channels is relevant to my needs.
� Simplicity (Casalo, Flavian & Guinaliu, 2008); (Yang, Peterson & Cai, 2003); (Pyun, Scruggs & Nam’ 2002); (Ganguli and Roy, 2010)
� Overall, I am satisfied with the electronic banking services offered by my bank.
� Simplicity (Singh, 2007); (Yoon, 2002); (Casalo, Flavian & Guinaliu, 2008); (Yang, Peterson & Cai, 2003); (Ganguli and Roy (2010)
� What would be the most important factor to start/ continue transacting via electronic channels such as the Internet and/or Cell phone banking? (Please select your preferences by order of priority of 1 to 3)
o Ease of access o Ease of use o Education o Incentives o Security to prevent fraud o Simplicity in opening
bank accounts o Speed of transaction
processing o Privacy of personal
information o Other
� Security � Convenience � Simplicity
(Singh, 2007); (Yoon, 2002); (Casalo, Flavian & Guinaliu, 2008); (Yang, Peterson & Cai, 2003); (Ganguli and Roy, 2010)
The key intent of the questionnaire was to obtain data based on the opinions/
perceptions of local banking consumers that are crucial for optimal customer
satisfaction.
58
4.4.2 Data gathering procedure parameters
In an attempt to unpack the strategic challenges facing banks through customer
centricity, the following data gathering approach was embarked on;
� Primary data collection (external)
� Secondary data collection (internal)
o Customer service survey
o Behavioral changes in usage and adoption specific to digital
banking
Primary Data
The primary data for this study was collected through the use of the survey
method.
Secondary data
� Customer service survey
This survey relates specifically to an online banking internal survey where
customers were probed on a survey “at log-out”. The question was rated
purely on a confidence score of 1 to 10. The question was “Based on your
interaction with Online banking, what is the likelihood that you will refer a
friend or family member to FNB”. The key limitation of this particular
secondary data was that it was generalistic in nature i.e. overall banking
services and did not necessarily encapsulate digital banking drivers per se.
Whilst the survey produced a substantial number of responses, a further
limitation is that it may not be reflective of the total digital banking population
given the time constraints of individuals that may not have been prepared to
complete the survey.

59
Whilst there were certain constraints with the data, it was still relevant to
facilitate triangulation principles to assess the satisfaction levels of customers
within FNB.
� Behavioral changes in usage and adoption specific to digital banking
The aim through assessment of this secondary data was to establish the
possible association in the growth of new customers with the deployment of
new functionality. In addition, the intent was also to assess whether there is a
reduction/ increase in usage aligned to specific fraud trends in the business
with an intervention such as the introduction of behavioral tracking to
minimise fraud discussed in chapter two. A review was also undertaken of
growth in new consumers to establish if there was any relationship to
interventions such as usability and heuristic enhancements.
4.5 Characteristics and scope of the sample
Webster (1985) as cited in the text by Coldwell and Herbst (2004: 74) defines a
sample as ‘a finite part of a statistical population whose properties are studied to
gain information about the whole’. In considering this definition it becomes clear
that the purpose of sampling is to serve as a dipstick about a certain
phenomenon with the key to a sample being representative; it must be
underpinned by randomness. Taylor (2001: 59) defines a sample as being
random when ‘every item in the population had an equal chance of being
chosen’.
The non-probability, convenience sampling technique proposed by Cant, Gerber-
Nel, Nel & Kotze (2003) was chosen for this study. However, certain quota
sampling parameters as suggested by Taylor (2001: 62) was incorporated
specifically to obtain an even spread of customers with the major restraint being
placed on age, gender and income.

60
The population sample for this study included people from different ages ranging
from 20-56+ as well as diverse gender, race and income mixes. The key reason
for the choice of age and income variables was to target the economically active
population.
The intention was to exclude income bands and racial groups from the
questionnaire to enhance the likelihood of a higher response rate. An eventual
distribution of 378 questionnaires was achieved based on resource constraints
with an unexpected positive response rate of >60% within the local banking
industry was achieved. The method of contact was via e-mail that integrated into
a free survey website namely ‘surveybuilder.com’. to assess customer opinions
about the key enablers of digital banking satisfaction and sought to address all of
the objectives identified.
The activities to increase the response rate were discussed earlier and will be
further elaborated on later in this paper. In an attempt to overcome the potential
sample challenges i.e. no overall industry view, a research house was employed
with the specific objective to sample customers and obtain their views from all
four major banks across the industry as well as ensuring a prudent mix in terms
of demographics. This was purely for the distribution to the research company’s
database, at the writers own cost, to ensure a prudent sample from the industry.
The analysis and interpretation of the findings was undertaken by the writer. The
survey was conducted through a link via e-mail and all collected data was only
accessible to the writer via appropriate password and sign on authentication.
Hence, the research house had no access to the respondent data. The briefed
criteria for the sampling were as follows;

61
Demographics
- Age (20-56+).
- Language (English speaking – because the survey was in English).
- Race (even split).
- Gender (even split).
- Income (based on LSM >7).
Banking
- Must have an active bank account.
- Must bank with one of the major banks in South Africa.
Geographic spread
- Must be an even split between all provinces in South Africa (if
possible).
Physiographical
- Experience with internet / technology (i.e. different levels of tech
savvy).
- Even split between users who make use of a Cell phone to access the
internet and those who use a PC (if possible).
The purpose of the study was explained to the respondents (Annexure A) and no
risk to anonymity or confidentiality was envisaged given the password protection
of the survey results and the findings that was only accessible to the writer. The
research house was re-reimbursed per completed survey received.

62
4.6 Data analysis approach
A conceptual model was adapted to ensure congruence with the tool, research
objectives and problem statement through integration of the themes, attributes
and drivers which are reflected in figure 4.1 below.
Figure 4.1: Conceptual model for research framework (Source: adapted from Yap, Wong, Loh & Bak, 2009)
The main analysis approach for both primary and secondary data that was
adopted for this study was the descriptive or exploratory method (Taylor, 2002).
KEY DRIVERS
� Fraud prevention � Privacy of personal information � Usability and functionality � Education � Accessibility � Simplicity of product purchase
� Speed of transaction processing
THEMES � Security � Convenience
� Simplicity
KEY ATTRIBUTES
� Levels of security � Data confidentiality � Process efficiency � Relevance and availability of
information � After sales service � Enhanced cost efficiencies � Incentivisation/ reward � Ease of use/ navigation � Visual appeal
Increased willingness to adopt and use
digital banking
CUSTOMER
SATISFACTION
63
The author proposes that this approach is used to describe and summarise raw
data. The technique employs a wide variety of visual representation
incorporating graphs and tables.
4.7 Technical and quality issues
The research had incorporated prudent consideration of the key technical
parameters to ensure reliability, validity and ethics of the research that was
undertaken.
4.7.1 Reliability and validity of data
Reliability
Data is considered reliable if it is without bias (Lawton, 2003) and equally
important, if it is consistent (Laxton, 2004). Hence, it is plausible to deduce that
reliability is improved if sampling bias and sampling errors are minimised. Given
the nature of qualitative responses in that it is assessing people’s perceptions
and attitudes, Lewis and Charlesworth (2003: 19) assert that these opinions can
change and therefore this is a drawback of the qualitative approach. If one
accepts that reliability can be improved through reducing sampling bias and
sampling errors then it is plausible to accept that there are ways of overcoming
this disadvantage. In the context of this study, the following activities were
pursued to ensure enhancement of reliability;
� Careful construction and design of the questionnaire incorporating the
suggestions by Taylor (2001, 51-57).
� Pilot studies were re-done to ensure simplicity of the questions
incorporating structured sections, with participants that are not bankers.

64
� A sample size that is as large as possible, given resource constraints was
chosen as well as the inclusion of customers from more than one banking
institution.
� Activities to increase the response rate were considered and rigorously
pursued e.g. follow up e-mails.
Validity
Leedy and Ormrod (2005: 28) suggest that validity is concerned with the
effectiveness of the measuring instrument. According to Laxton (2004), validity is
indicative of the accuracy of data obtained from a sample and can be categorised
into internal and external validity.
Internal validity
There are several factors that possibly could undermine internal validity, and the
key inhibitors relevant to this study are reflected below (Laxton, 2004);
� Respondents dropping out of a study or not completing the questionnaire;
� Bias in the selection of the sample group.
External validity
The factors that possibly could undermine external validity, in the context of this
study relate to the following (Laxton, 2004);
� Nature of study participants;
� Time-period or place at which the study is conducted.
To enhance the validity of the study, the following was done:
� Consciously attempting to minimise bias in the selection of the sample
group through inclusion of as many different types of the possible banking
population.
65
� Improving the questionnaire layout and ensuring that the instrument had
comprehensively assessed the chosen area of investigation. This was
achieved through the use of both open and closed probes in attempting to
understand what is important to customers and their perception of the
environment.
� Triangulation principles through the use of secondary data from within the
organisation as a supplement to the primary data obtained from the field
research.
4.7.2 Overcoming potential bias
Laxton (2004) proposes that sampling bias is the tendency to choose certain
individuals over others for inclusion in a sample group. The sample group is thus
not reflective of the target population. To overcome potential bias, the sample
was targeted to ensuring that a fair mix which is representative of the
demographics of South African’s e.g. an even mix of race, age and gender. In
practice and aligned to the purpose of this study, customers with an active bank
account was necessary as they would be engaging in banking activities.
The reason to conduct the study through electronic survey, whilst it is
acknowledged that this was not truly random given the considerable exclusion of
possible banking clients through electronic access restrictions, was purely based
on the key constraint of time. However, this also had advantages in that issues
such as bias and ethical issues that may have emerged through an interview
research method were minimised. It is however acknowledged that the data and
analysis could have been enriched through the interview method by
understanding how people feel through body language assessment, specific
reasons of responses, etc.
66
4.7.3 Ethical issues/ confidentiality
Permission was granted by the organisation to pursue the area of research as
well as a confidentiality agreement that is in place with Unisa to prevent leakage
of sensitive internal information that is not in the public domain without the prior
consent of the organisation. The aspects of overcoming confidentially related
issues aligned to the research company were discussed earlier. To ensure that
research ethics were aligned to Unisa’s guidelines, in addition to the above, the
following was instituted;
� Respondent confidentiality and anonymity was communicated, respected and
protected.
� Integrity was applied to the presentation of the findings in terms of factual
representation of the research results with no manipulation of data in any
form or context.
4.7.4 Generalisability
Given the approach for the study, it is accepted that broad generalisation to the
overall banking population cannot be extrapolated in totality (Laxton, 2004).
However, it is plausible to acknowledge that through researching across the
major S.A banks, specifically the targeted sample criteria, it is a fair assumption
that the research revealed the key determinants that are of importance to South
African’s which are enablers of customer satisfaction in the digital banking
sphere.
67
4.8 Summary
This chapter focused on the research design and methodology concepts that
were undertaken. Theoretical definitions and considerations were also discussed
as well as the importance of the technical and quality issues to facilitate validity
and reliability of the area of research was duly considered. Information regarding
the questionnaire design in particular the development of the instrument was
elaborated on. In the next chapter, the findings obtained from the research
undertaken has been analyised and presented in the format incorporating the
techniques suggested above.
68
CHAPTER 5
5. Research results
5.1 Introduction
The research methodology and design components were discussed in the
previous chapter. The content of this chapter focuses on the presentation and
analysis of the results obtained from the research undertaken. To understand
the perceptions and opinions of what will improve customer satisfaction and lead
to an increase in adoption and usage of digital banking channels, the qualitative
approach was the spearhead method to obtain the relevant primary data. The
primary data gathered has been organised and structured to provide meaningful
information to unpack the determinants of perceived value from a customer
standpoint. The secondary data was obtained from organisation reports that are
most applicable to the study and have been segmented into two key sections
namely; internal customer service survey and behavioral changes in usage and
adoption based on certain organisational events/ interventions.
5.2 Presentation of biographical information
A total of 378 questionnaires were distributed with the study resulting in 246
completed questionnaires being received with a response rate of 65% being
achieved. The high response rate is attributed to rigorous follow up processes
such as follow up e-mails as well as the pay for performance parameters
contracted with the outsourced research house i.e. remuneration for fully
completed questionnaires only. This coupled with the intentional exclusion of
race and income bands may also have contributed to the higher response rate.
The population sample for this study included people from different ages ranging
from 20-56+ as well as diverse gender, race and income mixes.

69
The key reason for the choice of age and income variables was to target the
economically active population.
The results of section A of the questionnaire are summarised in table 5.1 below.
Table 5.1: Biographical mix
VARIABLE RESPONSE
FREQUENCY
PERCENTAGE
AGE
� 20-25
� 26-35
� 36-45
� 46-55
� 56+
25
91
90
23
17
10%
37%
37%
9%
7%
GENDER
� Male
� Female
114
132
46%
54%
BANKING INSTITUTION
� ABSA
� Capitec
� First National Bank
� Nedbank
� Standard Bank
� Other
79
16
92
48
75
0
25%
5%
30%
15%
24%
0%
MAKING USE OF ELECTRONIC CHANNELS
� Yes
� No
231
15
94%
6%
From the table above it becomes evident that there is an equitable mix of the
targeted sample, albeit somewhat skewed toward users of electronic channels.
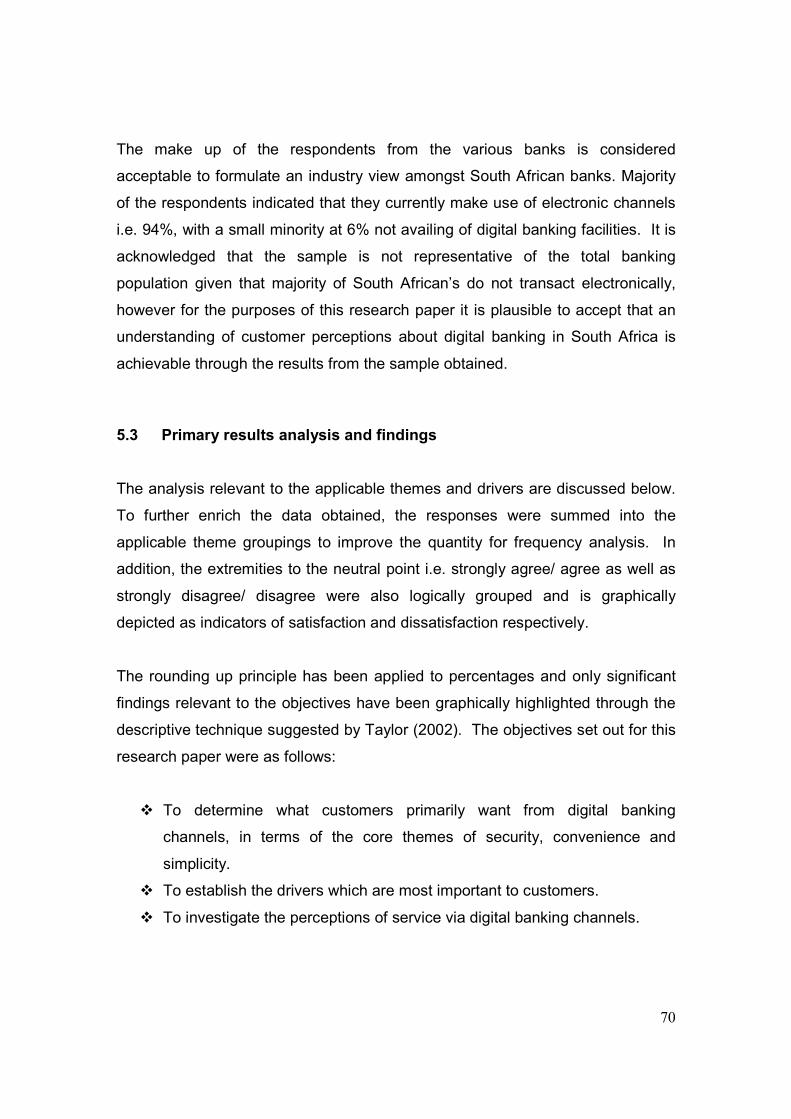
70
The make up of the respondents from the various banks is considered
acceptable to formulate an industry view amongst South African banks. Majority
of the respondents indicated that they currently make use of electronic channels
i.e. 94%, with a small minority at 6% not availing of digital banking facilities. It is
acknowledged that the sample is not representative of the total banking
population given that majority of South African’s do not transact electronically,
however for the purposes of this research paper it is plausible to accept that an
understanding of customer perceptions about digital banking in South Africa is
achievable through the results from the sample obtained.
5.3 Primary results analysis and findings
The analysis relevant to the applicable themes and drivers are discussed below.
To further enrich the data obtained, the responses were summed into the
applicable theme groupings to improve the quantity for frequency analysis. In
addition, the extremities to the neutral point i.e. strongly agree/ agree as well as
strongly disagree/ disagree were also logically grouped and is graphically
depicted as indicators of satisfaction and dissatisfaction respectively.
The rounding up principle has been applied to percentages and only significant
findings relevant to the objectives have been graphically highlighted through the
descriptive technique suggested by Taylor (2002). The objectives set out for this
research paper were as follows:
� To determine what customers primarily want from digital banking
channels, in terms of the core themes of security, convenience and
simplicity.
� To establish the drivers which are most important to customers.
� To investigate the perceptions of service via digital banking channels.

71
5.3.1 Security
The results reveal that majority of customers are both satisfied with the level of
security offered by banks (63%) as well as continuance with electronic banking in
the case of fraud being perpetrated i.e. 42% of consumers would continue to
make use of digital banking services, which is depicted in figure 5.1 and 5.2
respectively. The concern emerges with the detractors that would stop using
electronic banking (29%) as well customers whose change in usage behavior is
unknown also at 29%, if they were defrauded.
Overall Security Analysis
19%
18%63%
Dissatisfied
Neutral
Satisfied
Figure 5.1: Overall security analysis

72
29% 29%
42%
0%
5%
10%
15%
20%
25%
30%
35%
40%
45%
Dissatisfied Neutral Satisfied
Fraud perpetration
Question 5
Figure 5.2: Fraud perpetration
The key differentiator of the critical security driver exists in the protection of
personal information. Majority of customers (48%) claim that they would stop
using electronic banking if their personal information was compromised. Only
22% of consumers feel they would continue to use electronic channels and 30%
remains unsure of the impact that personal data breaches would have on the
digital banking behavior as can be seen in figure 5.3 below.
48%
30%
22%
0%
10%
20%
30%
40%
50%
Dissatisfied Neutral Satisf ied
Compromise of personal information
Question 7
Figure 5.3: Compromise of personal information
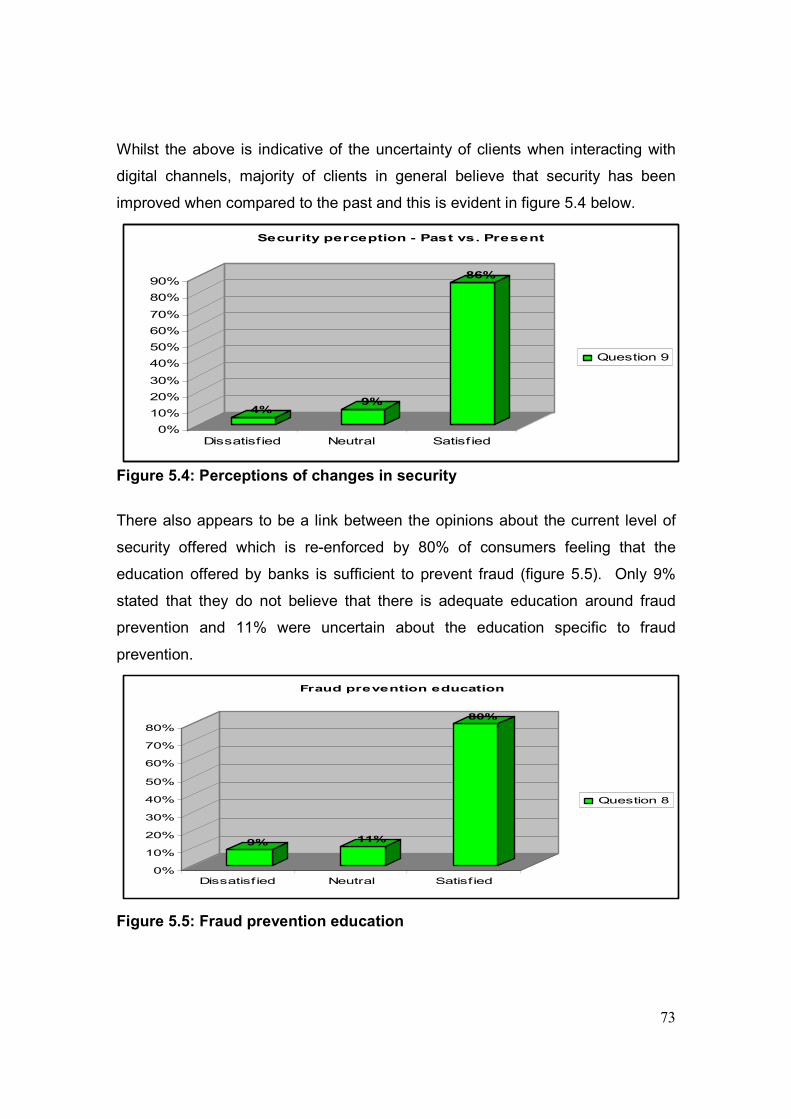
73
Whilst the above is indicative of the uncertainty of clients when interacting with
digital channels, majority of clients in general believe that security has been
improved when compared to the past and this is evident in figure 5.4 below.
4%9%
86%
0%
10%
20%
30%
40%
50%
60%
70%
80%
90%
Dissatisfied Neutral Satisf ied
Security perception - Past vs. Present
Question 9
Figure 5.4: Perceptions of changes in security
There also appears to be a link between the opinions about the current level of
security offered which is re-enforced by 80% of consumers feeling that the
education offered by banks is sufficient to prevent fraud (figure 5.5). Only 9%
stated that they do not believe that there is adequate education around fraud
prevention and 11% were uncertain about the education specific to fraud
prevention.
9% 11%
80%
0%
10%
20%
30%
40%
50%
60%
70%
80%
Dissatisf ied Neutral Satisf ied
Fraud prevention education
Question 8
Figure 5.5: Fraud prevention education

74
The frequency of positive and negative responses for questions 5, 7, 8 and 9 has
been interrogated further to assess the proportion of importance based on the
absolute numbers to validate findings and the results are presented below.
Figure 5.6: Frequency of significant security drivers
The analysis above reveals that question 8 and question 9 reflect the highest
numbers of positive sentiment. This indicates a consumers desire to have the
fundamentals in place when it relates to security. Conversely question 5 and
question 7 show disparate views of negativity and uncertainty on how consumer
behavior would change in the event of them being defrauded or if their personal
information were to be compromised. The distribution based on the security
theme drivers is further highlighted in figure 5.7 below. In reflection on the
dispersion relationship between a consumer actually being defrauded or theft of
personal information, in relation to perceptions, it would appear that the
satisfaction levels are directly related to reality i.e. customers are comfortable
with adequacy and education about security up until a point where they become
a victim which could have a material affect on usage behavior.
Frequency of key findings
0
20
40
60
80
100
120
140
160
180
Strongly Disagree Disagree Neutral Agree Strongly agree
Q 5 Fraud perpetration Q 7 Compromise of personal information
Q 8 Fraud prevention education Q 9 Security perception - Past vs Present
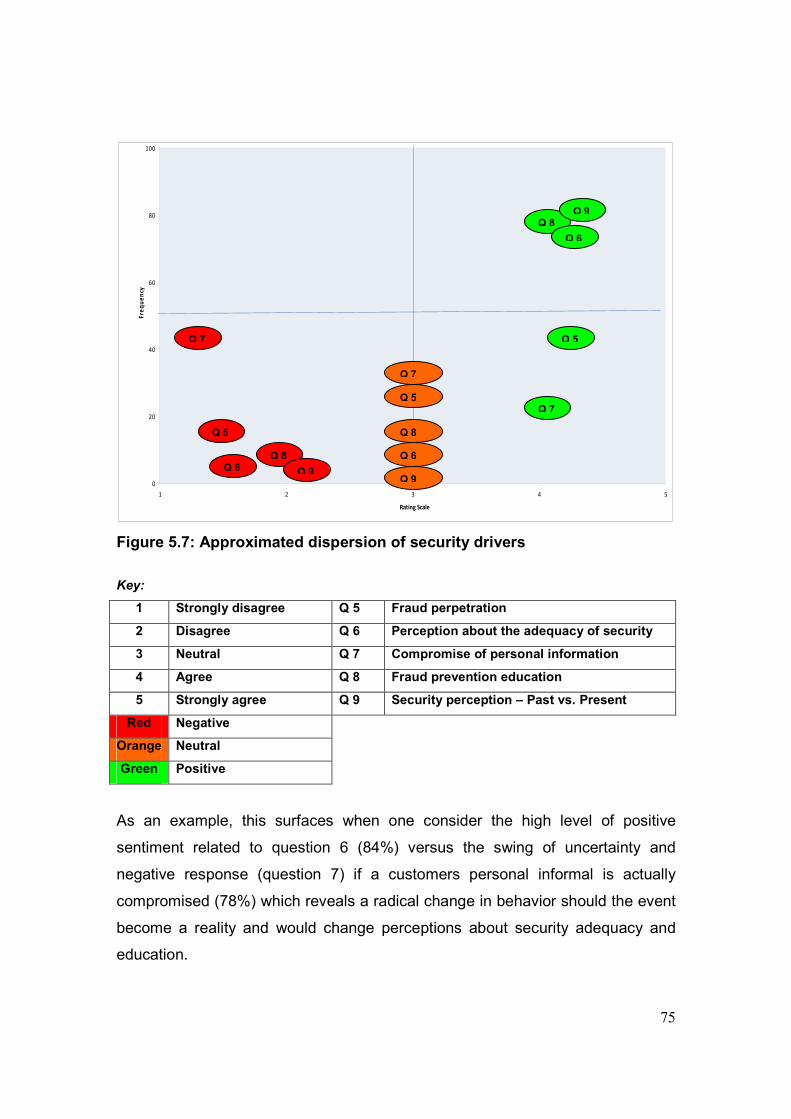
75
0
20
40
60
80
100
1 2 3 4 5
Rating Scale
Fre
qu
en
cy
Figure 5.7: Approximated dispersion of security drivers
Key:
1 Strongly disagree Q 5 Fraud perpetration
2 Disagree Q 6 Perception about the adequacy of security
3 Neutral Q 7 Compromise of personal information
4 Agree Q 8 Fraud prevention education
5 Strongly agree Q 9 Security perception – Past vs. Present
Red Negative
Orange Neutral
Green Positive
As an example, this surfaces when one consider the high level of positive
sentiment related to question 6 (84%) versus the swing of uncertainty and
negative response (question 7) if a customers personal informal is actually
compromised (78%) which reveals a radical change in behavior should the event
become a reality and would change perceptions about security adequacy and
education.
Q 7
Q 5
Q 6 Q 8
Q 8 Q 5
Q 8
Q 5
Q 7
Q 7
Q 6 Q 9 Q 9
Q 6
Q 9

76
5.3.2 Convenience
Two thirds of the customers within the industry appear to be satisfied with the
convenience drivers in general which is reflected in figure 5.8 below. In addition
there was a unanimous perception (figure 5.9) by clients with 96% believing that
their bank charges should be cheaper through using electronic channels.
Overall Convenience Analysis
9%
17%
75%
Dissatisfied
Neutral
Satisf ied
Figure 5.8: Overall convenience analysis

77
2% 2%
96%
0%
10%
20%
30%
40%
50%
60%
70%
80%
90%
100%
Dissatisf ied Neutral Satisf ied
Perception of bank charges
Question 10
Figure 5.9: Value for money
Similarly aligned to this tangible value expected by clients, 91% stated that they
would increase their usage frequency if they were rewarded through an incentive
such as a rewards programme to bank more frequently online, reflected in figure
5.10.
4% 5%
91%
0%
20%
40%
60%
80%
100%
Dissatisfied Neutral Satisf ied
Usage behavior based on reward
Question 11
Figure 5.10: Usage behavior based on reward

78
Conversely to the findings based on fraud prevention education, only 66%
believed that there is sufficient education/ training on how to use electronic
banking channels. Fifteen percent of consumers were uncertain and 20%
believed that this was not the case.
20%15%
66%
0%
10%
20%
30%
40%
50%
60%
70%
Dissatisf ied Neutral Satisf ied
Education on use of electronic channels
Question 12
Figure 5.11: Usage education of digital channels
This presents a potential need to up skill customers regarding how to use
different functionality that has been deployed into the channel. If one were to
consider that a third of customers are still uncomfortable or unsure of the uses of
electronic channels, equipping customers with the necessarily skills/ know how
appears to be an issue that needs to be prudently considered.
In respect of purchasing financial products online (question 13), 62% of clients
felt that this functionality was available with 28% being uncertain and 10%
believing that this option is not available via digital banking channels. On testing
the process experienced to open accounts online (question 14), 50% of
customers felt that this was a simple process but interestingly 40% said they did
not know and 10% were not in support of the convenience of the processes. The
50% gap of neutral customers and those that are not in support of the
convenience of the process re-enforces the earlier statement for the possibility of
education being a key driver of usage of digital banking services on offer.
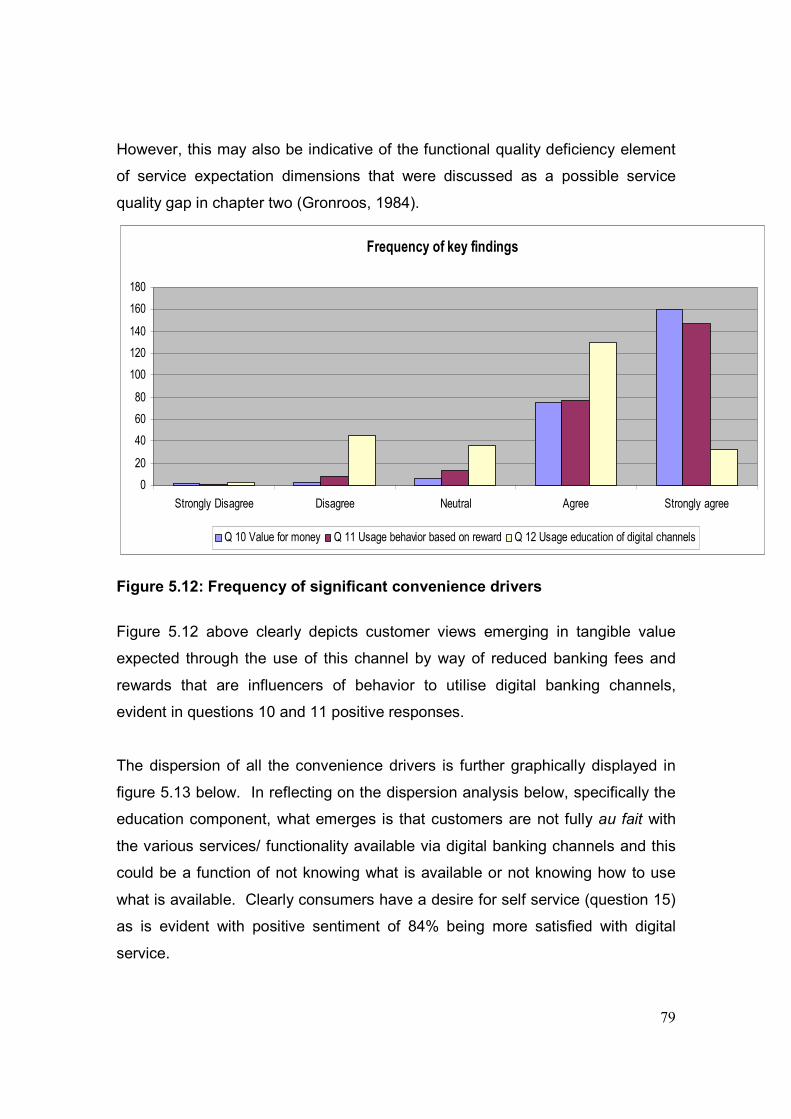
79
However, this may also be indicative of the functional quality deficiency element
of service expectation dimensions that were discussed as a possible service
quality gap in chapter two (Gronroos, 1984).
Figure 5.12: Frequency of significant convenience drivers
Figure 5.12 above clearly depicts customer views emerging in tangible value
expected through the use of this channel by way of reduced banking fees and
rewards that are influencers of behavior to utilise digital banking channels,
evident in questions 10 and 11 positive responses.
The dispersion of all the convenience drivers is further graphically displayed in
figure 5.13 below. In reflecting on the dispersion analysis below, specifically the
education component, what emerges is that customers are not fully au fait with
the various services/ functionality available via digital banking channels and this
could be a function of not knowing what is available or not knowing how to use
what is available. Clearly consumers have a desire for self service (question 15)
as is evident with positive sentiment of 84% being more satisfied with digital
service.
Frequency of key findings
0
20
40
60
80
100
120
140
160
180
Strongly Disagree Disagree Neutral Agree Strongly agree
Q 10 Value for money Q 11 Usage behavior based on reward Q 12 Usage education of digital channels

80
0
20
40
60
80
100
1 2 3 4 5
Rating Scale
Fre
qu
en
cy
Figure 5.13: Approximated dispersion of convenience drivers
Key:
1 Strongly disagree Q 10 Bank charges should be cheaper by using digital channels
2 Disagree Q 11 Reward incentives as a driver to increase usage
3 Neutral Q 12 Usage education on how to use digital banking channels
4 Agree Q 13 Ability to open banking accounts
5 Strongly agree Q 14 The process to open banking accounts via digital channels
Red Negative Q 15 Service between digital channel vs. branch engagement
Orange Neutral
Green Positive
As an example, in linking this to the high number that is aware of purchasing
bank accounts online of 62% (question 13), to the drop off (question 14) with
those that do not find the process user friendly (50%), the gap that emerges
shows a strong relationship in the need for education of services/ functionality to
be a conduit for consumer gratification that prefer the level of service received
through digital banking channels vs. branches (question 15).
Q 11
Q 10
Q 14
Q 11
Q 15
Q 13
Q 10
Q 12
Q 12
Q 11
Q 13
Q 13
Q 15
Q 14
Q 12
Q 15
Q 14
Q 10
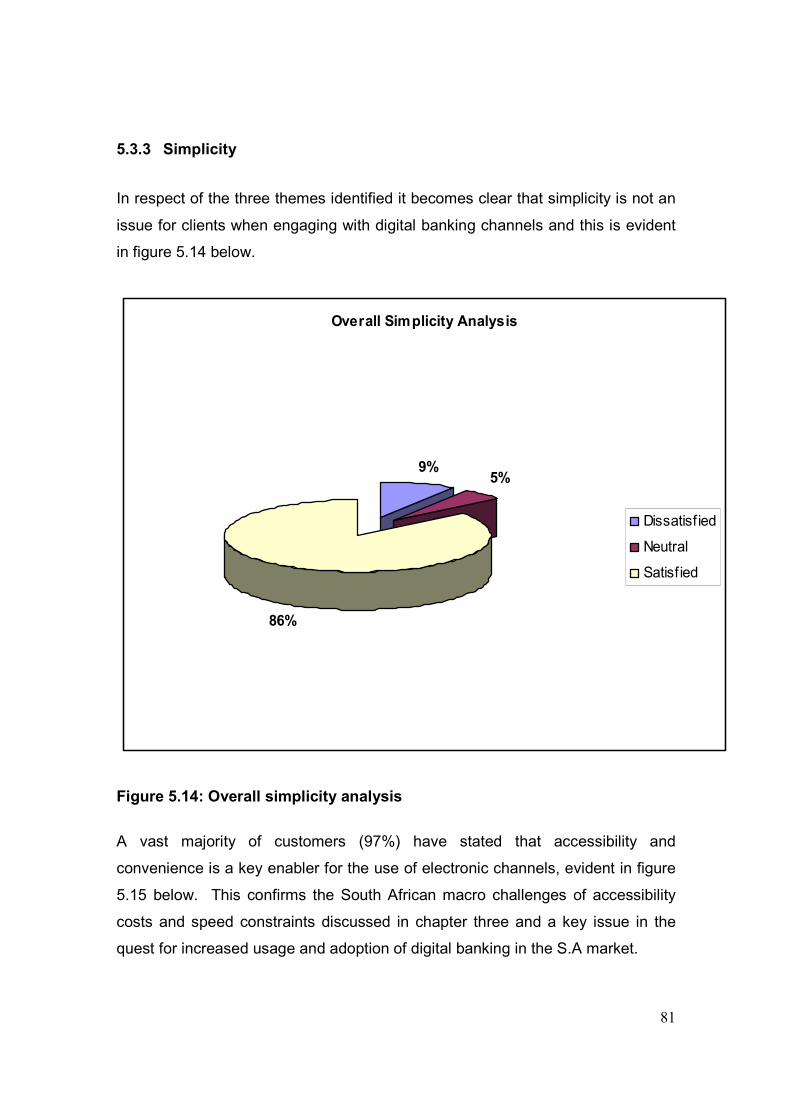
81
5.3.3 Simplicity
In respect of the three themes identified it becomes clear that simplicity is not an
issue for clients when engaging with digital banking channels and this is evident
in figure 5.14 below.
Overall Simplicity Analysis
9%5%
86%
Dissatisf ied
Neutral
Satisf ied
Figure 5.14: Overall simplicity analysis
A vast majority of customers (97%) have stated that accessibility and
convenience is a key enabler for the use of electronic channels, evident in figure
5.15 below. This confirms the South African macro challenges of accessibility
costs and speed constraints discussed in chapter three and a key issue in the
quest for increased usage and adoption of digital banking in the S.A market.
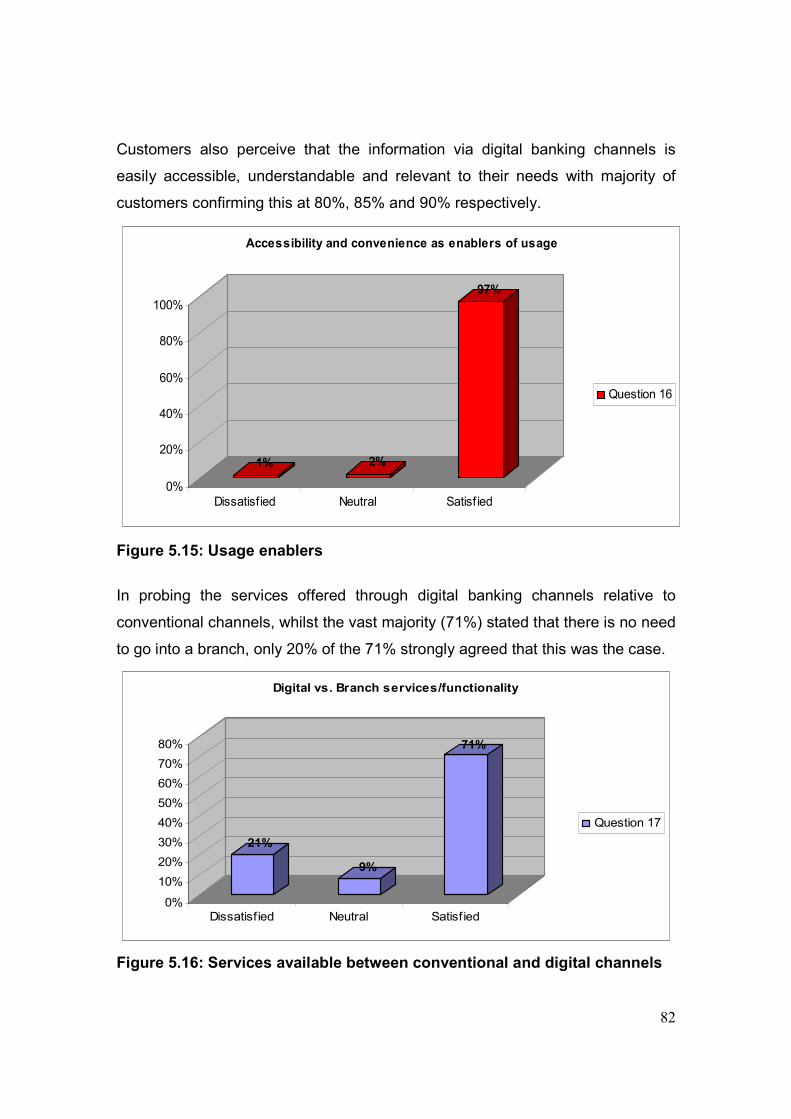
82
Customers also perceive that the information via digital banking channels is
easily accessible, understandable and relevant to their needs with majority of
customers confirming this at 80%, 85% and 90% respectively.
1% 2%
97%
0%
20%
40%
60%
80%
100%
Dissatisfied Neutral Satisf ied
Accessibility and convenience as enablers of usage
Question 16
Figure 5.15: Usage enablers
In probing the services offered through digital banking channels relative to
conventional channels, whilst the vast majority (71%) stated that there is no need
to go into a branch, only 20% of the 71% strongly agreed that this was the case.
21%
9%
71%
0%
10%
20%
30%
40%
50%
60%
70%
80%
Dissatisf ied Neutral Satisf ied
Digital vs. Branch services/functionality
Question 17
Figure 5.16: Services available between conventional and digital channels

83
Twenty one percent of consumers did not subscribe to this notion and 9% were
uncertain on whether all functionality/ services available via traditional banking
channels were also available via digital banking channels as can be seen in
figure 5.16 above.
In essence approximately a third of consumers are not convinced about the
parity of services on offer. Whilst this may be a function of poor communication
of digital banking services available, it is a key gap that is worth noting.
4% 4%
91%
0%
10%
20%
30%
40%
50%
60%
70%
80%
90%
100%
Dissatisf ied Neutral Satisf ied
Satisfaction levels of electronic banking services offered
Question 21
Figure 5.17: Satisfaction levels of electronic banking services offered
Majority of customers at 91% (figure 5.17) did however believe that they are
more satisfied with the level of services they receive from a bank when using
electronic banking channels.
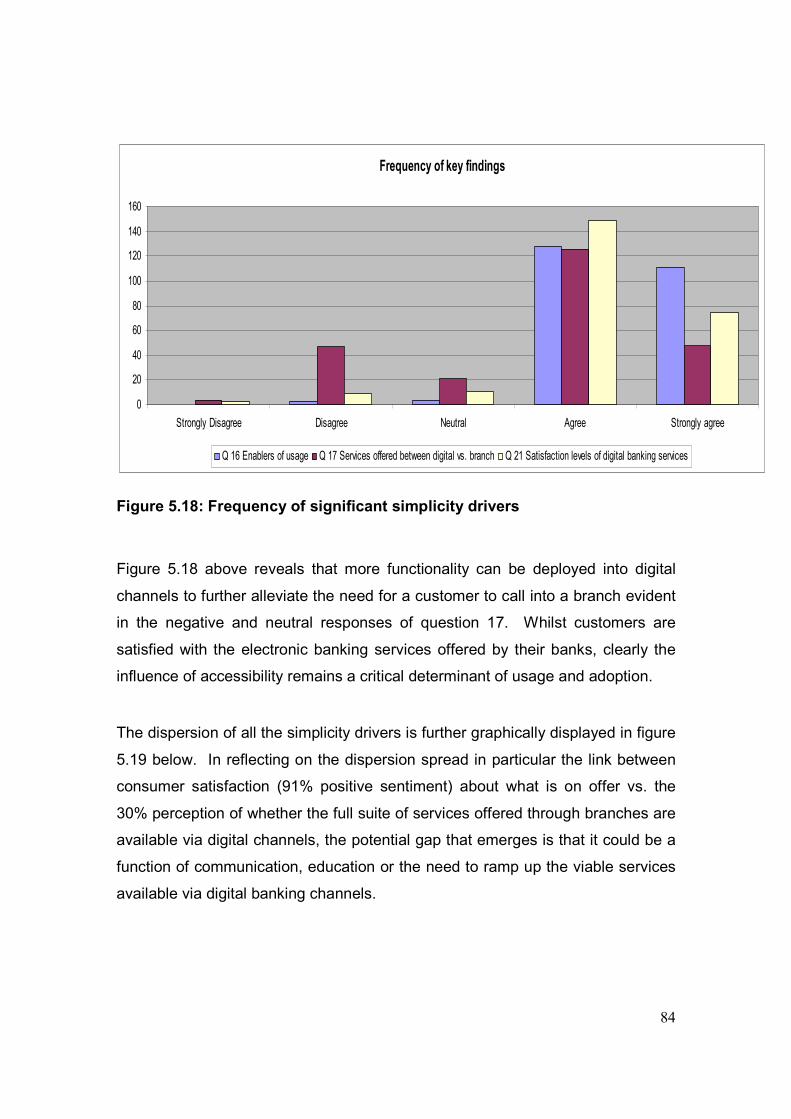
84
Figure 5.18: Frequency of significant simplicity drivers
Figure 5.18 above reveals that more functionality can be deployed into digital
channels to further alleviate the need for a customer to call into a branch evident
in the negative and neutral responses of question 17. Whilst customers are
satisfied with the electronic banking services offered by their banks, clearly the
influence of accessibility remains a critical determinant of usage and adoption.
The dispersion of all the simplicity drivers is further graphically displayed in figure
5.19 below. In reflecting on the dispersion spread in particular the link between
consumer satisfaction (91% positive sentiment) about what is on offer vs. the
30% perception of whether the full suite of services offered through branches are
available via digital channels, the potential gap that emerges is that it could be a
function of communication, education or the need to ramp up the viable services
available via digital banking channels.
Frequency of key findings
0
20
40
60
80
100
120
140
160
Strongly Disagree Disagree Neutral Agree Strongly agree
Q 16 Enablers of usage Q 17 Services offered between digital vs. branch Q 21 Satisfaction levels of digital banking services

85
0
20
40
60
80
100
1 2 3 4 5
Rating Scale
Fre
qu
en
cy
Figure 5.19: Approximated dispersion of simplicity drivers
Key:
1 Strongly disagree Q 16 Accessibility and convenience as enablers of usage
2 Disagree Q 17 Digital banking services/ functionality vs. branches
3 Neutral Q 18 Simplicity in locating the transactional services available
4 Agree Q 19 User friendliness of information available
5 Strongly agree Q 20 Relevance of information available
Red Negative Q 21 Overall satisfaction of services offered via digital banking
Orange Neutral
Green Positive
Accessibility and convenience at 97% surpassed all other drivers probed during
the research which is core gap worth noting. However, whilst this may be a short
term uncontrollable, migrating existing electronic users onto functionality that is
already available may be a more pressing issue for banks to focus on.
Q 17
Q 18
Q 21
Q 17
Q 16
Q 19
Q 16
Q 21
Q 20 Q 20
Q 19
Q 19
Q 17
Q 20
Q 18
Q 16
Q 21
Q 18

86
5.3.4 Prioritisation of drivers
In testing the most important factors of transacting via electronic channels in
order of priority, the response frequency was reviewed in absolute numerical
values as well as unpacking the intensity of priority with the following having
emerged;
Prioritisation of drivers
0
20
40
60
80
100
120
Priority 1 Priority 2 Priority 3
Ease of access
Ease of use
Incentives
Security to prevent fraud
Simplicity in account openening
processes
Speed of transaction processing
Privacy of personal information
Other
Figure 5.20: Prioritisation of drivers
Table 5.2: Driver prioritisation
QUESTION
22
EASE
OF
ACCESS
EASE
OF
USE
INCENTIVES SECURITY
TO
PREVENT
FRAUD
SIMPLICITY
IN
OPENING
BANK
ACCOUNTS
SPEED OF
TRANSACTION
PROCESSING
PRIVACY OF
PERSONAL
INFORMATION
OTHER
Priority 1 20% 7% 4% 46% 3% 9% 9% 1%
Priority 2 12% 18% 10% 20% 7% 15% 18% 1%
Priority 3 11% 20% 17% 11% 7% 17% 15% 2%
Total (n) 105 112 78 188 40 103 103 9

87
Based on the findings it becomes clear that the main priority for customers is
security to prevent fraud reflected at 46%. In analyising the frequency of
responses for this driver, it emerges that an overwhelming 188 respondents
across the prioritisation variables see this as an important factor to start/ continue
transacting via digital banking channels. The critical drivers in order of
importance are graphically reflected in figure 5.21 below.
Prioritisation Mix
46%
28%
26%
Security to prevent fraud
Ease of use
Ease of access
Figure 5.21: Prioritisation mix of drivers
It becomes apparent from the results above that the hygiene factors, namely
security to prevent fraud, ease of use and accessibility are key drivers of digital
banking adoption and usage. In addition, it would appear that the other drivers
may have an influence e.g. speed of transaction processing and protection of
personal information, although these appear to be latent needs for South African
consumers of electronic banking services.
In further reflection on the data gathered, it is plausible to accept that once these
hygiene factors are in place, consumers are more open to innovations such as
incentives and requirements of transaction speed which become evident in the
growth of response frequency from priority 1 to priority 3 that is reflected in figure
5.20 above.

88
In further interrogating the data from an inductive hypothesis perspective, it is
plausible to accept that there is a relationship between all the drivers identified
and customer satisfaction, albeit at different intensity levels and this is reflected
in the summative view of response frequency depicted in figure 5.22 below.
Figure 5.22: Relationship intensity of customer drivers to customer satisfaction In reflecting on the results of the primary data, it becomes clear that security is of
paramount importance, followed by ease of use and ease of access which
addresses the objective of what customers want from digital banking. In
reviewing the intensity of driver influence on customer satisfaction, it emerges
that once the fundamentals are in place, there is no clear cut differences in what
consumers view as important drivers. The results have also revealed that that
consumers are more satisfied with service when engaging with electronic
channels versus traditional branches, however there are gaps in educating
customers on what is available and how to leverage functionality that will result in
cheaper banking costs. It also becomes clear that once the hygiene factors have
been addressed, customers are more open to innovations such as incentivisation
which are beneficial to consumers by increasing value for money and for banks
through addressing innovative mechanisms to increase usage.
Intensity of drivers influencing customer satisfaction
25.47%
15.18%
14.23%13.96%
13.96%
5.42% 1.22%10.57%
Security to prevent fraud
Ease of use
Ease of access
Privacy of personal information
Speed of transaction processing
Incentives
Simplicity in account opening processes
Other

89
5.4 Secondary data analysis
The secondary data for this study, as previously mentioned are segmented into
two key sections, namely, customer service survey as well as behavioral
changes in usage and adoption aligned to specific heuristic and fraud
interventions. The secondary data relevant to these sections have been
obtained from corporate records. The key intent for the secondary data analysis
is premised on unpacking the objective of service perceptions via digital banking
to identify common threads that are evident in the primary data, specific to
particular trends or drivers that has emerged through the secondary data that has
been analyised. The primary motive for the secondary data interrogation was to
identify potential links to the primary data that may aid triangulation validation i.e.
to establish the tolerance levels of customer perceptions of service (third
objective) in relation to defective functionality deployment trends.
It is acknowledged that there were certain limitations to the secondary data for
the service survey such as non-representative sample as well as a generalistic
dipstick of services offered and the value of the channel as perceived by
consumers of FNB. However, given the specific relationship to interventions and
resultant influence on behavior, it plausible to acknowledge that possibly they
would reveal links that re-enforce the primary data collected.
The secondary data analysis aligned to the heuristic and fraud prevention
interventions is intended to validate the prioritisation of the second core theme
i.e. ease of use and whether previous interventions materialised into tangible
benefit for the channel through behavioral changes that result in either positive or
negative movement in transactional volumes, online enrolments, activations or
reduction in fraud trends.
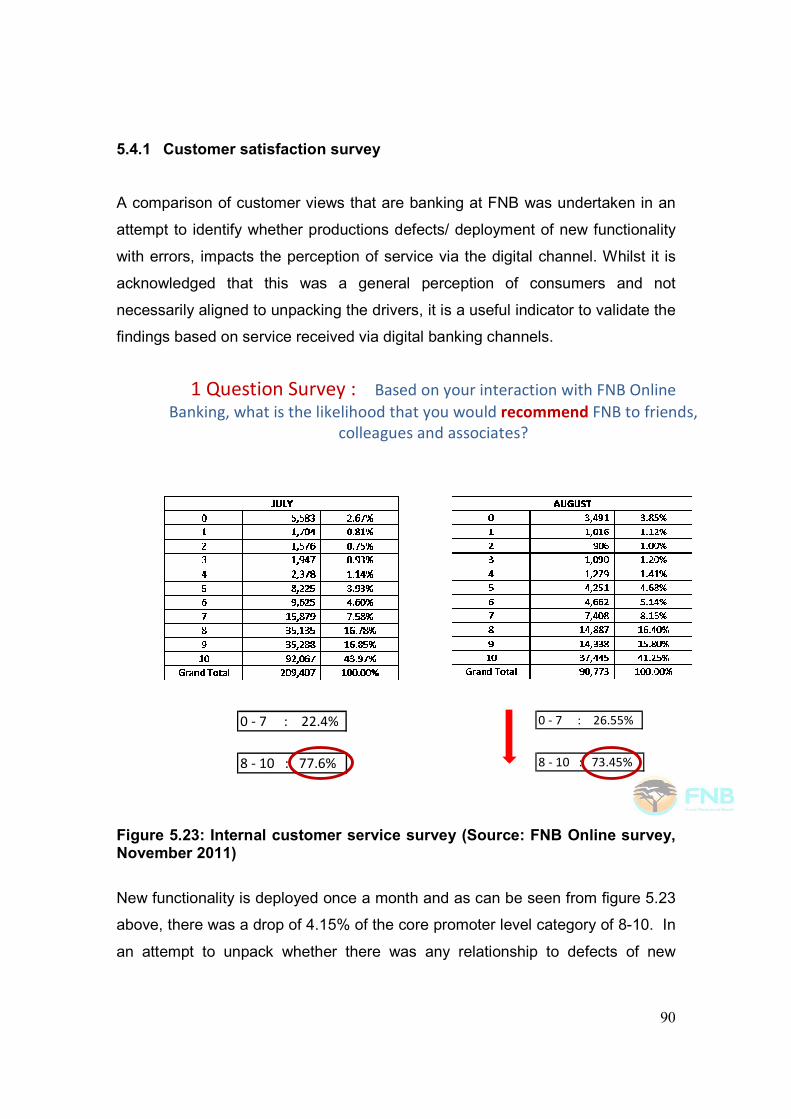
90
5.4.1 Customer satisfaction survey
A comparison of customer views that are banking at FNB was undertaken in an
attempt to identify whether productions defects/ deployment of new functionality
with errors, impacts the perception of service via the digital channel. Whilst it is
acknowledged that this was a general perception of consumers and not
necessarily aligned to unpacking the drivers, it is a useful indicator to validate the
findings based on service received via digital banking channels.
1 Question Survey : Based on your interaction with FNB Online
Banking, what is the likelihood that you would recommend FNB to friends,
colleagues and associates?
0 - 7 : 22.4%
8 - 10 : 77.6%
0 - 7 : 26.55%
8 - 10 : 73.45%
Figure 5.23: Internal customer service survey (Source: FNB Online survey, November 2011)
New functionality is deployed once a month and as can be seen from figure 5.23
above, there was a drop of 4.15% of the core promoter level category of 8-10. In
an attempt to unpack whether there was any relationship to defects of new

91
functionality deployed, an analysis was performed on the production incident
trend and it emerges that there were significant issues related to an increase in
defects as can be seen in figure 5.24 below over the period at which the survey
was undertaken.
Percentage Trend
10% 11%12%
8%
12% 12%11%
13%
10%
1%
0% 0%0%
2%
4%
6%
8%
10%
12%
14%
January
11
Febru
ary 1
1
Marc
h 11
April 1
1
May
11
June
11
July
11
August
11
Septem
ber 11
Oct
ober 11
November 1
1
Decem
ber 11
Defects
Figure 5.24: Defects in new functionality deployed (Source: FNB Online internal secondary data, 2011)
Whilst the drop in perceptions was not significant, it is an indication of the
intolerance of customers when it comes to errors experienced during
engagement with the channel. A further study was also conducted in February
2012 by the Online division with a small sample of thirty customers that were
telephonically contacted who had moved from Nedbank to FNB. This dipstick
also used a confidence scale of 1-10 and the results are reflected in figure 5.25
below. The key limitations of this secondary data were as follows;
� Not fully representative of ex Nedbank clients;
� Memory or recall bias;
� The time frame when customers switched i.e. if it was to short this may not
be an accurate representation of their experiences;
� Resentment and reason for switching may have influenced the responses.

92
Figure 5.25: Internal customer service survey (Source: FNB Online survey, February 2012)
The key findings from the perceptions of the clients reveal that FNB dominates in
all categories with strengths in security, service and support from call centres and
availability of the site. The areas needing improvement of this comparable
sample is clarity of instructions and ease of navigation.
The findings from the assessment of this secondary data support the notion that
customers are seeking convenience as well as a desire to have the hygiene
factors taken care of such as security and a channel that is free from defects. If
this is not the case, it can result in switching behavior of customers to banks
where they believe that they would have their core digital banking needs met.
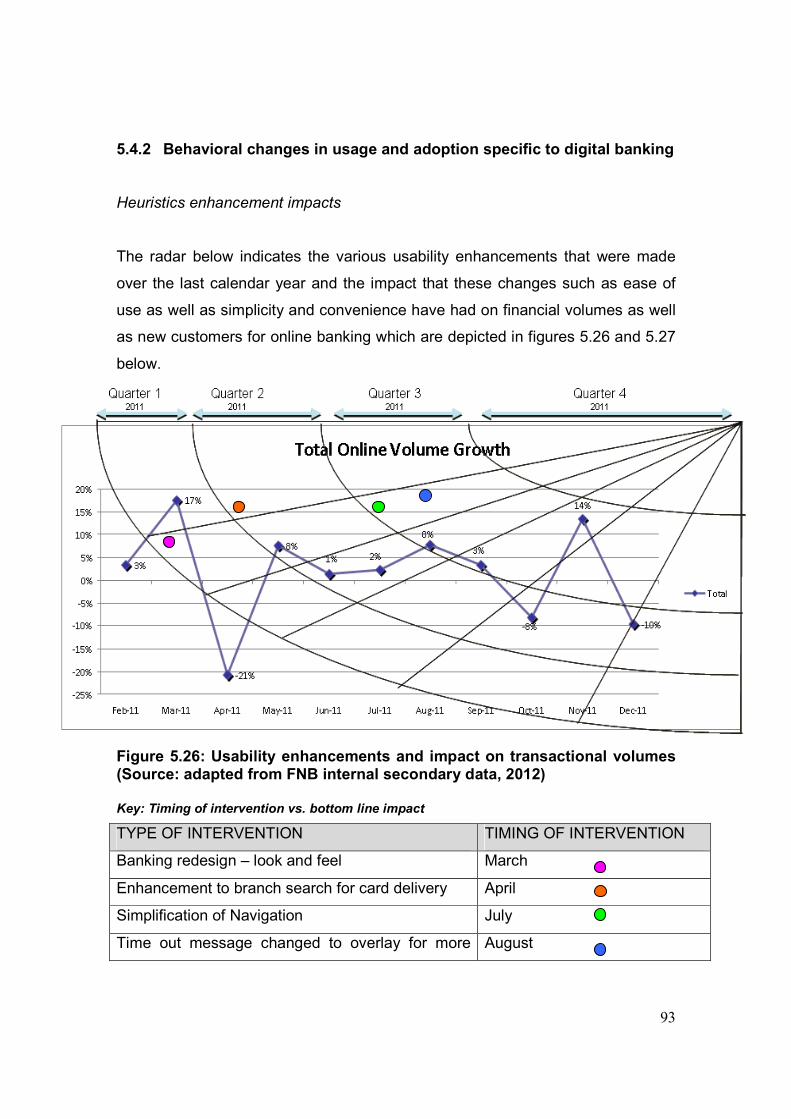
93
5.4.2 Behavioral changes in usage and adoption specific to digital banking
Heuristics enhancement impacts
The radar below indicates the various usability enhancements that were made
over the last calendar year and the impact that these changes such as ease of
use as well as simplicity and convenience have had on financial volumes as well
as new customers for online banking which are depicted in figures 5.26 and 5.27
below.
Figure 5.26: Usability enhancements and impact on transactional volumes (Source: adapted from FNB internal secondary data, 2012) Key: Timing of intervention vs. bottom line impact
TYPE OF INTERVENTION TIMING OF INTERVENTION
Banking redesign – look and feel March
Enhancement to branch search for card delivery April
Simplification of Navigation July
Time out message changed to overlay for more August
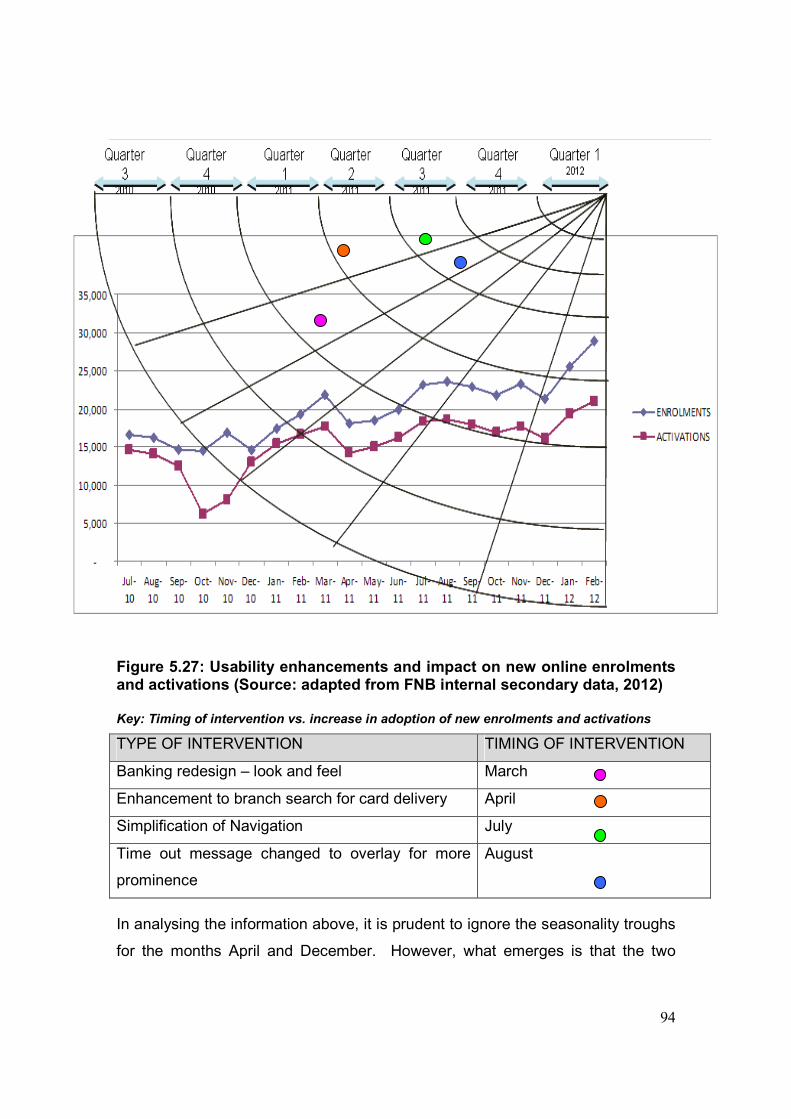
94
prominence
Market share gains from bricks to clicks also reveals opportunities of
improvement reflected in figure x below.
Figure 5.27: Usability enhancements and impact on new online enrolments and activations (Source: adapted from FNB internal secondary data, 2012) Key: Timing of intervention vs. increase in adoption of new enrolments and activations
TYPE OF INTERVENTION TIMING OF INTERVENTION
Banking redesign – look and feel March
Enhancement to branch search for card delivery April
Simplification of Navigation July
Time out message changed to overlay for more
prominence
August
In analysing the information above, it is prudent to ignore the seasonality troughs
for the months April and December. However, what emerges is that the two

95
interventions to enhance ease of use through look and feel as well as navigation
enhancements that were implemented in March and July has had a positive
influence on both transactional volumes and online banking uptake respectively.
This signal’s the direct link between tangible interventions such as usability
changes that can have a positive effect on the bottom line.
Fraud intervention impacts
Figure 5.28 below depicts a key change to a fraud preventative measure, namely
behavioral tracking that was discussed in chapter two and the resultant impact on
fraud losses.
Figure 5.28: FNB Fraud volume impact 2010-2011 (Source: adapted from FNB internal secondary data, 2012)
FNB Customer Data Compromised
0
50
100
150
200
250
300
Jul-10 Aug-10 Sep-10 Oct-10 Nov-10 Dec-10 Jan-11 Feb-11 Mar-
11
Apr-11 May-
11
Jun-11 Jul-11 Aug-11 Sep-11 Oct-11 Nov-11 Dec-11
Fraud count
Simswaps
Quarter
32010
Quarter
22011
Quarter
12011
Quarter
32011
Quarter
42011
Quarter
42010
FNB Customer Data Compromised
0
50
100
150
200
250
300
Jul-10 Aug-10 Sep-10 Oct-10 Nov-10 Dec-10 Jan-11 Feb-11 Mar-
11
Apr-11 May-
11
Jun-11 Jul-11 Aug-11 Sep-11 Oct-11 Nov-11 Dec-11
Fraud count
Simswaps
Quarter
32010
Quarter
22011
Quarter
12011
Quarter
32011
Quarter
42011
Quarter
42010
Quarter
32010
Quarter
22011
Quarter
12011
Quarter
32011
Quarter
42011
Quarter
42010
96
The behavioral tracking fraud preventative intervention was introduced mid
January 2011. In essence, behavioral tracking identifies a number of variables
which are unique to a user e.g. IP address and if there is a high failure rate of
matching variables, transactions are not allowed to proceed. It becomes evident
that in the initial three months of implementation, there was a reduction in the
number of frauds perpetrated in comparison to historical trends. However, it can
be argued that this is still a level one (Amtul, 2011: 3-6) fraud prevention
intervention that only contributes as an enhancement to authentication. The
trends thereafter depict growth in the number of frauds which may be indicative
of fraudsters still being able to obtain sensitive customer data to fraudulently
transact on a consumers account.
In reflection of the secondary data analyised, it emerges that whilst the primary
data reflected that customers are more satisfied in dealing with digital banking
channels in stead of branches, negative customer experiences can have an
immediate direct influence on service perceptions (figure 5.23) through the
channel with a resultant knock on effect on bottom line tangibles.
It also became apparent through the secondary data analysis that ease of use
can in fact positively have an influence on adoption and usage as was evident in
figure 5.26 and 5.27. This validates the primary data obtained in support of
objective one whereby ease of use has a direct bearing on channel behavior.
In considering the existing security interventions that are in place for FNB and the
primary need of consumers for security to prevent fraud (objective one), it
becomes clear that current security reveals opportunities for enhancement as
was evident in the discussion related to figure 5.28.

97
5.5 Summary
The primary data gathered indicates that banks need to make sure that the
basics are in place to ensure that objectives are met. Whilst the individual banks
were not interrogated for nuances related to specific organisations, it becomes
evident that the local industry trends are consistent with international findings
discussed in chapter three. From the analysis of the data collected, the following
observations can be made:
Security
• There is a consistent perception that security is the most important factor
for consumers.
• Majority of customers would be intolerant of engaging with digital banking
channels if their personal information were compromised.
• Security to prevent fraud, ease of use and ease of access are the three
prioritised primary drivers to enable increase in usage and adoption of
digital banking channels.
Convenience
• Customers expect value for money when engaging through this channel.
• Educating customer on how to use electronic banking presents an
opportunity for enhanced engagement.
• Customers are generally more satisfied with engaging with electronic
banking channels as apposed to conventional channels.
Simplicity
• Accessibility is core to digital banking usage for consumers.
General
• The secondary drivers are of significant importance only if the prioritised
drivers’ are met.

98
Considering the above observations, it is plausible to deduce the following issues
relevant to the objectives;
� To determine what customers primarily want from digital banking
channels, in terms of the core themes of security, convenience and
simplicity.
� Customers want security for the protection against fraud of their
finances, followed by an easy to use platform that is accessible which
can result in an increase in adoption and usage.
� To establish the drivers which are most important to customers.
� Once the above fundamentals are in place, consumers are more open
to innovations such incentives that will increase usage. In addition,
educating consumers on what is available and how to use the services
and functionality on offer will also lead to increased levels of
satisfaction.
� To investigate the perceptions of service via digital banking channels.
� Clients are more satisfied with the service they receive when engaging
with digital channels and this is driven by the need for self service and
instant gratification. However, clients are intolerant of service failure
via this channel through issues such as defective functionality and
these inefficiencies can negatively influence the opinions about service
levels via this platform with a resultant impact on the bottom line.
In the following chapter the results will be reviewed in the context of the research
objectives and key literature review with the intent to propose certain
recommendations. This may assist banks within the local banking industry to
increase their adoption and usage rates of digital banking channels with South
African consumers and address the strategic challenges that are of mutual
benefit.
99
CHAPTER 6
6. Recommendations and conclusion
6.1 Introduction
The previous chapter revealed the findings from the research undertaken and
was analyised and interpreted in the context of the three objectives set out for
this paper. The pertinent results of each category of the questionnaire were
presented through the use of various graphical representations and incorporated
an assessment of the significant findings.
The purpose of this chapter is to reflect on the accuracy of the research
statement i.e. “Customer satisfaction can be achieved by implementing the key
drivers which will lead to an increase in adoption and usage of digital banking
channels in South Africa”. The intent is also to review the key findings in
comparison to international research that was reviewed and suggest
recommendations based on the study that was undertaken.
6.2 Comparison of findings to the literature reviewed
What has emerged from the local study in comparison to international literature
available on the topic was close alignment to the commonality of needs of
consumers across the globe. In reflecting on the work done by Casalo, et al.,
(2008: 404), it becomes evident that website usability is a core driver of customer
satisfaction as was evident with the local study with ease of use featuring in the
top three priorities of critical drivers for usage. The shift of local consumer
behavior aligned through the move from conventional channels to a desire for
self gratification through digital channels also reveals close alignment to the work

100
presented by Ganguli and Roy (2010). The number one priority of local
consumers also mirrors international consumer needs for security, in particular
the safeguarding of personal information as was suggested by Nath, et al.,
(2001).
The key nuance that has emerged in interpreting the local results pertains to the
issue of accessibility, which in comparison to more established first world
countries remains a critical challenge that needs to be overcome and is
somewhat a macro-uncontrollable given the challenges faced within the South
African market context and echoed by the likes of Brown, et al., (2009). The
leading indicator of low internet penetration fueled by high costs associated with
access is contributing to the lagging effect of modest usage and adoption of
digital banking in S.A.
6.3 Research statement reflection
In critical refection of the results relative to the research statement, it is plausible
to acknowledge that customer satisfaction can indeed be achieved by
implementing the key drivers. The gap exists on whether there would be a
radical improvement in adoption and usage of digital banking given the macro
dependencies aligned to accessibility remains questionable.
In addition, it was also clear from the research results that customer satisfaction
is firstly achieved through ensuring that the fundamentals such as security must
be in place. Thereafter, customer satisfaction can be achieved through various
other secondary drivers such as incentivisation which can also influence an
increase in adoption and usage.
The macro dependency of accessibility warrants further research in the context
of the South African market which may present opportunities for leveraging the
101
penetration of digital banking into the broader society of S.A banking consumers.
The key addition to the body of knowledge that has emerged from this study
pertains to the holistic nature of needs aligned to customer satisfaction in the
digital banking context. This in essence reveals that there are no “magic pills” to
radically improve usage and adoption within the South African market, but rather
a combination of fundamentals that need to be in place which can be
complimented with innovative strategies such as incentivisation.
In reflecting on the research statement i.e. “Customer satisfaction can be
achieved by implementing the key drivers which will lead to an increase in
adoption and usage of digital banking channels in South Africa”, it becomes clear
from the analysis and interpretation of the results that the statement is only
partially true.
6.4 Problems encountered in the study
The main problem encountered in the study was linking the secondary data to
interventions, to aid validity through triangulation. This was mainly due to the fact
that there could have been other factors that was positively influencing bottom
line indicators such as aggressive above the line marketing that may have
resulted in brand affinity or co-incidental factors such as the maturing of users
that have banked with FNB for a number of years and have become more au fait
with the services when engaging with the platform.

102
6.5 Recommendations
Recommendation 1
Further research is required to determine whether the rollout of self-service
branches or leverage through third-party retailers would improve accessibility
through broadening the distribution network and making digital banking more
accessible for the South African market.
Recommendation 2
A fine balance needs to be struck with the implementation of prudent security
solutions such as encryption and biometrics to address the fundamental priorities
of South African consumers. This may incorporate the need for the organisation
to absorb upfront costs such PKI tokens with the benefits emerging in the long
run for the company.
Recommendation 3
Implementation of a rewards programme that encourages increased usage via
digital banking channels for specific services that would improve the tangible
value for customers.
Recommendation 4
Implementation of customer intuitive education modules e.g. videos and
interactive games to accelerate user knowledge and competence of services
offered.
103
6.6 Conclusion
Based on the analysis undertaken in chapter five as well as the findings from
international literature reviewed, it becomes apparent that there are opportunities
for improvement within the local banking sector. To ensure that the strategic
goals of the organisation to migrate consumers to cost effective distribution
channels such digital banking are met, local banks must first and foremost
embrace a customer centric approach to solving for the strategic challenges as
perceived by consumers of services.
Undoubtedly consumers are seeking more innovative solutions from their
bankers given the growing nature of consumerism and it becomes a case of
survive and thrive or become extinct in an industry that is highly competitive
given the borderless boundaries of the financial services sector on the digital
banking global stage.
104
LIST OF REFERENCES
Akinci, S., Akoy, S. & Atilgan, E. 2004. ‘Adoption of internet banking
among sophisticated consumer segments in an advanced developing
country’, International Journal of Bank Marketing, 22 (3): 212-232.
Aldas-Manzano, J., Lassala-Navarre, C., Ruiz-Mafe, C. & Sanz-Blas, S. 2009.
‘The role of consumer innovativeness and perceived risk in online banking
usage’. The International Journal of Bank Marketing, [online], 27 (1).
Available at: http://www.emeraldinsight.com/0265-2323.htm [Accessed 05
November, 2011]
Amato-McCoy, D. 2005. ‘Creating virtual value’, Journal of Bank Systems
and Technology,1 (22).
Amtul, F. 2010. ‘E-Banking security issues – Is there a solution in biometrics?’
, Journal of internet banking and commerce, 16 (2): 3-6.
Anderson, E.W., Fornell, C. & Mazvancheryl, S.K. 2004. ‘Customer
satisfaction and shareholder value’, Journal of Marketing, 68 (4): 172-185.
April, K.A. and Cradock, J. 2000. E-business: Redefining the corporate
landscape in South Africa. Durban, South Africa: Butterworth Publishers
(Pty) Ltd.
Auta, E.M. 2010. ‘E-Banking in developing economy: Empirical evidence
from Nigeria’, Journal of Applied Quantitative Methods, 5 (2): 215.
Bakhru, A. 2010. Analysing the External Environment: study guide for
MBA B820. Milton Keynes: Open University.

105
Barwise, P. and Farley, J.U. 2005. ‘The state of interactive marketing in
seven countries-interactive marketing comes of age’, Journal of Interactive
Marketing, 19 (3): 67-80.
Basel Committee – Electronic Banking Group. 2000. Electronic Banking
Group and White Paper Iniatives. Washington D.C
Brown, I., Letsididi, B. & Nazeer, M. 2009. ‘Internet access in South African
Homes-A pre-liminary study on factors influencing customer choice’,
Electronic journal on information systems in developing countries, 38 (2):
1-13.
Brown, I., Cajee, Z., Davies, D. & Stroebel, S. 2003. ‘Cell phone banking-
Predictors of adoption in South Africa – an exploratory study’, International
journal on information management, 23: 391-394.
Cant, M.C., Brink, A. & Brijball, S. 2002. Customer Behaviour,
A Southern African Perspective. Cape Town: Juta and Co Ltd.
Cant, M., Gerber-Nel, C., Nel, D. & Kotze, T. 2003. Marketing Research. 2nd ed.
Pretoria: Van Schaik Publishers.
Casalo, L.V., Flavian, C. & Guinaliu, M. 2008. ‘The role of satisfaction
and website usability in developing customer loyalty and positive
word-of-mouth in the e-banking services’. The International Journal of
Bank Marketing, [online], 26 (6). Available at:
http://www.emeraldinsight.com/0265-2323.htm [Accessed 05 November,
2011]
Charlesworth, J., Lawton, A., Lewis, J., Martin, V. & Taylor, P. 2003. Toolkit 1
and Toolkit 2: study guide for MBA B736. Milton-Keynes: Open University.

106
Christopher, G.C., Mike, L. & Amy, W. 2006. ‘A Logit Analysis of
Electronic Banking in New Zealand’, International Journal of Bank Market,
24: 360-383.
Chuang, C.C. and Hu, F. 2011. ‘An Empirical Study of Customers’ Perceptions
of E-Banking Services Based on Time Usage’. Journal of Internet Banking
and Commerce, [online], 16 (2). Available at:
http://www.arraydev.com/commerce/jibc/ [Accessed 05 November, 2011]
Coldwell, D. and Herbst, F. 2004. Business Research. Cape Town: Juta and Co
Ltd.
Collier, J.E. and Bienstock, C.C. 2006. ‘Measuring service quality in
e-retailing’, Journal of Service Research, 8 (3): 260-274.
Ernst & Young. 2011. The Financial Services Index, Banking. South Africa: Ernst
& Young Survey
Flavian, C., Guinaliu, M. & Gurrea, R. 2006. ‘The role played by
perceived usability, satisfaction and consumer trust on website loyalty’,
The International Journal of Information Systems Applications, 43 (1): 1-
14.
Gan, C., Clemes, M., Limsombunchai, V. & Weng, A. 2006. ‘A logit analysis
of electronic banking in New Zealand’, International Journal of Bank
Marketing, 24 (6): 360-383.
Ganguli, S. and Roy, S.K. 2010. ‘Generic technology-based service
quality dimensions in banking’. The International Journal of Bank
Marketing, [online], 29 (2). Available at:
http://www.emeraldinsight.com/0265-2323.htm [Accessed 07 January,
2012]
107
Gerrard, P., Cunningham, J.B. & Devlin, J.F. 2003. ‘The diffusion of
internet banking among Singapore consumers’, International Journal of
Bank Marketing, 21 (1): 16-28.
Grant, R.M. 2010. Contemporary Strategy Analysis, 7th Edition.
West Sussex: John Wiley & Sons Ltd
Hallowell, R. 1996. ‘The relationship of customer satisfaction, customer
loyalty and profitability: an empirical study’, International Journal of
Service Industry Management, 7 (4): 27-42.
Horn, N. 2002. Legal issues in electronic banking. Studies in
transactional economic law, volume 17. Kluwer Law International:
The Hague, Netherlands. Ince, D. 2001. Encyclopedia.com: Dictionary of
the Internet. Electronic mall – definition of electronic mall. [online].
Available: http://www.encyclopedia.com/doc/1012-electronicmall. html
[Accessed 09 April, 2011]
Howcroft, B. and Durkin, M. 2000. ‘Reflections on bank-customer interactions
in the new millennium’, Journal of Financial Services Marketing, 5 (1): 9-
20.
Ifinedo, P. 2006. ‘Acceptance and Continuance intention of web-based
Learning technologies (WLT) Use among university students in a baltic
country’, Journal of Information Systems in Developing Countries, 23 (6):
1-20.
Ismail, H. B., and Panni, M. F. A. K. 2009. ‘Factors affecting customer
retention toward internet banking in Malaysia’ Journal of Information and
Knowledge Management, 8 (1): 35-43.

108
IT News Africa 2009. Cyber attacks may increase leading up to the 2010
Soccer World Cup 2010, [online]. Available at:
http://www.itnewsafrica.com/?p=2635.com
[Accessed 24 January, 2012]
Jun, M. and Cai, E. 2001. ‘The key determinants of Internet banking
services quality: A content analysis’, International Journal of Bank
Marketing, 19 (7): 276-291.
Kassim, N.M. and Abdhulla, A.K.M.A. 2006. ‘The influence of attraction
on internet banking-an extension to the trust-relationship commitment
model’. The International Journal of Bank Marketing, [online], 24 (6).
Available at: http://www.emeraldinsight.com/0265-2323.htm [Accessed 07
January, 2012]
Kerem, K., Lustsik, O., Sorg, M. & Vensel, V. 2003. The development of
e-banking in an EU candidate country: An Estonian case. Proceedings of
International Atlantic Economic Society Conference, Vienna, March 11-17.
King, B. 2010 Bank 2.0-How Customer Behaviour and Technology will
change the future of financial services. London: Marshall Cavendish.
Klopping, I.M. and McKinney, E. 2004. ‘Extending the technology
acceptance model and the task technology fit model to consumer e-
commerce’, Information Technology, Learning and Performance Journal,
22 (1): 35-48.

109
Laukkanen, P., Sinkkonen, S. & Laukkanen, T. 2008. ‘Consumer resistance
to internet banking-postponers, opponents and rejectors’. The
International Journal of Bank Marketing, [online], 26 (6). Available at:
http://www.emeraldinsight.com/0265-2323.htm [Accessed 07 January,
2012]
Lee, E., Lee, J. & Eastwood, D. 2003. ‘A two-step estimation of
consumer adoption of technology-based service innovations’, The Journal
of Consumer Affairs, 37 (2): 256-282.
Lee, M.K.O. and Turban, E. 2001. ‘A trust model for consumer
internet shopping’, International Journal of Electronic Commerce, 6 (1):
75-91.
Leedy, P.D. and Ormrod, J.E. 2005. Practical Research: Planning and
Design. 7th edition. New Jersey: Prentice Hall.
Lewis, J. 2003. Becoming a Practitioner Researcher: study guide for MBA B736.
Milton-Keynes: Open University.
Lindridge, A., Woods, J., Ali, H. & Dibb, S. 2008. Service Marketing: study guide
for MBA B825. Milton Keynes: Open University.
Littler, D. and Melanthiou, D. 2006. ‘Consumer perceptions of risk
and uncertainty and the implications for behaviour towards innovative
retail services-the case of internet banking’ Journal of Retailing and
Consumer Services, 13 (6): 431-443.
Madu, C.N. and Madu, A.A. 2002. ‘Dimension of e-quality’, International
Journal of Quality and Reliability Management, 19 (3): 246-258.

110
Mensah, A.O., Bahta, A. & Mhlanga, S. 2005. ‘E-commerce challenges in Africa-
Issues, constraints, opportunities’. World summit on the information
society, Turnis, 2005. Economic commission for Africa
Meuter, M., Ostrom, A.L., Bitner, M.J. & Roundtree, R. 2003. ‘The influence
of technology anxiety on consumer use and experiences with self-service
technologies’ Journal of Business Research, 56 (11): 899-906.
Mukherjee, A. and Nath, P. 2003. ‘A model of trust in online
relationship banking’, International Journal of Bank Marketing, 21 (1):
5-15.
Natarajan, T., Balasubramanian, S.A. & Manickavasagam, S. 2010.
‘Customer’s choice amongst self service technology (SST) channels in
retail banking-A study using analytical hierarchy process(AHP)’. Journal of
Internet Banking and Commerce, [online], 16 (2). Available at:
http://www.arraydev.com/commerce/jibc/ [Accessed 07 January, 2012]
Nath, R., Schrick, P. & Parzinger, M. 2001. Bankers' Perspectives on
Internet Banking. E-Service Journal, [online], 1.1, 21-36.
Available: http://muse.jhu.edu/journals/eservice_journal/v001/1.1nath.html
[Accessed 02 April, 2011]
Neethling, R. 2008. Internet banking – South Africa - Online banking &
electronic banking on the internet, [online]. Available:
http://www.intoweb.co.za/articles-internet-banking.html
[Accessed 06 April, 2011]
Parasuraman, A. 2000. ‘Technology readiness index (TRI)-a multiple item
scale to measure readiness to embrace new technologies’, Journal of
service research, 2 (4): 307-320.

111
Parasuraman, A., Zeithaml, V.A. & Berry, L. 1988. ‘SERVQUAL:
A multiple-item scale for measuring consumer perceptions of service
quality’, Journal of Retailing, 64 (1): 12-40.
Patricio, L., Fisk, R.P. & Cunha, J.F. 2003. ‘Improving satisfaction with
bank service offerings-measuring the contribution of each delivery
channel’, International Journal of Bank Marketing, 13 (6): 471-482.
Pearce, J.A. and Robinson, R.B. 2003. Strategic Management-
Formulation, Implementation and Control. Durban, New York: McGraw-Hill
Companies, Inc.
Poon, W.C. (2008). ‘Users adoption of e-banking services-the
Malaysian perspective’, Journal of Business and Industrial Marketing, 23
(1): 59-69.
PwC. 2011. Strategic and emerging issues in South African banking. South
Africa: PwC
PwC. 2012. The new digital tipping point. South Africa: PwC
Pyun, C.S., Scruggs, L. & Nam, N. 2002. Internet Banking in the US, Japan
and Europe, Multinational Business Review.
Ram, S. and Sheth, J.N. 1989. ‘Consumer resistance to innovation-
the marketing problem and its solutions’, The Journal of Consumer
Marketing, 6 (2): 20-34.
Rotchanakitumnuai, S. and Speech, M. 2003. ‘Barriers to internet
banking adoption-a qualitative study among corporate customers in
Thailand’, International Journal of Bank Marketing, 21 (6): 312-323.

112
Salehi, M. and Zhila, A. 2008. ‘Fraud detection and audit expectation gap
Empirical evidence from Iranian Bankers’, International Journal of
Business and Management, 3 (10): 65-77.
Sarel, D. and Marmorstein, H. 2003. ‘Marketing online banking services-
the voice of the customer’, Journal of Financial Services Marketing, 8 (2):
106-118.
Sathye, M. 1999. ‘Adoption of internet banking by Australian consumers:
An empirical investigation’ International Journal of Bank Marketing, 17 (7),
324-334.
Saunders, M., Lewis, P. & Thornhill, A. 2003. Research Methods for
Business Students. 3rd ed. Essex: FT Prentice Hall
Segal-Horn, S. 2004 The Strategy Reader. Blackwell Publishing.
Singh, N.P. 2007. ‘Online Frauds in Banks with Phishing’. Journal of
Internet Banking and Commerce, [online], 12 (2). Available at:
http://www.arraydev.com/commerce/jibc/ [Accessed 05 November, 2011]
South Africa. Department of Communications. 2009. Draft broadband policy for
South Africa. Government Gazette, vol 531, No. 32578. Pretoria:
Department of Communications.
Tan, M. and Teo, T.S.H. 2000. ‘Factors influencing the adoption of
internet banking’, Journal of the Association for Information Systems, 1
(5): 1-44.
The Institute of Bankers in South Africa. 2007. Trends in global banking and the
role of centres of excellence presented by Minisi, P.

113
Walker, R.H. and Johnson, L.W. 2006. ‘Why consumers use and do not
use technology-enabled services’, Journal of Service Marketing, 20 (2):
125-135.
Wang, Y.S., Wang, Y.M., Lin, H.H. & Tang, T.I. 2003. ‘Determinants of
user acceptance of internet banking-an empirical research’, International
Journal of Bank Marketing, 14 (5): 501-519.
Wong, D., Rexha, N. & Phau, I. 2008. ‘Re-examining traditional service
quality in an e-banking era’, International Journal of Bank Marketing, 26
(7): 526-545.
World Wide Worx 2009. Internet access to double in next five years, [online].
Available at: http://www.worldwideworx.com/archives/150.htm
[Accessed 24 January, 2012]
Yang, Z., Peterson, R.T. & Cai, S. 2003. ‘Service quality dimensions of
Internet retailing: An exploratory analysis’, Journal of Service Marketing,
17 (7): 685-700.
Yap, K.B., Wong, D.H., Loh, C. & Bak, R. 2009. ‘Offline and online
banking-where to draw the line when building trust in e-banking?’. The
International Journal of Bank Marketing, [online], 28 (1). Available at:
http://www.emeraldinsight.com/0265-2323.htm [Accessed 07 January,
2012]
Yoon, S.J. 2002. ‘The antecedents and consequences of trust in
online-purchase decisions’, Journal of Interactive Marketing, 16 (2): 47-63.
Zikmund, W.G. 2006. Business research methods. 7th Edition. Thompson: USA.
114
Annexure A: Web based research questionnaire
Dear respondent
Thank you for your willingness to complete the questionnaire. The purpose of the
survey is to obtain your input as part of a UNISA MBA dissertation to improve the
services offered by banks through their electronic banking channels,
specifically Internet and Cell phone banking to ensure alignment to customer
needs. The survey should not take more than 10 minutes to complete. The
survey is anonymous and confidential. The answers you provide will be
respected and used for research purposes only.
Please answer all the questions/ state your level of agreement by selecting
the appropriate option. There are no right or wrong answers.
(Please tick one option only.)
Section A
Q1. What is your age?
20-25
26-35
36-45
46-55
55+
Q2. What is your gender?
Female
Male

115
Q3. Who do you bank with?
ABSA
Capitec
First National Bank
Nedbank
Standard Bank
Other
Q4. Do you currently bank electronically (making use of Internet and/ or Cell phone banking)?
Yes
No
Section B
Security
Q5. If I was a victim of bank fraud i.e. loss of funds without consent, I would continue to make use of electronic channels.
Strongly Disagree
Disagree Don’t Know Agree Strongly
Agree
1 2 3 4 5
Q6. There is good security offered through electronic banking channels.
Strongly Disagree
Disagree Don’t Know Agree Strongly
Agree
1 2 3 4 5
Q7. If my personal information was “stolen” through electronic banking channels I
would continue to make use of electronic banking channels.
Strongly Disagree
Disagree Don’t Know Agree Strongly
Agree
1 2 3 4 5
116
Q8. My bank provides sufficient education about fraud prevention through electronic banking channels.
Strongly Disagree
Disagree Don’t Know Agree Strongly
Agree
1 2 3 4 5
Q9. I believe that bank security through electronic banking channels is better now
than it was in the past.
Strongly Disagree
Disagree Don’t Know Agree Strongly
Agree
1 2 3 4 5
Section C
Convenience
Q10. I believe that through using electronic banking channels, my bank charges
should be cheaper.
Strongly Disagree
Disagree Don’t Know Agree Strongly
Agree
1 2 3 4 5
Q11. If I were rewarded with an incentive e.g. rewards programme to bank through
electronic channels more frequently, this would increase my usage.
Strongly Disagree
Disagree Don’t Know Agree Strongly
Agree
1 2 3 4 5
Q12. My bank provides sufficient education/ training on how to use electronic banking
channels.
Strongly Disagree
Disagree Don’t Know Agree Strongly
Agree
1 2 3 4 5
117
Q13. My bank offers the ability to open banking accounts through electronic banking channels.
Strongly Disagree
Disagree Don’t Know Agree Strongly
Agree
1 2 3 4 5
Q14. The process to open bank accounts through electronic banking channels is simple.
Strongly Disagree
Disagree Don’t Know Agree Strongly
Agree
1 2 3 4 5
Q15. I am more satisfied with the level of service I receive from the bank when
using electronic banking channels compared to visiting a branch.
Strongly Disagree
Disagree Don’t Know Agree Strongly
Agree
1 2 3 4 5
Section C
Simplicity
Q16. Accessibility and convenience are key factors for me to continue/ start
using electronic banking channels.
Strongly Disagree
Disagree Don’t Know Agree Strongly
Agree
1 2 3 4 5
Q17. My bank provides me with all the functionality/ services necessary to only bank
through electronic banking channels with no need to go into a branch.
Strongly Disagree
Disagree Don’t Know Agree Strongly
Agree
1 2 3 4 5

118
Q18. It is easy to find the transactional services I am looking for through electronic banking channels.
Strongly Disagree
Disagree Don’t Know Agree Strongly
Agree
1 2 3 4 5
Q19. The information available through electronic banking channels is easy to
understand.
Strongly Disagree
Disagree Don’t Know Agree Strongly
Agree
1 2 3 4 5
Q20. The information available through electronic banking channels is relevant to my
needs.
Strongly Disagree
Disagree Don’t Know Agree Strongly
Agree
1 2 3 4 5
Q21. Overall, I am satisfied with the electronic banking services offered by my bank.
Strongly Disagree
Disagree Don’t Know Agree Strongly
Agree
1 2 3 4 5

119
Section D
Main preference
Q22. What would be the most important factor to start/ continue transacting via electronic channels such as the Internet and/ or Cell phone banking?
(Please select your preferences by order of priority from 1 – 3)
Note: 1 being the most important
Ease of access
Ease of use
Education
Incentives e.g. reward programmes
Security to prevent fraud
Simplicity in opening bank products through electronic banking channels
Speed of transaction processing
Privacy of personal information
Other (if so, please explain below)
Other - explanation
Thank you for sharing your opinions with me. I appreciate your feedback.