a research report from ilc-uk · the value of fi nancial advice a research report from ilc-uk ... i...
TRANSCRIPT

The value of fi nancial adviceA Research Report from ILC-UK
Cesira Urzi Brancati, Ben Franklin and Brian Beach July 2017
www.ilcuk.org.uk

I 2 I The value of financial advice A Research Report from ILC-UK
AcknowledgementsThis project has been a real collaborative effort for which we are extremely grateful. First the ILC-UK would like to thank Royal London for sponsoring this research project. In particular, we would like to thank Berni Ryan who provided useful comments throughout and undertook the case study interviews included in this report. We’d like to thank The Pensions Advisory Service (TPAS) and Michelle Cracknell for enabling us to speak with some of their customers about their experiences of taking financial advice. We’d also like to thank all of the individuals who took part in the interviews and agreed to be case studies for this report. Final-ly, we’d like to thank those who took part in an industry roundtable to debate the report’s early findings and discuss possible recommendations. Nevertheless, the approach, contents and findings of the final report are solely the responsibility of the report’s authors.

I 3 I The value of fi nancial advice A Research Report from ILC-UK
Contents
Executive summary 4
Introduction 8
Chapter 1. Approach: Data and methods 10
Chapter 2. A demand-side overview of the advice market 12
Chapter 3. The main characteristics of people who receive fi nancial advice 18
Chapter 4. The medium-term economic impact of expert fi nancial advice 24
Chapter 5. Conclusions and recommendations 34
References 39
Appendix A 40
Appendix B 42
I 4 I The value of fi nancial advice A Research Report from ILC-UK
Executive summary
Overview
This report demonstrates the very real value of fi nancial advice for the consumer. Using robust statistical methods to control for a range of factors likely to determine demand for advice – including income, wealth and behavioural traits - our results show that those who take advice are likely to accumulate more fi nancial and pension wealth, supported by increased saving and investing in equity assets, while those in retirement are likely to have more income, particularly at older ages. Our results therefore demonstrate, in a statistically robust way, the importance of fi nancial advisers in delivering true value for their customers.
Background: About this report
Financial planning is complex. Broadly defi ned as making decisions about money to help individuals meet certain goals and aspirations over the lifetime, planning is a continuing process of anticipating and adapting to changes in personal circumstances over the long term. But the human mind is not programmed to think long term, preferring rewards today over larger rewards tomorrow, and switching off in the face of complexity.
Given that our lives are so full of other activities, we are likely to need help with fi nancial planning from those who are qualifi ed to give it. Unfortunately, many of us do not seek fi nancial advice – only 16.8% of people saw an adviser in the years 2012-2014. Indeed, this report fi nds that even amongst those who took out an investment product in the last few years, nearly half failed to see a fi nancial adviser. It is clearly a worry that so few fail to seek advice before taking out an investment product, where their capital could be at risk.
In this context, this report brings new empirical evidence to bear on the value of expert fi nancial advice. Our investigation, based on the largest representative survey of individual and household assets in Great Britain – The Wealth and Assets Survey, quantifi es the impact of advice on asset accumulation and retirement planning, and provides case studies to illustrate the roles of advisers in supporting the fi nancial planning needs of their clients.
Quantifying the value of fi nancial advice
This report’s major contribution is to explore whether advice makes a difference in terms of saving more, investing more in equity assets and ultimately more retirement income. Assessing whether advice works in this regard, poses signifi cant methodological challenges for researchers. Those who take advice may save more, accumulate greater fi nancial and pension assets and have higher pension incomes irrespective of taking fi nancial advice – perhaps because they are wealthier or more psychologically disposed to saving and investing in the fi rst place or prepared to accept more risk.
To address this challenge, this report uses an advanced statistical technique called propensity score matching which identifi es two similar groups of individuals within the data and then assesses the impact of advice on one group (the treatment group) versus the other (the control group) thereby mimicking a scientifi c experiment. Using this technique, our analysis explores the impact of receiving advice during the period 2001-2007 on consumer outcomes in 2012-14. As well as exploring the overall impact of advice, our analysis also focuses on two specifi c consumer groups – the “Affl uent” group (wealthier subset of the population) and the “Just Getting By” group (less wealthy subset).

I 5 I The value of financial advice A Research Report from ILC-UK
Headline findings
The results strongly demonstrate the positive value of financial advice for consumers – both amongst those who are wealthy and those who are less wealthy:
• Those who took advice were significantly more likely to save more as well as to invest in the equity market.
o The “affluent but advised” group was 6.7 percentage points more likely to save and 9.7 percentage points more likely to invest in the equity market than the equivalent non-advised group.
o The “just getting by group” was 9.7 percentage points more likely to save and 10.8 percentage points more likely to invest in the equity market than the equivalent non-advised group.
• Subsequently they ended up with more financial assets (£13,435) and pension wealth (£27,664) by 2012-14 than similar individuals who did not take advice.
o The “affluent but advised” group accumulated on average £12,363 (or 17%) more in liquid financial assets than the equivalent non-advised group, and £30,882 (or 16%) more in pension wealth.
o The “just getting by” but advised group accumulated on average £14,036 (or 39%) more in liquid financial assets than the equivalent non-advised group, and £25,859 (or 21%) more in pension wealth.
• Those who had received advice in the 2001-2007 period also had more pension income (+£773) than a similar group who did not. This was the case at all ages but particularly for the oldest group (+£1,100 for people aged 65-79 and +£1,300 for those aged 80 and over).
o The “affluent but advised” group earn £880 (or 16%) more per year than the equivalent non-advised group.
o The “just getting by” group earn £713 (or 19%) more per year than the equivalent non-advised group.
Table 1:The value of advice in numbers
Probability of saving in 2012-14
Average financial assets (2012/14)
Average pension wealth (2012/14)
Occupation/private pension income
Probability of having risky assets
Bassline (all groups) 56.8% £54,224 £161,248 £4,664 24.8%
Affluent & advised 67.0% £86,949 £223,711 £6,395 39.1%
Affluent & non-advised 60.3% £74,586 £192,829 £5,515 29.3%
Average impact on the ‘affluent’ 6.7pp £12,363 £30,882 £880 9.7pp
in percentage terms 17% 16% 16%
Just getting & advised 60.8% £49,918 £151,685 £4,409 27.6%
Just getting & non-advised 51.1% £35,882 £125,826 £3,696 16.8%
Average impact on the ‘just getting by’ 9.7pp £14,036 £25,859 £713 £10.8pp
in percentage terms 39% 21% 19%
All advised 63.0% £63,218 £177,471 £5,121 31.8%
All non-advised 54.4% £49,794 £149,814 £4,348 21.3%
Average effect on all 8.6pp £13,435 £27,664 £773 10.4pp
Source: Author’s analysis of Wealth and Assets Survey, various waves
These results strongly indicate that advice works, adding real value to consumer’s financial circumstances over the long run.

I 6 I The value of financial advice A Research Report from ILC-UK
Alongside demonstrating real value for their customers, evidence from this report also reveals that the experience of taking advice is highly satisfactory – 9 in 10 people are satisfied with the advice received with the vast majority deciding to go with their adviser’s recommendation.
Since advice has clear benefits for customers, it is a shame that more people do not use it. The clear challenge facing the industry and government is therefore how to get more people through the “front door” in the first place. In this context, our research reveals a number of critical factors that may help to support increased demand for advice. After controlling for a range of factors, the two most powerful driving forces of whether people sought advice was whether the individual trusts an IFA to provide advice and the individual’s level of financial capability. Raising trust and confidence in the industry and boosting overall levels of financial capability are important key drivers in improving understanding and generating greater demand for advice.
Recommendations
In light of these findings, the report makes a number of recommendations based on discussions with a roundtable of industry experts, which we summarise here:
Taking advantage of short to medium term opportunities
Using advice to support the auto-enrolled: As pension pots grow, consumers are likely to take more of an interest in their savings, since the choices they make regarding the pot will have an increasingly discernible impact on their overall financial situation. At this point, the employer must have an explicit duty to ensure employees can access the best information and advice regarding their pension savings and general financial position.
Default guidance for those seeking to access their pension savings: In the absence of a strong default decumulation product – which seems a relatively long way off and would not be optimal for some savers - guidance and advice are critical for consumers to make informed financial decisions. In this respect, we would echo the views of others across industry, that default guidance may be an appropriate strategy to ensure that people get the information they need in a complex marketplace.
Helping to create informed consumers through the pensions dashboard: The pensions dashboard may help to drive up the level of financial capability amongst pension savers and enable them to make more informed choices. Indeed, if we can get to a place where people review their pension savings more frequently (on a six monthly basis) that would be a real step forward in financial planning. Ensuring that the dashboard is easily accessible and understandable, with all relevant information included and up to date, will be critical to its success.
Advisers must sell their added value: This report demonstrates the real value add of financial advice – in terms of greater asset accumulation during working life and increased income in retirement. Since those who receive advice accumulate more assets and have more retirement income than those who don’t, this shows that advisers are good value for money. Post RDR, people now understand what taking advice will initially cost them, but many of those who fail to take advice are unlikely to know what the potential long term financial rewards are. It is up to the advice sector to convince them.
Harnessing technology to promote advice services: The front door isn’t just the high street. Increasingly consumers are looking at internet based solutions including online non-advised routes in order to support their financial planning needs. The advice sector must explore whether these other routes are an opportunity or a threat, including whether there are possibilities for working in collaboration with these other businesses. In addition, the industry should consider ways in which “robo advice” could complement existing expert financial advice. Advisers working with robots may well be the future, but only if it adds to, rather than detracts from, the current value of advice.

I 7 I The value of financial advice A Research Report from ILC-UK
Addressing long term challenges
Raising and promoting the professionalism of the sector: Initiatives to support increasing professionalism in the sector should be encouraged and well publicised so that the public better understand why going to adviser is beneficial rather than speaking to friends and family or using the internet.
Exploring what works to raise financial capability: There is some evidence to suggest that the timing of financial capability interventions is critical to their success and should be targeted at those individuals undergoing significant changes in their personal circumstances – i.e. marriage, starting a family, buying a home, saving for a pension etc. But more hard evidence on what types of interventions work is needed supported by high quality evaluations of pilots and projects that are currently ongoing.
Regulation should continue to place higher emphasis on accessibility: The Financial Advice Market Review has placed a strong emphasis on the affordability and access of advice. This regulatory focus must continue. Access to expert financial advice is likely to be important in fulfilling the FCA’s statutory remit of protecting consumers. Without access, individuals may not make good financial decisions, instead choosing either to go it alone, speak to family or friends or perhaps worst of all, choose an internet based solution to their financial planning needs which may be completely unregulated.
Supporting a step-change in cultures and behaviours across the financial services sector: The level of trust in financial advice will be dependent on how consumers view finan-cial intermediation in general. In this regard, a cultural shift across the retail financial services sector to put consumers first will be necessary in order to support increased trust, and drive up demand for expert advice.
I 8 I The value of fi nancial advice A Research Report from ILC-UK
Introduction
“I’m confused by all the options and lose the plot” – KL, busy with job and family commitments.
Across the developed world, there is widespread evidence of people failing to plan and save for retirement, failing to participate in the stock market, failing to diversify appropriately and failing to shop around for the best fi nancial products.1 The UK is no exception in this regard. As a result of poor decision making as well as inertia in the face of complex fi nancial decisions, many attain a standard of living in retirement which is signifi cantly lower than it could have been had they invested and planned better.
Over the years, scholars and legislators have come up with several potential solutions to try and prevent consumers making investment mistakes. Some of these solutions focus on providing extensive fi nancial education;2 others involve an infrastructure of nudges and default options capable of instigating optimal behaviours;3 some argue that simplifi cation and regulation are the answers.4 In addition, some authors argue that an effi cient way to prevent costly fi nancial mistakes could be to rely on the expert advice provided by industry professionals.5
In this report, we investigate the value of fi nancial advice as a tool to improve retirement planning and outcomes. Retirement planning is particularly challenging today because of the increasing responsibility being placed onto the individual. Historically, retirees would receive retirement income (to complement their state pension) through a defi ned benefi t (DB) plan; but, because of population ageing, DB schemes are now deemed unsustainable and closed to new entrants, and have been replaced with defi ned contribution (DC) schemes. Unlike DB schemes, when saving into a DC scheme, it is up to the individual to choose how much he or she wants to contribute every month, and those individuals need to be able to calculate the necessary amount to save to reach the desired retirement income. And yet, we have evidence that contribution rates are not nearly high enough to guarantee adequate income in retirement.6 In addition, the recent introduction of the “pension freedoms” allow people to choose whichever decumulation strategy they see fi t, including cashing in the entire DC pot, entering an income drawdown arrangement or buying an annuity. A critical challenge in this complex environment is to ensure that people are able to derive an income for their remaining years, whilst making sure they don’t run out of money before they die.
While expert fi nancial advice may have a crucial role to play in helping consumers plan adequately for retirement, much of the academic literature has argued that, in certain cases, consumers who receive fi nancial advice do not fare much better than those who do not. Furthermore, agency confl icts may arise, whereby fi nancial advisers may pursue their own interest rather than their clients’, especially when the compensation structure creates perverse incentives.To raise the professional standards of fi nancial advisers, as well as mitigate potential confl icts of interests, many governments have passed new regulations, such as the Markets in Financial Instruments Directive (MiFID) at the European Level and the Retail Distribution Review (RDR) in the UK.
This report adds to the literature on fi nancial advice by bringing new empirical evidence7,8 on the value of expert fi nancial advice in the UK. Our investigation, based on the largest representative survey of individual and household assets in Great Britain – The Wealth and Assets Survey –
1Lusardi and Mitchell, (2006, 2007)2Ibid. 3Thaler and Sunstein (2010)4Willis (2008). 5Hung and Yoong (2010); OECD Pensions Outlook, 2016. 6See for instance Franklin (2015) Consensus revisited: the case for a new Pensions Commission, Report for the ILC-UK7Inderst, R. and M. Ottaviani (2009). Misselling through agents. American Economic Review 99, 883.908.8Inderst, R. and M. Ottaviani (2011). Competition through commissions and kickbacks. American Economic Review 102(2), 780.809.
I 9 I The value of financial advice A Research Report from ILC-UK
quantifies the impact of advice on asset accumulation and retirement income. We supplement this data analysis with a selection of case studies which are the result of in depth interviews with customers of The Pensions Advisory Service (TPAS). These illustrate the journeys and experiences that a selection of customers have taken, from initially considering their financial planning needs to ultimately accessing a financial adviser. We’ve also included quotes from interviewees at the beginning of each chapter.
The report is structured in five chapters:
Chapter 1. Outlines the statistical methods that we have used to explore the value of financial advice and the key definitions that we have applied.
Chapter 2. Provides a demand side overview of the advice market. We describe the market for financial advice from the consumers’ perspective, by assessing the proportion of people who recently received advice, whether they were satisfied with the advice received, what type of provider delivered it, and so on.
Chapter 3. Explores the characteristics of those who received advice in terms of age, gender, marital status, education, income, financial capability, risk preferences, and trust in the financial industry.
Chapter 4. Quantifies the impact of advice on wealth accumulation, retirement income and the probability of investing in equity assets and saving for the future.
Chapter 5. Concludes the report with a series of recommendations for action to improve the take-up of financial advice.
I 10 I The value of fi nancial advice A Research Report from ILC-UK
Chapter 1. Approach: Data and methods
Data
Our empirical investigation draws on data from the Wealth and Assets Survey (WAS). The WAS is a longitudinal survey that interviews individuals and households across Great Britain; Wave one achieved approximately 30,000 household interviews, wave two achieved approximately 20,000 household interviews, wave three achieved approximately 21,000 household interviews and wave four achieved approximately 20,000 household interviews.
The WAS can be used to assess the economic well-being of households as it gathers information on the ownership of assets (fi nancial assets, physical assets and property), pensions, savings and debt. It is funded by a consortium of government departments: Department for Work and Pensions; HM Revenues and Customs; HM Treasury; Financial Conduct Authority; Scottish Government and the Offi ce for National Statistics. Fieldwork is undertaken by the Offi ce for National Statistics.
To produce the estimates illustrated in Chapters 2 and 3 we only used the latest wave of data (Wave 4, collected between 2012 and 2014). For the estimates illustrated in Chapter 4, we used all waves, so as to follow our individuals over time. Our sample is restricted to all individuals or households who completed a full interview. In addition, while in the fi rst part of our analysis (Chapters 2 and 3) we looked at all individuals aged 20 and over, regardless of their economic position, for the last part of the analysis (Chapter 4), we focused on individuals close to retirement age (45+), who were not yet retired.
Methods: econometric specifi cations
To describe the use of fi nancial advice in Britain and compare the socio-economic characteristics of those who receive advice with those who do not, our analysis applies a number of statistical techniques. In particular, we fi rst produce some descriptive statistics on the prevalence of fi nancial advice; the most common sources used; the level of trust in advisers; the level of satisfaction with the advice received, and so on. We then use a series of discrete choice models (logit, multinomial logit) to study the socio-economic characteristics of individuals who receive advice, the probability to act on the advice received, and what the preferred source of advice was (i.e. IFA, banks, free agencies or other’).
In Chapter 4 we identify the causal impact of receiving fi nancial advice on a series of outcomes, such as: saving/saving more; investing in equity assets; attaining a higher retirement income.
Even though purely descriptive research can offer some interesting insights, we believe that the most important research in social science is about questions of cause and effect. One of the main issues in quantifying the value of fi nancial advice is that consumers who look for advice may be different from those who do not, and may therefore accumulate more wealth or achieve a better standard of living because of those innate differences and not because of the advice received. In addition, some people may decide to take advice because they know that they stand to gain more from it, and thus estimating a difference in mean outcomes between advised and non-advised will give us biased results.
To identify a causal impact, we need to ensure that receiving advice is independent of the outcome. One way to achieve this, is to fi rst estimate the probability of being ‘treated’ (i.e. of receiving advice) through a discrete choice model controlling for a series of relevant factors; we can then calculate the predicted value of exposure from the model, that is the ‘propensity score’. Each observation in our data will have a propensity score variable with range 0-1. Some observations may have been treated (T=1) with low propensity score of 0.01, while others not treated (T=0) with high propensity score of 0.90.
I 11 I The value of financial advice A Research Report from ILC-UK
Finally, we then use the propensity score in the analysis to estimate the treatment effect. The idea behind this technique is that it mimics a natural experiment, so that, should any difference in mean outcome between the two groups occur, we would be able to say that it is due to our ‘treatment’, which in this case is equal to having received financial advice. Clearly, we cannot guarantee that we will attain exactly the same results as if we carried out an experiment; we can only hope that our estimates will be less biased and thus closer to the true impact of receiving advice than if we run a simple regression.
Because we are interested in the medium/long term impact of receiving financial advice, we will estimate the probability of receiving advice between 2001 and 2007 and estimate its impact on outcomes occurring in 2012-14.
Focus box: Defining financial advice
Since we are using the WAS in order to explore the use of financial advice, we utilise the survey’s definitions of financial advice. WAS has used two definitions of advice over various waves.
“The Wealth and Assets Survey (WAS) defines expert financial advice as advice from a professional person – including a family member or a friend qualified to give expert advice – who advises people looking to make financial decisions” WAS Wave 4 2012/14.
We use this definition in Chapters 2 and 3 which explore financial advice over the last couple of years.
“In the last five years, have you received any professional advice about planning your personal finances? By that I mean things like planning for retirement, tax planning, or investing money. But please do not include any advice related to running a business or mortgages” WAS Wave 1 (2006/7).
We use this definition of financial advice in Chapter 4 which explores the medium term impact of taking financial advice.
Please refer to our Glossary in Appendix A for definitions of key terms and variables used in this report.
I 12 I The value of fi nancial advice A Research Report from ILC-UK
Chapter 2. A demand-side overview of the advice market
“You have to know what’s what, to know that what the ‘expert’ is telling you is right.” - GP, seeking advice on a small self-administered scheme
Summary
• We estimate that approximately 16.8% of the adult population in Britain received expert fi nancial advice between 2012-2014. This is equivalent to approximately 7.5 million people.
• People are more likely to search for advice in their mid ’20s to mid ‘30s (19.3%), and in their mid ‘50s to mid ‘60s (19.3%) in line with typical lifecourse choices (i.e. taking out a mortgage for the younger group and choosing investments or a personal pension for the older age group).
• Investments (27%), mortgages (24%) and pensions (15%) were the most commonly cited reasons for seeking fi nancial advice.
• 40.8% of people who received advice consulted either a fi rm of Independent Financial Advisers (IFA) or a sole / self-employed fi nancial adviser, whereas 29% received advice from someone working for a bank or a building society.
• More than 9 in 10 consumers reported being very or fairly satisfi ed with the advice received at the time they received it, as well as when asked about it at a later point in time.
• Nearly 86% of people who were satisfi ed with the advice they received bought a product following their adviser’s recommendation. Amongst those who were unsatisfi ed, 18% of them still bought a product following the recommendation.
• Perhaps due to high levels of satisfaction, the majority of consumers do not feel the need to get a “second opinion” on the advice received with 62.7% speaking to just one adviser.
• Our analysis also highlights a number of potential market issues:
- People who may need advice don’t seek it: Around 40% of people who took out an investment product didn’t take advice, and this rises to 78% of people who took out a personal pension.
- People fail to understand how advice is paid for: Approximately 30% of people who received advice thought it was free, including around 15% of people who received advice from an IFA.
Defi ning expert fi nancial advice
For the purposes of this and the following chapter, we use the defi nition of fi nancial advice taken from WAS Wave 4 (2012-2014) which defi nes advice as advice from a professional person – including a family member or a friend qualifi ed to give expert advice – who advises people looking to make fi nancial decisions.9 We follow this defi nition in our analysis and include advice provided by a professional in the following institutions: A bank or building society; an insurance company; an accountant or solicitor; a fi rm of fi nancial advisers (e.g. an IFA); a sole/self-employed fi nancial adviser; a stockbroker or wealth manager; a charity or union; a free advice agency (eg Citizens Advice Bureau, the Pensions Service (now The Pensions Advisory Service, TPAS), Money Advice Service; Other. Our defi nition of advice is therefore broader than the defi nition usually adopted by the industry, according to which advice is a service specifi cally provided by a regulated fi nancial adviser, and we include a range of different sources, some of which provide specifi c product recommendations and some of which provide more generic
9 Expert fi nancial advice could include a face-to-face, telephone or an internet consultation where you may have been asked detailed questions about your needs and circumstances, including full details of your income and outgoings.
I 13 I The value of financial advice A Research Report from ILC-UK
advice or guidance. This allows us to explore who uses these different sources and identify whether there are any differences in consumer outcomes depending on the sources of advice received.
A quick overview of the market for financial advice
How many people receive advice?
To study the market for expert financial advice in the UK, we exploit a new module of the Wealth and Assets Survey (2012/14). In this chapter, our population of interest comprises only adults over the age of 20. Because the module on financial advice was introduced in the survey mid-wave, approximately half of the observations are missing; however, we are still left with an initial sample of 17,520 people.
Between 2012 and 2014, approximately 16.8% of the UK adult population received some form of expert financial advice. This is equivalent to approximately 7.5 million people.
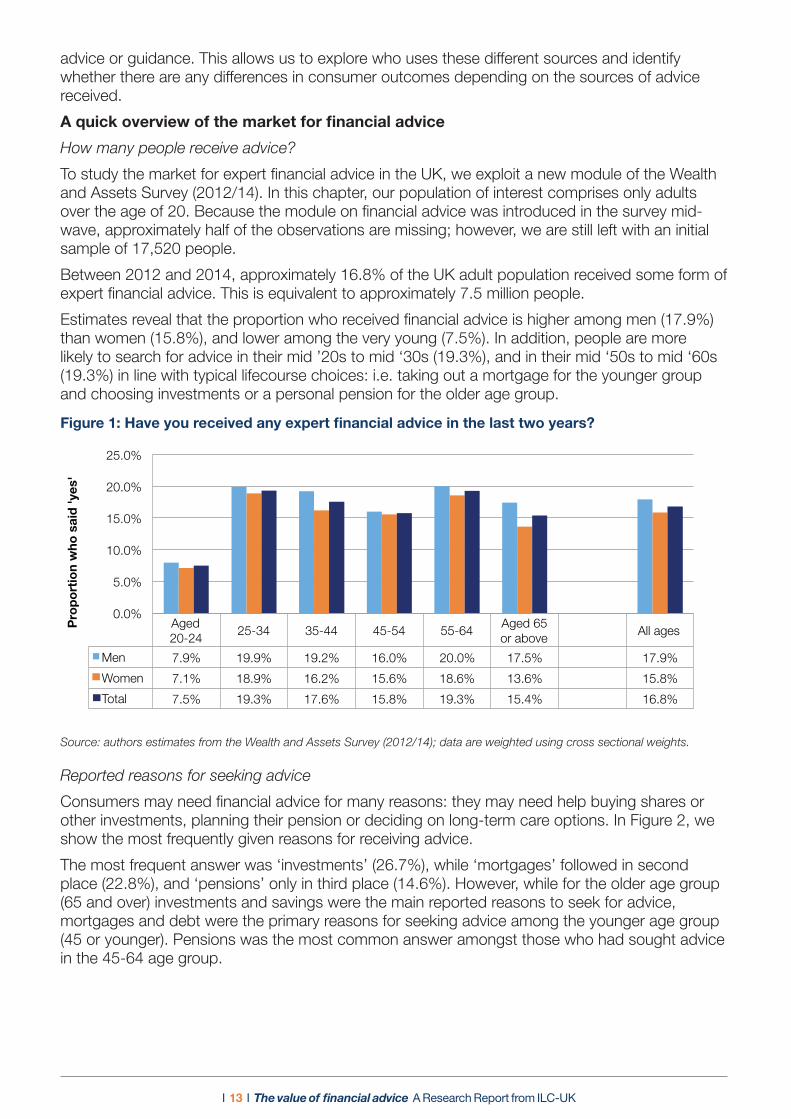
Estimates reveal that the proportion who received financial advice is higher among men (17.9%) than women (15.8%), and lower among the very young (7.5%). In addition, people are more likely to search for advice in their mid ’20s to mid ‘30s (19.3%), and in their mid ‘50s to mid ‘60s (19.3%) in line with typical lifecourse choices: i.e. taking out a mortgage for the younger group and choosing investments or a personal pension for the older age group.
Figure 1: Have you received any expert financial advice in the last two years?
11
Figure 1 : Have you received any expert financial advice in the last two years?
Source: authors estimates from the Wealth and Assets Survey (2012/14); data are weighted using cross sectional weights.
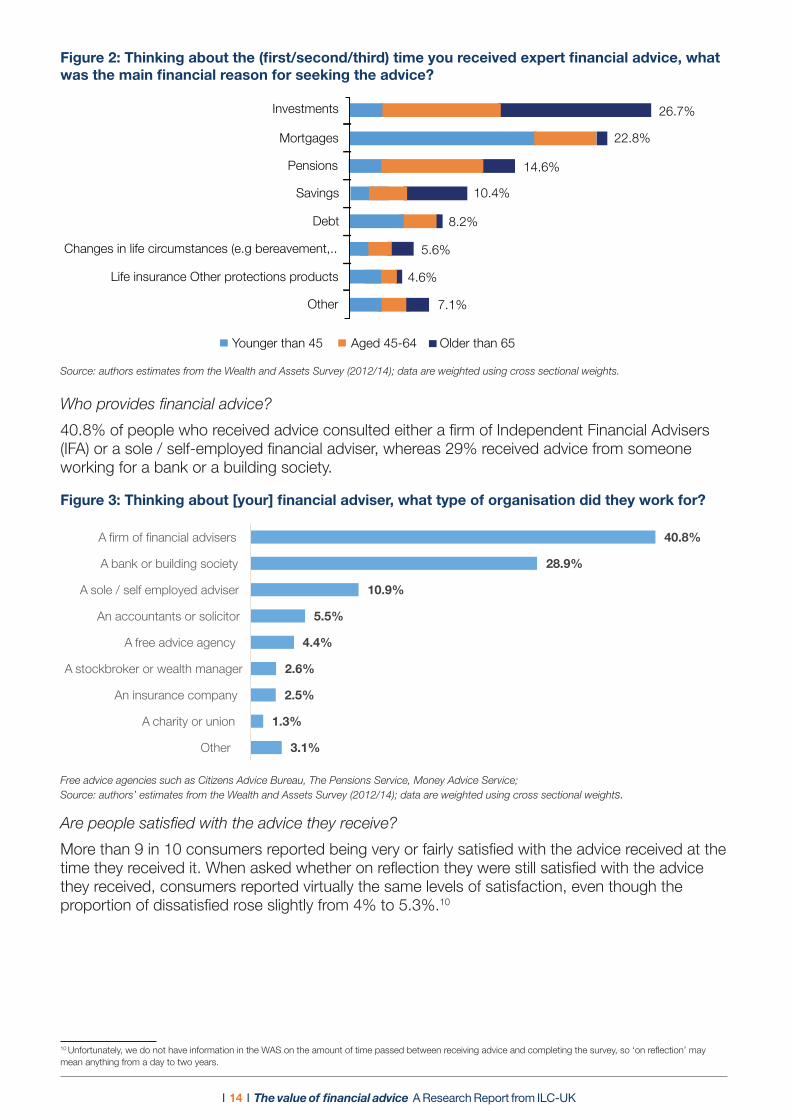
Figure 2: Thinking about the (first/second/third) time you received expert financial advice, what was the main financial reason for seeking the advice?
Source: authors estimates from the Wealth and Assets Survey (2012/14); data are weighted using cross sectional wei ghts.
Aged 20-24
25-34 35-44 45-54 55-64 Aged 65 or above
All ages
Men 7.9% 19.9% 19.2% 16.0% 20.0% 17.5% 17.9%
Women 7.1% 18.9% 16.2% 15.6% 18.6% 13.6% 15.8%
Total 7.5% 19.3% 17.6% 15.8% 19.3% 15.4% 16.8%
0.0%
5.0%
10.0%
15.0%
20.0%
25.0%
Pro
po
rtio
n w
ho s
aid
'yes
'
Younger than 45 Aged 45-64
7.1%
4.6%
8.2%
10.4%
22.8%
26.7%
14.6%
5.6%
Older than 65
Other
Investments
Mortgages
Pensions
Savings
Debt
Changes in life circumstances (e.g bereavement,..
Life insurance Other protections products
Source: authors estimates from the Wealth and Assets Survey (2012/14); data are weighted using cross sectional weights.
Reported reasons for seeking advice
Consumers may need financial advice for many reasons: they may need help buying shares or other investments, planning their pension or deciding on long-term care options. In Figure 2, we show the most frequently given reasons for receiving advice.
The most frequent answer was ‘investments’ (26.7%), while ‘mortgages’ followed in second place (22.8%), and ‘pensions’ only in third place (14.6%). However, while for the older age group (65 and over) investments and savings were the main reported reasons to seek for advice, mortgages and debt were the primary reasons for seeking advice among the younger age group (45 or younger). Pensions was the most common answer amongst those who had sought advice in the 45-64 age group.
I 14 I The value of financial advice A Research Report from ILC-UK
Figure 2: Thinking about the (first/second/third) time you received expert financial advice, what was the main financial reason for seeking the advice?
11
Figure 1 : Have you received any expert financial advice in the last two years?
Source: authors estimates from the Wealth and Assets Survey (2012/14); data are weighted using cross sectional weights.
Figure 2: Thinking about the (first/second/third) time you received expert financial advice, what was the main financial reason for seeking the advice?
Source: authors estimates from the Wealth and Assets Survey (2012/14); data are weighted using cross sectional wei ghts.
Aged 20-24
25-34 35-44 45-54 55-64 Aged 65 or above
All ages
Men 7.9% 19.9% 19.2% 16.0% 20.0% 17.5% 17.9%
Women 7.1% 18.9% 16.2% 15.6% 18.6% 13.6% 15.8%
Total 7.5% 19.3% 17.6% 15.8% 19.3% 15.4% 16.8%
0.0%
5.0%
10.0%
15.0%
20.0%
25.0%
Pro
po
rtio
n w
ho s
aid
'yes
'
Younger than 45 Aged 45-64
7.1%
4.6%
8.2%
10.4%
22.8%
26.7%
14.6%
5.6%
Older than 65
Other
Investments
Mortgages
Pensions
Savings
Debt
Changes in life circumstances (e.g bereavement,..
Life insurance Other protections products
Source: authors estimates from the Wealth and Assets Survey (2012/14); data are weighted using cross sectional weights.
Who provides financial advice?
40.8% of people who received advice consulted either a firm of Independent Financial Advisers (IFA) or a sole / self-employed financial adviser, whereas 29% received advice from someone working for a bank or a building society.
Figure 3: Thinking about [your] financial adviser, what type of organisation did they work for?
40.8%
28.9%
10.9%
5.5%
4.4%
2.6%
2.5%
1.3%
3.1%
A firm of financial advisers
A bank or building society
A sole / self employed adviser
An accountants or solicitor
A free advice agency
A stockbroker or wealth manager
An insurance company
A charity or union
Other
Free advice agencies such as Citizens Advice Bureau, The Pensions Service, Money Advice Service; Source: authors’ estimates from the Wealth and Assets Survey (2012/14); data are weighted using cross sectional weights.
Are people satisfied with the advice they receive?
More than 9 in 10 consumers reported being very or fairly satisfied with the advice received at the time they received it. When asked whether on reflection they were still satisfied with the advice they received, consumers reported virtually the same levels of satisfaction, even though the proportion of dissatisfied rose slightly from 4% to 5.3%.10
10 Unfortunately, we do not have information in the WAS on the amount of time passed between receiving advice and completing the survey, so ‘on reflection’ may mean anything from a day to two years.
I 15 I The value of financial advice A Research Report from ILC-UK
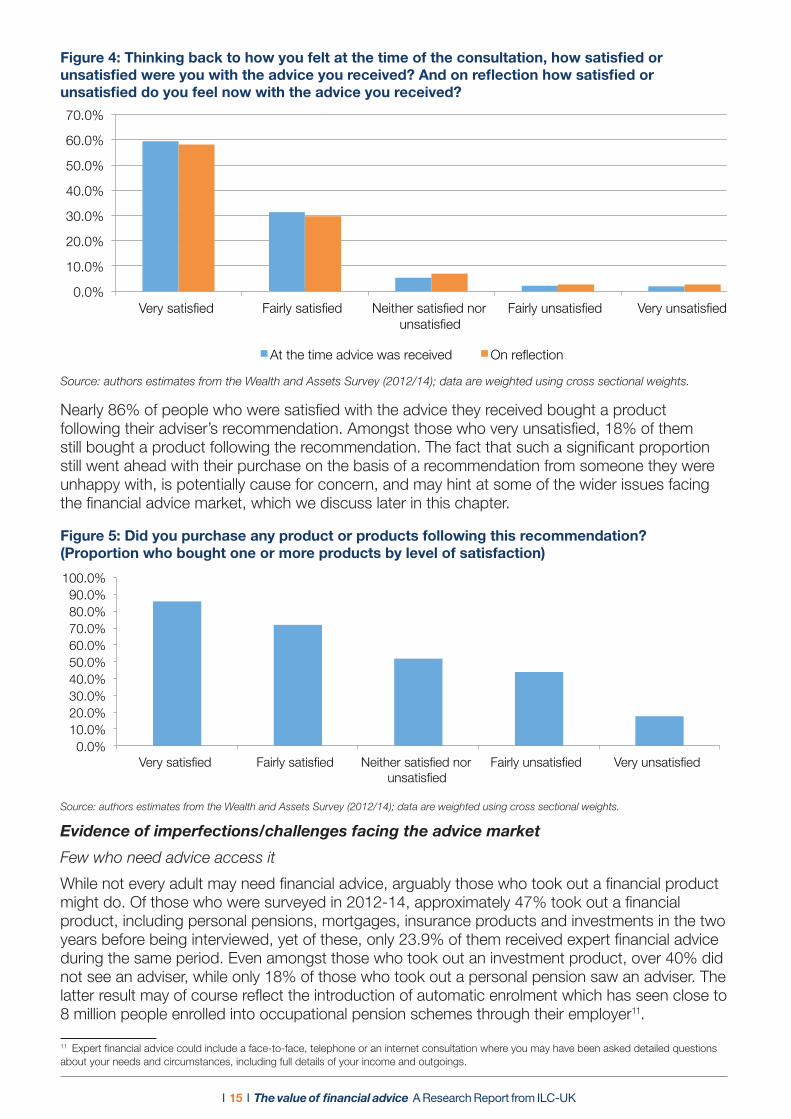
Figure 4: Thinking back to how you felt at the time of the consultation, how satisfied or unsatisfied were you with the advice you received? And on reflection how satisfied or unsatisfied do you feel now with the advice you received?
0.0%
10.0%
20.0%
30.0%
40.0%
50.0%
60.0%
70.0%
Very satisfied Fairly satisfied Neither satisfied nor unsatisfied
Fairly unsatisfied Very unsatisfied
At the time advice was received On reflection
0.0% 10.0% 20.0% 30.0% 40.0% 50.0% 60.0% 70.0% 80.0% 90.0%
100.0%
Very satisfied Fairly satisfied Neither satisfied nor unsatisfied
Fairly unsatisfied Very unsatisfied
Source: authors estimates from the Wealth and Assets Survey (2012/14); data are weighted using cross sectional weights.
Nearly 86% of people who were satisfied with the advice they received bought a product following their adviser’s recommendation. Amongst those who very unsatisfied, 18% of them still bought a product following the recommendation. The fact that such a significant proportion still went ahead with their purchase on the basis of a recommendation from someone they were unhappy with, is potentially cause for concern, and may hint at some of the wider issues facing the financial advice market, which we discuss later in this chapter.
Figure 5: Did you purchase any product or products following this recommendation? (Proportion who bought one or more products by level of satisfaction)
0.0%
10.0%
20.0%
30.0%
40.0%
50.0%
60.0%
70.0%
Very satisfied Fairly satisfied Neither satisfied nor unsatisfied
Fairly unsatisfied Very unsatisfied
At the time advice was received On reflection
0.0% 10.0% 20.0% 30.0% 40.0% 50.0% 60.0% 70.0% 80.0% 90.0%
100.0%
Very satisfied Fairly satisfied Neither satisfied nor unsatisfied
Fairly unsatisfied Very unsatisfied
Source: authors estimates from the Wealth and Assets Survey (2012/14); data are weighted using cross sectional weights.
Evidence of imperfections/challenges facing the advice market
Few who need advice access it
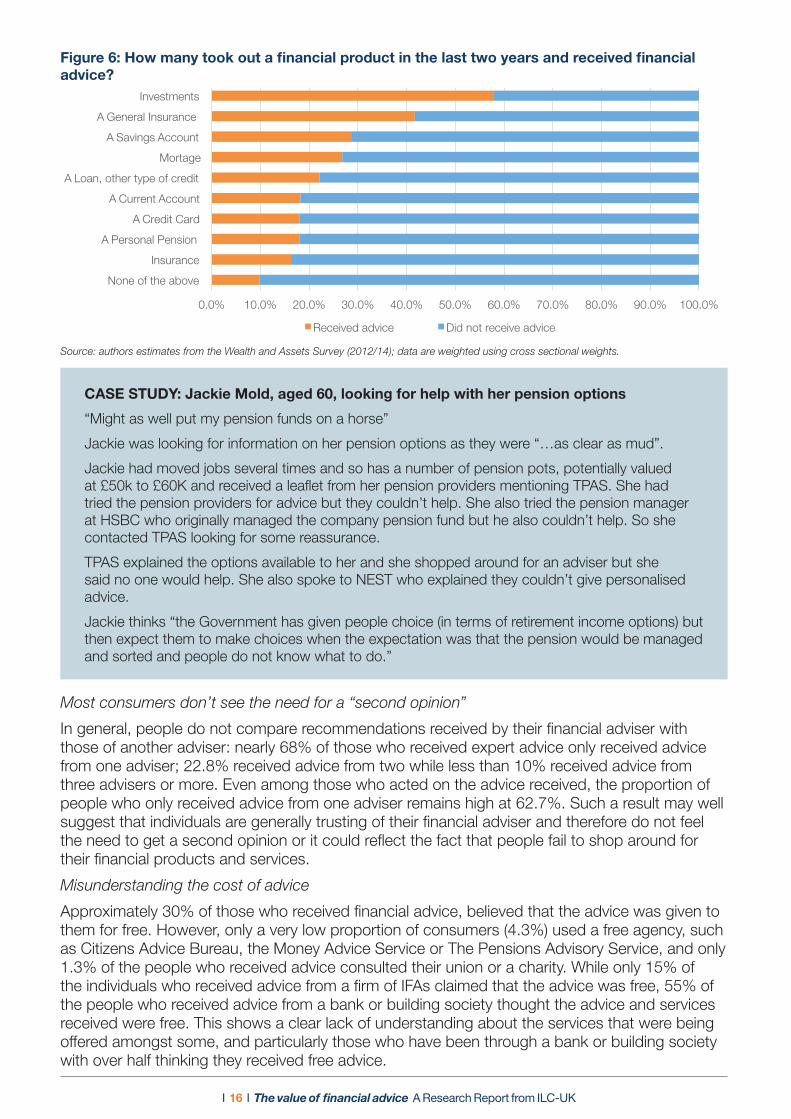
While not every adult may need financial advice, arguably those who took out a financial product might do. Of those who were surveyed in 2012-14, approximately 47% took out a financial product, including personal pensions, mortgages, insurance products and investments in the two years before being interviewed, yet of these, only 23.9% of them received expert financial advice during the same period. Even amongst those who took out an investment product, over 40% did not see an adviser, while only 18% of those who took out a personal pension saw an adviser. The latter result may of course reflect the introduction of automatic enrolment which has seen close to 8 million people enrolled into occupational pension schemes through their employer11.
11 Expert financial advice could include a face-to-face, telephone or an internet consultation where you may have been asked detailed questions about your needs and circumstances, including full details of your income and outgoings.
I 16 I The value of financial advice A Research Report from ILC-UK
Figure 6: How many took out a financial product in the last two years and received financial advice?
0.0% 10.0% 20.0% 30.0% 40.0% 50.0% 60.0% 70.0% 80.0% 90.0% 100.0%
None of the above
Insurance
A Personal Pension
A Credit Card
A Current Account
A Loan, other type of credit
Mortage
A Savings Account
A General Insurance
Investments
Received advice Did not receive advice
Source: authors estimates from the Wealth and Assets Survey (2012/14); data are weighted using cross sectional weights.
CASE STUDY: Jackie Mold, aged 60, looking for help with her pension options
“Might as well put my pension funds on a horse”
Jackie was looking for information on her pension options as they were “…as clear as mud”.
Jackie had moved jobs several times and so has a number of pension pots, potentially valued at £50k to £60K and received a leaflet from her pension providers mentioning TPAS. She had tried the pension providers for advice but they couldn’t help. She also tried the pension manager at HSBC who originally managed the company pension fund but he also couldn’t help. So she contacted TPAS looking for some reassurance.
TPAS explained the options available to her and she shopped around for an adviser but she said no one would help. She also spoke to NEST who explained they couldn’t give personalised advice.
Jackie thinks “the Government has given people choice (in terms of retirement income options) but then expect them to make choices when the expectation was that the pension would be managed and sorted and people do not know what to do.”
Most consumers don’t see the need for a “second opinion”
In general, people do not compare recommendations received by their financial adviser with those of another adviser: nearly 68% of those who received expert advice only received advice from one adviser; 22.8% received advice from two while less than 10% received advice from three advisers or more. Even among those who acted on the advice received, the proportion of people who only received advice from one adviser remains high at 62.7%. Such a result may well suggest that individuals are generally trusting of their financial adviser and therefore do not feel the need to get a second opinion or it could reflect the fact that people fail to shop around for their financial products and services.
Misunderstanding the cost of advice
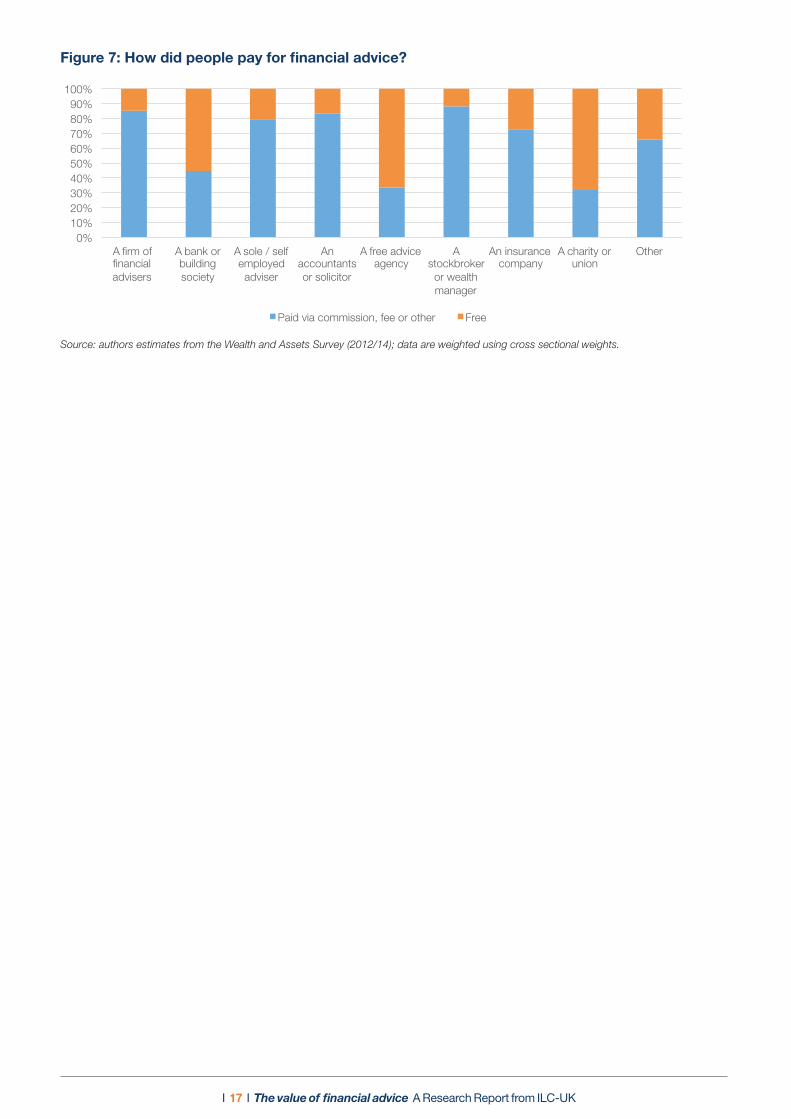
Approximately 30% of those who received financial advice, believed that the advice was given to them for free. However, only a very low proportion of consumers (4.3%) used a free agency, such as Citizens Advice Bureau, the Money Advice Service or The Pensions Advisory Service, and only 1.3% of the people who received advice consulted their union or a charity. While only 15% of the individuals who received advice from a firm of IFAs claimed that the advice was free, 55% of the people who received advice from a bank or building society thought the advice and services received were free. This shows a clear lack of understanding about the services that were being offered amongst some, and particularly those who have been through a bank or building society with over half thinking they received free advice.
I 17 I The value of financial advice A Research Report from ILC-UK
Figure 7: How did people pay for financial advice?
0% 10% 20% 30% 40% 50% 60% 70% 80% 90%
100%
A firm of financial advisers
A bank or building society
A sole / self employed adviser
An accountants or solicitor
A free advice agency
A stockbroker or wealth manager
An insurance company
A charity or union
Other
Paid via commission, fee or other Free
Source: authors estimates from the Wealth and Assets Survey (2012/14); data are weighted using cross sectional weights.

I 18 I The value of fi nancial advice A Research Report from ILC-UK
Chapter 3. The main characteristics of people who receive fi nancial advice
Summary
• The probability of receiving fi nancial advice increases signifi cantly with income and wealth, but the impact is dampened once controls for all other factors are included. Earners in the top quartile (>£23,500) are 12 percentage points more likely to receive advice than low earners (<£2,210).
• All else equal, trust in IFAs appears to be the strongest driver of the demand for expert advice:
- The probability of receiving fi nancial advice is 12.5 percentage points higher among people who say that they would trust an IFA as among who those that did not express such trust. In addition, people who trust IFAs are 6.6 percentage points more likely to act on the advice received and buy a product following the recommendation.
• Raising fi nancial capability levels may lead to an increase in the demand for fi nancial advice among women and the less wealthy, and therefore help reduce the advice gap:
- Highly fi nancially capable individuals are 8.2 percentage points more likely to receive fi nancial advice than people with low fi nancial capability. However, when it comes to buying a product, highly capable investors are 9.5 percentage points less likely to follow the advice received.
- While at low fi nancial capability levels men are more likely than women to get advice (15.5% of men vs 13.7% of women), at high levels the relationship is reversed and women are 3 percentage points more likely to receive advice than men (21.1% of men and 24% of women).
- Highly fi nancially capable individuals with less than £500 in assets are only 2.8 percentage points less likely to receive advice than the least fi nancially capable people who have more than £36,000 in fi nancial assets (19.0% vs. 21.8%), suggesting that fi nancial capability is a stronger driver of the demand for advice than wealth.
• Self-employed individuals are 6 percentage points more likely to receive expert fi nancial advice than being an employee, which may be because they have to deal with more uncertain income and would benefi t more from careful fi nancial planning. Furthermore, they are also 6 percentage points more likely to act on the advice received and buy the recommended product.
• Unsurprisingly, wealthier individuals are 14.7% more likely to use an IFA, while people in the lowest wealth quartile are more likely to use a free agency.
About this chapter
In this chapter, we explore the characteristics of those who receive fi nancial advice. Detailed profi les of those who recently received advice versus those who did not were created focusing on a wide array of socio-economic and psychological characteristics.12 To this end, this chapter reveals the results of an empirical investigation exploiting data from wave 4 of the WAS (2012 to 2014) that focused on all adults aged 20 and over and not yet in retirement. We compare the attributes of people who actually acted on the advice received by buying the recommended fi nancial product, with those who did not act. Finally, we explore the differences between the different types of advice and assess the attributes typical of people who use an IFA as opposed to a bank or building society, a charity or union, or another organisation providing fi nancial advice.
The socio-economic characteristics we include in our analysis are: age, gender, marital status,
12 The defi nition of expert fi nancial advice is the same as the one given in the previous section, i.e. services including a face-to-face, telephone or an internet consulta-tion where one may have been asked detailed questions about your needs and circumstances, including full details of your income and outgoings.
I 19 I The value of financial advice A Research Report from ILC-UK
household size, educational attainment, housing tenure, employment status, income and financial wealth quartiles. In terms of psychological factors, we adopt simplified measures for risk aversion, cautiousness and trust in financial advisers and banks.13 We use a measure of financial capability to understand the extent to which it may be seen as a complement or as a substitute for financial advice. The financial capability measure (Fin Cap Index) is built combining information provided by the answers to the three questions – self-assessed pension knowledge, knowledge of bank account and frequency of checking own account – to create a composite indicator of financial capability. We then classify people as having low, medium and high financial capability based on the combined answers.
Income, wealth and the search for adviceBetween 2012 and 2014 the average individual net income among people aged 20 and over and not yet in retirement was equal to roughly £24,230 (median income £16,200), 14 while average financial wealth (gross) was equal to approximately £47,855 (£4,074 median wealth).15 We also estimate that approximately 17.3% of the people aged 20 and over have received expert financial advice during the same period.16
To assess how income and wealth may affect the probability of receiving advice, we ran a few separate regressions: in the first two, we studied the unadjusted impact of belonging to higher income or wealth quartiles, in the third we included all the socio-demographics and in the last one we added the psychological characteristics and the financial capability measure.
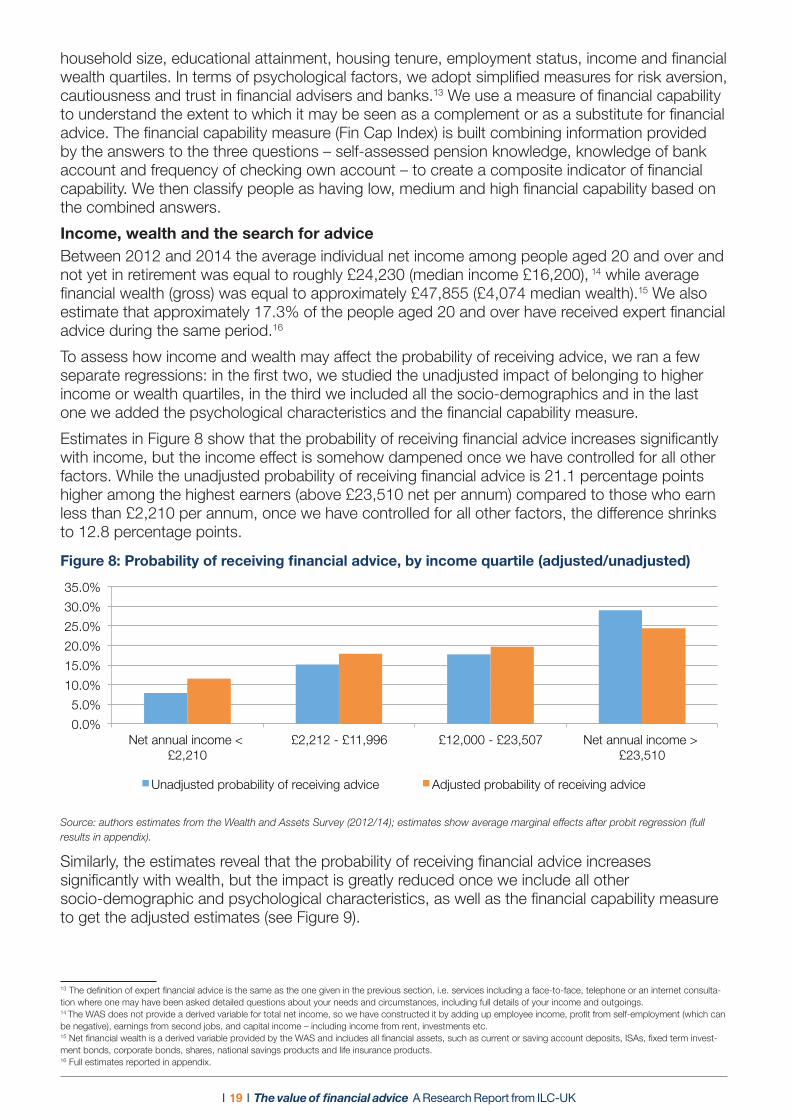
Estimates in Figure 8 show that the probability of receiving financial advice increases significantly with income, but the income effect is somehow dampened once we have controlled for all other factors. While the unadjusted probability of receiving financial advice is 21.1 percentage points higher among the highest earners (above £23,510 net per annum) compared to those who earn less than £2,210 per annum, once we have controlled for all other factors, the difference shrinks to 12.8 percentage points.
Figure 8: Probability of receiving financial advice, by income quartile (adjusted/unadjusted)
0.0%
5.0%
10.0%
15.0%
20.0%
25.0%
30.0%
35.0%
Net annual income <£2,210
£2,212 - £11,996 £12,000 - £23,507 Net annual income > £23,510
Unadjusted probability of receiving advice Adjusted probability of receiving advice
0.0% 5.0%
10.0% 15.0% 20.0% 25.0% 30.0% 35.0% 40.0%
Gross financial assets <£500
£500 - £6,000 £6,005 - £36,1000 Gross financial assets >£36,101
Unadjusted probability of receiving advice Adjusted probability of receiving advice
Source: authors estimates from the Wealth and Assets Survey (2012/14); estimates show average marginal effects after probit regression (full results in appendix).
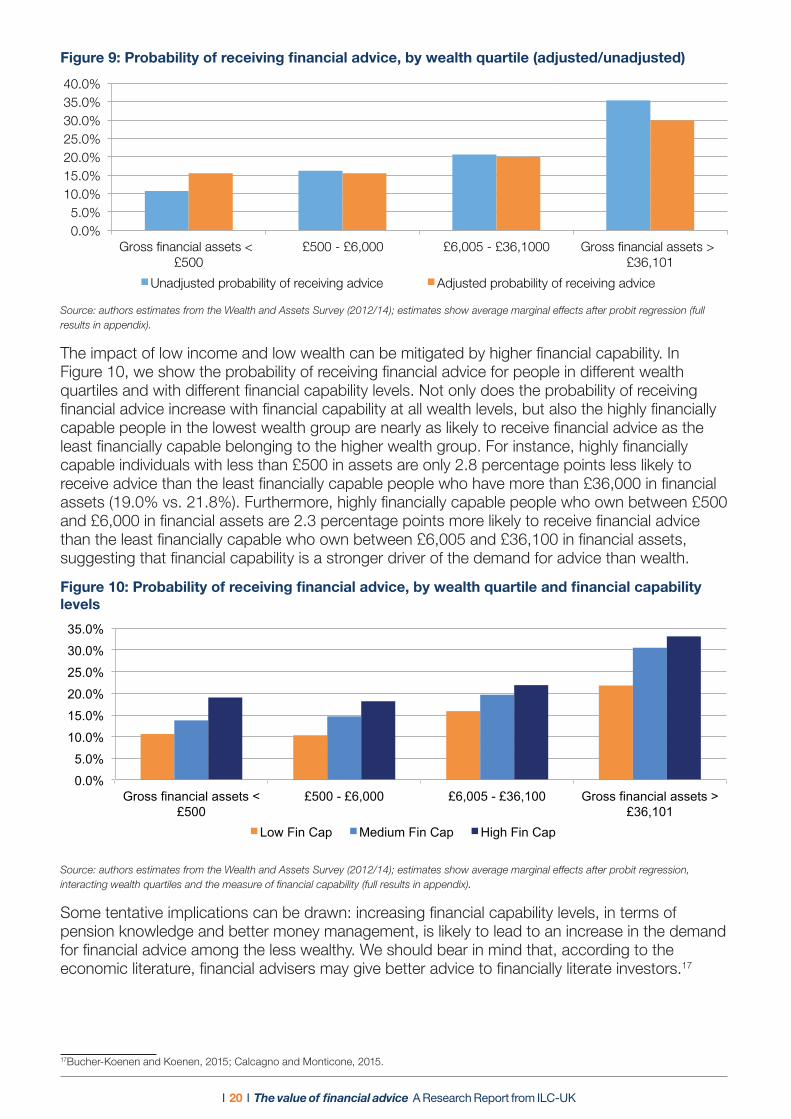
Similarly, the estimates reveal that the probability of receiving financial advice increases significantly with wealth, but the impact is greatly reduced once we include all other socio-demographic and psychological characteristics, as well as the financial capability measure to get the adjusted estimates (see Figure 9).
13 The definition of expert financial advice is the same as the one given in the previous section, i.e. services including a face-to-face, telephone or an internet consulta-tion where one may have been asked detailed questions about your needs and circumstances, including full details of your income and outgoings. 14 The WAS does not provide a derived variable for total net income, so we have constructed it by adding up employee income, profit from self-employment (which can be negative), earnings from second jobs, and capital income – including income from rent, investments etc. 15 Net financial wealth is a derived variable provided by the WAS and includes all financial assets, such as current or saving account deposits, ISAs, fixed term invest-ment bonds, corporate bonds, shares, national savings products and life insurance products. 16 Full estimates reported in appendix.
I 20 I The value of financial advice A Research Report from ILC-UK
Figure 9: Probability of receiving financial advice, by wealth quartile (adjusted/unadjusted)
0.0%
5.0%
10.0%
15.0%
20.0%
25.0%
30.0%
35.0%
Net annual income <£2,210
£2,212 - £11,996 £12,000 - £23,507 Net annual income > £23,510
Unadjusted probability of receiving advice Adjusted probability of receiving advice
0.0% 5.0%
10.0% 15.0% 20.0% 25.0% 30.0% 35.0% 40.0%
Gross financial assets <£500
£500 - £6,000 £6,005 - £36,1000 Gross financial assets >£36,101
Unadjusted probability of receiving advice Adjusted probability of receiving advice
Source: authors estimates from the Wealth and Assets Survey (2012/14); estimates show average marginal effects after probit regression (full results in appendix).
The impact of low income and low wealth can be mitigated by higher financial capability. In Figure 10, we show the probability of receiving financial advice for people in different wealth quartiles and with different financial capability levels. Not only does the probability of receiving financial advice increase with financial capability at all wealth levels, but also the highly financially capable people in the lowest wealth group are nearly as likely to receive financial advice as the least financially capable belonging to the higher wealth group. For instance, highly financially capable individuals with less than £500 in assets are only 2.8 percentage points less likely to receive advice than the least financially capable people who have more than £36,000 in financial assets (19.0% vs. 21.8%). Furthermore, highly financially capable people who own between £500 and £6,000 in financial assets are 2.3 percentage points more likely to receive financial advice than the least financially capable who own between £6,005 and £36,100 in financial assets, suggesting that financial capability is a stronger driver of the demand for advice than wealth.
Figure 10: Probability of receiving financial advice, by wealth quartile and financial capability levels
0.0%
5.0%
10.0%
15.0%
20.0%
25.0%
30.0%
35.0%
Gross financial assets <£500
£500 - £6,000 £6,005 - £36,100 Gross financial assets >£36,101
Low Fin Cap Medium Fin Cap High Fin Cap
Source: authors estimates from the Wealth and Assets Survey (2012/14); estimates show average marginal effects after probit regression, interacting wealth quartiles and the measure of financial capability (full results in appendix).
Some tentative implications can be drawn: increasing financial capability levels, in terms of pension knowledge and better money management, is likely to lead to an increase in the demand for financial advice among the less wealthy. We should bear in mind that, according to the economic literature, financial advisers may give better advice to financially literate investors.17
17Bucher-Koenen and Koenen, 2015; Calcagno and Monticone, 2015.
I 21 I The value of financial advice A Research Report from ILC-UK
CASE STUDY: Dr Adrian Tucker, Aged 43, moving into the private sector from the civil service and out of the UK
“I’m just going to have to get on with it myself”
Dr Tucker contacted TPAS to check what the position and implications were for him as he was moving from the civil service to the private sector, as well as leaving the country. He thought TPAS were great at outlining the general implications but as some of the aspects were quite difficult to understand he wanted to get financial advice.
He had an IFA that he had used previously, but didn’t think that they would be interested as there was effectively, “nothing in it for them”. However, he found the advice helpful to the extent that it identified that he had another pension, a stakeholder pension that was set up in his 20’s, and warned him about the potential for his state pension entitlement to be frozen while he was abroad.
However, Dr Tucker was frustrated that there were “no real answers” following consultation with the adviser and that he “would just have to get on with it” himself.
Dr Tucker said that he would see an adviser again as long as it was one who could take care of things in an independent way. He suggested that people should go on-line and look for an adviser locally.
Age and gender and other socio-demographics do not really matter once you take everything else into account
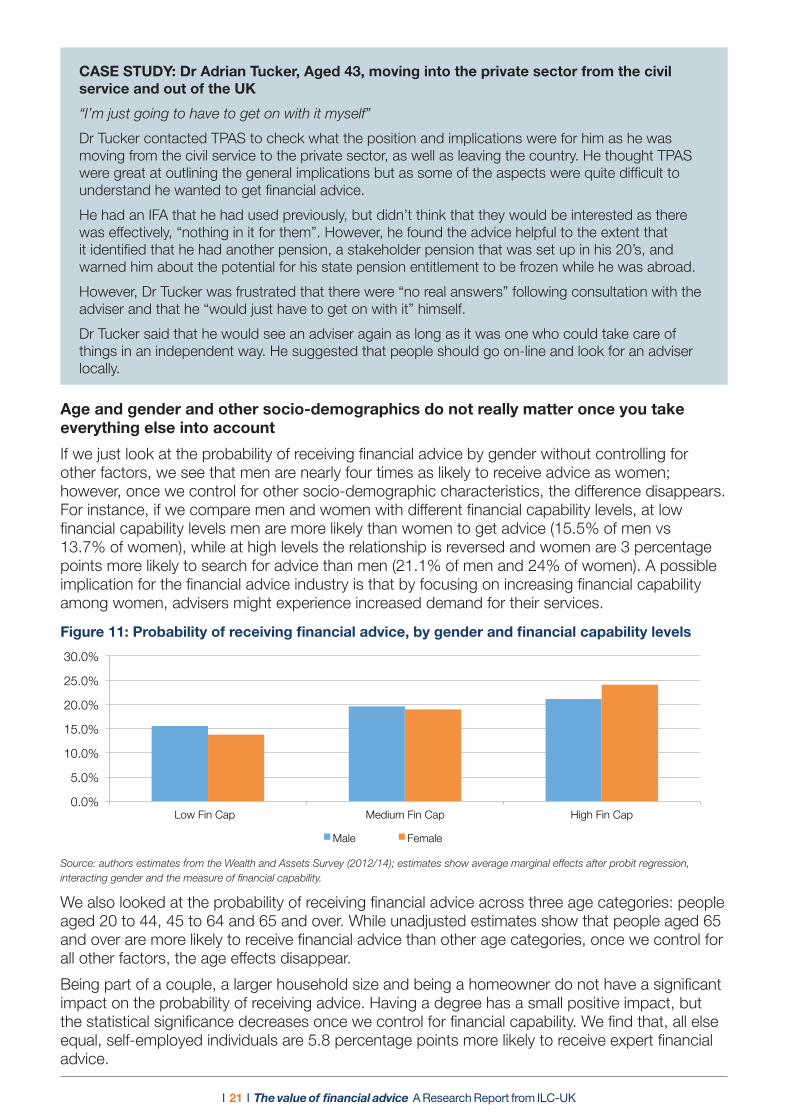
If we just look at the probability of receiving financial advice by gender without controlling for other factors, we see that men are nearly four times as likely to receive advice as women; however, once we control for other socio-demographic characteristics, the difference disappears. For instance, if we compare men and women with different financial capability levels, at low financial capability levels men are more likely than women to get advice (15.5% of men vs 13.7% of women), while at high levels the relationship is reversed and women are 3 percentage points more likely to search for advice than men (21.1% of men and 24% of women). A possible implication for the financial advice industry is that by focusing on increasing financial capability among women, advisers might experience increased demand for their services.
Figure 11: Probability of receiving financial advice, by gender and financial capability levels
22
Figure 11: Probability of receiving financial advice, by gender and financial capability levels
0.0%
5.0%
10.0%
15.0%
20.0%
25.0%
30.0%
Low Fin Cap Medium Fin Cap High Fin Cap
Male Female
Source: authors estimates from the Wealth and Assets Survey (2012/14); estimates show average marginal effects after probit regression, interacting gender and the measure of financial capability.
We also looked at the probability of receiving financial advice across three age categories: people aged 20 to 44, 45 to 64 and 65 and over. While unadjusted estimates show that people aged 65 and over are more likely to receive financial advice than other age categories, once we control for all other factors, the age effects disappear.
Being part of a couple, a larger household size and being a homeowner do not have a significant impact on the probability of receiving advice. Having a degree has a small positive impact, but the statistical significance decreases once we control for financial capability. We find that, all else equal, self-employed individuals are 5.8 percentage points more likely to receive expert financial advice.
I 22 I The value of financial advice A Research Report from ILC-UK
Focus box: Trust in the profession is also key
Among psychological attributes, trust is key in determining demand for advice. We explored whether people who claimed to trust IFAs or banks and other institutions to provide the best advice for retirement savings are in fact more likely to receive expert advice. Our findings reveal that, after controlling for all other socio-demographic characteristics, trust in IFAs is one of the strongest drivers of the demand for financial advice. After controlling for income, wealth and financial capability, the probability of receiving financial advice is 12.5 percentage points higher among people who say that they would trust an IFA than among who those that did not express such trust. By contrast, people who would trust banks and building societies are no more or less likely to receive advice than those who do not trust them.
Other psychological characteristics such as risk aversion or cautiousness have a weak negative association with the demand for financial advice.
Who acted on the recommendation received and bought a product?Four in five people (aged 20 and over and not yet in retirement) who received expert advice bought a product following the recommendation.
Higher income is associated with a higher probability of following the recommendation, while higher wealth has no impact. Even though being unemployed has no impact on the demand for advice, once unemployed people consult an adviser, they are more likely to act on it and buy the recommended product.
While people who trust IFAs are more likely to act on the recommendation and buy a product, people who stated they trust banks or building societies are 6.6 percentage points less likely to follow a recommendation if they see an adviser.
Even though people with higher levels of financial capability are more likely to receive financial advice, they are less likely to act on the advice than their less capable counterparts. A possible explanation is that while investors with high financial capability understand the value of consulting a professional adviser, they are also more likely to understand whether the product recommended is right for them.
What types of organisations provide advice and to whom?
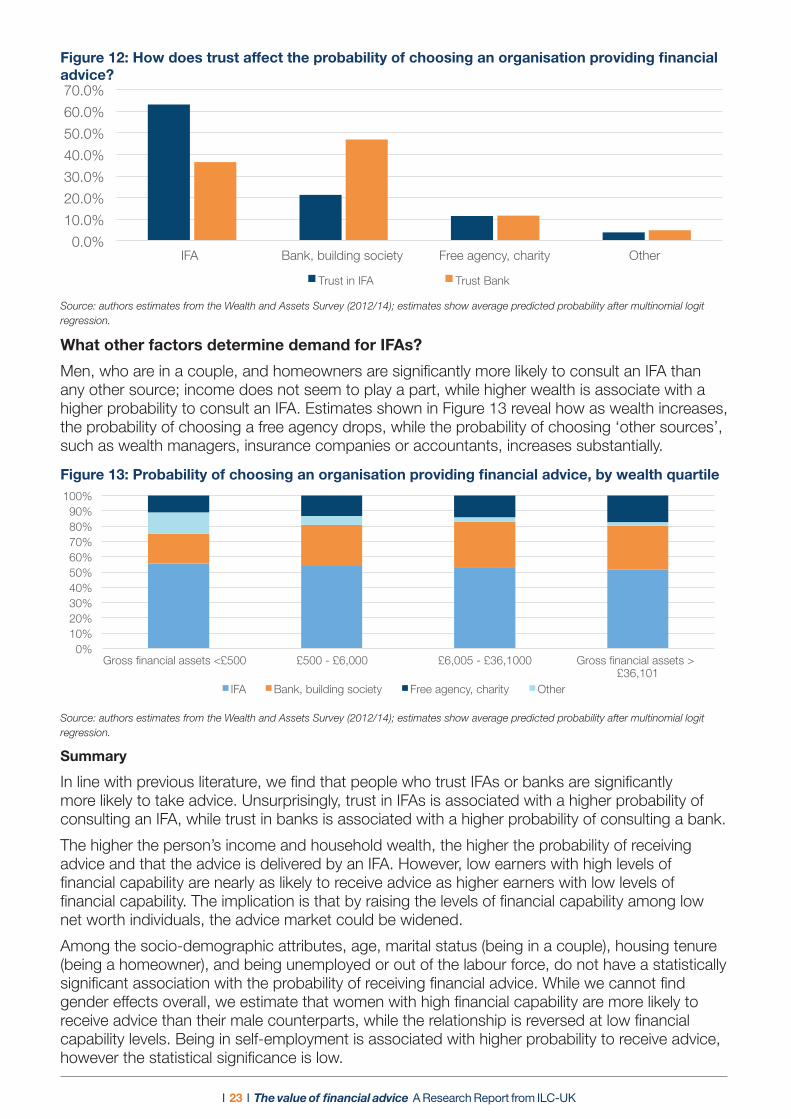
Over half of the people (63.2%) who received financial advice consulted an IFA, that is either a firm of financial advisers or a sole/self-employed adviser; approximately 28% consulted a bank or building society; 7% consulted a charity, union or free agency such as Money Advice Service, the Pension Service (now The Pensions Advisory Service) or Citizens Advice Bureau; the remaining 14.4% consulted other sources, such as an insurance company, a wealth manager, an accountant, a solicitor and other.
Unsurprisingly, people who trust IFAs are three times more likely to consult an IFA than a bank or building society, and significantly less likely to go to a free agency, while people who trust banks are 4 times more likely to consult a bank (Figure 12).
I 23 I The value of financial advice A Research Report from ILC-UK
Figure 12: How does trust affect the probability of choosing an organisation providing financial advice?
The Value of Advice
Figure 12: How does trust affect the probability of choosing an organisation providing financial advice?
Figure 13: Probability of choosing an organisation providing financial advice, by wealth quartile
0.0%
10.0%
20.0%
30.0%
40.0%
50.0%
60.0%
70.0%
IFA Bank, building society Free agency, charity Other
Trust in IFA Trust Bank
0% 10% 20% 30% 40% 50% 60% 70% 80% 90%
100%
Gross financial assets <£500 £500 - £6,000 £6,005 - £36,1000 Gross financial assets >£36,101
IFA Bank, building society Free agency, charity Other
Source: authors estimates from the Wealth and Assets Survey (2012/14); estimates show average predicted probability after multinomial logit regression.
What other factors determine demand for IFAs?
Men, who are in a couple, and homeowners are significantly more likely to consult an IFA than any other source; income does not seem to play a part, while higher wealth is associate with a higher probability to consult an IFA. Estimates shown in Figure 13 reveal how as wealth increases, the probability of choosing a free agency drops, while the probability of choosing ‘other sources’, such as wealth managers, insurance companies or accountants, increases substantially.
Figure 13: Probability of choosing an organisation providing financial advice, by wealth quartile
The Value of Advice
Figure 12: How does trust affect the probability of choosing an organisation providing financial advice?
Figure 13: Probability of choosing an organisation providing financial advice, by wealth quartile
0.0%
10.0%
20.0%
30.0%
40.0%
50.0%
60.0%
70.0%
IFA Bank, building society Free agency, charity Other
Trust in IFA Trust Bank
0% 10% 20% 30% 40% 50% 60% 70% 80% 90%
100%
Gross financial assets <£500 £500 - £6,000 £6,005 - £36,1000 Gross financial assets >£36,101
IFA Bank, building society Free agency, charity Other
Source: authors estimates from the Wealth and Assets Survey (2012/14); estimates show average predicted probability after multinomial logit regression.
Summary
In line with previous literature, we find that people who trust IFAs or banks are significantly more likely to take advice. Unsurprisingly, trust in IFAs is associated with a higher probability of consulting an IFA, while trust in banks is associated with a higher probability of consulting a bank.
The higher the person’s income and household wealth, the higher the probability of receiving advice and that the advice is delivered by an IFA. However, low earners with high levels of financial capability are nearly as likely to receive advice as higher earners with low levels of financial capability. The implication is that by raising the levels of financial capability among low net worth individuals, the advice market could be widened.
Among the socio-demographic attributes, age, marital status (being in a couple), housing tenure (being a homeowner), and being unemployed or out of the labour force, do not have a statistically significant association with the probability of receiving financial advice. While we cannot find gender effects overall, we estimate that women with high financial capability are more likely to receive advice than their male counterparts, while the relationship is reversed at low financial capability levels. Being in self-employment is associated with higher probability to receive advice, however the statistical significance is low.
I 24 I The value of fi nancial advice A Research Report from ILC-UK
Chapter 4. The medium-term economic impact of expert fi nancial advice
“It was actually valuable and helped in a wider context” – MH, exploring his options for an old DB scheme
Summary• Financial advice can have a positive impact on wealth accumulation through several channels:
advisers may help people with day-to-day money management (including tax planning), thus encouraging them to save more; they can recommend investing more aggressively, therefore encouraging ownership of stocks and shares, in accordance with each individual’s risk/return preferences; advisers can also suggest deferring retirement, especially when individuals have not accumulated suffi cient wealth to generate adequate retirement income. Advisers may also be important in ensuring that individuals choose the most appropriate retirement income product.
• In this section, we explore all of these channels, and we carry out an empirical analysis using the WAS (2006-2014) to assess the impact of receiving fi nancial advice on the following economic outcomes:
1. The probability of saving any income between 2012 and 2014;
2. The probability of owning assets such as shares in 2012 and 2014;
3. The probability of retiring before age 65;
4. The amount of fi nancial wealth accumulated by 2012-2014;
5. The amount of pension wealth accumulated by 2012-2014;
6. The impact on private pension income in 2012 and 2014.
Financial advice has a positive and statistically signifi cant impact on all the fi nancial outcomes.
• Receiving advice between 2001 and 2007 raises the probability of saving in 2012-14 by 8.6 percentage points (but with low statistical signifi cance) across the four consumer groups we considered for our analysis;
• Receiving fi nancial advice has a huge impact on investments, with the advised group 10.4 percentage points more likely to own equity assets, than those who did not take advice.
• In terms of liquid fi nancial wealth, we fi nd that receiving fi nancial advice between 2001 and 2007 led to approximately £13,435 in additional accumulated assets per household by 2012-14.
- The “affl uent but advised” group accumulated on average £12,363 (or 17%) more in liquid fi nancial assets than the equivalent non-advised group.
- The “just getting by” but advised group accumulated on average £14,036 (or 39%) more in liquid fi nancial assets than the equivalent non-advised group.
• Similarly, receiving fi nancial advice between 2001 and 2007 resulted in approximately £27,664 in additional pension wealth among the advised.
- The “affl uent but advised” group accumulated on average £30,882 (or 16%) more in pension wealth than the equivalent non-advised group.
- The “just getting by but advised” group accumulated on average £25,859 (or 21%) more in pension wealth than the equivalent non-advised group.
• We can quantify the overall value of receiving fi nancial advice in the period 2001-2007 as approximately £41,099 additional fi nancial and pension assets. Those who took advice have
I 25 I The value of financial advice A Research Report from ILC-UK
accumulated 20% more assets than those who have not taken advice.
• Receiving advice between 2001 and 2007 also had a positive impact on pension income, amounting to approximately £773 more per year.
- The “affluent but advised” group earn £880 (or 16%) more per year than the equivalent non-advised group.
- The “just getting by” group earn £713 (or 19%) more per year than the equivalent non-advised group.
• On aggregate we find that financial advice has added approximately £36.6 billion in financial assets and £75.4 billion in pension assets, reflecting a total of £112 billion in additional savings and investments. Financial advice also promoted £2.5 billion in additional annual income from occupational and/or private pensions.
About this chapter: How can we quantify the value of advice?The previous chapter explored how people receiving expert financial advice tend to have higher incomes, wealth and financial capability. However, we cannot say whether higher income and wealth lead to taking advice or whether taking advice leads to higher income and wealth. To assess whether or not paying for financial advice is economically viable, we need to understand if being advised causes an increase in income, wealth, or in general a higher standard of living.
Using a statistical technique ‘propensity score matching’ we’ve been able to mimic a natural sample and so ascribe any difference in mean outcome between the two groups – advised and non-advised.
Because we are interested in the medium to long term impact of receiving financial advice, we we assessed the impact of receiving advice between 2001 and 2007 on economic outcomes in 2012-14. The economic outcomes we are interested in are described below.
We focus on people aged 45 and over in 2006/07 (who will be aged 53 and over in 2012-14) to assess the impact of advice both on the accumulation and on the decumulation phase.
Describing the ‘advised’ and the ‘non advised’ groupWe identify people who received financial advice between 2001 and 2007 by exploiting the following question in the first wave of the WAS:
“In the last five years, have you received any professional advice about planning your personal finances? By that I mean things like planning for retirement, tax planning, or investing money. But please do not include any advice related to running a business or mortgages.”
According to our estimates, between 2001 and 2007, 32.5% of people aged 45 and over received professional financial advice. Among them, nearly 60% received advice from an Independent Financial Adviser, while 42% received advice from someone working for a bank or building society. 18
Approximately half of the people who answered the question on advice in 2007 were interviewed again in 2012/14, so we are left with a final sample of approximately 5,000 people.
We then estimate the probability of being advised given a set of socio-demographic characteristics to attain a propensity score; after estimating the propensity scores, we match a treated (advised) person with their counterfactual, which is a non-treated person with a similar propensity score as a treated person.
The socio-demographic characteristics included in our analysis to estimate the propensity scores are the same used to estimate the probability of receiving advice between 2012-14 reported in the previous chapter (but in this case they refer to the years 2006-08): gender (binary equal
18 The totals do not add up to 100 because people may have received advice from more than one source; for instance, nearly a quarter of those who took advice from someone working for a bank or building society also consulted an IFA.
I 26 I The value of financial advice A Research Report from ILC-UK
to 1 if the respondent is male); age categories; educational attainment; being part of a couple; household size; economic activity (employee, self-employed, unemployed and inactive); housing tenure (being a homeowner); a proxy for cautiousness (binary equal to 1 if the respondent agrees with the statement I always make sure I have money left at the end of the month); a proxy for risk aversion (respondents prefer a £1,000 today to a gamble with a 20% probability to win 10,000); and a past measure of the outcome to account for initial conditions, such as whether the respondent was able to save any income in 2006-08; their financial assets and pension wealth in that period (for a detailed definition of the variables, please see the Appendix A).19
The impact of financial advice on economic behaviours
We estimate the impact of financial advice on six different economic outcomes:
1. The probability of saving any income between 2012 and 2014;
2. The probability of owning equity assets, such as shares;
3. The probability of retiring before age 65 at different wealth levels;
4. The amount of financial wealth accumulated by 2012-2014, including current or saving account deposits, ISAs, fixed term investment bonds, corporate bonds, shares, national savings products and life insurance product;
5. The amount of pension wealth accumulated by 2012-2014; and finally
6. We look at the difference in private pension income, accounting for whether or not the person had contributed to an occupational pension scheme in 2006-08.
Focus box: A snapshot of economic behaviours in 2012-2014
• Between 2012 and 2014, only 56.8% of the people in our sample managed to save some of their income.
• Approximately 1 in 4 (24.8%) holds any equity assets, such as stocks, employee shares etc.
• Average financial wealth in 2012-14 is equal to approximately £54,234 (median £15,950).
• Average pension wealth amounts to approximately £161,248 (median £56,658).
• Average individual income from occupational pensions amounts to approximately £4,664 per annum (median £720).
How do we take care of self-selection when assessing the value of advice?To assess whether receiving financial advice between 2001 and 2007 had a positive impact on economic outcomes, we need to compare people who actually received advice, but also account for whether their socio-economic characteristics made them more likely to do so. To this end, we identify two groups based on the probability that they might have received advice: the ‘affluent’ group and the ‘just-getting-by’ group.
In the affluent group, we find people with a degree, those who are part of a couple, the self-employed, homeowners, people who managed to save in 2006-08 and those who have more wealth. In the just-getting-by group, we find people without educational qualification, single, divorced or widowed, employees, renters, and those with lower wealth in 2006-08.
19 We cannot include trust or financial capability because the information is not available in year 2007.

I 27 I The value of financial advice A Research Report from ILC-UK
We then combine the ‘affluent’ group and the ‘just-getting-by’ group with the advised and non-advised group to obtain the following four groups:
The four consumer groups
Affluent & Advised: People who have a high a priori probability to receive advice and have actually received it;
Affluent but non-advised: People who have a high a priori probability to receive advice but have not received it;
Just-getting-by, but advised: People who have a low a priori probability to receive advice, but have actually received it;
Just-getting-by & non-advised: People who have a low a priori probability to receive advice and have not received it.
To be noted that while values for the first and fourth group are observed, values for the second and third group are estimated using the matching technique.
Table 1:The value of advice in numbers
Probability of saving in 2012-14
Average financial assets (2012/14)
Average pension wealth (2012/14)
Occupation/private pension income
Probability of having risky assets
Bassline (all groups) 56.8% £54,224 £161,248 £4,664 24.8%
Affluent & advised 67.0% £86,949 £223,711 £6,395 39.1%
Affluent & non-advised 60.3% £74,586 £192,829 £5,515 29.3%
Average impact on the ‘affluent’ 6.7pp £12,363 £30,882 £880 9.7pp
in percentage terms 17% 16% 16%
Just getting & advised 60.8% £49,918 £151,685 £4,409 27.6%
Just getting & non-advised 51.1% £35,882 £125,826 £3,696 16.8%
Average impact on the ‘just getting by’ 9.7pp £14,036 £25,859 £713 £10.8pp
in percentage terms 39% 21% 19%
All advised 63.0% £63,218 £177,471 £5,121 31.8%
All non-advised 54.4% £49,794 £149,814 £4,348 21.3%
Average effect on all 8.6pp £13,435 £27,664 £773 10.4pp
Source: Author’s calculations from Wealth and Assets Survey (2006-08, 20012-14)
Impact of advice on the probability of saving any income Before adjusting for self-selection and other endogeneity issues, we find that the probability of being a saver is 15.9 percentage points higher for the advised group (67% vs. 51.1%). After accounting for endogeneity issues, we find that the impact of advice is smaller, but still positive. In particular, our analysis reveals that receiving advice between 2001 and 2007 raises the probability of saving in 2012-14 by 8.6 percentage points (but with low statistical significance) across our four groups; if we focus on the affluent group and calculate the difference in the probability of saving between those who actually received advice and those who didn’t, we find that the impact of receiving advice is slightly smaller, 6.7 percentage points, but highly statistically significant.
Impact of advice on the probability of holding equity assets Saving more of one’s income is not the only way to accumulate more assets; another option is to invest in stock and shares, which offer higher returns, albeit substantially higher risks.
Our findings reveal that people who took financial advice between 2001 and 2007 were
I 28 I The value of financial advice A Research Report from ILC-UK
10.4 percentage points more likely to own equity assets by 2012-14 than those who didn’t, and the impact is slightly larger (10.8 percentage points) for the “just getting by” group. Given that, overall, only 1 in 4 people aged 45 and over owns stocks, we can say that the impact of advice is large.
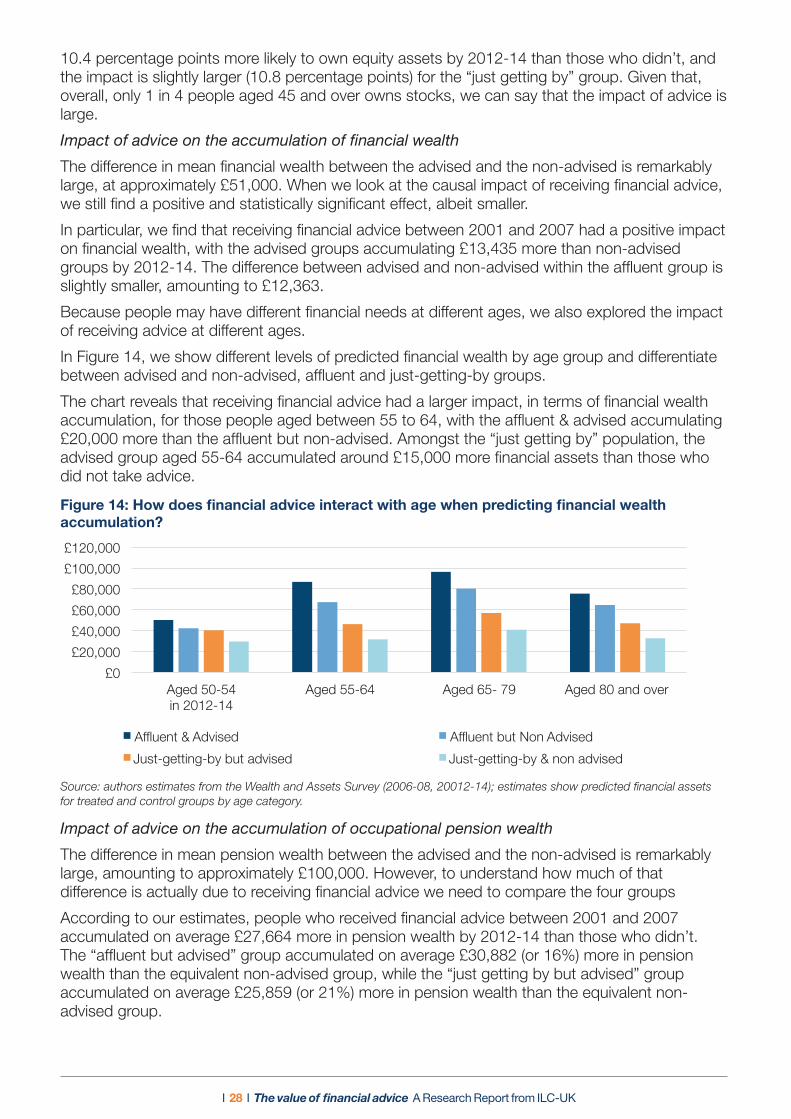
Impact of advice on the accumulation of financial wealthThe difference in mean financial wealth between the advised and the non-advised is remarkably large, at approximately £51,000. When we look at the causal impact of receiving financial advice, we still find a positive and statistically significant effect, albeit smaller.
In particular, we find that receiving financial advice between 2001 and 2007 had a positive impact on financial wealth, with the advised groups accumulating £13,435 more than non-advised groups by 2012-14. The difference between advised and non-advised within the affluent group is slightly smaller, amounting to £12,363.
Because people may have different financial needs at different ages, we also explored the impact of receiving advice at different ages.
In Figure 14, we show different levels of predicted financial wealth by age group and differentiate between advised and non-advised, affluent and just-getting-by groups.
The chart reveals that receiving financial advice had a larger impact, in terms of financial wealth accumulation, for those people aged between 55 to 64, with the affluent & advised accumulating £20,000 more than the affluent but non-advised. Amongst the “just getting by” population, the advised group aged 55-64 accumulated around £15,000 more financial assets than those who did not take advice.
Figure 14: How does financial advice interact with age when predicting financial wealth accumulation?
£0
£20,000
£40,000
£60,000
£80,000
£100,000
£120,000
Aged 50-54 in 2012-14
Aged 55-64 Aged 65- 79 Aged 80 and over
Financial wealth in 2012-14
Affluent & Advised Affluent but Non Advised
Just-getting-by but advised Just-getting-by & non advised
Source: authors estimates from the Wealth and Assets Survey (2006-08, 20012-14); estimates show predicted financial assets for treated and control groups by age category.
Impact of advice on the accumulation of occupational pension wealthThe difference in mean pension wealth between the advised and the non-advised is remarkably large, amounting to approximately £100,000. However, to understand how much of that difference is actually due to receiving financial advice we need to compare the four groups
According to our estimates, people who received financial advice between 2001 and 2007 accumulated on average £27,664 more in pension wealth by 2012-14 than those who didn’t. The “affluent but advised” group accumulated on average £30,882 (or 16%) more in pension wealth than the equivalent non-advised group, while the “just getting by but advised” group accumulated on average £25,859 (or 21%) more in pension wealth than the equivalent non-advised group.

I 29 I The value of financial advice A Research Report from ILC-UK
Differences by ageWhen differentiating the impact of financial advice across age categories, we find that the impact of receiving advice is already visible at younger ages, with people in their early fifties accumulating substantially more if they had received financial advice. In addition, while pension wealth predictably declines with age, even by age 80+, the advised can count on an additional £17,580 (or £23,600 for the affluent group).
Figure 15: How does financial advice interact with age when predicting pension wealth accumulation?
£0
£100,000
£200,000
£300,000
Aged 50-54 in 2012-14
Aged 55-64 Aged 65- 79 Aged 80 and over
Pension wealth in 2012-14
Affluent & Advised Affluent but Non Advised Just-getting-by but advised Just-getting-by & non advised
Source: authors estimates from the Wealth and Assets Survey (2006-08, 20012-14); estimates show predicted financial assets for treated and control groups by age category.
CASE STUDY: Ewan Moore, sought tax advice around pensions
“Pensions are so scary. There are tax loopholes that make things even more complicated”Mr Moore is a chartered accountant who thought that sorting out his pension would not be so complicated. He became quite demotivated and nearly gave up, but contacted TPAS to check that his understanding was correct and to provide some comfort.
After speaking with TPAS, he shopped around on the internet for an adviser and established that the typical cost for advice was around £3k. He was looking to have “someone on my side who was impartial”.
“Pensions are so scary. There are tax loopholes that make things even more complicated e.g. MPAA and LTA and then there is tax that may be recovered. The position needs to be more transparent.I don’t understand how other people are able to do it.”
Mr Moore used a financial adviser who was very helpful and resolved his tax issue. He just spoke to the adviser for which there was no charge which he thought was “good value”.
To actually sort it out just took an afternoon but there were weeks of frustration leading up to that point.
“People don’t really want to sort their finances and engagement is so poor. The possibility that there may not be a State Pension in the future and the tax advantages do not strike home. Constant rumours of changes to pensions or retrospective changes do not help.”
Impact of advice on the probability of deferring retirement/retiring early We estimated whether taking financial advice between 2001 and 2007 had an impact on the probability of early retirement, but could not find any significant differences among groups. We then tested for differences across the financial and pension wealth spectrum, assuming that people who have accumulated less may be discouraged from early retirement by their adviser, but again could not find any evidence.
This is not to say that an adviser would not discourage early retirement among people who have accumulated less, but because of data limitations and a very small sample size, we could not find any conclusive evidence.
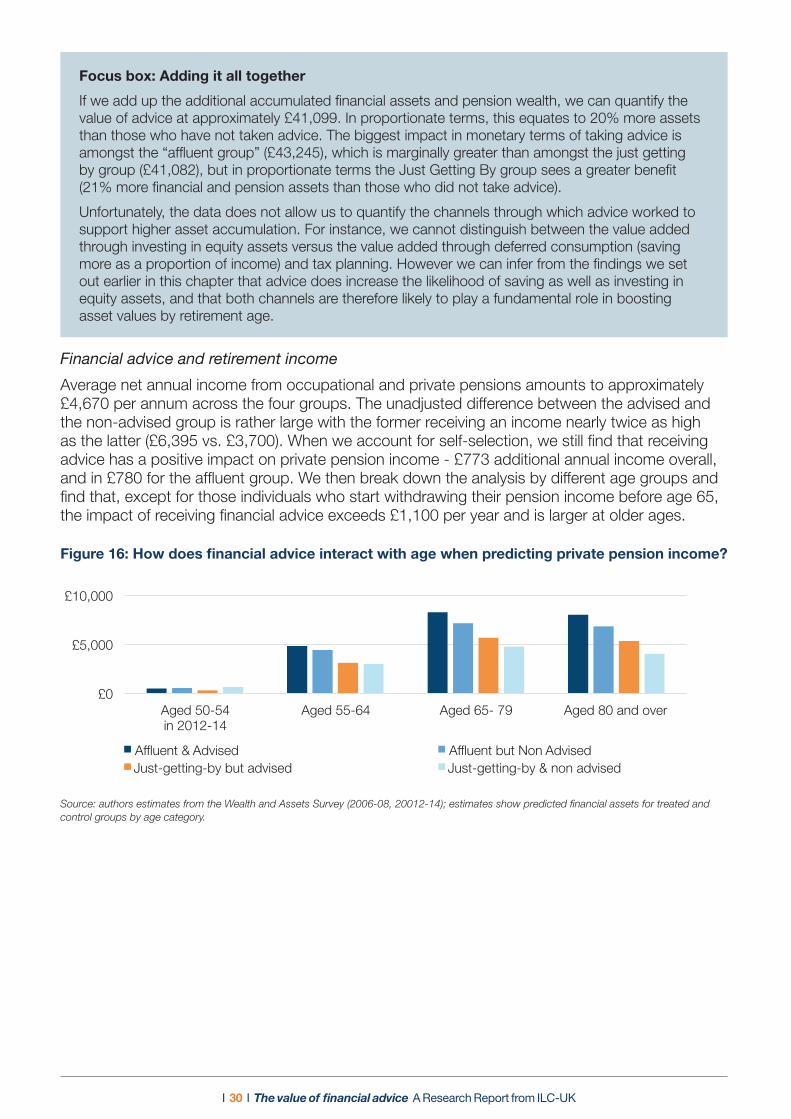
I 30 I The value of financial advice A Research Report from ILC-UK
Focus box: Adding it all together
If we add up the additional accumulated financial assets and pension wealth, we can quantify the value of advice at approximately £41,099. In proportionate terms, this equates to 20% more assets than those who have not taken advice. The biggest impact in monetary terms of taking advice is amongst the “affluent group” (£43,245), which is marginally greater than amongst the just getting by group (£41,082), but in proportionate terms the Just Getting By group sees a greater benefit (21% more financial and pension assets than those who did not take advice).
Unfortunately, the data does not allow us to quantify the channels through which advice worked to support higher asset accumulation. For instance, we cannot distinguish between the value added through investing in equity assets versus the value added through deferred consumption (saving more as a proportion of income) and tax planning. However we can infer from the findings we set out earlier in this chapter that advice does increase the likelihood of saving as well as investing in equity assets, and that both channels are therefore likely to play a fundamental role in boosting asset values by retirement age.
Financial advice and retirement income Average net annual income from occupational and private pensions amounts to approximately £4,670 per annum across the four groups. The unadjusted difference between the advised and the non-advised group is rather large with the former receiving an income nearly twice as high as the latter (£6,395 vs. £3,700). When we account for self-selection, we still find that receiving advice has a positive impact on private pension income - £773 additional annual income overall, and in £780 for the affluent group. We then break down the analysis by different age groups and find that, except for those individuals who start withdrawing their pension income before age 65, the impact of receiving financial advice exceeds £1,100 per year and is larger at older ages.
Figure 16: How does financial advice interact with age when predicting private pension income?
£0
£5,000
£10,000
Aged 50-54 in 2012-14
Aged 55-64 Aged 65- 79 Aged 80 and over
Individual income from occupational pensions
Affluent & Advised Affluent but Non Advised Just-getting-by but advised Just-getting-by & non advised
Source: authors estimates from the Wealth and Assets Survey (2006-08, 20012-14); estimates show predicted financial assets for treated and control groups by age category.
I 31 I The value of financial advice A Research Report from ILC-UK
CASE STUDY: Mr Bonnett, late 50s, exploring retirement options
“This was the most important decision I will make. I will not receive the state pension until I’m 66 and that is a few years to go yet.”
Mr Bonnett contacted TPAS in order to explore his retirement options. In particular, he wanted to know whether to take early retirement and go into income drawdown and what level of drawdown income to take.
Mr Bonnett had heard about TPAS in the media and they popped up on his internet search engine, while social media and radio advertisements were promoting the need for independent financial advice. After checking with TPAS on the need for advice, Mr Bonnet eventually found an adviser he felt he could trust through Nottingham Building Society. The adviser discussed Mr Bonnett’s retirement options which included exploring his savings and outgoings and other available retirement income sources. On the basis of the advice received, Mr Bonnett decided to take a guaranteed income each month rather than going into drawdown - “looking at the numbers really helped“.
Mr Bonnett was pleased he used an adviser and is continuing to use them for an annual review of his financial position and available options
Quantifying the aggregate contribution of financial advice to asset accumulationTo quantify the value of advice at the aggregate level, we can simply multiply the average financial gain from receiving advice by the number of people who received advice between 2001 and 2007. We estimate that 20.8% of people aged 45+ who were not retired received advice between 2001 and 2007, which represents 2.7 million people. We estimate that, among these people, financial advice has added approximately £36.6 billion in financial assets and £75.4 billion in pension assets, reflecting a total of £112 billion in additional savings and investments. Financial advice also promoted £2.5 billion in additional annual income from occupational and/or private pensions. Furthermore, financial advisers have encouraged an additional 235,000 people to save some of their income and approximately 284,000 to invest in the stock market.
What about the overall impact on the economy?In the short run, saving more may limit economic growth by reducing consumption expenditure. However, in the long run, increased savings can act to drive up the level of output in the economy through increased investment. But this is only the case if those additional savings are channelled into productive areas of the economy. The problem in recent years – both at home and abroad – has been a general failure to invest savings in this way, with households keen to keep their money in liquid savings and current accounts, banks keen to build up their capital reserves, and UK investment funds shifting their asset base away from equity investments (see Figure 17). This report has shown that advice results in increased investment in equity assets, implying that financial advisers may help to support long term investment in the UK economy, as well as grow the size of their client’s assets. However, measuring the extent to which financial advice has supported investment and economic growth in this regard, is beyond the scope of this report.
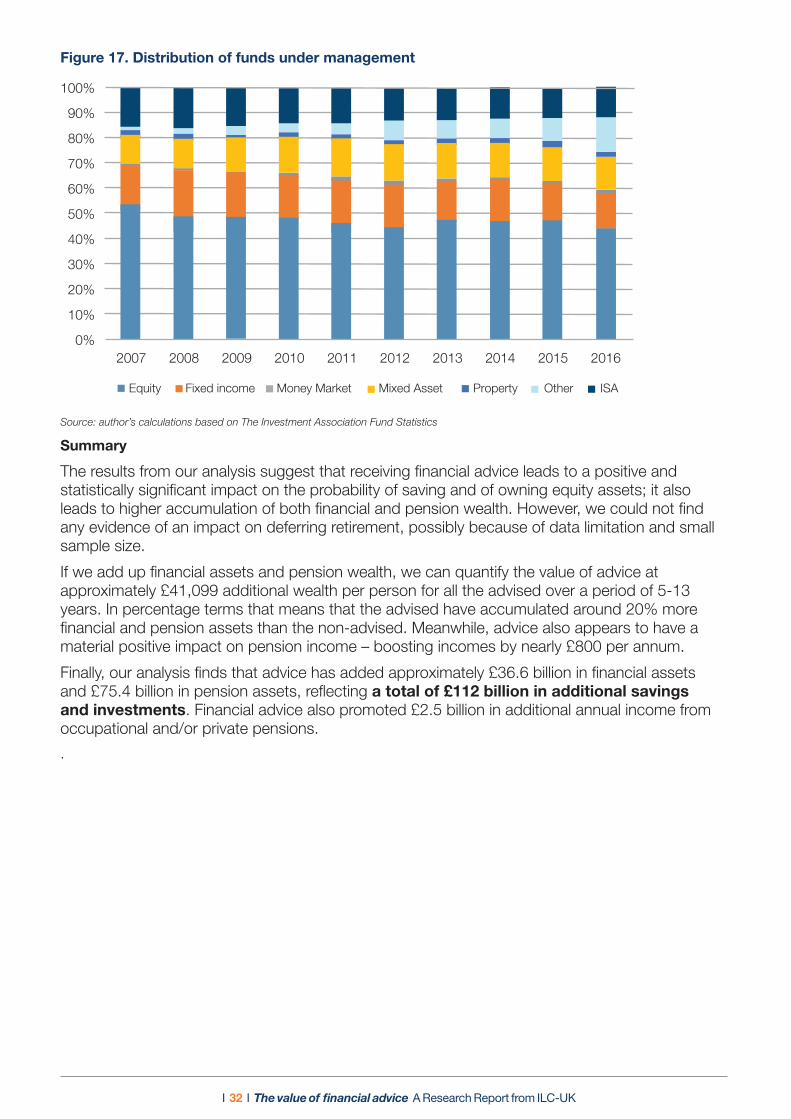
I 32 I The value of financial advice A Research Report from ILC-UK
Figure 17. Distribution of funds under management
Figure 17. Distribution of funds under management
2007 2008 2009 2010 2011 2012 2013 2014 2015 2016
100%
0%
10%
20%
30%
40%
50%
60%
70%
80%
90%
Equity Fixed income Money Market Mixed Asset Property Other ISA
Source: author’s calculations based on The Investment Association Fund Statistics
Summary
The results from our analysis suggest that receiving financial advice leads to a positive and statistically significant impact on the probability of saving and of owning equity assets; it also leads to higher accumulation of both financial and pension wealth. However, we could not find any evidence of an impact on deferring retirement, possibly because of data limitation and small sample size.
If we add up financial assets and pension wealth, we can quantify the value of advice at approximately £41,099 additional wealth per person for all the advised over a period of 5-13 years. In percentage terms that means that the advised have accumulated around 20% more financial and pension assets than the non-advised. Meanwhile, advice also appears to have a material positive impact on pension income – boosting incomes by nearly £800 per annum.
Finally, our analysis finds that advice has added approximately £36.6 billion in financial assets and £75.4 billion in pension assets, reflecting a total of £112 billion in additional savings and investments. Financial advice also promoted £2.5 billion in additional annual income from occupational and/or private pensions.
.
I 33 I The value of fi nancial advice A Research Report from ILC-UK
Chapter 5. Conclusions and recommendations
“Good advice is out there but you must dig for it” – SL, moving employer and wanted advice on what to do with his pension pots
This report has demonstrated the very real value of advice for the consumer. Using robust statistical methods to control for a range of factors likely to determine demand for advice – including income, wealth and behavioural traits - our results show that those who take advice are likely to accumulate more fi nancial and pension wealth, supported by increased saving and investing in equity assets, while those in retirement are likely to have more income, particularly at older ages. Our results therefore demonstrate, in a statistically robust way, the importance of fi nancial advisers in delivering true value for their customers. For those who use advisers, this is unlikely to come as a surprise. Our research found high levels of trust and satisfaction amongst those who use fi nancial advice, and a general reluctance to seek a second opinion on the advice received, which is perhaps symptomatic of customers being pleased with their adviser’s service.
But the advice market is not working for everyone. A high proportion of people who take out investments and pensions do not use fi nancial advice, while only a minority of the population has seen a fi nancial adviser. Since fi nancial advice has clear benefi ts for its customers, it is a shame that more people do not use it.
The clear challenge facing the industry and government is to get more people through the “front door” in the fi rst place. In this context, our research revealed a number of critical factors that may help to support increased demand for advice. After controlling for a range of factors, the two most powerful driving forces of whether people received advice was whether the individual trusts an IFA to provide advice and the individual’s level of fi nancial capability. Raising trust and confi dence in the industry and boosting overall levels of fi nancial capability will therefore be important in generating greater demand for advice.
Are there potential game-changers for the advice market?
Discussions about breaking down barriers to fi nancial advice tend to centre around questions of trust and fi nancial capability. These are generally seen as slow-burn issues – ones that will take a number of years, perhaps decades, to overcome. But what if there were opportunities in the short to medium term to drive increased demand for advice due to policy change or new technology.
1. Automatic enrolment and the role of employers
The advent of automatic enrolment has seen close to 8 million people enrolled into defi ned contribution occupational pension schemes. If anything is a game changer, then this is it. The initiative was designed to harness individual inertia – people do not have to do anything to start saving, then their savings are invested in a diversifi ed default fund which shifts asset accumulation during the lifecycle. While the reforms were designed to harness inertia, they may ultimately help prompt some people into action regarding their fi nances. As pension pots grow, consumers are likely to take more of an interest in their savings, since the choices they make regarding the pot will have an increasingly discernible impact on their overall fi nancial situation. Some of these individuals may therefore seek fi nancial advice without any prompting from others to do so. Others, meanwhile, may want to go it alone, or not sure where to go, will turn to online tools and family and friends for advice.
In this context, it seems to us that the employer has an important duty to ensure their employee is able to access to the best information and advice regarding their pension savings (and general fi nancial position). They should be willing and able to guide employees towards local expert fi nancial advice – indeed some business already do this. This is not an overly onerous or costly task for employers and is consistent with the duty of care they must have for all members of staff.
I 34 I The value of financial advice A Research Report from ILC-UK
Government, industry and professional bodies should explore ways to ensure that all employers understand their role in this regard, and are able to give support to their employees on what financial advice is available should they need it. Such support might be triggered, either by the employee seeking advice, or by the employer once individuals have savings pots over a certain size.
2. Pension freedoms and guidance
Since 2015, savers with defined contribution pension pots and some with defined benefit pensions have been given much more freedom to do what they like with the money they have saved. While in the past, individuals with DC pots may have annuitised, they now have many options including income drawdown, taking it all out as cash and spending it or adding it to their savings account. Increased freedom may therefore prompt individuals to make a decision as to what they would like to do with their savings as they reach pensionable age. However, given the lack of knowledge that many are likely to have regarding their pension savings and their options, a pensions guidance service was established which offers phone; face to face and online support. These services provide guidance and information about the options that people have but fall short of advice because they do not give recommendations on products. The very act of going through the guidance process is likely to boost the financial capability of consumers and may help to raise awareness of financial advice at this critical juncture in their lives. Pension freedoms combined with guidance may therefore prompt consumers to seek financial advice in ways that they would not have done in the past. However, there is one important stumbling block - a significant proportion of people who are eligible for the Pension Wise service are not using it20. This is despite the service being free and financial services firms signposting it to those customers who might benefit from it.
In the absence of a strong default decumulation product – which seems a relatively long way off and would not be optimal for some savers - guidance and advice are critical for consumers to make informed financial decisions. In this respect, we would echo the views of others across industry, that default guidance may be an appropriate strategy to ensure that people get the information they need in a complex marketplace. This means that consumers would have to consciously opt out of guidance before they can access their pension pot. This is still within the spirit of the original reforms, since it falls short of compulsion and the process of opting out should be made simple enough for the consumer. But it provides an extra safeguard against making the worst decisions, should drive more people towards the guidance service and raise levels of take-up in financial advice which, as this report has shown, provides added value to the consumer.
3. The pensions dashboard
In March 2017, insurance providers unveiled a prototype of the pensions dashboard, which is designed to show savers all their pension pots in one place, with a view to fully rolling it out in 2019. Clearly it is early days for this initiative, so it is difficult to draw too many conclusions about its likely overall impact on the financial services sector, but this is a move in the right direction which should, if done well, help consumers understand their personal financial situation. As such it may help to drive up the level of financial capability amongst pension savers and enable them to make more informed choices. Indeed, if we can get to a place where people check their pension savings on a six monthly basis this would represent a real step forward in financial planning
21. But there remain big challenges about the ease with which people will be able to access the dashboard and ensuring up to date, accurate information. Both of these issues will be crucial if the dashboard is to work effectively, but the early signs are positive.
20 Data on use is only released on an ad-hoc basis but there have been a number of reports discussing low take-up of the services since Pension Wise was introduced.21Money Advice Service research shows that 65% of people check their bank balance at least once a week. https://www.moneyadviceservice.org.uk/blog/when-did-you-last-check-your-bank-balance
I 35 I The value of financial advice A Research Report from ILC-UK
4.Technology and roboadvice
The kind of financial advice explored in this report is largely independent financial advice. That is where an adviser gives specific recommendations on products and services for a given individual’s financial planning needs. It is, broadly speaking, this type of advice which is linked to improved financial outcomes for consumers. In this context, the use of technology and roboadvice may be relevant in two ways to support better consumer outcomes and drive up demand. First, it may improve the quality of that advice. For instance, if an adviser can immediately see all of his/her customer’s wealth and assets in one place at the click of a button, it allows the adviser to spend more time on actually advising about options and providing an informed recommendation.
Similarly, there are an increasing number of online tools being used by the adviser community at home and abroad that can helpfully illustrate the impact of different investment decisions for consumers over their lifecycle. For instance, such tools might help someone understand what deferring retirement for an extra two years might mean, or what investing in investments with higher risk during working life might mean for their potential income in retirement. By simply adjusting a dial on a computer screen, there are models of roboadvice being used in conjunction with full independent financial advice that could help consumers make better sense of their investment choices. Each of these developments may help to increase the quality of advice – though few roboadvice models have been properly evaluated to see if they really do result in better consumer outcomes.
Secondly, while roboadvice might require an initial investment by an adviser, it may in the long run, help to drive up demand for their services by reducing the amount of time required for each client and therefore lowering the overall unit costs of providing advice. For instance, if advisers could quickly access the wealth and asset profile of customers through a computer screen, this would reduce the time needed to “fact find” at the beginning of an advice process. Again though, we do not have good evidence on whether this is actually happening, or whether, in actual fact, customers have to pay more for advice in conjunction with robots because it constitutes an enhanced service. But this should not deter the industry from exploring ways to harness technology and innovation, particularly if it can improve the quality of the financial advice service and ultimately drive down the costs for consumers.
5. Providing financial incentives for advice
The Pension Advice Allowance enables people to withdraw £500 on up to three occasions (£1,500 in total) from their pension pots tax-free to put towards the cost of pensions and retirement advice. Individuals can do this at any time in their life and can be redeemed against the cost of regulated financial advice, including ‘robo advice’ as well as traditional face-to-face advice. While making withdrawals for advice tax-free is an interesting move, it is debatable whether it will have any significant impact on take-up of advice. This report has demonstrated how wealth, trust in advisers and financial capability act as the critical motivators for taking advice so offering a relatively modest financial incentive for advice - which individuals will still have to pay for out of their pension assets - is unlikely to make much of a difference. Younger and middle aged individuals with modest pension assets may be better off keeping the £1,500 invested over the long term to ensure they fully benefit from the effects of compound interest. Perhaps a better way of ensuring greater interaction with advisers, would be for employers to facilitate free consultations with trusted advisers – particularly for their employees who are close to retirement – as a clear employee benefit.
I 36 I The value of financial advice A Research Report from ILC-UK
6. The value pitch
This report has demonstrated the real value add of financial advice – in terms of greater asset accumulation during working life and increased income in retirement. Since those who receive advice accumulate more assets and have more retirement income than those who don’t, this shows that advisers are good value for money – the benefits of advice outweigh any costs associated with it. Advisers must not shy away from this critical point. Yes they will charge for advice, but this is likely to result in better financial outcomes for individuals in the medium to long run. Advisers must actively sell this added value when pitching their services to prospective clients. Once customers realise that the benefits are likely to outweigh the costs, then advice will no longer be seen as expensive. This is a critical challenge for the advice sector, which pre-RDR earned money via commission and therefore the cost of advice was far less transparent. Post RDR people now understand what taking advice will cost them, but many of those who fail to take advice are unlikely to know what the likely financial rewards are. It is up to the advice sector to convince them.
Addressing long term challenges to raise demand
7. Raising trust in financial advice
Raising general levels of trust in financial advice will be dependent on a number of different interlinked issues. First, there is the perceived professionalism of the financial advice sector itself. The level of professionalism in the sector has undergone a transformation in recent times through the Retail Distribution Review which enforced higher qualifications for advisers and banned payment via commission. This may help to engender greater public trust and confidence, assuming of course that the public understand the step-change that has occurred across the industry. But perhaps the industry can go further. Indeed, an increasing number of advisers hold chartered status – akin to qualifications attained in the accountancy and other professions – in order to demonstrate their level of skill and expertise. It will be important that such initiatives are supported and well publicised in order for the public to understand why going to a financial adviser might be beneficial over other sources of advice – such as friends and family or the internet.
Second, and much harder to address, is that the level of trust in financial advice will be dependent on how consumers view financial intermediation in general. This is not just about the quality and delivery of financial advice but other forms of advice and guidance including their experiences with mortgage brokers, insurance intermediaries and their high-street bank. Since financial advice is unlikely to be the first form of financial intermediation that many customers interact with, it is crucial that their experiences with other forms of intermediation are also positive. In this regard, a cultural shift across the retail financial services sector to put consumers first will be necessary in order to support increased trust and therefore drive up demand for expert financial advice. Unfortunately, trust in the financial services sector remains at a low ebb. According to Edleman’s trust barometer it is one of the least trusted sectors of the UK economy - albeit levels have risen in the last few years. Industry-wide initiatives to grow trust will therefore be important, but it is likely to take time to grow public confidence with the financial crisis still lingering in the memory. Indeed, globally, financial services is one of the least trusted industries22. The financial services sector should actively publicise examples of good practise happening across the sector, while continuing to try and improve the overall customer experience.
22 See; http://www.edelman.com/insights/intellectual-property/2016-edelman-trust-barometer/state-of-trust/trust-in-financial-services-trust-rebound/
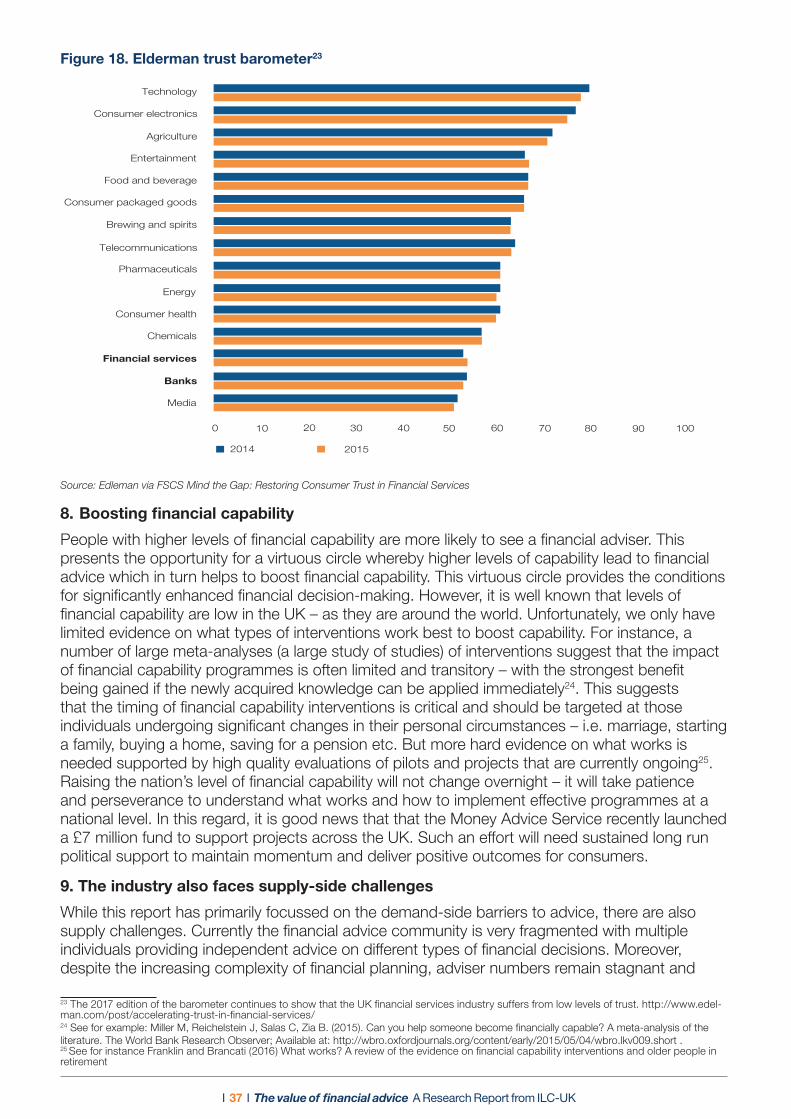
I 37 I The value of fi nancial advice A Research Report from ILC-UK
Figure 18. Elderman trust barometer23
Consumer electronics
Technology
Agriculture
Entertainment
Consumer packaged goods
Brewing and spirits
Telecommunications
Pharmaceuticals
Energy
Consumer health
Chemicals
Financial services
Media
0 10
20152014
20 30 40 50 60 70 80 90 100
Banks
Food and beverage
Source: Edleman via FSCS Mind the Gap: Restoring Consumer Trust in Financial Services
8. Boosting fi nancial capability
People with higher levels of fi nancial capability are more likely to see a fi nancial adviser. This presents the opportunity for a virtuous circle whereby higher levels of capability lead to fi nancial advice which in turn helps to boost fi nancial capability. This virtuous circle provides the conditions for signifi cantly enhanced fi nancial decision-making. However, it is well known that levels of fi nancial capability are low in the UK – as they are around the world. Unfortunately, we only have limited evidence on what types of interventions work best to boost capability. For instance, a number of large meta-analyses (a large study of studies) of interventions suggest that the impact of fi nancial capability programmes is often limited and transitory – with the strongest benefi t being gained if the newly acquired knowledge can be applied immediately24. This suggests that the timing of fi nancial capability interventions is critical and should be targeted at those individuals undergoing signifi cant changes in their personal circumstances – i.e. marriage, starting a family, buying a home, saving for a pension etc. But more hard evidence on what works is needed supported by high quality evaluations of pilots and projects that are currently ongoing25. Raising the nation’s level of fi nancial capability will not change overnight – it will take patience and perseverance to understand what works and how to implement effective programmes at a national level. In this regard, it is good news that that the Money Advice Service recently launched a £7 million fund to support projects across the UK. Such an effort will need sustained long run political support to maintain momentum and deliver positive outcomes for consumers.
9. The industry also faces supply-side challenges
While this report has primarily focussed on the demand-side barriers to advice, there are also supply challenges. Currently the fi nancial advice community is very fragmented with multiple individuals providing independent advice on different types of fi nancial decisions. Moreover, despite the increasing complexity of fi nancial planning, adviser numbers remain stagnant and
23 The 2017 edition of the barometer continues to show that the UK fi nancial services industry suffers from low levels of trust. http://www.edel-man.com/post/accelerating-trust-in-fi nancial-services/24 See for example: Miller M, Reichelstein J, Salas C, Zia B. (2015). Can you help someone become fi nancially capable? A meta-analysis of the literature. The World Bank Research Observer; Available at: http://wbro.oxfordjournals.org/content/early/2015/05/04/wbro.lkv009.short .25 See for instance Franklin and Brancati (2016) What works? A review of the evidence on fi nancial capability interventions and older people in retirement

I 38 I The value of financial advice A Research Report from ILC-UK
have actually fallen over the medium term. In 2009, there were 27,080 advisers, but by 2015 this had fallen to 23,86426. Meanwhile many firms of advisers are relatively small, averaging between 4 to 5 advisers per firm27. Clearly then, there may be a problem in meeting consumer demand should we be successful in addressing the demand-side barriers to advice noted in this report. And, perhaps more significant, the lack of supply may in itself be restricting access to advice by helping to keep the costs of providing advice high. While addressing the supply-side challenge is largely beyond the scope of this report, it may be worth investigating the scope for increased economies of scale across the sector through greater collaboration or even consolidation of services. Beyond that, there needs to be a continual drive to foster and grow talent across the sector – supporting intelligent school leavers, university graduates, and experienced professionals make the leap into financial advice just as they might into the accountancy or law professions. Natural attrition of advisers and the Retail Distribution Review may have contributed to a fall in adviser numbers in the last decade, so the sector needs to take considerable effort to retain and attract talent in order to meet the needs of the customers it serves.
26 APFA (2015), The Financial Adviser Market: In Numbers: http://www.apfa.net/documents/publications/financial-adviser-market/apfa-the-fi-nancial-adviser-market-in-numbers-v4.0.pdf 27 IBID
I 39 I The value of fi nancial advice A Research Report from ILC-UK
References
APFA (2015). The Financial Adviser Market: In Numbers; Edition 3.0
Bhattacharya, U., Hackethal, A., Kaesler, S., Loos, B., Meyer, S. (2012). “Is Unbiased Financial Advice To Retail Investors Suffi cient? Answers from a Large Field Study,” Review of Financial Studies 25(4):975-1032.
Brown, A. and Rice, B. (2012). The RDR and MiFID II: all change again for fi nancial advisers? Butterworths Journal of International Banking and Financial Law
Bucher-Koenen, T., Koenen, J. (2010). Do Seemingly Smarter Consumers Get Better Advice?, Max Planck Institute for Social Law and Social Policy Discussion Paper No. 01-2015.
Calcagno, R., Monticone, C. (2015). Financial literacy and the demand for fi nancial advice, Journal of Banking and Finance, 50: 363-380
Chalmers, J., Reuter, J. (2013). What is the Impact of Financial Advisers on Retirement Portfolio Choices and Outcomes?
Clare, A., Thomas, S. Walgama, O., Makris, C. (2013). Challenge and opportunity. The impact of the RDR on the UK’s market for fi nancial advice, Cass Business School
HM Treasury and FCA, Financial Advice Market Review, Final Report. March 2016Hung, A.A. and J.K. Yoong, 2010, “Asking for Help: Survey and Experimental Evidence on Financial Advice and Behavior Change,” RAND Center for Labor and Population Working PaperInderst, R. and M. Ottaviani (2009). Misselling through agents. American Economic Review 99, 883.908.
Inderst, R. and M. Ottaviani (2011). Competition through commissions and kickbacks. American Economic Review 102(2), 780.809.
Lusardi, A., Mitchell, O. (2006). Financial Literacy and Retirement Preparedness: Evidence and Implications for Financial Education, Michigan Retirement Research CenterLusardi, A., Mitchell, O. (2007). Baby Boomer retirement security: The roles of planning, fi nancial literacy, and housing wealth, Journal of Monetary Economics, 54: 205-224.
OECD Pensions Outlook, 2016
Thaler, Richard H., and Cass R. Sunstein. (2010). Nudge: Improving Decisions about Health, Wealth, and Happiness. New Haven: Yale University Press.
Willis, L. (2008). Against Financial Literacy Education. Iowa Law Review, Vol. 94, 2008
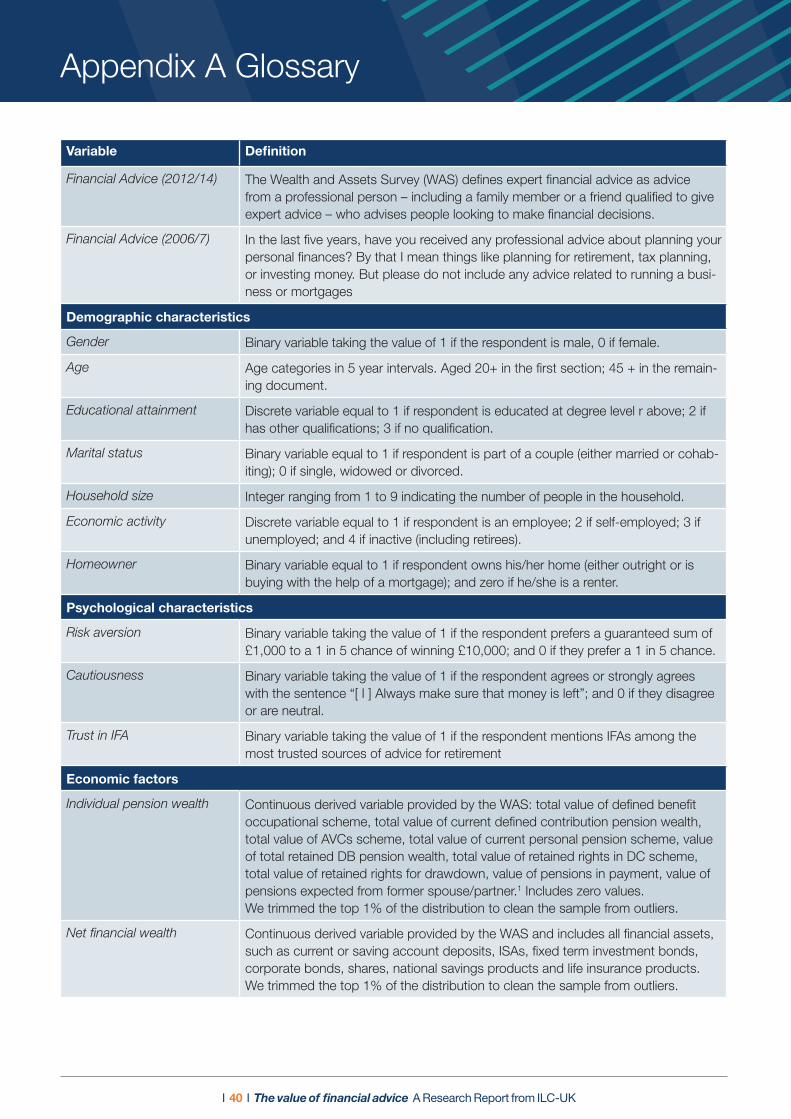
I 40 I The value of fi nancial advice A Research Report from ILC-UK
Appendix A Glossary
Variable Defi nition
Financial Advice (2012/14) The Wealth and Assets Survey (WAS) defi nes expert fi nancial advice as advice from a professional person – including a family member or a friend qualifi ed to give expert advice – who advises people looking to make fi nancial decisions.
Financial Advice (2006/7) In the last fi ve years, have you received any professional advice about planning your personal fi nances? By that I mean things like planning for retirement, tax planning, or investing money. But please do not include any advice related to running a busi-ness or mortgages
Demographic characteristics
Gender Binary variable taking the value of 1 if the respondent is male, 0 if female.
Age Age categories in 5 year intervals. Aged 20+ in the fi rst section; 45 + in the remain-ing document.
Educational attainment Discrete variable equal to 1 if respondent is educated at degree level r above; 2 if has other qualifi cations; 3 if no qualifi cation.
Marital status Binary variable equal to 1 if respondent is part of a couple (either married or cohab-iting); 0 if single, widowed or divorced.
Household size Integer ranging from 1 to 9 indicating the number of people in the household.
Economic activity Discrete variable equal to 1 if respondent is an employee; 2 if self-employed; 3 if unemployed; and 4 if inactive (including retirees).
Homeowner Binary variable equal to 1 if respondent owns his/her home (either outright or is buying with the help of a mortgage); and zero if he/she is a renter.
Psychological characteristics
Risk aversion Binary variable taking the value of 1 if the respondent prefers a guaranteed sum of £1,000 to a 1 in 5 chance of winning £10,000; and 0 if they prefer a 1 in 5 chance.
Cautiousness Binary variable taking the value of 1 if the respondent agrees or strongly agrees with the sentence “[ I ] Always make sure that money is left”; and 0 if they disagree or are neutral.
Trust in IFA Binary variable taking the value of 1 if the respondent mentions IFAs among the most trusted sources of advice for retirement
Economic factors
Individual pension wealth Continuous derived variable provided by the WAS: total value of defi ned benefi t occupational scheme, total value of current defi ned contribution pension wealth, total value of AVCs scheme, total value of current personal pension scheme, value of total retained DB pension wealth, total value of retained rights in DC scheme, total value of retained rights for drawdown, value of pensions in payment, value of pensions expected from former spouse/partner.1 Includes zero values.We trimmed the top 1% of the distribution to clean the sample from outliers.
Net fi nancial wealth Continuous derived variable provided by the WAS and includes all fi nancial assets, such as current or saving account deposits, ISAs, fi xed term investment bonds, corporate bonds, shares, national savings products and life insurance products. We trimmed the top 1% of the distribution to clean the sample from outliers.
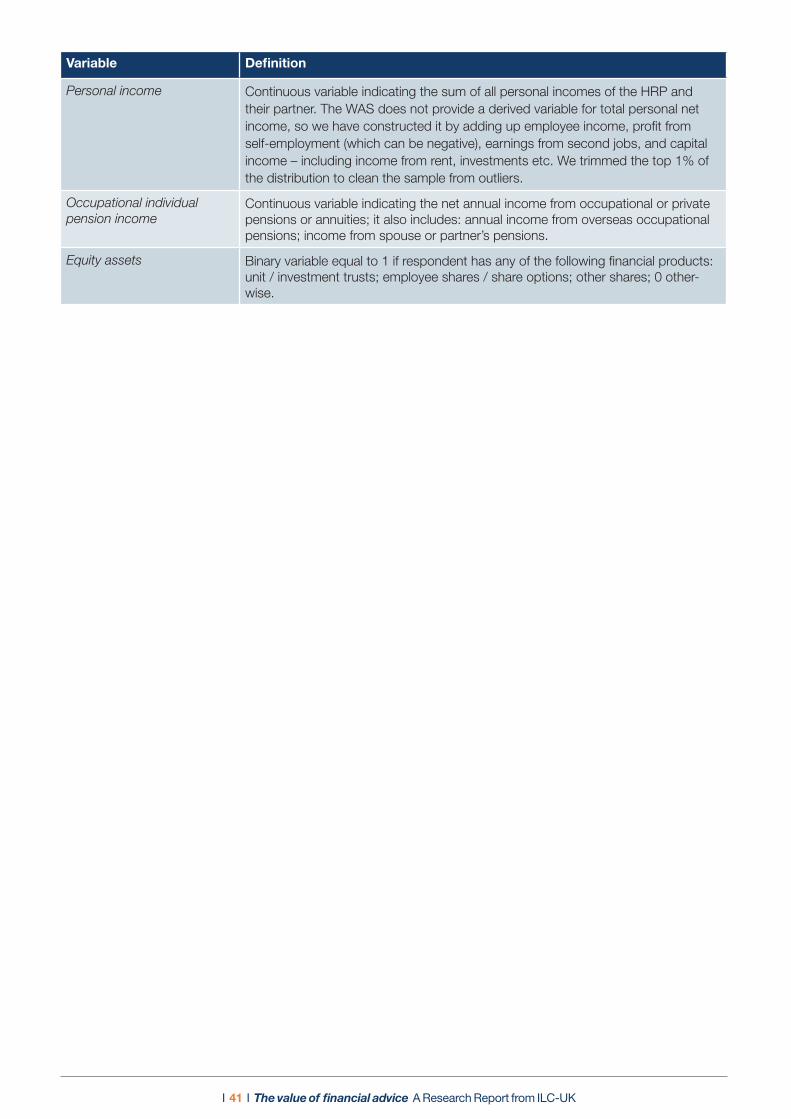
I 41 I The value of financial advice A Research Report from ILC-UK
Variable Definition
Personal income Continuous variable indicating the sum of all personal incomes of the HRP and their partner. The WAS does not provide a derived variable for total personal net income, so we have constructed it by adding up employee income, profit from self-employment (which can be negative), earnings from second jobs, and capital income – including income from rent, investments etc. We trimmed the top 1% of the distribution to clean the sample from outliers.
Occupational individual pension income
Continuous variable indicating the net annual income from occupational or private pensions or annuities; it also includes: annual income from overseas occupational pensions; income from spouse or partner’s pensions.
Equity assets Binary variable equal to 1 if respondent has any of the following financial products: unit / investment trusts; employee shares / share options; other shares; 0 other-wise.
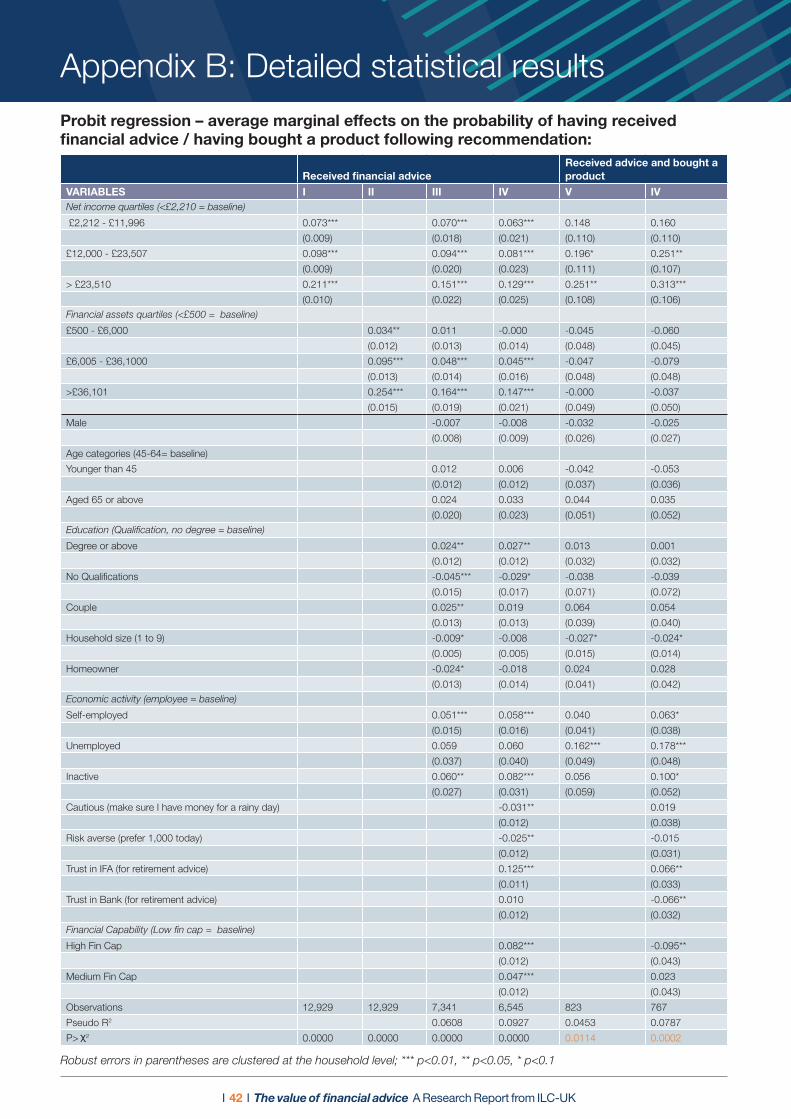
I 42 I The value of fi nancial advice A Research Report from ILC-UK
Appendix B: Detailed statistical resultsProbit regression – average marginal effects on the probability of having received fi nancial advice / having bought a product following recommendation:
Received fi nancial adviceReceived advice and bought a product
VARIABLES I II III IV V IVNet income quartiles (<£2,210 = baseline)
£2,212 - £11,996 0.073*** 0.070*** 0.063*** 0.148 0.160
(0.009) (0.018) (0.021) (0.110) (0.110)
£12,000 - £23,507 0.098*** 0.094*** 0.081*** 0.196* 0.251**
(0.009) (0.020) (0.023) (0.111) (0.107)
> £23,510 0.211*** 0.151*** 0.129*** 0.251** 0.313***
(0.010) (0.022) (0.025) (0.108) (0.106)Financial assets quartiles (<£500 = baseline)
£500 - £6,000 0.034** 0.011 -0.000 -0.045 -0.060
(0.012) (0.013) (0.014) (0.048) (0.045)
£6,005 - £36,1000 0.095*** 0.048*** 0.045*** -0.047 -0.079
(0.013) (0.014) (0.016) (0.048) (0.048)
>£36,101 0.254*** 0.164*** 0.147*** -0.000 -0.037
(0.015) (0.019) (0.021) (0.049) (0.050)
Male -0.007 -0.008 -0.032 -0.025
(0.008) (0.009) (0.026) (0.027)
Age categories (45-64= baseline)
Younger than 45 0.012 0.006 -0.042 -0.053
(0.012) (0.012) (0.037) (0.036)
Aged 65 or above 0.024 0.033 0.044 0.035
(0.020) (0.023) (0.051) (0.052)Education (Qualifi cation, no degree = baseline)
Degree or above 0.024** 0.027** 0.013 0.001
(0.012) (0.012) (0.032) (0.032)
No Qualifi cations -0.045*** -0.029* -0.038 -0.039
(0.015) (0.017) (0.071) (0.072)
Couple 0.025** 0.019 0.064 0.054
(0.013) (0.013) (0.039) (0.040)
Household size (1 to 9) -0.009* -0.008 -0.027* -0.024*
(0.005) (0.005) (0.015) (0.014)
Homeowner -0.024* -0.018 0.024 0.028
(0.013) (0.014) (0.041) (0.042)Economic activity (employee = baseline)
Self-employed 0.051*** 0.058*** 0.040 0.063*
(0.015) (0.016) (0.041) (0.038)
Unemployed 0.059 0.060 0.162*** 0.178***
(0.037) (0.040) (0.049) (0.048)
Inactive 0.060** 0.082*** 0.056 0.100*
(0.027) (0.031) (0.059) (0.052)
Cautious (make sure I have money for a rainy day) -0.031** 0.019
(0.012) (0.038)
Risk averse (prefer 1,000 today) -0.025** -0.015
(0.012) (0.031)
Trust in IFA (for retirement advice) 0.125*** 0.066**
(0.011) (0.033)
Trust in Bank (for retirement advice) 0.010 -0.066**
(0.012) (0.032)Financial Capability (Low fi n cap = baseline)
High Fin Cap 0.082*** -0.095**
(0.012) (0.043)
Medium Fin Cap 0.047*** 0.023
(0.012) (0.043)
Observations 12,929 12,929 7,341 6,545 823 767
Pseudo R2 0.0608 0.0927 0.0453 0.0787
P> χ2 0.0000 0.0000 0.0000 0.0000 0.0114 0.0002
Robust errors in parentheses are clustered at the household level; *** p<0.01, ** p<0.05, * p<0.1

I 43 I The value of financial advice A Research Report from ILC-UK
Ordered probit regression – average marginal effects on the probability of having received financial advice / having bought a product following recommendation:
Received financial advice
VARIABLES IFABanks/Building society Other IV
Net income quartiles (<£2,210 = baseline)
£2,212 - £11,996 0.070 -0.015 -0.032 -0.024
(0.081) (0.014) (0.037) (0.030)
£12,000 - £23,507 0.115 -0.028* -0.051 -0.036
(0.084) (0.016) (0.039) (0.031)
> £23,510 0.117 -0.029* -0.052 -0.036
(0.084) (0.015) (0.038) (0.031)Financial assets quartiles (<£500 = baseline)
£500 - £6,000 0.155*** -0.039*** -0.068*** -0.048**
(0.053) (0.012) (0.024) (0.020)
£6,005 - £36,1000 0.156*** -0.039*** -0.069*** -0.048**
(0.055) (0.012) (0.025) (0.021)
>£36,101 0.116** -0.026** -0.052** -0.039*
(0.058) (0.011) (0.026) (0.022)
Male 0.057** -0.017** -0.024** -0.015**
(0.028) (0.009) (0.012) (0.007)
Age categories (45-64= baseline)
Younger than 45 0.038 -0.012 -0.016 -0.010
(0.036) (0.012) (0.016) (0.009)
Aged 65 or above 0.053 -0.017 -0.023 -0.013
(0.050) (0.017) (0.021) (0.012)Education (Qualification, no degree = baseline)
Degree or above -0.002 0.001 0.001 0.000
(0.030) (0.010) (0.013) (0.008)
No Qualifications -0.174*** 0.033*** 0.078*** 0.063**
(0.058) (0.008) (0.027) (0.028)
Couple 0.079** -0.024** -0.034** -0.021**
(0.039) (0.012) (0.017) (0.010)
Household size (1 to 9) 0.013 -0.004 -0.005 -0.003
(0.015) (0.005) (0.006) (0.004)
Homeowner 0.075** -0.023** -0.032** -0.020**
(0.037) (0.012) (0.016) (0.010)Economic activity (employee = baseline)
Self-employed -0.014 0.004 0.006 0.004
(0.038) (0.011) (0.017) (0.010)
Unemployed 0.126 -0.050 -0.051 -0.026
(0.112) (0.052) (0.042) (0.018)
Inactive -0.012 0.004 0.005 0.003
(0.075) (0.022) (0.032) (0.020)
Cautious (make sure I have money for a rainy day) 0.062 -0.019 -0.027 -0.016
(0.038) (0.012) (0.016) (0.010)
Risk averse (prefer 1,000 today) -0.038 0.012 0.016 0.010
(0.032) (0.010) (0.014) (0.009)
Trust in IFA (for retirement advice) 0.296*** -0.067*** -0.130*** -0.099***
(0.028) (0.010) (0.015) (0.013)
Trust in Bank (for retirement advice) -0.097*** 0.030*** 0.042*** 0.025***
(0.030) (0.010) (0.013) (0.008)Financial Capability (Low fin cap = baseline)
High Fin Cap -0.053 0.017 0.023 0.013
(0.043) (0.015) (0.018) (0.010)
Medium Fin Cap -0.024 0.008 0.010 0.006
(0.046) (0.016) (0.019) (0.011)
Observations 1,137
Pseudo R2 0.0856
P> χ2 0.0000
Robust errors in parentheses are clustered at the household level; *** p<0.01, ** p<0.05, * p<0.1 (Footnotes)1 Note that, while net property wealth, physical wealth and net financial wealth are calculated simply by adding up the value of assets (minus liabilities, if applicable) for every household in the dataset, private pension wealth is more complicated because modelling is needed to calculate the value of current occupational pension wealth, retained rights in occupational pensions etc for each household. As with all models, the results depend on the assumptions made. For reference, consult the WAS user guide

I 44 I The value of financial advice A Research Report from ILC-UK


ILC–UK11 Tufton StreetLondonSW1P 3QBTel : +44 (0) 20 7340 0440www.ilcuk.org.uk
Published in July 2017 © ILC-UK 2017Registered Charity Number: 1080496.