a research plan and report on factors a˜ecting culvert ... · a research plan and report on...
TRANSCRIPT
A Research Plan and Reporton Factors A�ecting Culvert
Pipe Service Life in Minnesota
Je� Marr, Principal InvestigatorSt. Anthony Falls Laboratory
University of Minnesota
September 2012Research Project
Final Report 2012-27
Technical Report Documentation Page 1. Report No. 2. 3. Recipients Accession No. MN/RC 2012-27 4. Title and Subtitle 5. Report Date
A Research Plan and Report on Factors Affecting Culvert Pipe Service Life in Minnesota
September 2012 6.
7. Author(s) 8. Performing Organization Report No. Craig A. Taylor and Jeff Marr
9. Performing Organization Name and Address 10. Project/Task/Work Unit No. University of Minnesota St. Anthony Falls Laboratory 2 Third Avenue SE Minneapolis, MN 55414
CTS Project #2011083 11. Contract (C) or Grant (G) No.
(C) 89261 (WO) 244
12. Sponsoring Organization Name and Address 13. Type of Report and Period Covered Minnesota Department of Transportation Research Services 395 John Ireland Boulevard, MS 330 St. Paul, MN 55155
Final Report 14. Sponsoring Agency Code
15. Supplementary Notes http://www.lrrb.org/pdf/201227.pdf 16. Abstract (Limit: 250 words) Culvert pipe material selection has traditionally been a relatively simple task involving metal or concrete pipe. In recent years, the addition of coated metal and plastic pipe has led the federal government to implement a rule requiring the consideration of alternative pipe materials. The current MnDOT Drainage Manual provides limited guidance on the selection of pipe material. The manual is lacking detailed information on the influence of environmental conditions on pipe durability in Minnesota. It is necessary to provide updated, accurate information on pipe material and durability for factors directly related to Minnesota.
To reach this goal, the availability and suitability of existing data, as well as the practices associated with predicting pipe life spans must be evaluated. This report is the result of the initial feasibility study for a larger project(s) to update the MnDOT Drainage Manual. The goal for this report is to identify knowledge gaps, produce a research plan that will guide future research, and draw any pipe materials conclusions possible using the data available.
17. Document Analysis/Descriptors 18. Availability Statement Culvert pipe, Drainage structures, Pipe, Materials selection, No restrictions. Document available from: HydInfra, Types of culverts National Technical Information Services,
Alexandria, Virginia 22312
19. Security Class (this report) 20. Security Class (this page) 21. No. of Pages 22. Price Unclassified Unclassified 88
A Research Plan and Report on Factors Affecting Culvert Pipe Service Life in Minnesota
Final Report
Prepared by:
Craig A. Taylor Jeff Marr
St. Anthony Falls Laboratory
University of Minnesota
September 2012
Published by:
Minnesota Department of Transportation Research Services
395 John Ireland Boulevard, MS 330 St. Paul, Minnesota 55155
This report represents the results of research conducted by the authors and does not necessarily represent the views or policies of the Minnesota Department of Transportation or the University of Minnesota. This report does not contain a standard or specified technique.
The authors, the Minnesota Department of Transportation, and the University of Minnesota do not endorse products or manufacturers. Any trade or manufacturers’ names that may appear herein do so solely because they are considered essential to this report.
Acknowledgments
A special thanks to Andrea Hendrickson, MnDOT State Hydraulics Engineer, who’s guidance made this project possible. A special thanks also to Bonnie Peterson for guiding us through the HydInfra database and to Ruth Betcher for graciously coordinating the District 6 culvert pipe tour and interviews.
We would also like to thank the MnDOT Technical Advisory Panel Members: Andrea Hendrickson, Bonnie Peterson, Joe Nietfeld, Jim Kochsiek, James Michael, Ruth Betcher, David Johnston, Jon Bergstrand, and Shirlee Sherkow.
Finally, we would like to thank all of the district and industrial contacts who made the interviews possible, but shall remain nameless.
Table of Contents
Chapter 1. Introduction ............................................................................................................. 1
Chapter 2. Literature Review ................................................................................................... 2
2.1 General Overview ............................................................................................................ 2
2.2 Concrete and Reinforced Concrete Pipe .......................................................................... 3
2.3 Corrugated Metal Pipe ..................................................................................................... 4
2.3.1 Galvanized Corrugated Steel Pipe............................................................................ 4
2.3.2 Aluminized Corrugated Steel Pipe ............................................................................ 4
2.3.3 Other Coatings for Corrugated Steel Pipe ............................................................... 5
2.3.4 Corrugated Aluminum Pipe ...................................................................................... 5
2.4 Plastic Pipe ....................................................................................................................... 5
2.5 Abrasion Considerations .................................................................................................. 6
2.6 Joint Separation ................................................................................................................ 6
Chapter 3. Evaluation of Current Practices ............................................................................ 8
3.1 District Interview Discussion ........................................................................................... 8
3.1.1 Design ....................................................................................................................... 8
3.1.2 Existing Pipe Materials and Methods ....................................................................... 8
3.1.3 Construction ............................................................................................................ 10
3.1.4 Maintenance ............................................................................................................ 11
3.1.5 HydInfra Inspection ................................................................................................ 11
3.1.6 General Comments.................................................................................................. 12
3.2 District 6 (Rochester) Site Visit ..................................................................................... 12
3.3 Pipe Distributor Interview Discussion ........................................................................... 13
3.3.1 Concrete Pipe Advocate Interviews ........................................................................ 13
3.3.2 Metal Pipe Advocate Interviews ............................................................................. 14
3.3.3 HDPE Pipe Advocate Interviews ............................................................................ 14
3.4 Miscellaneous Contacts .................................................................................................. 15
Chapter 4. Database Identification and Evaluation.............................................................. 16
Chapter 5. Data Analysis ......................................................................................................... 18
5.1 Site Characteristics for Steel Pipe Life Determination .................................................. 18
5.1.1 District 3 Soil Map .................................................................................................. 18
5.1.2 USGS Gaging Stations ............................................................................................ 19
5.1.3 MPCA Groundwater Data ...................................................................................... 20
5.1.4 NRCS Web Soil Survey Data................................................................................... 22
5.2 HydInfra Investigation ................................................................................................... 23
5.2.1 State Usage and Condition Trends ......................................................................... 23
5.2.2 Cause of Road Damage .......................................................................................... 27
5.2.3 Impact of Standing Water ....................................................................................... 30
5.2.4 HydInfra Rating Trends .......................................................................................... 30
5.2.5 Failure Trends ........................................................................................................ 31
Chapter 6. Conclusions & Recommendations ....................................................................... 34
6.1 General ........................................................................................................................... 34
6.2 Concrete Pipe ................................................................................................................. 35
6.3 Steel Pipe ........................................................................................................................ 36
6.4 Plastic Pipe ..................................................................................................................... 36
6.5 HydInfra Database Conclusions ..................................................................................... 36
6.5.1 State Usage and Trends Conclusions (based on sec 5.2.1) .................................... 37
6.5.2 A Note on Plastic Pipe Data ................................................................................... 37
6.5.3 Cause of Road Damage Conclusions (based on sec 5.2.2)..................................... 37
6.5.4 Impact of Standing Water Conclusions (based on sec 5.2.3) ................................. 37
6.5.5 HydInfra Rating Trends Conclusions (based on sec 5.2.4) .................................... 37
6.5.6 Failure Trends Conclusions (based on sec 5.2.5)................................................... 37
Chapter 7. Research Plan ........................................................................................................ 38
7.1 HDPE Inspection and Testing Methods ......................................................................... 38
7.2 Steel Pipe Service Life Map ........................................................................................... 39
7.3 Concrete Pipe Joint Separation Evaluation .................................................................... 39
7.4 Processed Based Abrasion Model .................................................................................. 40
7.5 Implementation Priorities ............................................................................................... 40
7.6 Other Research Topics of Interest Not Included in Research Plans .............................. 41
Chapter 8. Summary of Recommendations ........................................................................... 43
References .................................................................................................................................... 44

Appendix A: District Interview Discussion & Responses
Appendix B: District 3 Soil Map Spot Checked Against NRCS Web Soil Survey
Appendix C: pH Data Comparison Tables
Appendix D: Sub-Sampled Data from WSS
Appendix E: Recommended Needs Statements

List of Figures
Figure 1 – pH comparison plot ..................................................................................................... 19
Figure 2 – pH comparison plot (Tabular data available in Appendix C)...................................... 19
Figure 3 – Time-series pH data for the Vermillion River ............................................................. 20
Figure 4 – MPCA shallow groundwater sampling locations with groundwater tables less than 20 feet deep ........................................................................................................................................ 21
Figure 5 – pH comparison plot between MPCA and WSS for the Figure 4 sampling locations (Tabular data available in Appendix C) ........................................................................................ 21
Figure 6 – 16G galvanized pipe service life as estimated by the California Method comparison plot (Tabular data available in Appendix C) ................................................................................. 22
Figure 7 – WSS query locations where both pH and conductivity data are available .................. 23
Figure 8 – In place pipe use by district ......................................................................................... 24
Figure 9 – Average pipe condition by district for all pipes with a non-zero condition rating ...... 25
Figure 10 – Average condition by pipe diameter for all pipes excluding pipes with a condition 0 rating. ............................................................................................................................................ 26
Figure 11 –Road damage where concrete pipes (both centerline and entrance) haves joint separation ...................................................................................................................................... 29
Figure 12 – Tendencies of road damage for various pipe sizes (both centerline and entrance) ... 29
Figure 13 – Influence of cover depth on concrete pipe damage for all pipes ............................... 32
Figure 14 – Influence of cover depth on steel pipe damage for both centerline and entrance pipes....................................................................................................................................................... 33
Figure 15 – Gasketed vs. non-gasketed concrete pipe joints ........................................................ 35

List of Tables
Table 1 – District 3 soil map comparisons.................................................................................... 18
Table 2 – Inplace pipe use by district ........................................................................................... 24
Table 3 – Inplace pipe (centerline and entrance) use by route system ......................................... 25
Table 4 – Average condition by route system excluding pipes with a condition 0 rating. ........... 25
Table 5 – Average pipe size .......................................................................................................... 26
Table 6 – Average condition by pipe shape for concrete and steel pipes (excluding pipes with a condition 0 rating) ......................................................................................................................... 26
Table 7 – Road damage trends by material for all pipes excluding pipes with a condition 0 rating....................................................................................................................................................... 27
Table 8 – Pipe condition influence on road damage for all pipes ................................................. 28
Table 9 – Road damage where concrete pipes (both centerline and entrance) have joint separation....................................................................................................................................................... 28
Table 10 – Impact of standing water on steel pipe holes and overall pipe condition for all pipes excluding pipes with a condition 0 rating ..................................................................................... 30
Table 11 – Impact of standing water on concrete pipe joint separation, misalignment, and overall pipe condition for all pipes excluding pipes with a condition 0 rating ......................................... 30
Table 12 – Average conditions for pipes with various flags for all pipes excluding pipes with a condition 0 rating .......................................................................................................................... 31
Table 13 – Percent of pipes with holes that have backfill material loss ....................................... 32
Table 14 – Percent of pipes (both centerline and entrance) with joint separations that have backfill material loss ..................................................................................................................... 32
Table 15 – Correlations between misalignment and joint separation for both centerline and entrance pipes................................................................................................................................ 33
Executive Summary
Culvert pipe material selection has traditionally been a relatively simple task involving metal or concrete pipe. In recent years, the addition of coated metal and plastic pipe has led the federal government to implement a rule requiring the consideration of alternative pipe materials. The current MnDOT Drainage Manual provides limited guidance on the selection of pipe material. It is necessary to provide updated, accurate information on pipe material and durability for factors directly related to Minnesota.
To reach this goal, the availability and suitability of existing data, as well as the practices associated with predicting pipe life spans must be evaluated. This project will be the initial feasibility study of a larger project(s). The goal for this portion of the study is to determine knowledge gaps and produce a research plan that will guide future research. Ultimately, the results of this study will be used to update Chapter 2 in the MnDOT Drainage Manual to provide improved guidance for practitioners in the selection of appropriate pipe materials and life spans for culverts.
This project has reviewed literature, design/construction practices, available databases, and manufacturer opinions in order to draw conclusions about the state of pipe material selection practices in Minnesota. This project has generated several conclusions which are discussed in detail in Sections 6, 7, and 8.
The first major finding is that highway surfaces are replaced/repaired to increase its life, but the road core is not; so pipes need to last longer than the surface; as such, we recommend a design service life of 100 years for centerline and mainline T.H. culverts and a design service life of 50-75 years for entrance culverts.
There is much disagreement as to whether compaction requirements are being. Differential compaction is often a more threatening problem than under compaction; however, without density testing, it is impossible to check for either. We recommend that MnDOT investigate the feasibility of adding a third-party or contractor nuclear density testing item to construction projects to test all culverts 18 inches or larger. It is estimated that 20 nuclear density tests can be taken in the time required for one sand cone test. Nuclear density testing is quick (less than 1 minute per test) and the third party testing item will insure that there is a tester/inspector on site for every pipe installation. Nuclear density testing would allow density to be tested twice as often as recommended for sand cone testing. An alternate to nuclear density testing is dynamic cone penetration, but can only be used in sandy soils.
Concrete pipe is generally considered durable and low risk and is the default material for centerline pipe. The most common failure mode of concrete pipe is joint separation. Gasketed joints have a longer joint and joint geometrics that are expected to reduce the incidence of failure due to joint separation. We recommend that gasketed joints be the default joint for all concrete pipe.
16-gage corrugated aluminized steel pipe (CAS) should be the default corrugated steel pipe (CSP) for Minnesota. CAS can be used in a similar range of pH and has a predicted service life
of 3 to 8 times longer than galvanized CSP in both dry and wet conditions (sec 2.3.2). CAS have fewer abrasive and installation damage concerns than polymer coated CSP (sec 3.3.2).
The two most common types of plastic pipe are HDPE and PVC. PVC becomes brittle if the temperature drops below 37°F. PVC pipe should not be installed during cold temperatures (when the temperature is below 37°F) or in places where it may be jarred or deformed during cold temperatures. Considering the observed seasonal deflection of plastic pipes, the restriction eliminates nearly all applications for PVC pipe.
HDPE pipe has the durability and corrosive resistance to have a service life of over 100 years and is not significantly susceptible freeze/thaw damage. We recommend adopting testing methods similar to the Florida testing methods for determining service life (FDOT 2008a-d) to identify HDPE pipes capable of yielding a 100-year service life. Separate issues of installation, backfilling, and inspection are still a concern for designers and inspectors. We also recommend that these issues be addressed prior to giving HDPE pipe a projected service life of 100 years.
In general, a major deficiency of the HydInfra database is that it does not contain pipe age data. Much of the analysis of the HydInfra required the assumption that all pipes in the state/district are the same average age. This assumption is not valid. We recommend that a selection of pipe ages be determined and the analysis is repeated taking into account pipe age.
Concrete is the most common in place pipe material with 76% state wide. Steel is the second most common material. The average measured concrete pipe size is 24 inches and the average measured steel pipe size is 22 inches. For in place pipes, the pipe condition becomes worse with pipe diameter.
For all common pipe types (concrete, steel, and plastic) condition 3 (poor) and 4 (very poor) pipes are most associated with road damage. Although it is expected that joint separation increases the incidence of road damage, there are other mitigating factors. Joint separations could be bridged by various soil types, joint treatments, or pavement types. Medium pipe sizes (24 to 36 inches) are most susceptible to joint separation.
Over half of concrete and steel pipe with joint separation have some type of fill material loss around the pipe. For concrete pipe increased cover depth correlates with higher rates of joint separation and lower rates of road distress and voids in the road. For steel pipe increased cover depth correlates with higher rates of cracks and lower rates of deformation and road distress. For concrete pipe joint separation typically occurs before misalignment; however, for plastic pipe misalignment typically occurs before joint separation.
Standing water increases the incidence of holes in steel pipe and increases the incidences of joint separation and misalignment in concrete pipe. Steel pipe seems be more susceptible to standing water than concrete pipe; however, the correlation isn’t a strong one. We recommend that dry pipe conditions be removed from Chapter 2 of the drainage manual because ditch sedimentation means that pipes are exposed to water for much longer duration that initially expected during design.

There are four research needs statements generated out of this project: 1) HDPE Inspection and Testing Methods, 2) Steel Pipe Service Life Map, 3) Concrete Pipe Joint Separation Evaluation, and 4) Processed Based Abrasion Model. These needs statements are listed in order of research needs priority. A summary of the thirteen recommendations resulting from this work are also provided in Section 8.

1
Chapter 1. Introduction
Culvert pipe material selection has traditionally been a relatively simple task involving metal or concrete pipe. In recent years, the addition of coated metal and plastic pipe has led the federal government to implement a rule requiring the consideration of alternative pipe materials. The current MnDOT Drainage Manual provides limited guidance on the selection of pipe material. The manual is lacking detailed information on the influence of environmental conditions on pipe durability in Minnesota. It is necessary to provide updated, accurate information on pipe material and durability for factors directly related to Minnesota.
To reach this goal, the availability and suitability of existing data, as well as the practices associated with predicting pipe life spans must be evaluated. This project will be the initial feasibility study of a larger project(s). The goal for this portion of the study is to determine knowledge gaps and produce a research plan that will guide future research. Ultimately, the results of this study will be used to update Chapter 2 in the MnDOT Drainage Manual to provide improved guidance for practitioners in the selection of appropriate pipe materials and life spans for culverts.
This study will be conducted in seven tasks: literature review, assessment of current practices, database identification, data analysis, research plan development, draft project report, and final project report.
2
Chapter 2. Literature Review
A number of published documents were reviewed on the subject of factors influencing pipe material selection and wear. In the summary that follows, we provide an overview of the information from these reports and organize under key categories listed below. Information relating to these topics from various sources are discussed and briefly summarized.
• General Overview • Concrete and reinforced concrete pipe • Corrugated metal pipe • Plastic pipe • Abrasion considerations • Joint separation
There was little literature found discussing service life. It should be considered that there are several failure modes that influence pipe life and only a few of them are related to the pipe material durability. A pipe may take significantly longer to structurally fail from deterioration of the pipe material than for the installation to fail by other means in the field. Many of these other failure modes are related to installation methods.
2.1 General Overview
Three sources provided general overviews of the topic of pipe material selection. Chapter 14 of AASHTO (2007) Highway Drainage Guidelines contains a review of many of the pipe material concerns and outlines a few of the protective measures used. Chapter 14 identifies pH, soil resistivity, chlorides, sulfates, and bedload as material life reducers through corrosion and wall thinning. A pH of less than 5.5 or greater than 8.5 is considered “severely detrimental to culvert life.” The influence of other site properties on culvert life varies with different pipe materials.
NCHRP (2011) “Alternate Pipe Material Selection Protocol” is a general review of the culvert material selection and culvert design process. This report highlights factors that reduce culvert life and reviews the decision making criteria from several state DOTs across the US and Canada. NCHRP (2011) develops a flowchart for pipe material selection. NCHRP presents the flowchart as a design tool; however, its use would require each DOT/designer to choose appropriate decision making criteria for each step. The protocol is divided into three phases. The first phase focuses on site and material properties and design service life. Phase two and three focus on hydraulic and structural design.
NCHRP (2011) also identifies the following site characteristics as important influences on pipe durability: soil mechanical properties, soil and water chemistry (pH, resistivity, chloride concentration, and/or sulfate content), streambed properties, and drainage area characteristics. The protocol gives no advice on how to obtain these site characteristics. The only guidance on how to incorporate these important site characteristics is a reference to example guidelines from several state DOTs. The protocol also requires the designer to select a design service life, but reiterates that there are no established objective guidelines for choosing an appropriate design service life.

3
Perrin and Jhaveri (2004) conducted an economic exploration of culvert life cycles. Perrin and Jhaveri note that most culverts are not replaced at the end of their life expectancies, rather replacement occurs after failure and is costly. When these culverts fail, they are then replaced at emergency rates. The cost due to user delays during replacement is also considered and it is concluded that the savings gained by using a shorter life pipe is more than offset by the replacement costs. Perrin and Jhaveri go on to state that inspection and maintenance programs will lead to an overall savings when compared to emergency replacements. Perrin and Jhaveri conclude, “At this point, it is important to consider whether a pipe with longer life is more cost-effective simply based on the likelihood that the pipe may not be replaced at the end of its design life.”
2.2 Concrete and Reinforced Concrete Pipe
Both AASHTO (2007) Chapter 14 and NCHRP (2011) provide a discussion of concrete pipe durability. Both sources generally consider concrete pipe durable.
AASHTO (2007) Chapter 14 gives the following recommendations/requirements for concrete pipe:
• Sulfate concentration must be greater than 1000 ppm. • Extra concrete cover over steel reinforcement is recommended when abrasion is severe. • Extra steel cover or coated steel is also recommended when the pH is less than 5.5. • Concrete pipe should never be partially buried.
NCHRP (2011) provides examples of concrete pipe service life estimates for several state DOTs. In summary:
• All state DOTs include a wide range of conditions for which the project a service life is over 100 years.
• Most of the DOTs’ models agree that for sites with low chloride content and a pH between 5.0 and 9.0, the projected service life will exceed 100 years.
• Unlike the other state DOTs, the Utah DOT requires a resistivity of greater than 900 ohm-cm.
Note: Utah is a rather arid climate and the Utah DOT resistivity requirement is likely not applicable to Minnesota.
Salt in the environment has potential to accelerate reinforced concrete pipe degradation. Busba et al. (2011) concluded that the allowable crack width should be reduced from 0.02 inches to 0.01 inches when chloride concentrations are greater than 500 – 2000 ppm (or 500 – 2000 mg/l). Novotny et al (2007) reports that storm sewer effluents in the Twin Cities Metropolitan Area can reach as high as 35,000 mg/l during the winter months; however, at this location the median concentration is 150 mg/l and the summer lower concentration is 64mg/l. Storm sewers along the Mississippi range between 130 mg/l in summer to 900 mg/l in winter.

4
2.3 Corrugated Metal Pipe
The current MnDOT default metal pipe type is 16-gaga galvanized corrugated steel pipe. Alternate coating materials include aluminized and polymer coated corrugated steel pipe.
2.3.1 Galvanized Corrugated Steel Pipe
Chapter 14 of AASHTO (2007) defers to the Caltrans Test Method 643-C (California Method) for estimating service life of galvanized corrugated steel pipe (CS). Historically, zinc galvanizing is the most common corrosion resistant coating. Chapter 14 indicates that galvanizing is effective for a pH range of 5.5 to 8.5; however, galvanized CS little has appreciable abrasion resistance and concrete invert paving is recommended as an effective abrasive resistant coating. Concrete thicknesses are typically between 3 and 6 inches.
NCHRP (2011) also recognizes the California Method and the American Iron and Steel Institute (AISI) Modified California Method as the prevailing models for galvanized CS service life. These models depend on pH and resistivity. Both models are based on the same data; however, the California Method sets the service life as the time to first perforation and the AISI method set the service life as the time when 25% of the invert is completely lost. NCHRP (2011) reviews studies conducted by eight states evaluating the accuracy of both models. The accuracy of each model depends on the state applying the model. The large range of results suggests that several environmentally important factors are not included in the model (such as abrasion). Models for galvanized CS were reviewed for the five states. Of these states, only a few indicated a service life of greater than 50 years for 18-gage galvanized CS and these were only for limited scenarios. New York projected a service life as low as 13 years for 18-gage galvanized CS. None of the states projected a service life of 100 years for 18-gage galvanized CS. Note that the minimum gage used for MnDOT projects is 16-gage.
Stratton et al (1990) conducted a study of 819 CSs for Kansas DOT. The researchers measured the pipe wall thickness, rated pipe condition, and project pipe lifespan. Stratton et al noted markedly lower projected life spans for pipe placed after 1974. There was some postulation that this change could be due to policy change that allowed for thinner pipe walls with thicker corrugations, but they provide no conclusive evidence to support this. For all of the pipes studied, regardless of the installation date, the projected pipe service lives ranged from 26 to 50 years. Based on this study, Kansas DOT opted to limit the use of CS pipe in 4 of 6 districts due to unacceptable service life estimates.
2.3.2 Aluminized Corrugated Steel Pipe
Chapter 14 of AASHTO (2007) states that aluminizing is effective for a pH range of 5.0 to 9.0 and a soil resistivity of greater than 1500 ohm-cm. Corrugated aluminized steel pipe (CAS) does not have appreciable abrasion resistance. Chapter 14 cites concrete invert paving is an effective abrasive resistant coating. Concrete thicknesses are typically between 3 and 6 inches.
NCHRP (2011) discusses CAS as having “long term potential.” One study indicates that aluminized pipe provides a service life that is 3 to 8 times longer than galvanized CS. Florida

5
DOT developed a service life model for CAS using the California Method and an adjustment factor of 2.9. This model also uses 16-gage pipe as the default.
Ault and Ellor (2000) conducted a study focusing on CAS. They found that in the absence of abrasion, CAS had a service life 3.5 times greater than the service life estimated for galvanized CS via the California Method. Observations were made about pitting rates. High pitting rates were correlated with bed load severity while low pitting rates were linear with time. Ault and Ellor (2000) reiterate that the California Method has a reported accuracy of ±12 years.
2.3.3 Other Coatings for Corrugated Steel Pipe
New types of polymeric coated-corrugated steel pipes (PC-CS) have not been extensively studied. NCHRP (2011) does cite one study which projects that a PC-CS with 10-mil thick polymer coating will have a service life of up to 100 years under most conditions.
2.3.4 Corrugated Aluminum Pipe
NCHRP (2011) provides a short review/discussion of corrugated aluminum pipe. Corrugated aluminum pipe requires similar site conditions as CAS (pH = 5.5 – 8.5, resistivity > 1500 ohm-cm, and non-abrasive). Excerpts from the Florida DOT and Utah DOT design guidelines project service lives for corrugated aluminum pipe. The Florida DOT projects service lives of over 150 years for a pH between 6.0 and 8.0. The Utah DOT assigns corrugated aluminum pipe the same service life as galvanized CS which peaks at 75 years.
2.4 Plastic Pipe
AASHTO (2007) Chapter 14 discusses a few considerations for plastic pipe. First, AASHTO (2007) indicates that the installation method is the most important consideration. Material creep, the deformation of the pipe walls under constant loads, is possible if pipe backfill creates an asymmetric load. High-density polyethylene (HDPE) pipes will also creep if the temperature exceeds 140°F. Polyvinyl Chloride (PVC) is susceptible to UV weakening and becomes brittle if the temperature drops below 37°F. Note the term “brittle” refers to a materials ability to withstand impacts or bends and not its ultimate strength.
NCHRP (2011) does not discuss plastic (HDPE or PVC) pipe in detail, but does recognize that plastic pipe is corrosive resistant under most natural conditions. NCHRP states that the concerns regarding material creep and oxygen degeneration in plastic pipe largely remain to be studied. Several studies have been conducted for the Florida DOT on the subjects of crack generation and oxygen degeneration. Florida DOT does project the service life of HDPE pipe as high as 100 years, but it does not consider in influence of the freeze/thaw cycle. An excerpt from the Ontario Ministry of Transportation cites the U.S. Army Corps of Engineers (USACOE) and Federal Highway Administration (FHWA) recommendations for a service life of 50 years; however, no justification is given other than that the projection needs to be conservative.
6
2.5 Abrasion Considerations
NCHRP (2011) highlights abrasion as detrimental to service live, but recognizes that there is no objective method for incorporating abrasion into service life models. AASHTO (2007) Chapter 14 defines bedload by the 2-5 year return frequency flow velocity. Velocities less than 5 ft/s are not considered abrasive, while velocities greater than 15 ft/s are considered very abrasive. Chapter 14 advises against the use of metal pipe in abrasive environments unless the invert is paved. Chapter 14 acknowledges that the abrasive impact on plastic pipes has been documented for sands and gravels flowing in the 2-7 ft/s range. The influence of cobbles has not been well defined, and there have been few rehabilitation methods developed yet.
Ault and Ellor (2000) recommend incorporating the existing Federal Lands Highway Design Guidance abrasion rating system (Levels 1 through 4) into culvert condition assessment and durability prediction practices at a minimum.
The most in-depth pipe abrasion study found is DeCou and Davis’s (2007) five year study on the Shady Creek in Nevada County, CA. This site, with average flow velocities of 12 to 18 ft/s and median grain sizes between 3 and 11 mm, is highly abrasive. The service life estimates developed for this study are site specific because of these conditions. DeCou and Davis found that abrasive wear at the site is event-driven and not linear with time. Several material comparisons and observations were made:
• All non-concrete pipe materials studied have lower abrasive wear rates than concrete; however, concrete pipe walls are much thicker than the non-concrete pipe materials studied.
• Smooth pipes wear slower than rough walled pipe. • PVC pipe wears slower than HDPE; however, the construction of smooth-walled,
corrugated HDPE provides a positive characteristic. After the inner wall is perforated, the outer wall remained intact.
• Polyethylene coating for composite steel spiral rib pipe was the only steel coating studied that could provide the desired 50 service life.
2.6 Joint Separation
Joint separation is a structural pipe failure where the joints between individual sections of pipe widen. While joint separation occurs for all pipe types, it is most commonly associated with concrete pipe. Joint separation can allow bed material to infiltrate into the pipe. This can lead to roadway settling and piping failures. AASHTO (2007) Chapter 14 cites the following causes of joint separation: uneven bedding, poor compaction, and unexpected settling. Chapter 14 claims that placing pipe in multiple stages should be avoided, as it is difficult to get consistent compaction at the transition. Curved pipes also force joint separation along the outside bend. Maintaining proper joint overlap in a curved pipe can be difficult.
NCHRP (2011) recognizes that there is little agreement on how joint types should be selected. A table of state DOT pipe joint usages is included. Half of the DOTs that responded indicated that they either “mostly” or “commonly” use bell and spigot joints with gaskets for reinforced

7
concrete pipe (RCP). Ten of the twelve states that commented on the performance of gasketed RCP bell and spigot joints rated their performance as “good” (the top rating).
Type II geotextile fabric is sometimes used to protect concrete joints from sediment intrusion. Koerner (2005) presents design guidelines for geotextile strength. Based on Koerner’s design guide, type II geotextile fabric should be adequate to prevent soil intrusion into a joint gap of 1 cm; however, Koerner has found no guidelines for the expected service life of type II geotextile fabric.

8
Chapter 3. Evaluation of Current Practices
3.1 District Interview Discussion
This discussion is the authors’ review of three interviews held with several MnDOT employees. The contents of this interview are based on the personal opinions of the interviewees and not on the opinion of MnDOT. The complete minutes of the district interview questions and responses are provided in Appendix A.
3.1.1 Design
Chapter 2 of the MnDOT Drainage Manual receives little use from designers. The load tables are used most often. The material selection section of the drainage manual is only used for special cases. All districts use concrete as the default material for centerline pipes. The use of alternate materials for entrance culverts varies from district to district.
The development of design flow charts would not be well received. The primary concern over design flowcharts, such as the one proposed in NCHRP (2011), is the challenge flowcharts can pose to engineering judgment. A flowchart would need to be district specific. The general opinion is that a flowchart may be too rigid in some situations.
Soil borings are the only soils data the designers receive and often that data is not available until after culverts design is complete. Resistivity and pH are rarely considered during design. District 3 has a soil pH map and District 1 designers can take pH samples if desired. Other districts do not consider or have access to pH data. In areas where soil is suspect, designers opt to use select backfill/bedding in lieu more investigation.
Most districts agree that mainline culverts should have a design service life of 75 to 100 years, with most opting for 100 years. The justification for longer design service life is that districts are not allowed to excavate the highway and divert traffic in order to replace deteriorating pipes. District 1 believes that concrete pipe has a 20-year life and CS has a 10 to 20-year life; in that case, a 50-year design service life is desirable.
3.1.2 Existing Pipe Materials and Methods
The technical memorandum for plastic pipe (MnDOT 2007) is the primary motivation given for designing with alternate materials. Some designers have found that there are too many types of coated CMP options to make an informed decision. Another concern for alternate materials is the different hydraulic conditions that require multiple designs. Designers have also found that the use of alternate materials is limited because MnDOT does not work on many low volume roads. The materials used for entrance roads are often deferred to the discretion of the local agency who will be maintaining them. Local agencies often request concrete pipe, especially when MnDOT is paying for the entrance culverts. Documenting the local agency’s request for a single pipe type is the primary justification for excluding pipe alternatives.

9
Galvanized Corrugated Steel Pipe (CS)
In general galvanized CS is the most common alternative material; however, most districts now tend to avoid it. There have been many observations of 30-year old galvanized CS with corroded/failed inverts. The galvanized CS that has been observed to last the longest is the riveted pipe from the 40’s and 50’s (military grade steel) and structural plate steel (installed with a thicker gage). Maintenance has also observed that galvanized CS lasts in the north half of District 3. The advantage of galvanized CS is that it is light weight and comes in long sections, which make it easier to install. For this reason, galvanized CS is the primary pipe material for several districts’ maintenance crews.
Galvanized CS is also used for applications where pipe needs to be placed underwater. HDPE is not an option in these cases because of buoyancy. That said, corrosion has also been observed to be the worst is wet and swampy areas. Maintenance has also noted that ditches are not being maintained to prevent standing water. Maintenance believes that we cannot count on culverts to be primarily dry; as such, pipe life is reduced.
Another consideration for galvanized CS is safety aprons. There are size and manufacturing limitations for polymer coated CS, so galvanized CS is required. Some districts have found that CS safety aprons, especially mitered aprons, have a tendency to float. Floating causes the apron to bend or slip off. Floating is more likely when the apron is submerged, often by a flood or blockage. The Metro District has observed that safety apron with incorrectly installed toe plates are more likely to float, but correctly installed toe plates have failed as well. The Metro District requests an official design for 1:10 slope prefabricated CM safety aprons. District 7 proposes a concrete headwall to anchor CS safety aprons.
Aluminized Corrugated Steel Pipe (CAS)
CAS is not widely used; however, there are several suggestions that it be the default CS. The primary hesitation for specifying CAS is that there isn’t much experience with its use. Another challenge to CAS is that pipe suppliers do not have a large stock of it, but there is some indication that they would stock it, if MnDOT were to call for it more often. There is also concern about how the aluminum will react in peat rich environments. (Note: peat typically has a pH between 3.6 and 4.2. This range would increase the corrosion rates of all pipe materials especially galvanized CSP.)
Plastic Pipe
The two types of plastic pipe discussed and used are high-density polyethylene (HDPE) and polyvinyl chloride (PVC). PVC pipe is occasionally used for storm sewer and as a liner, but HDPE is the more prevalent plastic pipe. The rigidity of PVC makes it prone to cracking when used as a liner.
Similar to CSP, the advantages of plastic pipe are that they are light weight and come in long sections, which make them easier to install. Plastic pipes are also considered superior for corrosion and joint separation. Dual walled HDPE is most common, except where the interior corrugations are needed for energy dissipation.

10
There are several challenges to plastic pipe. The largest of these challenges are compaction around the pipe. Pipes may fail the 30-day mandrel test; however, by that time the road is finished and it is too costly to replace to poor pipe. For local roads deductions are typically given in lieu of culvert repair. There are some suggestions for MnDOT to adopt the deduction or warranty philosophy; however, some effort will be needed to determine how much the deduction is necessary to cover premature failure costs. Other concerns over plastic pipe include floating in wet conditions, adequate cover, prone to construction damage, and ditch burning.
Reinforced Concrete Pipe (RCP)
All districts agree that concrete pipe has long material life. The only observations of RCP corrosion were due to illicit discharge or poor quality control during manufacturing. The primary observed failure mechanism for RCP is joint separation. A second, although related, failure is aprons falling off within 20 years of construction. Most districts agree that tying all culvert joints and using gasket joints will alleviate most joint separation issues. There have, however, been cases where joint ties have broken or corroded. Clarification does need to be made about how to handle centerline culverts with median drains; these are and should be considered culverts and not storm sewers. The primary disadvantage of RCP is that it is difficult for maintenance crews to install, which makes it expensive when not installed under a larger project.
There is some debate as to how to deal with existing untied RCP with failing end section joints. The question is whether or not to tie the end sections when they are reset. About half of the districts have found that tied end sections will cause a joint separation further up the pipe at the next untied joint. This problem seems more common in poor soils.
3.1.3 Construction
There are a number of unique challenges to construction inspection of culvert pipes. Construction inspection is conducted “in house” by MnDOT inspectors. The number of inspectors on staff relative to the size of the construction projects does not allow for all pipes to be observed during construction. Post-construction as-built inspection check sheets are not feasible because projects rarely create as-built plan sheets. Post-construction inspection seems to focus on checking that the pipes are clear at the end of the project. It is noted that while pipes appear correctly installed post-construction, incorrectly installed pipes typically show their issues within the first few years.
Pipe bedding and trench backfill compaction are a common concern during construction. Most designers have had success in poor soils by over-excavating two feet and backfilling with select granular material. Lining the trench with geotextile fabric has also improved performance. For example, District 8 maintenance has observed RCP placed in four feet of organic material under a roadway. The pipe was properly bedded and tied; as such, there were no problems with differential settlement.
There is a general belief that pipes are not being bedded and compacted properly. Class B and C bedding techniques call for rounded bedding formed with a template. Inspectors do not see templates in use. There is some speculation that in some cases bedding techniques might be closer to a Class D. There doesn’t seem to be much consistency in trench width. The trench

11
width used in the field depends largely on the equipment used for installation. Many feel that bedding and compaction efforts are effective when inspectors are overseeing the pipe installation, but short cuts are often taken when inspectors are absent.
There were several solutions proposed to alleviate the concerns over inadequate bedding and compaction practices. Firstly, there is a suggestion for more formal education for installers on pipe bedding. Currently bedding techniques are handed down from senior installers to junior installers. District 4 is planning a 30-minute slide presentation on proper installation techniques during their seasonal kick-off meeting. This is in response to new pipe not achieving a HydInfra condition code of “1 – Excellent, like new condition”. A second suggestion is that rigid pipes have less risk for compaction related issues, because it is not as dependent on bedding for strength. A third suggestion is to video installation. Finally, there was a suggestion to increase the penalty for a failed pipe, since often times a contractor will opt to take a contract deduction rather than repair/replace a failed pipe. District 8 maintenance developed a differential culvert settlement specification along these lines. The specification allows the contractor to design their own culvert treatment, but requires a 3-year warranty bond to ensure that the roadway will not develop a dip. This specification was first used nearly three years ago. District 8 will update the state hydraulic engineer as to how effective the specification was. If it is deemed effective, it will be distributed to the other districts.
3.1.4 Maintenance
A widespread maintenance problem is sedimentation in ditches and at culvert ends. Maintenance crews have been downsized in recent years, and there is no longer time or budget to clean out ditches. Ditch filling is leading to less flow though culverts and more standing water; ultimately, culvert life is reduced under wet conditions.
Due to accelerated timeframes and the need for additional survey, ditch cleaning work is rarely included in mill and overlay projects. Ditch cleaning requires more than just digging out excess sediment; it also requires an erosion control plan. Once a ditch has accumulated a few feet of sediment, the problem is more difficult. Utilities are place based on the existing grade. If a filled ditch is cleaned out, some utilities will then be too shallow. Also, ditches that have filled in can form incidental wetlands, protected orchid habitat, or protected waters for fish passage.
Northern districts have also found maintenance issues due to the freeze thaw cycle. They believe that water seeps into joints and freezes causing a separation. Freezing may also cause soil swelling and up heaving. One proposed solution is to install a concrete or sheet pile cut-off wall when poor soils are present. A second suggestion is to place bands on pipe to prevent water from seeping into the joints.
One maintenance practice that has been found to extend CSP life is invert paving. This has been found particularly effective in abrasive environments.
3.1.5 HydInfra Inspection
The HydInfra database is used primarily as scoping tool to determine which pipes should be checked in more detail prior to a project design. Projects are typically not scheduled based on

12
HydInfra data. For most districts the easiest way to determine pipe ages is to use the electronic document management system (EDMS) to attempt to find the plan under which the HydInfra pipe was installed. The Metro District has a library of pipe ages available with their MS4 group. District 6 keeps hard copies of plans with HydInfra inspection sheets.
3.1.6 General Comments
Entrance culverts are typically replaced by maintenance crews due to limited traffic control requirements. There is some interest in including entrance culverts in projects, but limited funds typically lead to their exclusion. Some feel that entrance culverts should be a low priority for replacement because there is more risk to drivers/vehicles when a centerline culvert fails.
3.2 District 6 (Rochester) Site Visit
A District 6 (Rochester) site visit was conducted in August 2011. One day was spent inspecting pipes exhibiting typical failure modes. The site visit was hosted by a hydraulic engineer and a HydInfra inspector. Time was also spent with maintenance personnel and construction inspectors. Much of District 6’s focus is directed towards rehabilitation of ageing pipes that are not scheduled for replacement. District 6 has an inordinate number of condition 3 and 4 pipes when compared to other districts in the state. Several possible reasons for the number of poor condition pipe were discussed. Firstly, District 6 has some of the oldest roads in the state. Other considerations are that District 6 also has steep slopes, high fills, poor soils, and karst topography. Finally, concrete pipes in District 6 all are Standard Plate 3000 joints which are not gasketed. Most of the District 6 were places before joint tying was a standard practice.
Concrete pipes from two roadways were inspected. One roadway had a 6-foot RCP under high cover that was 12 years old and the other roadway had several 24 to 30-inch RCP under shallow cover that were approaching 100 years old. Both pipes had joint separation issues and cracked tongues. The joint separations tended to alternate sides upon which they were most prevalent. This suggests non-uniform horizontal and vertical pipe movements. Cracked tongues may have been due to soil or freezing water in the joints. The 6-foot pipe had a significant amount of water infiltrating near the joints. The smaller pipes were misaligned and had standing water due to the ditches filling with sediment.
A 5-foot, dual-walled HDPE culvert was also inspected. The inner wall or “liner” had regular cracks in locations where the pipe had deflected. Within the past two years all of the cracks were welded closed. Most of the weld locations had new cracks form adjacent to the welds. This suggests that the deflection of the pipe changes throughout the seasons. Joint separations also alternated sides of the pipe, suggesting a slight misalignment and non-uniform movement. The inlet of the culvert was also damaged by debris washed down the entrance channel. It was discussed that inlet aprons could be connected to the inside of the culvert instead of the outside.
Galvanized arch CMP were inspected along TH 69. These pipes were installed between 1925 and 1929. The CMP are riveted structural plate steel, meaning that the original gauge thickness was thicker than the today’s default thickness. The highway has low traffic volumes and receives little salt. The ditches have thick vegetation and a low grade, indicating that the site is non-

13
abrasive. In summary, this site has nearly ideal conditions for a CMP. Under these conditions, the CMP are about 85 years old and the inverts have corroded well past failure.
The construction inspectors have found that replacing organic soils with select backfill helps reduce differential settlement, but it is not a common practice. The construction inspectors conduct density testing using the sand cone method. Construction inspectors feel that soil density testing eliminates many of the soil compaction concerns; however, they have found that testing is not always conducted for all projects/pipe installations, especially for smaller (lower budget) projects and maintenance projects. In response to this, maintenance feels that testing is only conducted where the soils are not going to pass. As the result of the testing, the test area is over compacted and the pipe as a whole has differential compaction. Maintenance feels that it is better to risk some areas being under compacted than to have inconsistent compaction.
3.3 Pipe Distributor Interview Discussion
This discussion is the authors’ interpretation of interviews held with several regional pipe distributors/advocates for the three most common pipe materials. The contents of this editorial are based on the personal opinions of the interviewees. The authors have attempted to remove the interviewees’ bias from the discussion, but such a task is not entirely possible. The general theme from all advocates is that construction damage and improper installation is the most common cause of premature pipe ageing.
3.3.1 Concrete Pipe Advocate Interviews
The discussion with the concrete pipe advocates focused primarily on joint separation. It was agreed that poor soils are the most likely cause of joint separation. It was suggested that construction traffic and a lack of proper soil blisters during construction may push joints apart, particularly where rock backfill is used. They felt that it is unlikely that ice in the joints would be able to directly push joints apart. The argument was that ice will form from one edge of the joint and push water out of the joint in lieu of pushing on the joint face. They hypothesize that freezing clay material along the outside wall of the pipe can swell and pull the joints apart via wall friction. It is further suggested that replacing the poor soils with good backfill will eliminate the effects of the freeze thaw cycle. Several people also suggested that drop walls be considered where joint separation is a problem. Headwalls and cutoff walls or anti-seep diaphragms could be used in place of clay caps which may cause pipe end movement.
Observations were also made that box culverts have fewer joint separations. This was attributed to better bedding material and more onsite inspections. When questioned about tongue and grove verses bell and spigot joints, the distributer commented that there wasn’t much cost difference, but pipe with bells can be harder to compact around; on the other hand, it was also suggested that the bell end of the pipe may key into the soil and help prevent pipe movement. Finally it was suggested that “tattle tale” straps be placed on new pipe joints as a means of indicating when a joint has separated.
14
3.3.2 Metal Pipe Advocate Interviews
There is a general feeling that CAS is a superior product to galvanized CSP. Service life span for galvanized CSP was estimated on the order of 30 years, whereas service life span for CAS was estimated on the order of 75 years. The price of CAS is comparable to the price of galvanized CSP and is sometimes less expensive.
Polymer coated CSP is commonly used in North Dakota. The service life span for polymer coated CSP was estimated up to 100 years. The most common problem with polymer coating is construction damage. The polymer coating is easily damaged, and the pipe wall will quickly corrode where the damage occurred. The corrosion has not been found to migrate from the location of the initial damage; however, a hole will form in the pipe equal to the size of the damage. The distributer does supply touch up coating to repair any areas that the coating is damages during construction; although, it is acknowledged that the touch up coating is not always applied properly. Wrapping the pipe in a protective fabric has been considered, but it adds too much cost to the pipe. Concerns over construction damage are great enough that one distributer encourages municipalities to use an aluminized pipe alternative when polymer coated pipe is specified for a 75 to 100-year design life.
Finally, when asked about failing 30-day mandrel tests on flexible walled pipes, failures were attributed to poor compaction. It is suggested that the required compaction is not being achieved when inspectors are not present and the solution is to have inspectors present for the installations.
3.3.3 HDPE Pipe Advocate Interviews
There are three primary failure mechanisms for HDPE pipe: brittle failure, slow crack growth, and corrosion. Brittle failure is due of overloading and is, therefore, preventable. Slow crack growth is the failure mechanism associated with 50-year service life pipe. 100-year service life pipes, which have been designed to prevent slow crack formation, will then succumb to corrosion. For 100-year HDPE pipes, additional anti-oxidant is added to the material blend to prevent corrosive wear.
During construction the duration of construction loading should be minimized. If this is done, distributors feel that the pipe will recover from any initial installation deflection. It is also believed that about 85% of the deflection occurs within the first 7 days. A preliminary mandrel test could be conducted after one week as an indicator if the pipe may not pass the 30-day mandrel test. There is also some discrepancy between the nominal pipe diameter as specified by the plan and the actual pipe diameter as provided by the manufacturer. The actual pipe diameter can be off by 2-3%. If the mandrel is set per the nominal size, it could cause false readings. Most manufactures claim to have mandrels calibrated to their actual pipe sizes that they are willing to loan to inspectors.
It is suggested that as a pipe nears the end of its service life, internal welding of slow growth cracks may extend culvert life by 20%. Developers have also observed that slow growth cracks typically form in the inside wall of a dual walled pipe, which does not affect structural strength. They expect that a dual walled pipe will last an additional 25 years without maintenance after the inside wall has cracked.
3.4 Miscellaneous Contacts
Efforts were made to contact several out of state DOTs. The Florida DOT (FDOT) was the only responsive DOT. The discussion with FDOT focused on the use of plastic pipe. FDOT has two classes of dual-walled HDPE pipe. Class I has a 50-year service life and Class II has a 100-year service life. In order for a pipe to achieve a 100-year service life, tests are required to determine its crack free service life, oxidation resistance, and long-term modulus. The test procedures used by FDOT are FM 5-572, FM 5-573, FM 5-574, and FM 5-577 (FDOT 2008a-d).
For 100-year service life pipes, oxidation is typically the limiting factor. The FDOT testing methods uses a rate process method equation to predict crack free service life and the Arrhenius equation to extrapolate the antioxidant depletion rate. Both of these methods depend on ambient site temperatures. For both models HDPE pipe will perform better under cooler conditions, implying that FDOT Class II HDPE pipes will have longer service lives in Minnesota then in Florida.
The biggest challenge that FDOT has had using their testing method has been keeping the approved products list up to date. A supplier qualifies a product as Class II using a given resin and anti-oxidant. The question remains, how much of a change to the formula qualifies as a new mix that requires a new set of tests?
FDOT was unable to postulate about the influence of freeze/thaw cycles on HDPE durability. It was suggested to I contact the Pennsylvania DOT who adopted the FDOT method and Dr. Grace Hsuan from Drexel University who helped develop the FDOT and PennDOT protocols. PennDOT did not respond to requests to discuss their testing protocol.
Dr. Hsuan’s response was limited as she was out of the country at the time I contacted her. She did state that HDPE is not as sensitive to freeze/thaw cycles as concrete, but she has written two papers documenting the phenomena.
15
16
Chapter 4. Database Identification and Evaluation
The data needs for this project provide a unique challenge. Watersheds flowing into MnDOT culverts are typically very small when compared to the typical stream-gauged watershed. In fact, the majority of culverts do not contain continual flow and are therefore difficult to gauge at all. The site characteristics also have the potential to be highly variable from one culvert to the next. The ideal database would need to contain high resolution data at small, culvert-watershed scales. Due to funding and data capacity restrictions most databases have either a few sites with extensive data or many sites with less detailed data. This section will review the most likely sources of data.
U.S. Geological Survey (USGS): The USGS data base provides water pH data for 13 stream sites in the state. Water pH monitoring has been for short term projects. Water conductance data is available for 42 sites. On the whole this database is not suitable for this project because the data is too sparse and the stream sizes are too large.
Minnesota Pollution Control Agency (MPCA): The MPCA has collected extensive shallow ground water data throughout the state; however, their focus has been on urban and undeveloped areas. Their shallow groundwater data is available as part of the Ambient Groundwater Network, and contains data on conductivity, pH, and temperature. This data is being assembled by MPCA staff and will be made available in mid-October 2011. The MPCA does not have a readily available collection of surface water data. Individual watershed districts collect their time series data and store them in house. Data collected by the watersheds is for streams larger than the culvert scale. Much of this data has not yet undergone post processing. The MPCA has invested in a database called EQUIS. They hope to have the site up and running by the end of 2011. The EQUIS site is intended to be a state wide database where multiple agencies can share and compile time series data. The EQUIS database will contain most of the surface water data available through the MPCA and their affiliates.
National Oceanic and Atmospheric Administration (NOAA): NOAA has developed a rainfall frequency atlas (TP 40) for the United State (Hershfield 1961). The NOAA rainfall atlas for the state of Minnesota is currently being reevaluated. The new rainfall atlas is expected to be published in the summer of 2012. The rainfall depth-duration frequencies for Minnesota are expected to change/increase with the new atlas.
Minnesota DOT Mn/Road: The Mn/Road facility installed and monitored several culverts. An information request has been made, and we are awaiting a reply.
Natural Resources Conservation Service (NRCS) Web Soil Survey (WSS): The NRCS has soil data for the entire state of Minnesota. The WSS database is based on data from county soil surveys. The WSS provides culvert-watershed scale data on typical land slopes, soil pH, soil resistivity, risk of corrosion, hydraulic conductivity, and many other development and engineering properties. The data sets are typically not complete in urban areas. The data is not based on direct measurements, but on typical values for the soil types present at the site. It is expected that runoff water pH and resistivity are related to soil pH and resistivity. It may be

17
possible to develop a correlation between the two such that the soil data from the WSS could be used in lieu of direct measurements taken from the site.
District 3 pH Map: District 3 has a map highlighting sample locations with pH measurements. This map could be compared with the NRCS WSS as a spot check of the accuracy of soil classifications.
Minnesota Geospatial Information Office (MnGeo): MnGeo has maps of state geology data. This is coarse data of bedrock geology and hydrogeology as well as quaternary geology and hydrogeology. The maps are available as GIS files. These maps could be used to look at general trends between geology, slopes, and material failure types such as joint separations.
Minnesota Department of Natural Resources (MnDNR): MnDNR data will be incorporated into the MPCA EQUIS database. In response to an inquiry about water quality data, MnDNR defers to the MPCA because they are compiling the EQUIS database.
Minnesota DOT HydInfra Database: The HydInfra base contains inspection records from over 95,000 pipes within the MnDOT right-of-way. The database records pipe type, size, location, and overall condition. There is also a record of types of damage to the pipe, types of damage to the road, maintenance concerns, and failure modes. The HydInfra database will be the primary source for the analysis portion of this project. The one key piece of information the HydInfra database is missing is the installation dates of the pipes.

18
Chapter 5. Data Analysis
Data analysis focused on two tasks determining typical site condition for Minnesota to determine expected steel pipe life via the California Method and examining the HydInfra Database for MnDOT pipe trends for all types of materials.
5.1 Site Characteristics for Steel Pipe Life Determination
The site characteristics needed for the California Method are water pH and resistivity. Collecting this data in the field is not practical. The Natural Resources Conservation Service (NRCS) Web Soil Survey (WSS) has the highest spatial resolution for pH and resistivity. This database provides soil characteristics only and pH and conductivity are approximated from the soil type. Resistivity is the reciprocal of conductivity. It is hypothesized that water pH and resistivity are greatly influenced by the adjacent soil properties and, therefore, may be used to determine expected steel pipe life. In this section, the accuracy of the WSS will be measured against other available sources of pH and resistivity data.
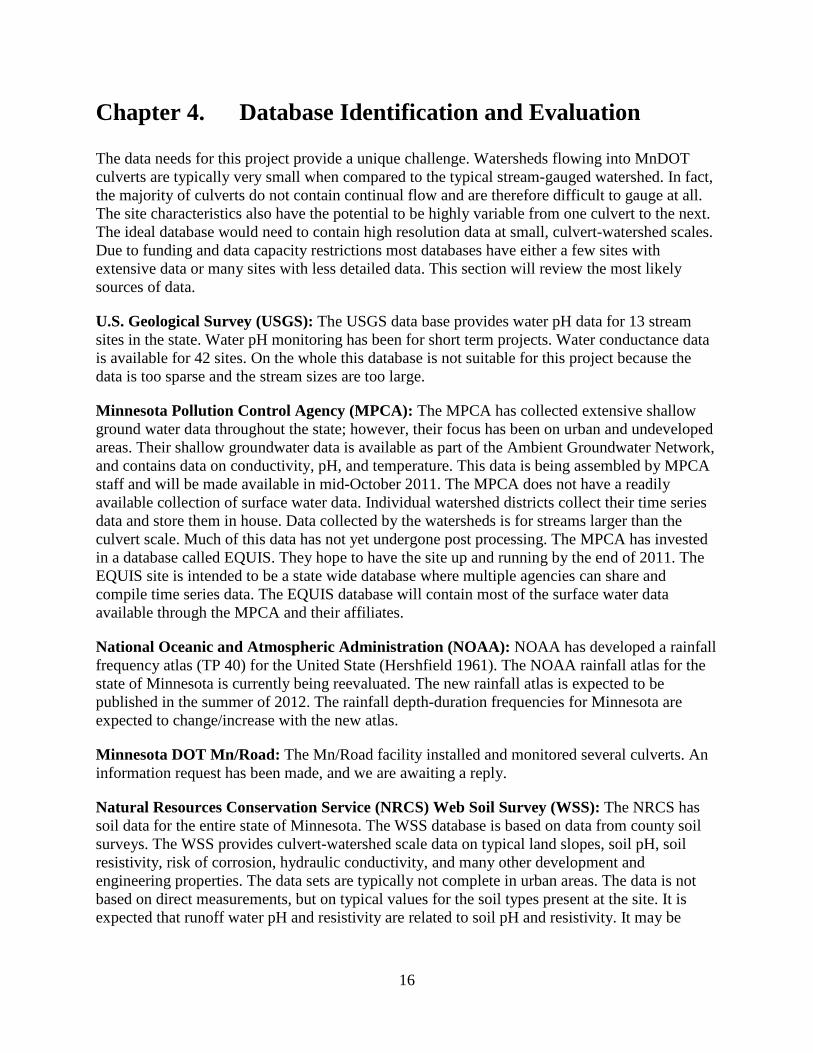
5.1.1 District 3 Soil Map
District 3 has a soil map with measured pH. Table 1 provides a comparison of pH between the District 3 soil map and WSS data taken at the same locations. The District 3 soil map is provided in Appendix B, and the 12 comparison locations are marked. Figure 1 plots the pH from the WSS against the pH from the District 3 soil map. In Figure 1 a perfect correlation between the two data sets would yield a trend line slope of 1. Figure 1 shows that the WSS predicts a lower pH of the soil. Research has indicated that water pH can affect the useful service life; consequently, the WSS would predict a shorter steel pipe life than the District 3 soil map. Based on the California Methods the pH change from 6.5 to 7.0 would yield a 5 year increase in the predicted service life of 16-gage galvanized steel pipe.
Table 1 – District 3 soil map comparisons
Location NRCS pH Map pH % Difference1 6.2 7.3 16.3%1 6.2 6.8 9.2%2 5.9 6.3 6.6%3 5.8 5.9 1.7%4 6 6.2 3.3%5 6.21 7.4 17.5%6 6.52 7.4 12.6%7 6.02 6.4 6.1%8 6.78 7.7 12.7%9 5.85 6.5 10.5%10 6.43 7.5 15.4%11 6.05 6.4 5.6%12 5.67 6.1 7.3%
19
Figure 1 – pH comparison plot
y = 1.78x - 4.15R² = 0.81
5
6
7
8
5 6 7 8
Dist
rict 3
Map
pH
NRCS pH
pH Comparison:NRCS vs District 3 Map
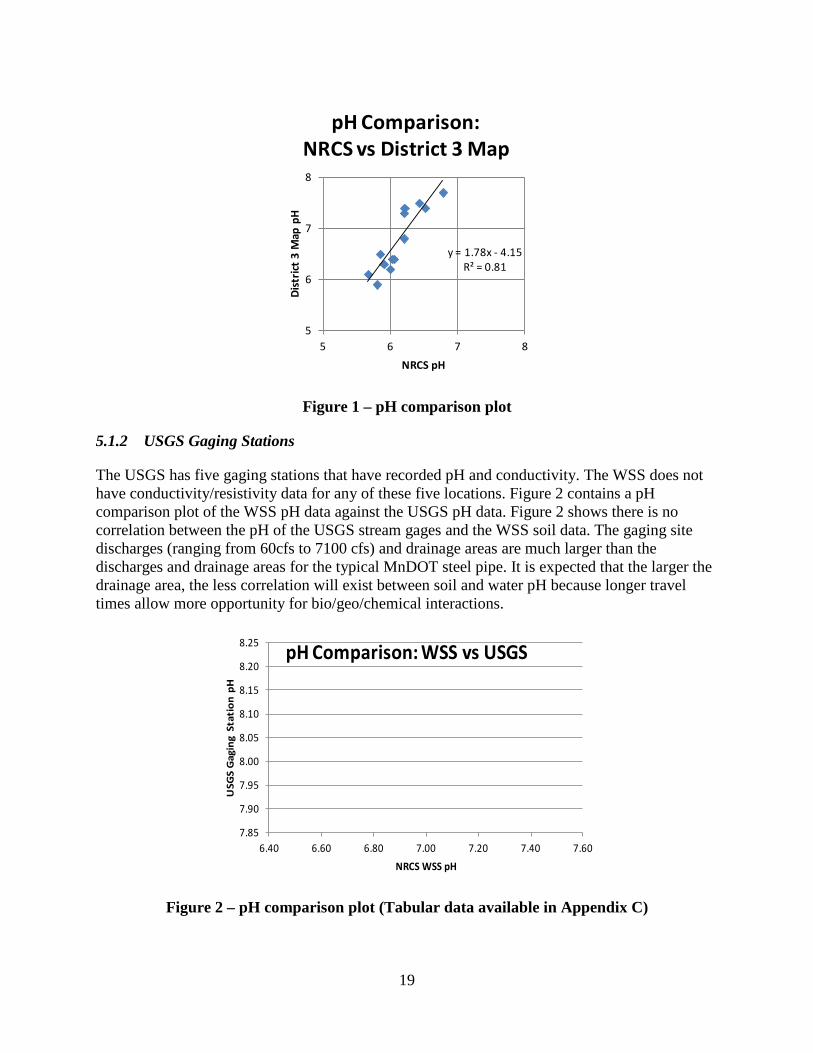
5.1.2 USGS Gaging Stations
The USGS has five gaging stations that have recorded pH and conductivity. The WSS does not have conductivity/resistivity data for any of these five locations. Figure 2 contains a pH comparison plot of the WSS pH data against the USGS pH data. Figure 2 shows there is no correlation between the pH of the USGS stream gages and the WSS soil data. The gaging site discharges (ranging from 60cfs to 7100 cfs) and drainage areas are much larger than the discharges and drainage areas for the typical MnDOT steel pipe. It is expected that the larger the drainage area, the less correlation will exist between soil and water pH because longer travel times allow more opportunity for bio/geo/chemical interactions.
Figure 2 – pH comparison plot (Tabular data available in Appendix C)
7.85
7.90
7.95
8.00
8.05
8.10
8.15
8.20
8.25
6.40 6.60 6.80 7.00 7.20 7.40 7.60
USG
S G
agin
g St
atio
n pH
NRCS WSS pH
pH Comparison: WSS vs USGS
20
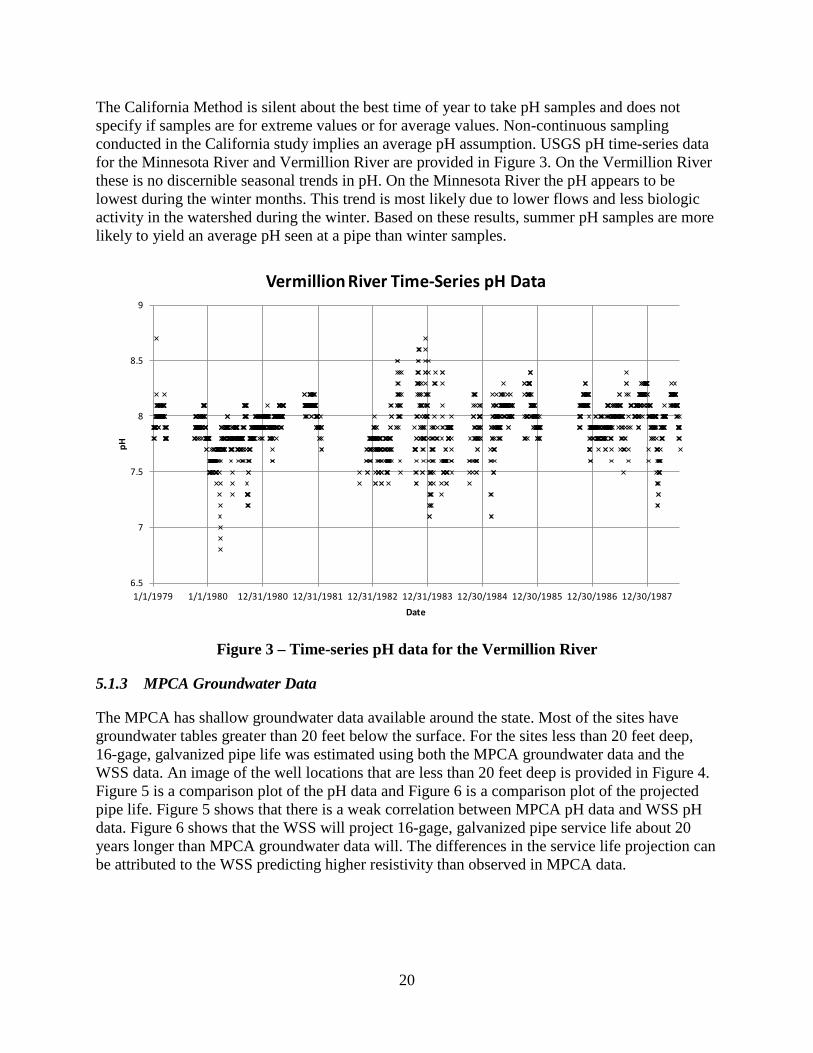
The California Method is silent about the best time of year to take pH samples and does not specify if samples are for extreme values or for average values. Non-continuous sampling conducted in the California study implies an average pH assumption. USGS pH time-series data for the Minnesota River and Vermillion River are provided in Figure 3. On the Vermillion River these is no discernible seasonal trends in pH. On the Minnesota River the pH appears to be lowest during the winter months. This trend is most likely due to lower flows and less biologic activity in the watershed during the winter. Based on these results, summer pH samples are more likely to yield an average pH seen at a pipe than winter samples.
6.5
7
7.5
8
8.5
9
1/1/1979 1/1/1980 12/31/1980 12/31/1981 12/31/1982 12/31/1983 12/30/1984 12/30/1985 12/30/1986 12/30/1987
pH
Date
Vermillion River Time-Series pH Data
Figure 3 – Time-series pH data for the Vermillion River
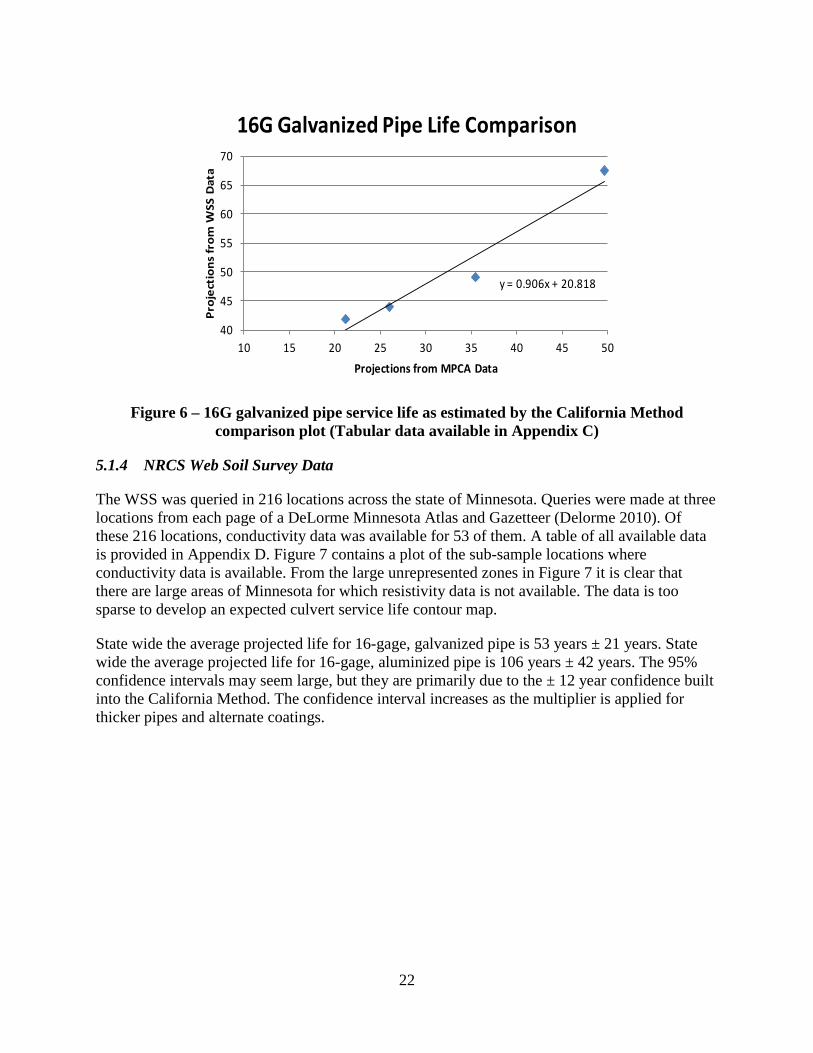
5.1.3 MPCA Groundwater Data
The MPCA has shallow groundwater data available around the state. Most of the sites have groundwater tables greater than 20 feet below the surface. For the sites less than 20 feet deep, 16-gage, galvanized pipe life was estimated using both the MPCA groundwater data and the WSS data. An image of the well locations that are less than 20 feet deep is provided in Figure 4. Figure 5 is a comparison plot of the pH data and Figure 6 is a comparison plot of the projected pipe life. Figure 5 shows that there is a weak correlation between MPCA pH data and WSS pH data. Figure 6 shows that the WSS will project 16-gage, galvanized pipe service life about 20 years longer than MPCA groundwater data will. The differences in the service life projection can be attributed to the WSS predicting higher resistivity than observed in MPCA data.

21
© 2011 Google – Map data © 2011 Google
Figure 4 – MPCA shallow groundwater sampling locations with groundwater tables less than 20 feet deep
Figure 5 – pH comparison plot between MPCA and WSS for the Figure 4 sampling
locations (Tabular data available in Appendix C)
y = 0.4632x + 3.3959
5.0
5.5
6.0
6.5
7.0
7.5
8.0
5 5.5 6 6.5 7 7.5 8
WSS
pH
MPCA pH
pH Comparison: WSS vs MPCA
22
Figure 6 – 16G galvanized pipe service life as estimated by the California Method
comparison plot (Tabular data available in Appendix C)
y = 0.906x + 20.818
40
45
50
55
60
65
70
10 15 20 25 30 35 40 45 50
Proj
ecti
ons
from
WSS
Dat
a
Projections from MPCA Data
16G Galvanized Pipe Life Comparison
5.1.4 NRCS Web Soil Survey Data
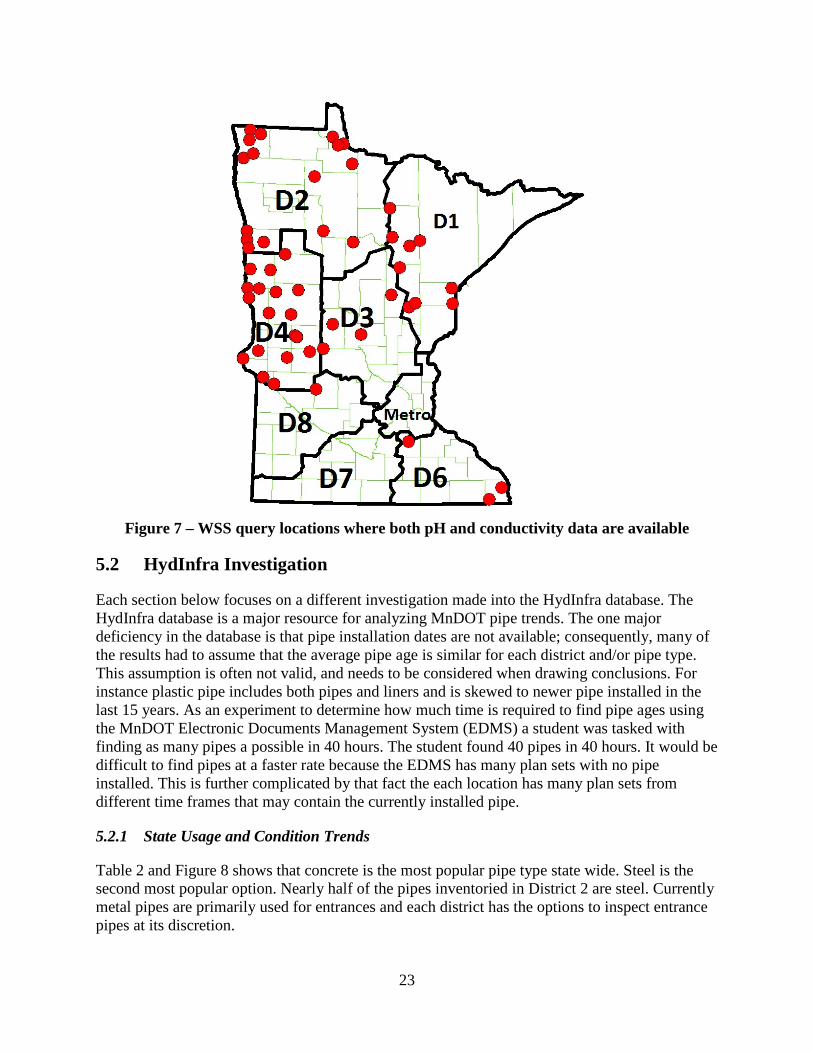
The WSS was queried in 216 locations across the state of Minnesota. Queries were made at three locations from each page of a DeLorme Minnesota Atlas and Gazetteer (Delorme 2010). Of these 216 locations, conductivity data was available for 53 of them. A table of all available data is provided in Appendix D. Figure 7 contains a plot of the sub-sample locations where conductivity data is available. From the large unrepresented zones in Figure 7 it is clear that there are large areas of Minnesota for which resistivity data is not available. The data is too sparse to develop an expected culvert service life contour map.
State wide the average projected life for 16-gage, galvanized pipe is 53 years ± 21 years. State wide the average projected life for 16-gage, aluminized pipe is 106 years ± 42 years. The 95% confidence intervals may seem large, but they are primarily due to the ± 12 year confidence built into the California Method. The confidence interval increases as the multiplier is applied for thicker pipes and alternate coatings.
23
Figure 7 – WSS query locations where both pH and conductivity data are available
5.2 HydInfra Investigation
Each section below focuses on a different investigation made into the HydInfra database. The HydInfra database is a major resource for analyzing MnDOT pipe trends. The one major deficiency in the database is that pipe installation dates are not available; consequently, many of the results had to assume that the average pipe age is similar for each district and/or pipe type. This assumption is often not valid, and needs to be considered when drawing conclusions. For instance plastic pipe includes both pipes and liners and is skewed to newer pipe installed in the last 15 years. As an experiment to determine how much time is required to find pipe ages using the MnDOT Electronic Documents Management System (EDMS) a student was tasked with finding as many pipes a possible in 40 hours. The student found 40 pipes in 40 hours. It would be difficult to find pipes at a faster rate because the EDMS has many plan sets with no pipe installed. This is further complicated by that fact the each location has many plan sets from different time frames that may contain the currently installed pipe.
5.2.1 State Usage and Condition Trends
Table 2 and Figure 8 shows that concrete is the most popular pipe type state wide. Steel is the second most popular option. Nearly half of the pipes inventoried in District 2 are steel. Currently metal pipes are primarily used for entrances and each district has the options to inspect entrance pipes at its discretion.
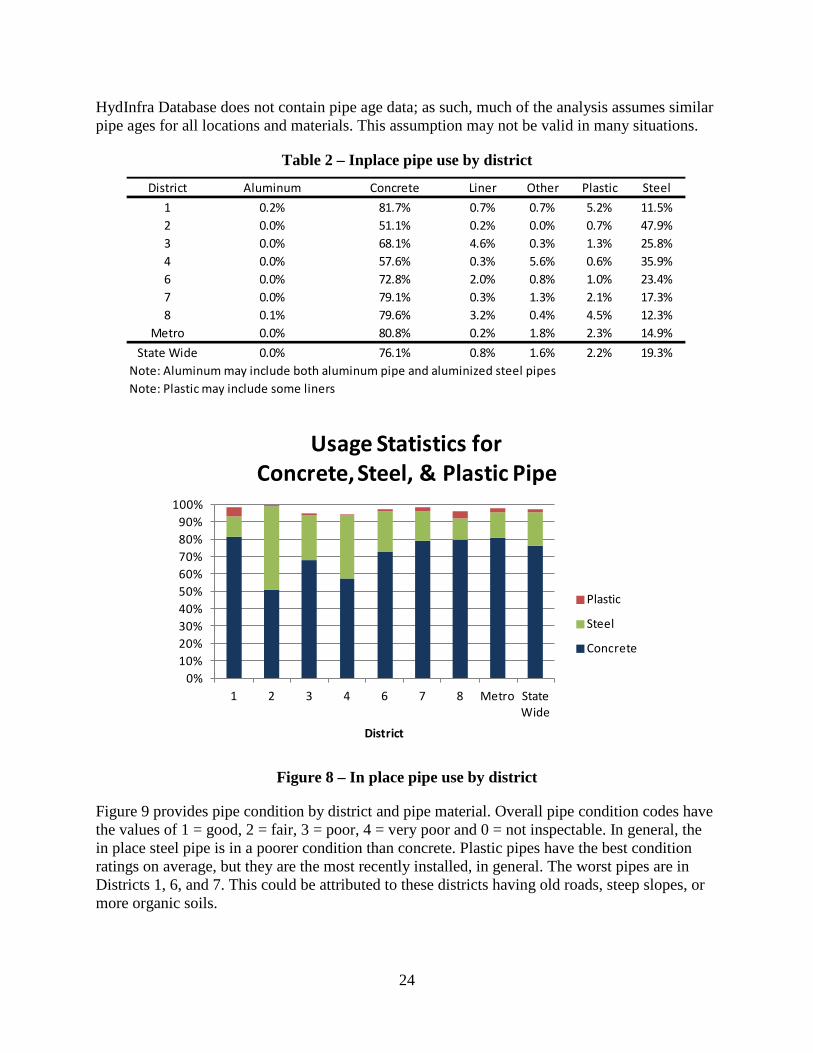
24
HydInfra Database does not contain pipe age data; as such, much of the analysis assumes similar pipe ages for all locations and materials. This assumption may not be valid in many situations.
Table 2 – Inplace pipe use by district
District Aluminum Concrete Liner Other Plastic Steel1 0.2% 81.7% 0.7% 0.7% 5.2% 11.5%2 0.0% 51.1% 0.2% 0.0% 0.7% 47.9%3 0.0% 68.1% 4.6% 0.3% 1.3% 25.8%4 0.0% 57.6% 0.3% 5.6% 0.6% 35.9%6 0.0% 72.8% 2.0% 0.8% 1.0% 23.4%7 0.0% 79.1% 0.3% 1.3% 2.1% 17.3%8 0.1% 79.6% 3.2% 0.4% 4.5% 12.3%
Metro 0.0% 80.8% 0.2% 1.8% 2.3% 14.9%State Wide 0.0% 76.1% 0.8% 1.6% 2.2% 19.3%
Note: Aluminum may include both aluminum pipe and aluminized steel pipesNote: Plastic may include some liners
0%10%20%30%40%50%60%70%80%90%
100%
1 2 3 4 6 7 8 Metro State Wide
District
Usage Statistics forConcrete, Steel, & Plastic Pipe
Plastic
Steel
Concrete
Figure 8 – In place pipe use by district
Figure 9 provides pipe condition by district and pipe material. Overall pipe condition codes have the values of 1 = good, 2 = fair, 3 = poor, 4 = very poor and 0 = not inspectable. In general, the in place steel pipe is in a poorer condition than concrete. Plastic pipes have the best condition ratings on average, but they are the most recently installed, in general. The worst pipes are in Districts 1, 6, and 7. This could be attributed to these districts having old roads, steep slopes, or more organic soils.
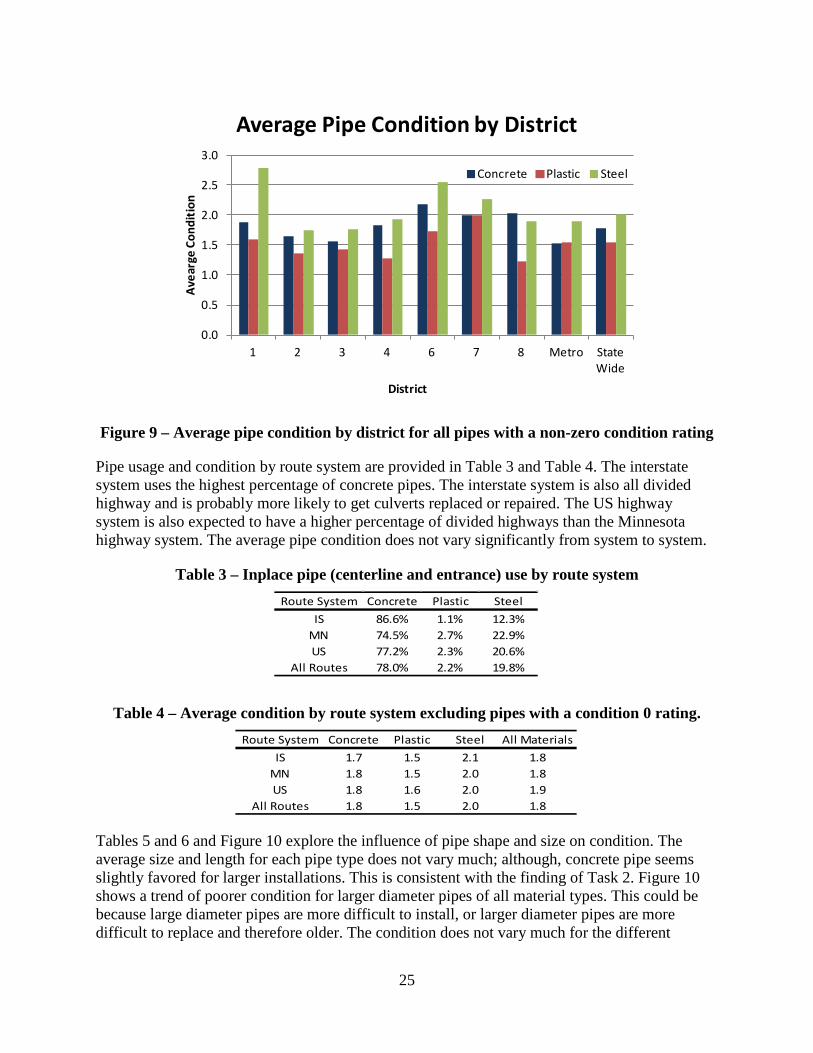
25
Figure 9 – Average pipe condition by district for all pipes with a non-zero condition rating
0.0
0.5
1.0
1.5
2.0
2.5
3.0
1 2 3 4 6 7 8 Metro State Wide
Avea
rge
Cond
ition
District
Average Pipe Condition by District
Concrete Plastic Steel
Pipe usage and condition by route system are provided in Table 3 and Table 4. The interstate system uses the highest percentage of concrete pipes. The interstate system is also all divided highway and is probably more likely to get culverts replaced or repaired. The US highway system is also expected to have a higher percentage of divided highways than the Minnesota highway system. The average pipe condition does not vary significantly from system to system.
Table 3 – Inplace pipe (centerline and entrance) use by route system Route System Concrete Plastic Steel
IS 86.6% 1.1% 12.3%MN 74.5% 2.7% 22.9%US 77.2% 2.3% 20.6%
All Routes 78.0% 2.2% 19.8%
Table 4 – Average condition by route system excluding pipes with a condition 0 rating. Route System Concrete Plastic Steel All Materials
IS 1.7 1.5 2.1 1.8MN 1.8 1.5 2.0 1.8US 1.8 1.6 2.0 1.9
All Routes 1.8 1.5 2.0 1.8
Tables 5 and 6 and Figure 10 explore the influence of pipe shape and size on condition. The average size and length for each pipe type does not vary much; although, concrete pipe seems slightly favored for larger installations. This is consistent with the finding of Task 2. Figure 10 shows a trend of poorer condition for larger diameter pipes of all material types. This could be because large diameter pipes are more difficult to install, or larger diameter pipes are more difficult to replace and therefore older. The condition does not vary much for the different

26
concrete pipe shapes. Elliptical concrete pipes are the exception. The lower condition for elliptical concrete is most likely due to a much smaller sampling size. It should be noted that shape is reflective of the current installed shape and the not designed shape. For example, there has not been elliptic or arch plastic pipe specified in any MnDOT plans. Plastic pipe listed as elliptic and arch plastic pipe are likely actually deformed pipes or liners that have been molded to elliptic or arch pipes.
Table 5 – Average pipe size
Material Average Diameter (in) Average Length (ft)
Concrete 24.6 88
Plastic 17.5 74
Steel 22.6 67
Figure 10 – Average condition by pipe diameter for all pipes excluding pipes with a
condition 0 rating.
Table 6 – Average condition by pipe shape for concrete and steel pipes (excluding pipes with a condition 0 rating)
Pipe Shape Concrete Steel
Arch 1.8 2.1
Box 1.9 2.7
Elliptical 1.5 2.0
Round 1.8 2.0

27
5.2.2 Cause of Road Damage
For the purpose of this report road damage is defined as a HydInfra Flag for either void in road or road distress or both. Table 7 provides data on road damage by material type. Concrete pipe are correlated with the highest incidence of road damage. This finding is, however, in contrast with observation made by maintenance. It may be that concrete joint separations allow a better view of lost soil, so void is more often noted. Steel culvert failure is not localized to joints and often causes larger depressions that transition with the road length and, therefore, is not noticible to the visual inspection of the HydInfra inspectors. Plastic pipe correlate with lowest incidence of road damage, but is the newest pipe material in the ground, on average, and there are very few of them. In addition plastic pipe includes both liner and pipes. Liners would not be expected to correlate well with road damage since damage may have occurred before the liner was installed or the road and liner may have been recently installed. Table 8 further breaks down the incidence of road damage by pipe condition. The base line percentage of road damage for pipe in good condition is 3-5%. At these sites the road damage may be due to factors other than the pipe, pipe problems that are not visible, or the inspector error.
Worse condition plastic pipes are more likely to be associated with road damage than concrete or steel pipe. It is unexpected, however, that condition 3 plastic pipe are more likely to be associated with road damage than condition 4 plastic pipe. This could indicate that the differences between condition 3 and 4 plastic pipe are not well understood or not well defined.
There are several caveats that need to be considered in this analysis. Firstly, plastic pipe is generally younger than steel and concrete pipe. Secondly, the sample sizes for plastic pipe are small. Thirdly not all plastic pipe are the same. To get meaningful results the data will need to separated liners and pipe, as well as PVC and HDPE. Data collection procedures have been updated so that in the future specific types of plastic pipe will be able to be analyzed. The definitive message is that condition 3 and 4 pipes are most likely to correspond to road damage. In other words, inspectors are correctly identifying poor condition pipes.
Table 7 – Road damage trends by material for all pipes excluding pipes with a condition 0 rating
Material No Damage Distress Only Void Only Both Any Damage % of Pipes w/Road DamageConcrete 35788 1529 371 271 2171 5.7%
Plastic 1194 44 5 3 52 4.2%Steel 13211 640 56 80 776 5.5%
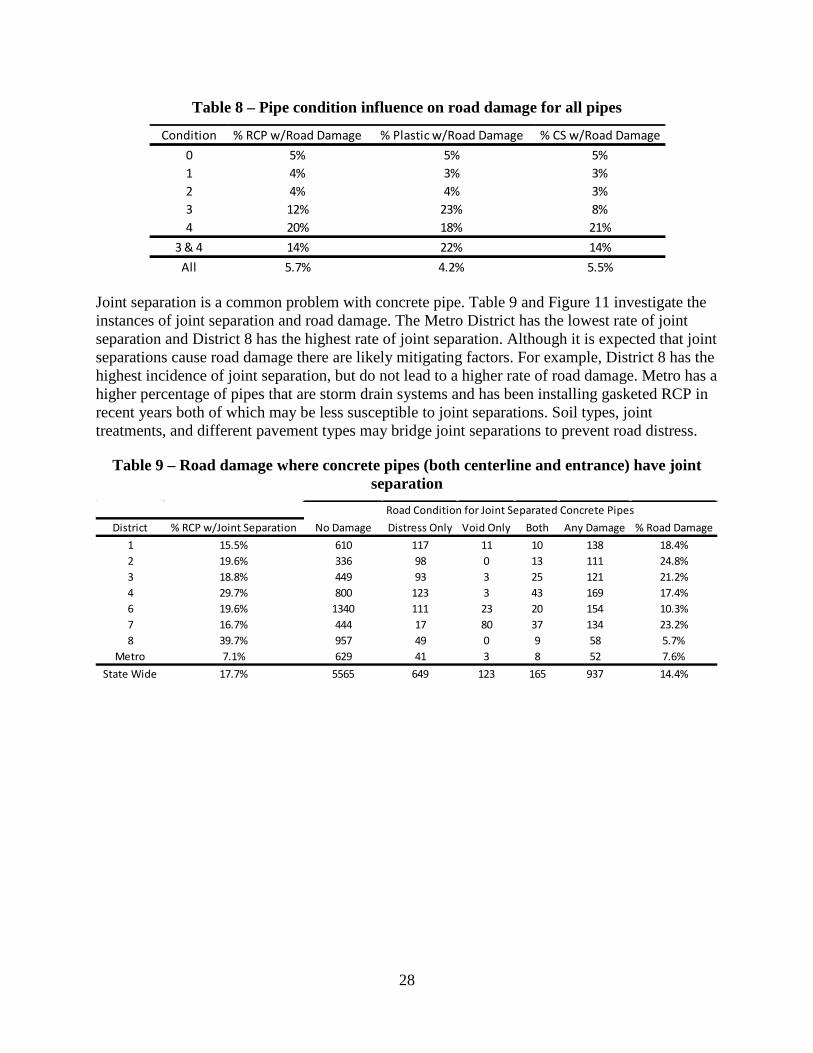
28
Table 8 – Pipe condition influence on road damage for all pipes
Condition % RCP w/Road Damage % Plastic w/Road Damage % CS w/Road Damage0 5% 5% 5%1 4% 3% 3%2 4% 4% 3%3 12% 23% 8%4 20% 18% 21%
3 & 4 14% 22% 14%All 5.7% 4.2% 5.5%
Joint separation is a common problem with concrete pipe. Table 9 and Figure 11 investigate the instances of joint separation and road damage. The Metro District has the lowest rate of joint separation and District 8 has the highest rate of joint separation. Although it is expected that joint separations cause road damage there are likely mitigating factors. For example, District 8 has the highest incidence of joint separation, but do not lead to a higher rate of road damage. Metro has a higher percentage of pipes that are storm drain systems and has been installing gasketed RCP in recent years both of which may be less susceptible to joint separations. Soil types, joint treatments, and different pavement types may bridge joint separations to prevent road distress.
Table 9 – Road damage where concrete pipes (both centerline and entrance) have joint separation
District % RCP w/Joint Separation No Damage Distress Only Void Only Both Any Damage % Road Damage1 15.5% 610 117 11 10 138 18.4%2 19.6% 336 98 0 13 111 24.8%3 18.8% 449 93 3 25 121 21.2%4 29.7% 800 123 3 43 169 17.4%6 19.6% 1340 111 23 20 154 10.3%7 16.7% 444 17 80 37 134 23.2%8 39.7% 957 49 0 9 58 5.7%
Metro 7.1% 629 41 3 8 52 7.6%State Wide 17.7% 5565 649 123 165 937 14.4%
Road Condition for Joint Separated Concrete Pipes

29
Figure 11 –Road damage where concrete pipes (both centerline and entrance) haves joint
separation
Concrete Pipe Joint Separation& Road Damage
No Joint Separation
Separation w/No Damage
Separation w/Distress
Separation w/Void
Separation w/Distress and Void
Incidences of road damage do seem to depend on pipe diameter (Figure 12). Large spikes up and down in Figure 12 are due to small sample sizes. Medium sized pipe have highest probability of road damage. One possible explanation is that the larger pipe size the more material is displaces and the higher the risk is of soil shifting causing road damage; however larger pipes also get more vigorous testing and inspection. Medium pipes displace a significant amount of material, but their common use (Table 5) reduces the amount of inspection and testing they receive.
Figure 12 – Tendencies of road damage for various pipe sizes (both centerline and
entrance)
0%
2%
4%
6%
8%
10%
12%
14%
12 15 18 24 30 36 42 48 54 60 72
% P
ipes
w/R
oad
Dam
age
Pipe Diameter (in)
Trends in Pipe Size and Road Damage
Concrete Pipe Plastic Pipe Steel Pipe

30
5.2.3 Impact of Standing Water
Tables 10 and 11 focus on the impact of water on steel and concrete pipe. For both materials the presence of standing water correlates to degraded pipe; however, steel pipe has a stronger condition response. Standing water corresponds to a higher likelihood of holes in steel pipe and joint separation and/or misalignment in concrete pipes.
Table 10 – Impact of standing water on steel pipe holes and overall pipe condition for all pipes excluding pipes with a condition 0 rating
Table 11 – Impact of standing water on concrete pipe joint separation, misalignment, and overall pipe condition for all pipes excluding pipes with a condition 0 rating
Standing water % With Holes Average ConditionNo 11% 2.08Yes 17% 2.22
Standing water % Joint Seperation % Misaligned Average ConditionNo 16.0% 4.7% 1.92Yes 24.8% 7.2% 2.02
5.2.4 HydInfra Rating Trends
Table 12 tells very little about pipe trends, but it is telling of HydInfra inspection trends. For the most part, ratings are consistent with the HydInfra Ratings Guide. The exception is the Void in Road flag. The ratings guide identifies a void in the road a “very poor condition” (Condition 4); however, the average conditions for the Void in Road flag is at or below condition 3. It is possible that the Void in Road Flag is being checked as “yes” when there is a void in road but the cause is not believed to be from the pipe.
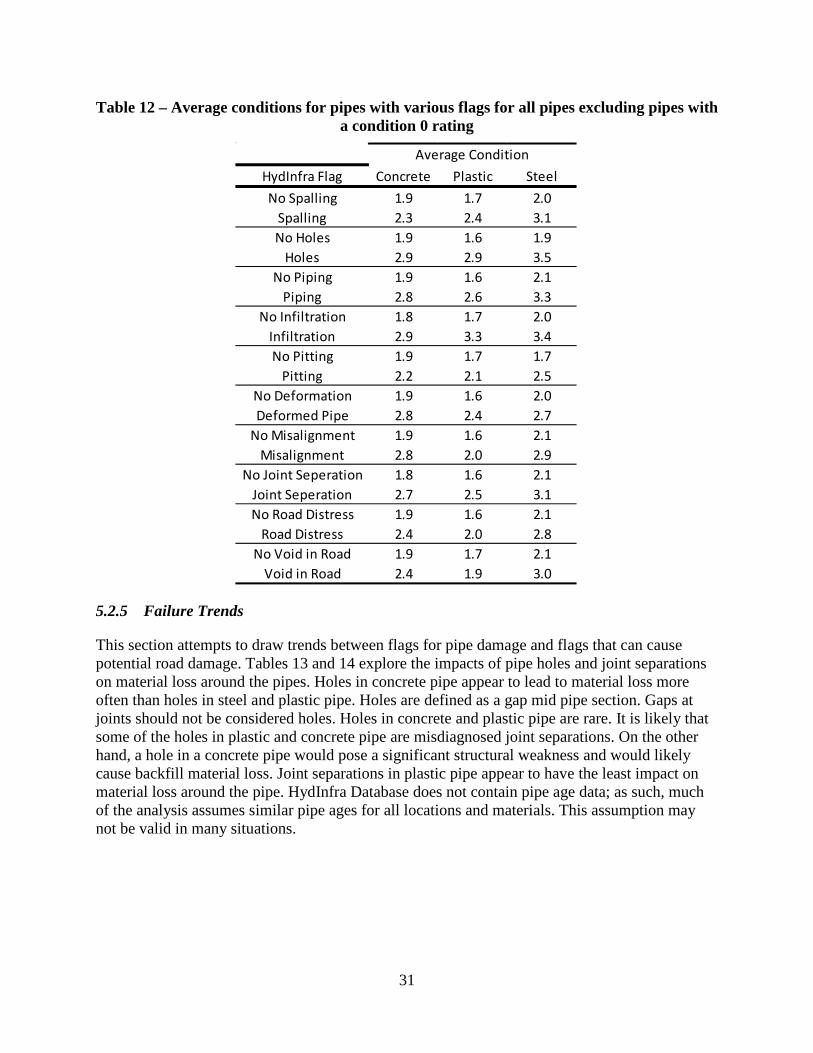
31
Table 12 – Average conditions for pipes with various flags for all pipes excluding pipes with a condition 0 rating
HydInfra Flag Concrete Plastic SteelNo Spalling 1.9 1.7 2.0
Spalling 2.3 2.4 3.1No Holes 1.9 1.6 1.9
Holes 2.9 2.9 3.5No Piping 1.9 1.6 2.1
Piping 2.8 2.6 3.3No Infiltration 1.8 1.7 2.0
Infiltration 2.9 3.3 3.4No Pitting 1.9 1.7 1.7
Pitting 2.2 2.1 2.5No Deformation 1.9 1.6 2.0Deformed Pipe 2.8 2.4 2.7
No Misalignment 1.9 1.6 2.1Misalignment 2.8 2.0 2.9
No Joint Seperation 1.8 1.6 2.1Joint Seperation 2.7 2.5 3.1No Road Distress 1.9 1.6 2.1
Road Distress 2.4 2.0 2.8No Void in Road 1.9 1.7 2.1
Void in Road 2.4 1.9 3.0
Average Condition
5.2.5 Failure Trends
This section attempts to draw trends between flags for pipe damage and flags that can cause potential road damage. Tables 13 and 14 explore the impacts of pipe holes and joint separations on material loss around the pipes. Holes in concrete pipe appear to lead to material loss more often than holes in steel and plastic pipe. Holes are defined as a gap mid pipe section. Gaps at joints should not be considered holes. Holes in concrete and plastic pipe are rare. It is likely that some of the holes in plastic and concrete pipe are misdiagnosed joint separations. On the other hand, a hole in a concrete pipe would pose a significant structural weakness and would likely cause backfill material loss. Joint separations in plastic pipe appear to have the least impact on material loss around the pipe. HydInfra Database does not contain pipe age data; as such, much of the analysis assumes similar pipe ages for all locations and materials. This assumption may not be valid in many situations.

32
Table 13 – Percent of pipes with holes that have backfill material loss
Table 14 – Percent of pipes (both centerline and entrance) with joint separations that have backfill material loss
Figure 13 – Influence of cover depth on concrete pipe damage for all pipes
Material Infiltration Piping Any LossConcrete 55% 19% 59%
Plastic 35% 15% 45%Steel 23% 15% 31%
Pipes with Holes
Material Infiltration Piping Any LossConcrete 58% 7% 59%
Plastic 23% 12% 27%Steel 56% 17% 58%
Pipes with Joint Separations
The influence of cover depth on concrete and steel pipe damage is reviewed in Figures 13 and 14. For concrete pipe the number of joint separations increase with the first 20 feet of cover. Cracks also increase with depth, but road distress and road voids both decrease with increasing cover. It is expected that there is less road damage for pipe with higher cover depth. For higher cover depths there is more soil matrix above the pipe to bridge the small scale voids caused by material shifting around the pipe. Higher cover depth also apply more earth pressure to the pipes; thereby resisting pipe movement. For steel pipe joint separation and cracks increase with increasing cover depth; however, deformation, road distress, and road voids all decrease with increasing cover depth.
0%
5%
10%
15%
20%
25%
30%
0 - 2 Feet 2 - 6 Feet 6 - 10 Feet 10 - 20 Feet Over 20 Feet
Cover Depth and Concrete Pipe Damage
Joint Separation Cracks Deformation Road Distress Void in Road
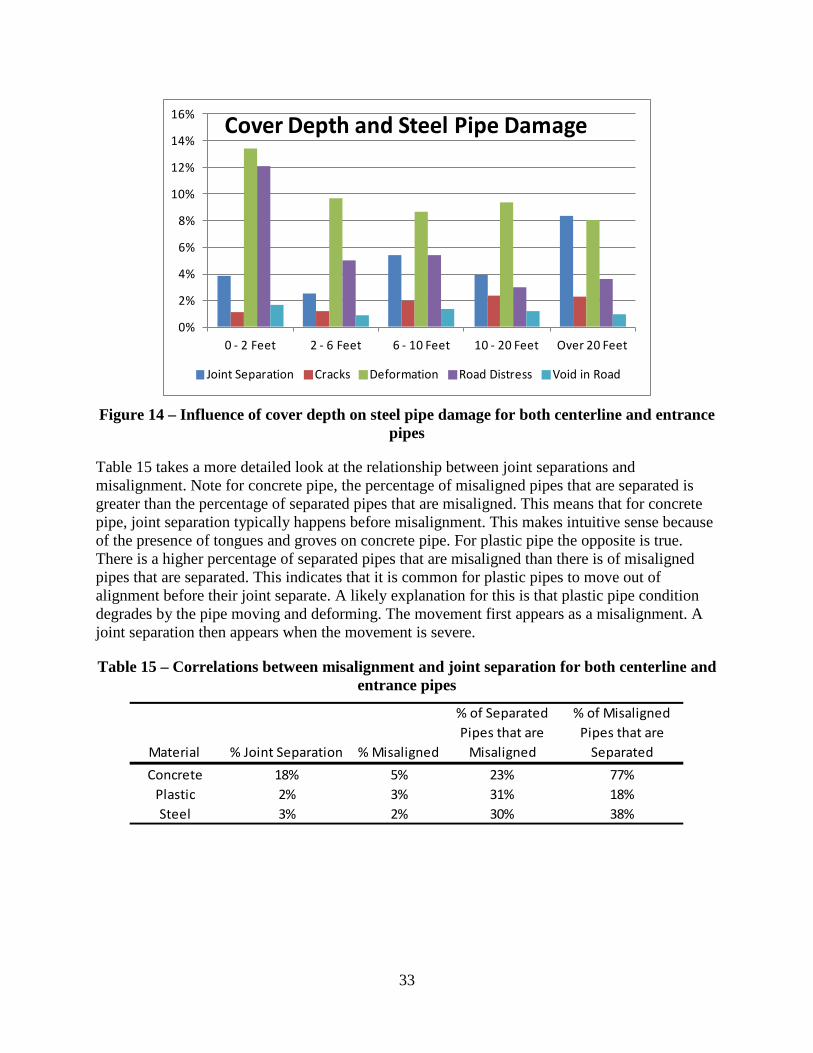
33
Figure 14 – Influence of cover depth on steel pipe damage for both centerline and entrance
pipes
0%
2%
4%
6%
8%
10%
12%
14%
16%
0 - 2 Feet 2 - 6 Feet 6 - 10 Feet 10 - 20 Feet Over 20 Feet
Cover Depth and Steel Pipe Damage
Joint Separation Cracks Deformation Road Distress Void in Road
Table 15 takes a more detailed look at the relationship between joint separations and misalignment. Note for concrete pipe, the percentage of misaligned pipes that are separated is greater than the percentage of separated pipes that are misaligned. This means that for concrete pipe, joint separation typically happens before misalignment. This makes intuitive sense because of the presence of tongues and groves on concrete pipe. For plastic pipe the opposite is true. There is a higher percentage of separated pipes that are misaligned than there is of misaligned pipes that are separated. This indicates that it is common for plastic pipes to move out of alignment before their joint separate. A likely explanation for this is that plastic pipe condition degrades by the pipe moving and deforming. The movement first appears as a misalignment. A joint separation then appears when the movement is severe.
Table 15 – Correlations between misalignment and joint separation for both centerline and entrance pipes
Material % Joint Separation % Misaligned
% of Separated Pipes that are
Misaligned
% of Misaligned Pipes that are
SeparatedConcrete 18% 5% 23% 77%
Plastic 2% 3% 31% 18%Steel 3% 2% 30% 38%

34
Chapter 6. Conclusions & Recommendations
This section is broken down into several sub-sections, starting with general conclusions and recommendations. Next, each pipe material is discussed. Final, the conclusions from the HydInfra database are discussed separately.
6.1 General
Highway surface is replaced/repaired to increase its life, but road core is not; so pipes need to last longer than the surface (sec 2.1). Most MnDOT districts agree that design life of 100 years is desirable for mainline culverts (sec 3.1.1). Entrance culverts are more readily replaced by maintenance crews (sec 3.1.6). We recommend a design service life of 100 years for centerline and mainline T.H. culverts and a design service life of 50-75 years for entrance culverts.
NCHRP (2011) recommends the use of a flow chart for selecting pipe materials (Sec 2.1); however, there are concerns that flow charts could become too restrictive and ultimately become a hindrance to designer (sec 3.1.1). As such, we recommend that Chapter 2 of the drainage manual retain a similar format with improved design aids.
Ditch and pipe sedimentation mean that even pipes designed to be dry most of the time (when not raining) may be subjected to standing water or wet sediment deposits.(sec 3.1.2 & 3.1.4). Standing water in the ditches means that the bed material is wet for extended durations. We recommend that dry pipe conditions be removed from Chapter 2 of the drainage manual.
Material abrasion is typically addressed by classifying ranges of material size and flow velocity (sec 2.5). These techniques are relatively easy to use for design; however, they can be inaccurate, and do not represent the physical processes of abrasion. As process based abrasion models have yet to be developed the methods used by CalTrans are the recommended design methods when abrasive conditions are present. Abrasive conditions can be determined by inspecting existing pipe at a given location. Concrete and HDPE pipe are considered non-abrasive.
There is much disagreement as to whether compaction requirements are being achieved (sec 3.1.3, 3.2, & 3.3.1). Differential compaction is often a more threatening problem than under compaction (sec 2.6 & 3.2); however, without density testing, it is impossible to check for either. We recommend that MnDOT investigate the feasibility of adding a third-party or contractor nuclear density testing item to construction projects to test all culverts 18 inches or larger. It is estimated that 20 nuclear density tests can be taken in the time required for one sand cone test. Nuclear density testing is quick (less than 1 minute per test) and the third party testing item will insure that there is a tester/inspector on site for every pipe installation. Nuclear density testing would allow density to be tested twice as often as recommended for sand cone testing. An alternate to nuclear density testing is dynamic cone penetration, but can only be used in sandy soils.
Analysis of pH time-series data from Vermillion and Minnesota Rivers suggest that summer is the best time of year to take pH samples for estimating steel pipe service life (sec 5.1.2). Avoid spring or winter sampling if possible. A minimum of three samples should be taken and averaged

35
for each site. PH can be determined using color comparison/chemical reaction tests or using hand-held electronic auto-analyzers.
6.2 Concrete Pipe
Concrete pipe is generally considered durable and low risk (sec 2.1 & 3.1.2) and is the default material for centerline pipe (sec 3.1.1 & 5.2.1). The most common failure mode of concrete pipe is joint separation (sec 3.1.2). Gasketed joints have a longer joint and joint geometrics that are expected to reduce the incidence of failure due to joint separation (Figure 15). We recommend that gasketed joints be the default joint for all concrete pipe.
Figure 15 – Gasketed vs. non-gasketed concrete pipe joints
There are several hypotheses about freeze thaw conditions can cause of joint separation in concrete pipe that are otherwise correctly designed (sec 3.1.4, 3.3.1), but in general, the actual cause is not well understood. The first hypothesis is that water freezes in the joints. The expansion of the ice forces the joints apart. The thermal conductivity of water, ice, and concrete is as follows: kice = 2.2 W/(m °K), kconcrete = 1.0 W/(m °K), kwater = 0.6 2.2 W/(m °K). Heat conducts faster through ice than concrete and faster through concrete than water. This could allow for a scenario where water freezes and is trapped in a concrete pipe joint.
The second hypothesis is that freezing silt and clay soils swell and shear along the side of the pipe thereby dragging the joint apart. The third hypothesis is that differential settling and movement causes the joint to separate. Soil infiltrating into the joint prevent the joint from coming back to together. When the pipe moves the other direction, the wedge of soil trapped in the separated joint forces the far side of the pipe to separate. By this mechanism, the joints “zig-zag” apart over the course of several seasons.

36
Studies have also found that highly saline stormwater can excessive crack growth and rebar corrosion in RCP. In the winter the salt levels on Minnesota roads are quite high due to deicing efforts. Recorded salt concentrations in Minnesota are near, but below damaging levels for concrete pipe (sec 2.2)
6.3 Steel Pipe
16-gage CAS should be the default CSP for Minnesota. CAS can be used in a similar range of pH and has a predicted service life of 3 to 8 times longer than galvanized CSP in both dry and wet conditions (sec 2.3.2). CAS have fewer abrasive and installation damage concerns than polymer coated CSP (sec 3.3.2).
The California method or variations of the California method is the most popular model for steel culvert service life prediction (Sec 2.3). This method uses on pH and resistivity of the site to estimate predict service life. On the whole, there is no one comprehensive source of pH and resistivity data for the whole state (sec 5.1). A comparison of MnDOT measured soil property data in District 3 to the NRCS WSS database shows that both data sets will predict 16-gage galvanized CSP service life within 12 years of each other using the California method (sec 5.1.1). Note the California method has a confidence interval of ±12 years (sec 2.3.2). At locations where WSS pH and conductivity/resistivity data are available, the average predicted service life for 16-gage galvanized CSP is 53 years ±21 years and for 16 gage CAS is 106 years ±42 years (sec 5.1.4). A study should be conducted to develop CSP projected life maps for the state of Minnesota.
6.4 Plastic Pipe
The two most common types of plastic pipe are HDPE and PVC. PVC becomes brittle if the temperature drops below 37°F (sec 2.4). PVC pipe should not be installed during cold temperatures (when the temperature is below 37°F) or in places where it may be jarred or deformed during cold temperatures. Considering the observed seasonal deflection of plastic pipes, the restriction eliminates nearly all applications for PVC pipe.
HDPE pipe has the durability and corrosive resistance to have a service life of over 100 years and is not significantly susceptible freeze/thaw damage (sec 3.4). We recommend adopting testing methods similar to the Florida testing methods for determining service life (FDOT 2008a-d) to identify HDPE pipes capable of yielding a 100-year service life. The testing methods were developed in studies by Dr. Hsuan at Drexel University. Separate issues of installation, backfilling, and inspection are still a concern for designers and inspectors (sec 2.4, 3.1.2, 3.3.2). We also recommend that these issues be addressed prior to giving HDPE pipe a projected service life of 100 years.
6.5 HydInfra Database Conclusions
The discussion of the HydInfra database conclusions will be broken down by subsection of the analysis. In general, a major deficiency of the HydInfra database is that it does not contain pipe age data (sec 5.2). Much of the analysis of the HydInfra required the assumption that all pipes in

37
the state/district are the same average age. This assumption is not valid. We recommend that a selection of pipe ages be determined and the analysis is repeated taking into account pipe age.
6.5.1 State Usage and Trends Conclusions (based on sec 5.2.1)
Concrete is the most common in place pipe material with 76% state wide. Steel is the second most common material. The average measured concrete pipe size is 24 inches and the average measured steel pipe size is 22 inches. For in place pipes, the pipe condition becomes worse with pipe diameter.
6.5.2 A Note on Plastic Pipe Data
There are insufficient numbers of plastic pipe in the data base to draw conclusions. In addition many plastic pipes are not differentiated between liners and pipes. Further data collection is needed and plastic culverts and storm drains need to be correctly coded as either plastic liner or plastic pipe.
6.5.3 Cause of Road Damage Conclusions (based on sec 5.2.2)
For all common pipe types (concrete, steel, and plastic) condition 3 and 4 pipes are most associated with road damage. Fourteen percent of condition 3 or 4 concrete and steel pipe are associated with road damage. Although it is expected that joint separation increases the incidence of road damage, there are other mitigating factors. Joint separations could be bridged by various soil types, joint treatments, or pavement types. Medium pipe sizes (24 to 36 inches) are most susceptible to joint separation.
6.5.4 Impact of Standing Water Conclusions (based on sec 5.2.3)
Standing water increases the incidence of holes in steel pipe and increases the incidences of joint separation and misalignment in concrete pipe. Steel pipe seems be more susceptible to standing water than concrete pipe; however, the correlation isn’t a strong one.
6.5.5 HydInfra Rating Trends Conclusions (based on sec 5.2.4)
In general yes flags (indicating a defect) in the HydInfra data base correlate with worse average conditions, indicating that condition ratings are being assessed correctly. The only concern is for void in road. When a void in road flag is “yes”, a condition 4 should be assessed. A second point to consider is the inspectors’ limited ability to identify a piping failure. Piping is only evident if water is actively flowing and that failure is occurring within 1 foot of the pipe wall.
6.5.6 Failure Trends Conclusions (based on sec 5.2.5)
Over half of concrete and steel pipe with joint separation have some type of fill material loss around the pipe. For concrete pipe increased cover depth correlates with higher rates of joint separation and lower rates of road distress and voids in the road. For steel pipe increased cover depth correlates with higher rates of cracks and lower rates of deformation and road distress. For concrete pipe joint separation typically occurs before misalignment; however, for plastic pipe misalignment typically occurs before joint separation.
38
Chapter 7. Research Plan
Each subsection of this research plan contains a separate topic that is in need of advancement. A potential research method is discussed for each topic. Corresponding recommended research needs statements are provided in Appendix E and are formatted per MnDOT requirements.
7.1 HDPE Inspection and Testing Methods
Part 1
Plastic pipe has been installed in Minnesota for nearly 20 years. MnDOT is considering increasing the locations where plastic pipe is allowed. Prior to changing guidelines MnDOT should verify the performance of pipes installed in the last 20 years.
Hire consultant to inspect select number of plastic pipes, both storm sewer and culvert. Review with laser ring/video and mandrel.
With this data we can improve guidelines on plastic pipe use, document success of installations and consider options for improving pipe inspection and acceptance criteria for all pipe such as:
• Deducting from construction payments for pipes not meeting criteria, or • Consider assessing the criteria for all pipe types.
Part 2
Some newly installed pipes are being rated as being in fair or poor condition, not being given a rating of “like new”. Pipes starting out in bad condition due to damage during construction or a poor installation will not meet the desired service life. This means additional resources will be needed to repair the pipe or to replace it early.
Consultant will review specifications currently being used by State DOTs for laser/video inspection. Produce a summary and develop specification for MnDOT use.
Video/laser ring existing pipe and provide specification for inspection of new pipe.
Compare results from:
1. mandrel test 2. direct measurement and 3. laser ring/video.
Assess the value of video inspection as part of pipe installation during construction. This project should develop specifications for video inspection and laser ring inspection. Consider inspection method for all types of pipe material. Quantify cost of implementing laser/video inspection, both to perform inspection and to review/approve pipe.

39
7.2 Steel Pipe Service Life Map
The MnDOT Drainage Manual refers to the California Method (AASHTO 2007) for estimating service life for steel pipe. The two key parameters required for use of the California Method are pH and resistivity. The current method for estimating steel pipe life is for the designer to take field samples for these two parameters. Although this method is desirable, time and expense restrictions often make sampling impractical. A state wide steel pipe service life map based on the California Method is needed to improve steel pipe design efficiency.
The Natural Resources Conservations Service (NRCS) web soil survey (WSS) has adequate estimates for soil pH and resistivity for about half of the state. This project will hire a consultant to take the required field samples to fill in voids in the WSS pH and resistivity maps. Resistivity and pH maps will be used to develop an expected steel pipe service life map based on the California Method.
Where possible pH and resistivity data will be determined from surface water samples in the right-of-way. When surface water is not available, pH and resistivity will be estimated using soil samples. Additional efforts will be made to relate soil pH and resistivity to surface runoff pH and resistivity be correlating soil and water samples taken at the same location.
7.3 Concrete Pipe Joint Separation Evaluation
Joint separation is the most common failure mode for concrete pipe. The mechanism causing joint separation is not well understood; as such, it is difficult to design joints to resist separation.
Part 1
Conduct detailed joint inspections for 100 concrete pipes that have been flagged in the HydInfra database as having joint separations. Conduct two destructive inspections if possible to coordinate with construction. Develop correlation curves between joint separation and site conditions and pipe damage. Site conditions of interest may include soil type, cover depth, pipe slope, groundwater level, and flowing water. Pipe damage of interest may include piping, road voids, cracking, infiltration, misalignment, broken/corroded/missing ties, high water table and damaged joint filter/filler.
Analyze inspection data to identify site conditions most likely to have joint separations.
Part 2
Develop lab test to evaluate the influence of the site conditions from Part 1 deemed most likely to cause joint separation. Monitor devices may track the following pipe conditions: tilt of individual pipe sections, magnitude of joint separation, driving separation force, soil force on pipe, and material strain.
Analyze testing data to determine the mechanism driving joint separation. Work with technical advisory panel (TAP) to develop techniques to resist joint separation.

40
7.4 Processed Based Abrasion Model
The extent of consideration given to abrasion in the MnDOT Drainage Manual is limited. Current versions state that discharges less than 5 ft/s are considered non-abrasive and discharges greater than 15 ft/s are considered highly abrasive. Nationwide the typical culvert abrasion models classify abrasive conditions using a combination of flow velocity, grain size, and sometimes pipe slope. This technique does not represent the actual processes by which abrasion occurs.
Part 1
In general, culverts fed by vegetated ditches are considered non-abrasive. The expectation is that vegetation filters out the bedload sediment prior to its entry into the culvert. The question remains if this assumption is realistic, especially considering the large quantities of road sand and granular salt placed on Minnesota roadways during the winter months. The first phase of this project is to characterize typical bedloads for both stream and non-stream culvert crossings. Particular attention should be paid to seasonally variable loads.
Part 2
Bedrock erosion in streams as a function of erosive energy is a well-understood, processed-based model. Measure pipe material abrasion rates in a sand/gravel bed flume for a range of typical Minnesota discharges and bedloads. Use erosive energy models to develop an energy based pipe abrasion model. Erosive energy models will then be used to evaluate if the velocity/grain-size/slope methods adopted by other states are appropriate.
7.5 Implementation Priorities
The topics of the research plan (Sections 7.1 – 7.4) are listed in order of priority. The HDPE Inspection and Testing Methods project should have the highest priority for implementation. Previous research conducted for FDOT and PennDOT has found that HDPE have the corrosive resistance to provide a service life of 100 years. If the remaining questions of installation and inspection techniques can be addressed, HDPE could be installed with confidence.
The Steel Pipe Service Life Map project should also be given high priority. Time and budget restrictions make estimating steel pipe service a low design priority. If the required design service life recommendations from Section 6 are adopted, estimating steel pipe service life may become a necessary task. A steel pipe service life map would provide an efficient method for estimating service life.
The HDPE Inspection and Testing project and the Steel Pipe Service Life Map project could be merged into one project. Some of the field samples required for estimating steel pipe service life could be taken during inspections of existing HDPE pipes. Also as both HDPE and steel are flexible wall pipes, some of the testing techniques developed for HDPE could be applicable to steel pipe when needed.
41
If the recommendation for gasketed concrete pipe joints is adopted, the Concrete Pipe Joint Separation Evaluation project should be given a medium priority. The longer and tighter joint will make material loss around the pipe less likely, even if the joints are slightly separated. Although gasketed joints are expected to reduce the damage caused by joint separation, they treat the symptoms of joint separation and not the cause. For this reason, a medium priority is warranted.
The Process Based Abrasion Model project should be given low priority. The number of MnDOT sites with significant abrasion issues is limited; furthermore, using an erosive energy model for design will likely require the collection of additional data, such as bed grain size. Designers will likely be resistant to needing to collect additional site information. The development of an erosive energy based model would be most valuable for cases where there is extreme abrasive ware. This project will also provide information about the relative abrasive resistance for various material types. For these reasons, the Process Based Abrasion Model project deserves consideration.
7.6 Other Research Topics of Interest Not Included in Research Plans
HydInfra Pipe Ages
Pipe ages for a select number of pipe in the HydInfra database could be determined by finding the installation plans in the electronics documents management system (EDMS). This project is not recommended due to extensive time requirements and uncertainty of actual steel pipe installation dates. The 800 pipes required to provide a reasonable analysis would take in excess of 1000 person-hours to determine ages. Also, steel pipes are often replaced by maintenance crews without documentation and would therefore yield inaccurate pipe ages.
Contractor Nuclear Density Testing Item
A study could be conducted to determine the feasibility of adding a nuclear density testing item to test pipe backfill. Nuclear density testing would allow for more soil density tests taken at a faster rate. This project would be difficult for a consultant to complete because of internal MnDOT logistics and safety concerns.
Road Salt and Concrete Pipe Damage
Salt has been found to cause corrosion of concrete pipe by salt water infiltrating into concrete micro-cracks. Previous studies of this phenomenon have been studied in coastal regions. The peak stormwater salinities found in Minnesota are on the borderline of levels considered detrimental; however, the exposure durations in Minnesota are significantly shorter than for coastal regions.
Concrete Pipe Joint Wrapping Life
This project would inspect concrete pipe joints to evaluate how joint wrapping during construction hold up over time. The topic is partially covered by the recommended joint separation study. The results of this type of study would likely be inconclusive, since there is no

42
way of knowing what type of joint wrapping was originally installed. Finally, if the gasketed joint recommendation is adopted, then the information obtained about joint treatments will receive little use.
Ice in Concrete Pipe Joints
This project would look at the formation of ice in joints and techniques for preventing joint icing. The project can be incorporated into the concrete joint separation project if deemed necessary. The project would be an inefficient stand alone project as it is unknown if joint icing is the primary mechanism of joint separation.

Chapter 8. Summary of Recommendations
1) We recommend a design service life of 100 years for centerline and mainline T.H. culverts and a design service life of 50-75 years for entrance culverts.
2) We recommend that Chapter 2 of the drainage manual retain a similar format with improved design aids (i.e. a design flow chart should not be developed).
3) We recommend that dry pipe conditions be removed from Chapter 2 of the drainage manual.
4) The abrasive conditions design methods used by CalTrans are the recommended design methods when abrasive conditions are present. Abrasive conditions can be determined by inspecting existing pipe at a given location.
5) MnDOT should investigate the feasibility of adding a third-party or contractor nuclear density testing item or a dynamic cone penetrometer test (when granular soils are present) to construction projects to test all culverts 18 inches or larger.
6) We recommend that gasketed joints be the default joint for all concrete pipe.
7) PVC pipe should not be installed during cold temperatures (when the temperature is below 37°F) or in places where it may be jarred or deformed during cold temperatures. Considering the observed seasonal deflection of plastic pipes, the restriction eliminates nearly all applications for PVC pipe. As such PVC use should be restricted to locations where other pipe materials are insufficient.
8) We recommend adopting testing methods similar to the Florida testing methods for determining service life (FDOT 2008a-d) to identify HDPE pipes capable of yielding a 100-year service life.
9) Concerns over the installation, backfilling, and inspection of HDPE should be addressed prior to giving HDPE pipe a projected service life of 100 years.
10) Research implementation priorities are as follows: 1) HDPE Inspection and Testing Methods, 2) Steel Pipe Service Life Map, 3) Concrete Pipe Joint Separation Evaluation, 4) Processed Based Abrasion Model
11) MnDOT should review the supplemental pipe inspection methodologies. Examples include: 1) Consider video inspection for special or high risk pipe installations or 2) consider pressure/vacuum tests for critical pipes.
12) MnDOT should consider developing construction training materials that instruct to the best installation and inspection methods.
13) Additional study should be conducted to evaluate the effect of drain tile lines discharging directly into the DOT right-of-way near culvert crossings.
43

44
References
AASHTO (2007) Highway Drainage Guidelines: Fourth Edition: “Chapter 14 – Culvert Inspection, Material Selection, and Rehabilitation Guideline” American Association of State Highway and Transportation Officials, Washington, DC.
Ault, J.P. and Ellor, J.A. (2000) Durability Analysis of Aluminized Type 2 Corrugated Metal Pipe Federal Highway Administration, Publication No. FHWA-RD-97-140, McLean, VA.
Busba, E., Sagüés, A., and Mullins, G. (2011) Reinforced Concrete Pipe Cracks – Acceptance Criteria Florida Department of Transportation, Contract/Grant No. BDK84 977-06, Tampa, FL.
DeLorme (2010) DeLorme Atlas & Gazetteer Minnesota – Seventh Edition P.O. Box 298, Yarmouth, ME 04096. www.delorme.com.
DeCou, G. and Davis, P (2007) Evaluation of Abrasion Resistance of Pipe and Pipe Lining Materials California DOT, Report No. FHWA/AC/TL-CA01-0173, Sacramento, CA.
FDOT (2008a) Florida Method of Test for Determining Stress Crack Resistance of HDPE Corrugated Pipes Florida Department of Transportation Testing method: FM 5-572, Tampa, FL, http://www.dot.state.fl.us/statematerialsoffice/administration/resources/library/publications/fstm/methods/fm5-572.pdf.
FDOT (2008b) Florida Method of Test for Predicting the Crack Free Service Live of HDPE Corrugated Pipes Florida Department of Transportation Testing method: FM 5-573, Tampa, FL, http://www.dot.state.fl.us/statematerialsoffice/administration/resources/library/publications/fstm/methods/fm5-573.pdf.
FDOT (2008c) Florida Method of Test for Predicting the Oxidation Resistance of HDPE Corrugated Pipes Florida Department of Transportation Testing method: FM 5-574, Tampa, FL, http://www.dot.state.fl.us/statematerialsoffice/administration/resources/library/publications/fstm/methods/fm5-574.pdf.
FDOT (2008d) Florida Method of Test for Predicting Long-Term Modulus of HDPE Corrugated Pipes Florida Method of Test for Predicting Long-Term Modulus of HDPE Corrugated Pipes: FM 5-577, Tampa, FL, http://www.dot.state.fl.us/statematerialsoffice/administration/resources/library/publications/fstm/methods/fm5-577.pdf.
Hershfield D.M. (1961) “Technical Paper No. 40 Rainfall Frequency Atlas of the Unites States for Durations from 30 Minutes to 24 Hours and Return Periods from I to 100 Years” U.S. Department of Commerce, Weather Bureas, Technical Paper No. 40, Washington, DC.

45
Koerner, R.M. (2005) Designing with Geosynthetics Pearson Education Inc., Upper Saddle River, NJ.
MnDOT (2007), “Use of Plastic Pipe for Storm Sewer and Culverts on Trunk Highways” Minnesota Department of Transportation, Technical Memorandum No. 07-04-B-01.
NCHRP (2011) Alternate Pipe Material Selection Protocol National Cooperative Highway Research Program, NCHRP Project 20-07(264), Washington, DC.
Novotny, E., Murphy, D., and Stefan, H. (2007) Road Salt Effects on the Water Quality of Lakes in the Twin Cities Metropolitan Area SAFL Project Report No. 505, St. Anthony Falls Laboratory, University of Minnesota, Minneapolis, MN.
Perrin, J. Jr. and Jhaveri C.S. (2004) “The Economic Costs of Culvert Failures” Prepared for the Transportation Research Board, TRB 2004 Annual Meeting CD-ROM, Washington, DC.
Stratton, F.W., Frantzen, J.A., and Meggers, D.A. (1990) Cause of Accelerated Deterioration of Corrugated Metal Pipe Installed After 1974 Kansas Department of Transportation, Report No. KS-90/3, Topeka, KS.

Appendix A: District Interview Discussion & Responses

A-1
Each paragraph in this transcript is an individual response. The names have been removed in order to maintain confidentiality.
Attendance:
D1 Duluth: Hydraulics
D2 Bemidji: Hydraulics and Maintenance
D3 Brainerd: Hydraulics and Maintenance
D4 Detroit Lakes: Hydraulics
Metro District: Hydraulics and Maintenance
D6 Rochester: Hydraulics and Maintenance
D7 Mankato: Hydraulics
D8 Willmar: Hydraulics and Maintenance
Co-Principle Investigator
MnDOT project champion
Design:
Do you use the Drainage Manual Chapter 2? Which parts?
What features of the current Drainage Manual Chapter 2 are most useful?
What additions/changes to Drainage Manual Chapter 2 would be most useful?
Use Load tables pipe installation for RCP. Doesn’t use much CMP.
Works with WRE, gets recommendations from them.
Concrete used mostly for centerline, but joints don’t keep together mostly last 3 joints on end. Most district metal pipes have bottoms gone within 10 years. Maintenance still uses aluminized metal. Using more plastic pipe, mostly following plastic pipe Tech Memo guidance. Had bad experience with polymeric metal but is going to try product again.
Always use concrete for centerline pipe. Uses charts in manual for class. Entrances usually corrugated metal.
Concrete for centerline culverts with joints tied. Don’t use manual for typical except if very deep or special situations may look at Chapter 2.
not used much.
A-2
Uses load tables, mainly occasionally pipe materials for something unusual otherwise don’t use much in comparison to other chapters.
would use, helpful if life was easier to do, if you could project how long would a 2 turn into 4.
Would a design flowchart be a useful tool as either a design aid or a training aid?
would be interested in what other states have. Wants to know if engineer still make decisions.
flowchart good idea, but depends what’s in it. They mostly just use concrete. More important to be able to determine how long it lasts and the cost. Now having to fix a bunch of metal, costs a lot would have preferred pipe that still lasts.
has informal decision tree, mostly uses RCP, where tech memo use plastic alt, CMP only temp or entrances.
More information on what is in decision tree. Will flow chart make you document why not following flow chart? District wants control on making decisions, tool OK, but not if it will create work or take away ability to make eng, judgment on best material.
Flow chart could be helpful.
OK if flowchart is District 3 orientated would use but not statewide.
What type of geotechnical information is available for design?
What types of additional site data is it feasible to collect? (Grain size, pH, etc)
doesn’t get or request. Soil borings give sand/clay/loam. With infiltration requirements getting infiltration data and that is difficult to get. General water sample not feasible
lucky to have any soil data. Infiltration, is water into sink hole. Only is clay, loam, sand. No pH…no capability to do water samples.
All they get is soil borings for centerline pipe, not entrance. Only get Ph if Hydraulics goes and gets it.
Takes soil borings on centerline culverts but doesn’t get info can go get from soils. Does 2 ft bedding that helps compensate for bad soils.
Soil borings at culvert locations. D3 soils engineer did pH map for district.
Some metal has no problems, but metal corrodes where there is a foul smell, mostly swampy areas. Has worked in soils, was never asked to provide data, soils said would be willing if asked.
A-3
get soil borings. pH only another thing to take. If had evidence it’s worth taking to request pH.
larger soils gets bedding
soil borings on larger reconstruction projects.
What design service life do you feel is appropriate?
100 years, roads already over 50 years old. High traffic volume high cost to repair, need long service life. Open cut forbidden in metro. Interstate and TH both with high traffic
300 year design life. Most culverts 50-75 year old. Requiring rehab can’t do it. Can’t shut down traffic,
Thinks Concrete has 20 yr life, CMP has 10-20 yr life wants material that provides at least 50 year service life.
Minimum 75 years mainline, sideline 50 years. Pipes need to last.
would be interested in cost benefit. Some old concrete looked good. Does it need to be replaced when doing major construction, though it may be longer or new location. Would it be worth putting in 100 year then not replacing for longer period?
Existing Pipe Materials and Methods:
How do you select materials?
Do you regularly choose alternate materials? When?
Do you have a sample document used to justify use of a single material?
Follow tech memo, plastic pipe alternatives where required. Replace existing private culverts CMP sometimes. Local road entrances ask their preference if maintained by them.
Get recommendation from WRE. RCP can be more difficult to install heavier. CMP may use different coatings polymeric coated, aluminized. Centerline try to put in RCP.
Concerned with driveway culverts. Doesn’t put as much money into driveway culverts (CMP cheaper then RCP but should use aluminized)
too many types of pipe different CM coatings. Leads to confusion. Simplify.
wrote letter staging complexity, traffic to wave plastic pipe alternative.
no formal reasons but have reasons in file. Most common city didn’t want it.

A-4
Not a lot of low volume roads. Cities usually send a letter stating they only want concrete in their city limits. We consider their preferences in material selection. Otherwise follow the plastic pipe Tech Memo.
follow tech memo for side pipes, deviate when water not galvanized, not plastic if concerned with floating or cover. Stormsewer figured by Geopak drainage. In Urban if city maintain and they want a certain type, they write a letter and we put in what they want. Generally if we are paying for it they request concrete.
If city request concrete we use that. Most cities request concrete. Thought they would be willing to pay the difference to get concrete.
What is your overall impression of galvanized CSP?
What do you see as the limitations of galvanized CSP?
What do you see as the advantage of galvanized CSP?
Doesn’t use much CMP.
Seeing bottoms gone in CMP in 30 years.
Old riveted metal pipes last longer. Stuff from 50’s still has bottoms, looks good.
Maintenance seeing lots of deterioration in metal, would plastic last longer.
No use for galvanized metal pipe in the district.
CSP like longer stick, easier to install can be done by maintenance with existing equipment, also plastic.
From maintenance perspective galvanized is flag ship.
In sandy soil CMP holds up better. Swampy area wet soils, has lots of bad entrance culverts that need to be replaced.
Some of the structural plate is old but is in good condition. Has heard more soil side corrosion then water side corrosion.
Structural plate not being used except by counties. The structural plate is much thicker than CMP.
Pipes deteriorated with water sitting in it. Ditches can’t be maintained enough to prevent standing water. Limited personal, only 2 backhoes, can’t keep up. Pipes don’t last as long.
Once in awhile not often. Once for value engineering, used DM to get service life. A lot of pipes needing liner are metal. CM have different flow characteristic, do not want to spec different sizes for centerline, more work to design.
Couldn’t get safety apron in right size.

A-5
Some CM over 30yr are deteriorated or damaged during construction
Metal Aprons large (8’ D) pipe floating 4-5 ft had to be replaced, really can’t fix. Smaller float too but can be fixed. Should we have concrete headwall. Usually happens pool at entrance, smaller pipes corn stocks block end cause high head. Other pipe difference of head outside to inside, coincide with large flows in pipe.
haven’t had this happen.
Metal harder to clean when beaver or corn stocks need to be unplugged. Maintenance can clean concrete easier.
Used steel for underwater installation.
What is your overall impression of CAS?
What do you see as the limitations of CAS?
What do you see as the advantage of CAS?
Some Districts requiring aluminized culverts for entrances, not Rochester (D6). Could this become a state Standard?
Aluminized is being considered but jury still out on if it works.
Only used aluminized in two places, getting good prices
Aluminum and aluminized not recommended in peat because the aluminum reacts with the peat.
has used aluminized or aluminum 2 times recently no track record.
Aluminized for driveway makes sense but not what they do.
What is your overall impression of plastic pipe?
What percent of plastic pipe use is HDPE vs. PVC?
What percent is dual walled vs. single walled?
What do you see as the limitations of plastic pipe?
What do you see as the advantage of plastic pipe?
Are mandrel tests for deflection effective? (How are the results used?)
No information on fill heights for plastic, these should be in manual. Thinks that plastic is damaged during construction rather than too much fill.
A-6
Thinks plastic superior for joints and corrosion, agrees needs good compaction. Plastic use 100% HDPE culverts. 15% storm sewer is PVC. 30% PVC lining. Dual vs. single wall, 70% Dual wall. Culverts mostly dual wall, outside roadway. Use single wall to reduce velocity. Mandrel test for plastic is a huge issue, makes difficult to use plastic pipe. Thinks 5% not serious 10% is failed, not seeing significant change in deflection after installation. Where use concrete apron on plastic pipe the pipe settles after installation, believes settlement occurs after 30 days.
Hasn’t had problem with PVC storm sewer. But PVC liner has cracked during installation (it’s brittle) and held up jobs.
Likes plastic durability in steep slopes vs. compared to metal.
Maintenance has used plastic to line centerline pipe in last 4-10 years. Mostly use dual wall HDPE for liner because if installer adds too much pressure they will shatter a PVC liner.
West side of district lots of farm entrances. Farmers burn ditches and plastic pipe melts.
Generally not policy but have note to use plastic pipe alternative where possible. Very rarely allow concrete alternative if plastic is called for in the plan.
like longer stick, easier to install can be done by maintenance with existing equipment
Plastic good but does float if not tied down. Not much single wall used…for slopes
Used single for county tile, got crushed a little, wouldn’t use it except for perforated tile line.
saw PVC installed on non-Mndot project
always uses dual wall, even for tile.
30 day before mandrel, usually paved or gravel over it. Lot more risk. Resistant to replacing.
Difficult to use rock bedding. Can’t keep on grade. Needs cover, if too shallow truck can pump it out of ground.
Even if final cover 4 ft, during construction damaged before fill installed.
Only did one in bottom of ditch, bedding and testing afterward was difficult. Had to dry out after the fact. Contractor said High risk they would include cost in the bid. Contract said plastic with risk factored in was closes to concrete, though did use plastic.
plastic dual wall, single wall only when down slope failure. PVC rigid, no flexibility not preferred except small drain tile. Has seen it move saturated soils, or standing water; not float if good soils well compacted. Don’t use PVC much.
very little plastic pipe used including PVC.
plastic light weight, easy to install

A-7
What is your overall impression of concrete pipe?
What do you see as the limitations of concrete pipe?
What do you see as the advantage of concrete pipe?
Advocate for concrete. Wants to use all gasketed joint and tie all joints. Knows plastic sales man wants us to use more, but likes how concrete holds up.
RCP good pipe, some issues with joints but normally lasts.
Concrete pipe is fine just joints are separating. Now getting better joints, tied and pipes should last longer.
Once joints are separated life span is gone.
We have better soils than D1. Concrete is in good condition and lasting longer then in D1. In the North half of District both metal and concrete last.
Not enough maintenance forces and equipment, for concrete having to do small RCP culvert projects that are very expensive not tied to a larger project.
Concrete pipe is good, but joints are terrible; gasketed big advantage, may take care of some issues. Thinks 3000 big problem but co-workers have different opinion.
Concrete too heavy for maintenance, so they don’t use it.
Having problems with joints in concrete pipe and overly aggressing pressure cleaning has changed 40 yr old to 70 yr old pipe in 10 minutes by exposing aggregate. Ties help but if lots of ground movement ties will break.
Concrete good but some joint separation. Stay together if all joints tied, not just some ties. Gasketed tied.
maintenance equipment not big enough to lift over 24” RC, Plastic and metal easier to handle.
few inverts rotted out. One case illicit discharge acid. Derek had some random pipe rotted out (bad mix?) couldn’t explain failure.
Is failure more common for round vs. arch vs. box RCP culverts?
All: seen no difference
needs arch pipe deeper designs. Load Tables expanded?
Need to tell people where to go to get special design with high fill
A-8
Old box held up well. But when widen rip out anyway because can’t extend.
Cast in place long life expectance. Precast box some separation but much less then round.
Experience joint problems. Box in good condition but separation at headway/wingwall. Where widened roadway getting separations at extensions.
Also has observed failure at extension joint.
See more separation with concrete round by far. Boxes don’t seem to have as much issue. Even Arch don’t separate much.
Have you observed any common causes of joint separation?
Have joint ties alleviated joint separation issues?
HydInfra inspectors consider joint separation a gap of 1 inch. Is this a reasonable value?
Do you routinely add joint ties when replacing end sections? Does this help?
Doesn’t understand why you would use transportation joint instead of gasketed if the price is close. Concrete holds up joints don’t.
Has even seen separation between manholes at one project.
Storm sewer a few separations for concrete but rare.
Jon uses 3006 joints but other hydraulic designers use 3000 unless there is a high velocity then the use 3006.
If MH to outlet under road tie all. Pipe run not under road only tie last 3. Recommend consistency between 2501 & 2503 outlet pipe.
Tied ends, separating under road.
no incidences of pipes pulling apart under roadway. Separations under inslope no ties. No observation of joint separation further in.
to fix excavate put in good soils, tie ends. Occasionally poor soils continued problems. They check if stable in, then tie further.
Id 1” separation ok for RCP
not good sandy soils, mostly silty clay loam, they do experience joint ties pushing problem to the spot where not tied.
use all o-ring pipes, manufacturer says 3/8 to 1” separation allowed. Thinks reasonable
depends on soils. Some cases 1” soils infiltration, sometimes not depends on the soils.

A-9
Doesn’t have any gasketed pipe.
when resetting separated ends, wrap joints with geotextile to prevent infiltration of soil.
has not seen joint separation for other pipe material types
has seen movement and joint separation on CMP if there is farm tile nearby.
sees ends and aprons on CMP beat up and crushed
aprons big issue. Safety aprons really long ends fly up
1:10 slope using CM safety apron. Prefer fabricated not mitered. Need official design
they put in toe plates right, maybe not construction. Of the ones that fly up, more do not have good toe plate but occurs in both cases.
One inch appropriate, starting to get infiltration. If know gasketed could be more but don’t know if gasketed and most are not gasketed.
1 inch not problem. Usually Apron 6” next in 3” that is problem. If saw 1” with dirt infiltration would add bands, thinks would get another 30 years out of pipe.
1” works well, nothing less or all fail.
Doing fabric wrapped thought that would help but still failing with 7-12” separations at ends.
New projects If tied and wrapped no problem. Look at older jobs not tied, problems.
Concrete has reset, were untied but when replace, they tie it. When have to extend pipe they have seem separated in middle but doesn’t seem linked.
Have had several pipes when reset and tie, the separation occurs on the first section that is not tied. Don’t know % but have 6 calls over half tied in past next joint up. Happens where higher velocity or constantly flowing, wet areas (moving fines faster).
When moving water gasketed pipe to prevent problems.
for New Gasket and tie may prevent problems. But for rehabbing what should you do? Can’t line if undersized. Some apron fall in because scour hole, maybe put in a headwall/cutoff wall. CIPP costly, experience with joint filler was $50,000/ culvert.
How often is elliptical pipe used for any material?
No
No
Allowed City of Buffalo to use a while ago, frontage roads.

A-10
Haven’t Spec’d elliptical
Construction
Do you find that installation the most common cause of concrete pipe failure?
Are construction specs being followed?
Are there additional specs that should be added?
Is construction inspections conducted by MnDOT employees or by consultants?
Would it be useful to develop an as-build pipe inspection sheet to ensure that pipe are clean/construction properly?
most inspection DOT, only if local lead or design build…can we revisit fill over class 4? Seen failure class 4 over 15 ft.
Design Build inspection by consultants (some DOT)
no one does as built. No one has time to do it.
Hasn’t’ had as built. They are trying for MS4 requirements, but it is a struggle.
believes being followed as close as practical in the field.
Not aware of problems but not much involvement.
Good luck. Installed incorrectly shows up in first few years. Things following construction requirements. One concrete centerline heaved out of ground bad soils.
Some of each inspected by MnDOT and other.
All inspection done my MnDOT. No as built. Bedding 2 ft deep, over-excavate on sides 2 feet use good granular borrow.
bedding, trenches, bedding and taper according to plan. Inspection priority seems to be checking pipes cleaned at end of project.
Experience varies between projects depends on # inspectors, bid, contractor
inspector used to follow the pipe installation, but no not there all the time.
How effective are the pipe bedding methods?
What trench width do you use?
When peat, digs out and gets good bedding.

A-11
Thinks trench width depends on equipment contractor using. Thinks close to what in plan closely followed.
Need fabric around frost treatment and bedding. Especially where questionable soil, soft soils line trench.
Materials engineer uses fabric in bad swampy spots.
What to do with area under aprons is a major issue. If joints open even a small amount and water gets in there freeze thaw may cause separation. Some think soil swelling and up heave. Used to do a clay cap to prevent piping but have stopped that because of uplift at ends of culverts.
Why don’t we have a concrete or sheet pile cut off wall when installing in bad soils?
class C bedding in Metro. Hard to guarantee class B minimum inspection. Bruce never seen rounding of bedding with template…he sees class D or class B. Dave agrees. Assume worse case.
Tapers in tech manual, other case treatments, lots of variation on what is used.
Materials office requires tapers you have wide trench. 1:20 upper 3 feet. Another problem with replacing culverts disturbing more road/soil.
when inspection not there contractor may not compact according to spec.
Finding 4 ft organic under old roadways. If bedded properly and tied not a problem.
Need education for installers on pipe bedding.
handed down informally no training.
They are doing training during their kick off meetings. Was started when new pipes were not getting rated as 1 in HydInfra. 30 minutes PPT next year on what to look for.
wide enough to install pipe and get compaction. Will vary with equipment used: 30” compactor, sheepsfoot, or jumping jack.
pipe bedding method good, but need to watch them. RC less risk since not as dependant on good bedding.
has changed to small rock when damp or peat. Vary material type not methods.
Hard to get compaction when inspector not there. Maybe video installation. If you step away don’t have quality control.
Is there a common construction or maintenance experience that poses a challenge to pipe life?
A-12
Ditches filling up. One project 2 feet to get to top of pipe. No one has time to clean ditches. As ditch fill up new utilities discharging higher, then if restore ditch utilities coming in too high.
Have ditches fill in. Utility problem, permitting problem (incidental wetland) COE approval restore to previous grade, disturbance needs erosion control reseeding. Complicated, not just dig it out.
widespread problem
See more in ag. Especially big farms that rent land, plowing waterway. Smaller farmers, smaller equipment owner more interest in preventing erosion.
tougher to clean. Problem building up.
more work is mill and overlay. Accelerated timeframe, to clean ditch need more surveys, hard to get in smaller projects without grading.
Maintenance used to have enough people to clean out apron ends and ditch to maintain flow. Now with shortage of manpower not cleaning, this effecting life of metal pipes.
HydInfra notes aprons plugged up, has maintenance crew that does cleaning.
Hope not done where protected waters, where pipes down for fish passage.
lots of work needs to be done but limited what you can do to fix drainage…protected orchids and wetlands…
Maintenance & HydInfra Inspection
How do you define pipe failure?
Do you have issues with culvert end section falling off?
Have you noticed issues caused by the freeze/thaw cycle?
Do you use invert paving as a maintenance method? (Is it effective?)
Metal rusted through. Fair amount of subjectivity. Not lot of total failure of concrete pipe. Some cracking but not getting worse, mostly just ends falling off. Sometimes sag but not severe not big deal. Mostly corrosion on CMP and CMP ends beat up. Looks at HydINfra data as starting place screening tool, then check in field. Do not schedule project on Hydinfra.
Use HydInfra as scoping tool, general cost. Does project field review to make final decision on what needs to be fixed, looks beyond pipe and try’s to solve other problems in the ROW.
Concrete pipe Aprons coming off within 20 years.
A-13
commonly does invert paving by bridge crews in box culverts. Is promoting for round, has seem pipe last much longer than putting in new pipe.
Hasn’t seen invert paving
Existing CSP planning invert paving in next year. Lost surface with abrasion metal disappears quickly after that.
Hard to see joint separation in middle of pipe. More looking for confirming that dirt is being lost. Need some metric so 1 inch as good as anything.
Need to talk to construction for information on following specs.
Construction says deduction not high enough. Contractor says will take deduction instead of fixing a failed pipe.
Impossible to watch installation of every piece of pipe. Maybe more teeth in contract when don’t have eyes on them.
Make it right or it’s free. We do not have enough inspectors. Often problem is pipe. Has developed spec on differential culvert settlement. Contractor designs own treatment, no dip allowed, warranty for 3 years use warranty bond can close out contract but still recover. 3 years almost up will see how well this works.
Andrea should get spec and share it. Maybe wait to see how well it worked.
Freezing and ice could be part of problem D1 was putting on bands on pipe. Need something to keep water out of joints for concrete.
We are seeking the pipe installation dates for the HydInfra database. Do you know of a means of finding install dates in your district?
Are the inspection sheets kept with the plan sheets?
Do you have any water pH and/or conductivity/resistivity data?
Are you willing to collect and analyze water samples during HydInfra inspections?
No do not have additional files beyond EDMS.
keeps set of plans with Hydinfra files. Adds notes to plans. So many different pipes don’t know for sure how old they are.
would be willing to collect some environmental data.
has pH map done by soils engineer.
Have CS files When have rain day she will have inspectors gather information.
A-14
Student workers pulled construction plans when inspection started. Need to check with MS4 group. Has library with plans until 15-20 years ago, available to researcher.
no easier way
maybe, construction log different roadway sections, know what year grading done.
That is what we have tried
that may lead to wrong answer.
only has EDMS for plan sheets and HydInfra
only has EDMS for plan sheets and HydInfra
Lots on entrances put in by permit, not done in a plan.
EDMS for plans, some in shelves
General comments
Plastic pipe sales man wants to increase the size of pipe under roadway. Has asked district to support. Referred to CO/Andrea.
Doing CIP liner. Hobas and other products sometimes brought up.
good about replacing centerline, but not much priority on fixing entrance pipes. Knows funds constraints, but wish they could do as part of projects.
Hydinfra starting to inspect culverts. Some entrances included if enough money and know about them early enough in process to include in project.
Usually entrances not included in projects. Maintenance takes care of entrances because they have limited traffic control and can be done with maintenance forces. Occasionally when lots of entrances are in bad condition maintenance asks to include in a project but project manager usually limits how many entrances are in construction projects (scope creep).
Update load tables simplified.
Planning on updating load tables for LRFD design. Would like to simplify them too.
Would be interested in more cost benefit for liners and repair methods.

Appendix B: District 3 Soil Map Spot Checked Against NRCS Web Soil Survey

Location 2 NRCS pH = 5.9
Location 1 NRCS pH = 6.2
Location 11 NRCS pH = 6.05
Location 9 NRCS pH = 5.85
Location 3 NRCS pH = 5.8
Location 10 NRCS pH = 6.43
Location 5 NRCS pH = 6.21
Location 4 NRCS pH = 6.0
Location 12 NRCS pH = 5.67
Location 7 NRCS pH = 6.02
Location 6 NRCS pH = 6.52
Location 8 NRCS pH = 6.78
B-1

Appendix C: pH Data Comparison Tables

C-1
County H.U.C.Latitude Longitude
deg/min/sec deg/min/secDrainage Area
mi2Average Discharge
ft3/s USGS pH NCRS pH % Diff pHDakota 7040001 44°40'00" 93°03'17" 129 63.61 7.91 6.86 14.14
Hennepin 7020012 44°52'13" 93°11'32" 16,900 7173.86 7.97 6.81 15.64Carver 7020012 44°41'35" 93°38'30" 16,200 4232.30 8.04 6.76 17.33
Blue Earth 7020011 43°59'48" 93°54'30" 130 80.12 8.10 6.62 20.09Renville 7020004 44°51'42" 95°25'38" n/a n/a 8.20 7.50 8.92
Figure C1 – USGS Gaging Station pH vs. NRCS pH
Latitude Longitude SYS MPCA
_LOC_CODESAMPLE DATE MM/dd/yyyy
GEOLOGIC UNIT CODE
TASK CODE
DEPTH OF WELL (ft) MPCA pH NRCS pH pH % Difference
46.07781 -94.8513 H152802_013 07/19/2000 QWTA PRJ00084 3.7 6.95 6.49 6.8%45.8303 -94.7751 H135783_002 05/20/1999 QWTA PRJ00084 4.77 6.99 7.03 0.5%45.47677 -94.3716 H135782_009 06/29/1999 QWTA PRJ00084 6.1 6.91 6.68 3.3%44.23711 -93.2784 H152812_001 04/05/2000 QWTA PRJ00084 6.37 6.64 6.61 0.4%46.33731 -94.2734 H138569_009 09/09/1998 QWTA PRJ00084 7.5 6.92 5.57 21.7%45.59576 -94.3093 H135789_001 08/19/1999 QWTA PRJ00084 7.6 7 6.38 9.3%45.50522 -94.1557 588382 Averaged PRJ00084 10 7.05 6.14 13.9%46.59022 -95.6434 609956 Averaged PRJ00084 10 7.37 7.09 3.9%44.64056 -93.1592 639314 Averaged PRJ07229 10 7.60 6.71 12.4%45.41241 -95.7925 H135781_002 09/27/2000 QWTA PRJ00084 11.21 7.53 7.58 0.6%44.50011 -96.2406 222238 09/30/1993 QWTA PRJ00084 12 6.88 7.47 8.2%45.5995 -93.4792 609973 Averaged PRJ00084 12 5.59 6.04 7.7%44.93066 -93.3765 497643 06/16/2005 QWTA PRJ07229 15 7.56 6.60 13.5%
46.35 -94.6827 H135784_003 08/04/1999 QWTA PRJ00084 15.66 5.97 6.03 0.9%45.4744.95
-95.046-93.23
H135776_022 07/14/1999 QWTA PRJ00084 15.7 7.19 7.23 0.6%464278 Averaged QWTA PRJ07229 16 7.514 6.42 15.7%
Figure C2 – MPCA Groundwater pH vs. NRCS pH
MPCA SAMPLE DATE GEOLOGIC DEPTH OF pH % Latitude
46.07781
Longitude
-94.8513
SYS_LOC_CODE
H152802_013
MM/dd/yyyy
07/19/2000
UNIT CODE TASK CODE
QWTA PRJ00084
WELL (ft)
3.7
MPCA pH
6.95
NRCS pH
6.49Difference
6.8%45.8303 -94.7751 H135783_002 05/20/1999 QWTA PRJ00084 4.77 6.99 7.03 0.5%46.59022 -95.6434 609956 Averaged PRJ00084 10 7.37 7.09 3.9%45.41241
Latitude
46.07781
-95.7925
Longitude
-94.8513
H135781_002
MPCA SYS_LOC_CODE
H152802_013
09/27/2000
MPCA Resistivity (ohms)
958
QWTA
NRCS Resistivity (ohms)
30074
PRJ00084
Resistivity % Difference
188%
11.21
MPCA 16 Gage Galv.
Life21
7.53 7.58 0.6%
NRCS 16 Gage Galv.
Life42
45.8303 -94.7751 H135783_002 1595 14856 161% 26 4446.59022 -95.6434 609956 2810 249394 196% 50 6845.41241 -95.7925 H135781_002 1235 2762 76% 35 49
Figure C3 – 16G galvanized pipe service life projections based MPCA Groundwater data vs. NRCS data

Appendix D: Sub-Sampled Data from WSS

Page Point Latitude Longitude Total Area pH Conductivity Resistivity pH > 7.3? 16 Gage Galv. 16 Gage ALT2
[degrees] [degrees] [acres] [] [mmhos/cm] [ohm cm] [Y / N] [years] [years]
16.000 1.000 48.9324 ‐97.164 6704.8 7.900263 1.99464861 501.34 Y 24.452 48.904
16.000 2.000 48.94 ‐96.84 7422.7 7.632214 0.746578738 1339.44 Y 36.585 73.169
16.000 3.000 48.8 ‐96.85 7175.3 7.618451 1.23411704 810.30 Y 29.772 59.544
17.000 4.000 48.89 ‐96.6 8803.6 7.556428 0.406588214 2459.49 Y 46.936 93.872
19.000 11.000 48.89 ‐95 8831.1 7.00638 0.049198854 20325.68 N 46.070 92.141
19.000 12.000 48.79 ‐94.75 7000.5 7.534725 0.202642668 4934.79 Y 62.445 124.891
20.000 13.000 48.53 ‐96.96 6988.8 7.629243 0.469040465 2132.01 Y 44.265 88.531
20 15 48.6 ‐96.75 8770 7.794997 1.947564424 513.4618335 Y 24.693 49.385
22.000 21.000 48.3 ‐95.38 7675 7.301445 0.009211726 108557.28 Y 221.759 443.518
23.000 22.000 48.77 ‐94.87 6815.3 7.437423 0.097049286 10304.04 Y 84.449 168.898
24.000 27.000 48.5 ‐94.55 6412.2 7.255909 0.000713391 1401756.10 N 88.189 176.379
28.000 38.000 47.46 ‐96.8 9139.7 7.838639 1.139314201 877.72 Y 30.764 61.527
31.000 48.000 47.5 ‐95.15 8794.8 6.234159 0.00421382 237314.36 N 55.890 111.780
33.000 53.000 47.43 ‐93.65 8409 6.089592 0.000838258 1192950.82 N 67.441 134.881
33.000 54.000 47.85 ‐93.71 7442.2 6.501065 0.017199215 58142.19 N 47.184 94.368
40.000 73.000 47.33 ‐96.79 9101.9 7.844357 1.177344849 849.37 Y 30.352 60.704
40.000 74.000 46.9 ‐96.69 9153.3 7.840741 1.87328251 533.82 Y 25.090 50.179
40.000 75.000 47.21 ‐96.75 9994.4 7.772366 0.939781708 1064.08 Y 33.290 66.581
41.000 76.000 46.9 ‐96.26 9930.3 7.613119 0.897219162 1114.55 Y 33.929 67.858
41.000 77.000 47.14 ‐95.96 8233.2 7.710078 0.330263366 3027.89 Y 51.113 102.225
41.000 78.000 47.31 ‐96.43 8119.3 7.909245 1.366286518 731.91 Y 28.555 57.111
44.000 87.000 47.35 ‐94.49 8922.9 6.040158 0.00058277 1715942.31 N 69.945 139.891
45.000 88.000 46.98 ‐93.49 9762 6.13326 0.00565107 176957.64 N 52.881 105.762
45.000 90.000 47.3 ‐93.28 9636.2 6.120581 0.141777873 7053.29 N 27.705 55.410
46.000 92.000 47.38 ‐93.05 9308.6 5.948171 0.216289516 4623.43 N 23.303 46.606
50.000 103.000 46.62 ‐96.73 8803.1 7.617162 1.151498095 868.43 Y 30.630 61.259
50.000 104.000 46.48 ‐96.69 8689.1 7.691821 0.95251522 1049.85 Y 33.107 66.215
51.000 106.000 46.62 ‐96.48 8325.5 7.799526 1.118614068 893.96 Y 30.996 61.991
51.000 107.000 46.27 ‐96.25 8832.6 7.658915 0.674746017 1482.04 Y 38.134 76.268
51.000 108.000 46.58 ‐96.12 7544.5 7.34471 0.174250917 5738.85 Y 66.432 132.864
52.000 109.000 46.26 ‐95.78 6106.2 7.399137 0.166326491 6012.27 Y 67.712 135.424
52.000 111.000 46.62 ‐95.65 7076.2 7.069684 0.005100315 196066.31 N 65.241 130.482
D-1
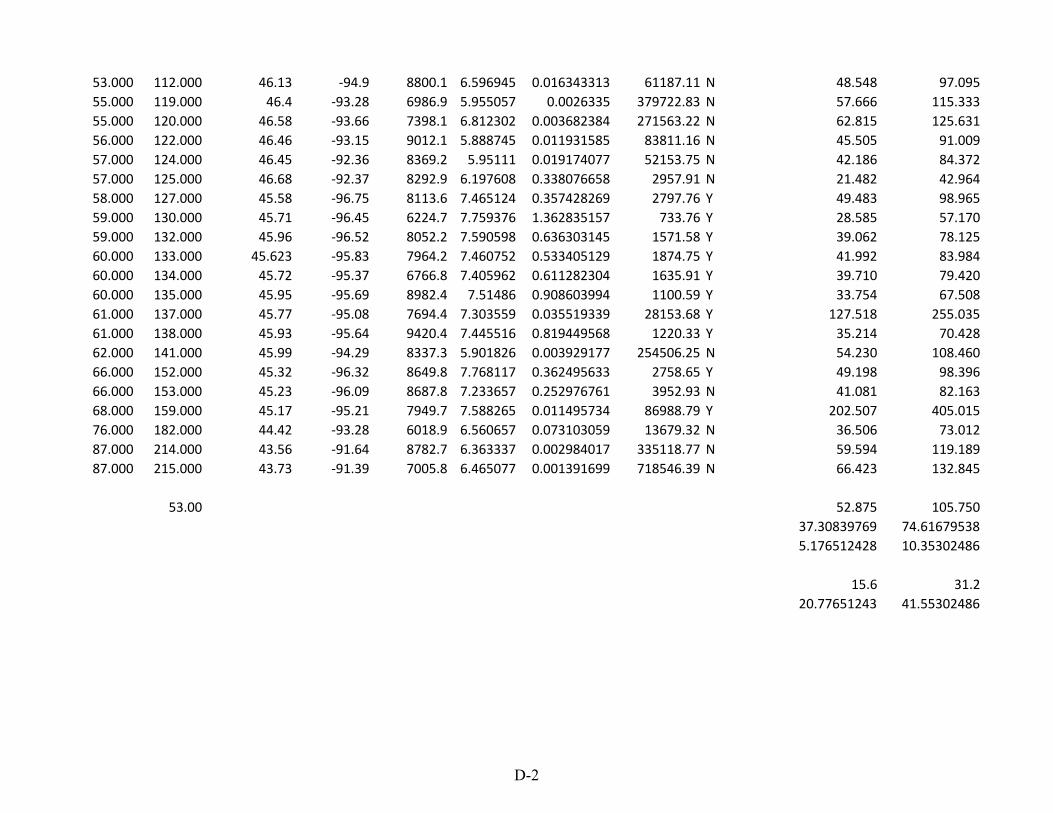
53.000 112.000 46.13 ‐94.9 8800.1 6.596945 0.016343313 61187.11 N 48.548 97.095
55.000 119.000 46.4 ‐93.28 6986.9 5.955057 0.0026335 379722.83 N 57.666 115.333
55.000 120.000 46.58 ‐93.66 7398.1 6.812302 0.003682384 271563.22 N 62.815 125.631
56.000 122.000 46.46 ‐93.15 9012.1 5.888745 0.011931585 83811.16 N 45.505 91.009
57.000 124.000 46.45 ‐92.36 8369.2 5.95111 0.019174077 52153.75 N 42.186 84.372
57.000 125.000 46.68 ‐92.37 8292.9 6.197608 0.338076658 2957.91 N 21.482 42.964
58.000 127.000 45.58 ‐96.75 8113.6 7.465124 0.357428269 2797.76 Y 49.483 98.965
59.000 130.000 45.71 ‐96.45 6224.7 7.759376 1.362835157 733.76 Y 28.585 57.170
59.000 132.000 45.96 ‐96.52 8052.2 7.590598 0.636303145 1571.58 Y 39.062 78.125
60.000 133.000 45.623 ‐95.83 7964.2 7.460752 0.533405129 1874.75 Y 41.992 83.984
60.000 134.000 45.72 ‐95.37 6766.8 7.405962 0.611282304 1635.91 Y 39.710 79.420
60.000 135.000 45.95 ‐95.69 8982.4 7.51486 0.908603994 1100.59 Y 33.754 67.508
61.000 137.000 45.77 ‐95.08 7694.4 7.303559 0.035519339 28153.68 Y 127.518 255.035
61.000 138.000 45.93 ‐95.64 9420.4 7.445516 0.819449568 1220.33 Y 35.214 70.428
62.000 141.000 45.99 ‐94.29 8337.3 5.901826 0.003929177 254506.25 N 54.230 108.460
66.000 152.000 45.32 ‐96.32 8649.8 7.768117 0.362495633 2758.65 Y 49.198 98.396
66.000 153.000 45.23 ‐96.09 8687.8 7.233657 0.252976761 3952.93 N 41.081 82.163
68.000 159.000 45.17 ‐95.21 7949.7 7.588265 0.011495734 86988.79 Y 202.507 405.015
76.000 182.000 44.42 ‐93.28 6018.9 6.560657 0.073103059 13679.32 N 36.506 73.012
87.000 214.000 43.56 ‐91.64 8782.7 6.363337 0.002984017 335118.77 N 59.594 119.189
87.000 215.000 43.73 ‐91.39 7005.8 6.465077 0.001391699 718546.39 N 66.423 132.845
53.00 52.875 105.750
37.30839769 74.61679538
5.176512428 10.35302486
15.6 31.2
20.77651243 41.55302486
D-2

Appendix E: Recommended Needs Statements

Appendix E – Research Needs Statements
Title: HDPE Inspection and Testing Methods
Research need: (Clearly and concisely describe the transportation problem or opportunity)
Plastic pipe has been installed in Minnesota for nearly 20 years. New material blends have the potential to provide corrosive resistance for 100 years. As such, MnDOT is considering increasing the locations where plastic pipe is allowed. There are, however, remaining concerns over proper installation techniques for HDPE. Prior to changing guidelines MnDOT should verify the performance of pipes installed in the last 20 years.
Some newly installed pipes are being rated as being in fair or poor condition, instead of being given a rating of “like new”. Pipes starting out in bad condition due to damage during construction or a poor installation will not meet the desired service life. This means additional resources will be needed to repair the pipe or to replace it early.
Research proposed: (Your idea for a research project to solve the problem – include tasks as needed to fully explain the direction this research should take)
The proposed research consists of two parts: (1) Inspection of existing MnDOT plastic pipe installations and (2) a review of inspections techniques and use guidelines for plastic pipe currently employed by MnDOT and other state DOTs.
For the inspection phase, researchers will inspect a minimum of 15 HDPE and 15 PVC culverts and storm sewers. Inspection techniques will include mandrel tests, direct measurement, laser ring and video. Five concrete and five steel pipes will also be inspected to serve as a baseline comparison. The results will be compared to evaluate how representative one type of test is to the other test methods.
Results from the inspection phase will be used to improve guidelines for plastic pipe use and document successful installations. Options for improving pipe installation, inspection, and acceptance will be developed. Such options include deductions for not meeting acceptance criteria and advanced testing techniques.
A review will be conducted of laser ring and video specifications currently in use by other state DOTs. This review, along with the inspection results, will be used to develop laser ring and video specifications for MnDOT. The laser ring specification should be developed such that it is applicable to all pipe materials.
The cost of implementing new laser ring and video specifications should be estimated for both inspection costs and review/approval costs.
List known related local, state or national current or recent projects, studies or reports: (Title, date, author and sponsor)
“A Research Plan and Factors Affecting Service Life for Culvert Pipe Materials in Minnesota” 2012, C. Taylor and J. Marr, Sponsored by MnDOT
E-1

“Methodology to Evaluate Oxidation Degradation of High-Density Polyethylene Corrugated Pipe Resin” 2010, Y.G. Hsuan and W-K. Wong, Sponsored by FDOT
“Evaluation of HDPE Pipelines Structural Performance” 2010. A. Abolmaali, A. Motahari, J. Hutcheson, and T. Le., Sponsored by the Initiative on the Underground Structural Healt Monitoring and Equipment Development.
How will we use the results and how can they be implemented into practice?
The results will be used to update the guidelines for plastic pipe use and provide new specifications for pipe inspection
What other groups or stakeholders need to be kept abreast of this research?
The local roads research board, pipe manufacturers, and materials inspectors would all be interested in these results.
Projected Cost and Duration:
Laser ring inspection services for 24-48 inch pipes costs about $4-$6 per foot. The projected cost and duration is approximately $100,000 and 18 months. A rough cost brakes down is a follows:
$14,000 Research Team Inspection
$50,000 Laser Ring & Video Inspection
$10,000 Policy Review
$20,000 Results Analysis
$6,000 Reporting
E-2

Title: Minnesota Steel Pipe Service Life Map
Research need: (Clearly and concisely describe the transportation problem or opportunity)
The MnDOT Drainage Manual refers to the California Method (AASHTO 2007) for estimating service life for steel pipe. The two key parameters required for use of the California Method are pH and resistivity. The current method for estimating steel pipe life is for the designer to take field samples for these two parameters. Although this method is desirable, time and expense restrictions often make sampling impractical. A state wide steel pipe service life map based on the California Method is needed to improve steel pipe design efficiency.
The Natural Resources Conservations Service (NRCS) web soil survey (WSS) has adequate estimates for soil pH and resistivity for about half of the state. This data set in insufficient to develop a state wide steel pipe service life map.
Research proposed: (Your idea for a research project to solve the problem – include tasks as needed to fully explain the direction this research should take)
The goal of this project is to develop a steel pipe service life map for the state of Minnesota. The California Method (AASHTO 2007) will be utilized to estimate steel pipe service life at locations throughout the state.
Resistivity and pH samples will be collected state wide. These samples will be the basis for service life estimates via the California Method. Forty sample sites will be selected from each district. Sites will be selected with in MnDOT right-of-way and will include major geology features. Samples will be collected during summer months after the spring floods have receded. Resistivity and pH will be recorded either directly or from soil samples taken at each site. Where possible, water samples will also be analyzed for comparison with soil samples.
Resistivity and pH data at each site will be used to estimate service life for 14 and 16-gage galvanize steel pipe and for 14 and 16-gage aluminized steel pipe. An estimated service life map will be developed for each of the four pipe types.
List known related local, state or national current or recent projects, studies or reports: (Title, date, author and sponsor)
“A Research Plan and Factors Affecting Service Life for Culvert Pipe Materials in Minnesota” 2012, C. Taylor and J. Marr, Sponsored by MnDOT
Highway Drainage Guidelines: Fourth Edition: “Chapter 14 – Culvert Inspection, Material Selection, and Rehabilitation Guideline” 2007, American Association of State Highway and Transportation (AASHTO)
How will we use the results and how can they be implemented into practice?
E-3

The estimated service life maps will be added to Chapter 2 of the MnDOT drainage manual and will serve as the primary method for estimating steel pipe service life on MnDOT projects.
What other groups or stakeholders need to be kept abreast of this research?
The local roads research board, pipe manufacturers, and materials inspectors would all be interested in these results.
Projected Cost and Duration:
The projected cost and duration is approximately $50,000 and 12 months. The cost estimate assumes that one crew could process 5 sites per day. A rough cost brake down is a follows:
$5,000 Setup and Crew Training
$30,000 Field Sampling (2 person crews, mileage, and lodging)
$5,000 Equipment
$2,000 GIS Mapping and Site Selection
$8,000 Report and Results Analysis
E-4
Title: Evaluation Concrete Pipe Joint Separation (Option 1)
Research need: (Clearly and concisely describe the transportation problem or opportunity)
Nearly 18% of the inspected concrete pipes on MnDOT right-of-way are found to have joint separations. As such, joint separation is the most common failure mode for concrete pipe. Tie bars are the most common prevention technique; however, it has not been determine if they have the necessary strength and corrosive resistance to prevent separation. Other techniques for preventing joint separation are difficult to evaluate because the physical mechanisms by which joint separations occur are not well understood. Determining the physical mechanisms and the forces driving separation would allow designers to design appropriate prevention techniques.
Research proposed: (Your idea for a research project to solve the problem – include tasks as needed to fully explain the direction this research should take)
Part 1
Conduct detailed joint inspections for 20 concrete pipes that have been flagged in the HydInfra database as having joint separations. Install dynamometers on three joints known to be actively separating. Develop correlation curves between joint separation and site conditions and pipe damage. Site conditions of interest may include soil type, cover depth, pipe slope, and flowing water. Pipe damage of interest may include piping, road voids, cracking, infiltration, misalignment, broken/corroded/missing ties, high water table and damaged joint filter/filler.
Analyze inspection data to identify site conditions most likely to have joint separations. Analyze dynamometer data to determine the forces driving separation in the field.
Part 2
Develop lab tests to replicate site conditions from Part 1 deemed most likely to cause joint separation and evaluate the influence on the rate of joint separation. Monitoring devices may track the following pipe conditions: tilt of individual pipe sections, magnitude of joint separation, driving separation force, soil force on pipe, and material strain.
Analyze testing data to determine the mechanism driving joint separation. Work with technical advisory panel (TAP) to develop techniques to resist joint separation.
List known related local, state or national current or recent projects, studies or reports: (Title, date, author and sponsor)
“A Research Plan and Factors Affecting Service Life for Culvert Pipe Materials in Minnesota” 2012, C. Taylor and J. Marr, Sponsored by MnDOT
Highway Drainage Guidelines: Fourth Edition: “Chapter 14 – Culvert Inspection, Material Selection, and Rehabilitation Guideline” 2007, American Association of State Highway and Transportation (AASHTO)
E-5
“Automated detection of cracks in buried concrete pipe images” 2006, S. Sinha and P. Fieguth, Printed in: Automation in ConstructionVolume 15, Issue 1, January 2006, Pages 58–72
How will we use the results and how can they be implemented into practice?
Results of the project will be used to develop new concrete pipe design and installation techniques.
What other groups or stakeholders need to be kept abreast of this research?
The local roads research board, pipe manufacturers, and materials inspectors would all be interested in these results.
Projected Cost and Duration:
The projected cost and duration is approximately $250,000 and 2.5 years.
E-6

Title: Evaluation Concrete Pipe Joint Separation (Option 2)
Research need: (Clearly and concisely describe the transportation problem or opportunity)
Nearly 18% of the inspected concrete pipes on MnDOT right-of-way are found to have joint separations. As such, joint separation is the most common failure mode for concrete pipe. Tie bars are the most common prevention technique; however, it has not been determine if they have the necessary strength and corrosive resistance to prevent separation. Determining the forces driving separation would allow designers to calculate the appropriate tie bar thickness.
Research proposed: (Your idea for a research project to solve the problem – include tasks as needed to fully explain the direction this research should take)
Conduct detailed joint inspections for 20 concrete pipes that have been flagged in the HydInfra database as having joint separations. For 10 of the inspected pipes install three dynamometers on the three joints most likely to be actively separating. Continue monitoring joint loading for two complete seasons. Develop correlation curves between joint separation, joint loading, site conditions, and pipe damage. Site conditions of interest may include soil type, cover depth, pipe slope, and flowing water. Pipe damage of interest may include piping, road voids, cracking, infiltration, misalignment, broken/corroded/missing ties, high water table and damaged joint filter/filler.
Analyze inspection data to identify site conditions most likely to have joint separations. Analyze dynamometer data to determine the forces driving separation in the field. Use dynamometer results data to determine the necessary tie bar thickness and pipe reinforcement to withstand the separation forces.
List known related local, state or national current or recent projects, studies or reports: (Title, date, author and sponsor)
“A Research Plan and Factors Affecting Service Life for Culvert Pipe Materials in Minnesota” 2012, C. Taylor and J. Marr, Sponsored by MnDOT
Highway Drainage Guidelines: Fourth Edition: “Chapter 14 – Culvert Inspection, Material Selection, and Rehabilitation Guideline” 2007, American Association of State Highway and Transportation (AASHTO)
“Automated detection of cracks in buried concrete pipe images” 2006, S. Sinha and P. Fieguth, Printed in: Automation in ConstructionVolume 15, Issue 1, January 2006, Pages 58–72
How will we use the results and how can they be implemented into practice?
Results of the project will be used to develop new concrete pipe design and installation techniques.
What other groups or stakeholders need to be kept abreast of this research?
E-7
The local roads research board, pipe manufacturers, and materials inspectors would all be interested in these results.
Projected Cost and Duration:
The projected cost and duration is approximately $125,000 and 3 years.
E-8