a report prepared by harry kitchen and enid slack for the ... · property taxes and competitiveness...
TRANSCRIPT

Property Taxes and Competitiveness in British Columbia
A report prepared by
Harry Kitchen and Enid Slack
for the
BC Expert Panel on Business Tax Competitiveness
May 11, 2012

1

2
Table of Contents
1. Introduction ............................................................................................................................. 3
2. Background on Municipal Expenditures and Revenues across Canada .................................. 4
3. The Property Tax in British Columbia .................................................................................... 8
4. Comparison of the Institutional Framework for Property Taxes across Canada ................... 29
5. Municipal Property Tax Approaches to Achieve Economic Development Objectives ........ 37
6. Inter-provincial Comparison of Property Taxes .................................................................... 39
7. Inter-city Comparison of Property Taxes .............................................................................. 44
8. Impact of Property Taxation on Business Properties ............................................................ 57
9. Final Observations ................................................................................................................. 70
Bibliography ................................................................................................................................. 73
Appendix A: Municipal Tax Shares ............................................................................................. 77
Appendix B: Municipal Tax Ratios .............................................................................................. 81
Appendix C: Municipal Tax Review – Terms of Reference ........................................................ 85

3
1. Introduction
For many decades, the property tax has been the primary source of revenue for municipalities in
Canada and many other countries around the world. Its longevity and durability have not been
without study and examination, however, nor has the tax been without criticism. One issue that
has been increasingly examined in the last twenty years compared to previously is the extent to
which the property tax on commercial and industrial properties (often referred to as the non-
residential sector) affects competitiveness. The primary purpose of this report is to consider the
impact of municipal property taxes on business on the overall competitiveness of British
Columbia’s tax system.1
Unfortunately, there is no single index or measure that can determine the extent to which the
property tax affects competitiveness. The impact depends on a variety of factors including the
amount of the tax, the location of the business, the timing of the business cycle, and the type of
business to name a few. Without one index or measure to fall back on, this report relies on a mix
of statistical comparisons, results of previous empirical studies, a description of property tax
practices in other provinces and jurisdictions, and a review of the literature.
Since the property tax is in large part a local tax, there can be considerable variation across local
governments. For this reason, much of the information in this report is not only provided on a
province-wide basis but also for ten cities: Vancouver, Surrey, Abbotsford, Kelowna, Kamloops,
Cranbrook, Prince George, Fort St. John, Victoria, and Nanaimo. These cities were chosen to
include major cities and regional centres and to capture the range of tax rates. Vancouver and
Surrey are the largest municipalities in Metro Vancouver; Abbotsford is the major population
centre in the Fraser Valley; Kelowna is the major population centre in the Okanagan; Kamloops
is a major regional centre; Cranbrook is the major centre in the southeast; Prince George is the
major centre in the north and a major industrial centre; Fort St. John is an industrial and regional
centre in the northeast; and Victoria and Nanaimo are the regional centres on Vancouver Island.
1 The terms of reference for this municipal tax review can be found in Appendix C.
4
The report is presented in a number of parts. Following this introduction, Part 2 provides a
summary of municipal spending responsibilities and reliance on revenues in six Canadian
provinces. Part 3 reviews the history of property taxation in British Columbia and discusses its
current application. Part 4 summarizes the institutional framework for property taxation for both
municipal and education purposes across the provinces and territories in Canada. Part 5 discusses
municipal property tax approaches to achieve economic development objectives. Part 6 compares
property tax loads for municipal and education purposes across six provinces and Part 7 makes
the same comparisons for a number of cities in British Columbia and the rest of Canada. Part 8
discusses the impact of property taxation on business properties delving into issues such as the
relationship between property taxes and benefits received from local services, the use of non-
residential property taxes to pay for education, and the impact on economic activity and
competitiveness. Part 9 draws some final observations, as they pertain to competitiveness, from
the information set out in the report. Appendices A and B provide some additional material on
property tax measures in selected municipalities in BC.
2. Background on Municipal Expenditures and Revenues across Canada
Municipal governments in Canada deliver a range of services. At one extreme, there is a group of
services that includes water, sewers, solid waste collection and disposal. These services exhibit
mainly ‘private goods’ characteristics; that is, individual beneficiaries or users can be identified
and hence charged for their use. At the other extreme is a group that includes local streets and
roads, street lighting, neighbourhood parks, and so on. These exhibit mainly ‘public goods’
characteristics; that is, individual beneficiaries cannot be identified, yet the benefits accrue to the
entire community. In between is a range of services that includes a mix of public and private
good characteristics. These services include public recreation, public transit, fire and police
protection, for example.
Table 1 illustrates the relative importance of municipal spending by function for a representative
range of provinces (the choice is partially determined by the availability of statistical data). The
table shows that British Columbia’s per capita spending on municipal responsibilities is well

5
Table 1: Municipal Spending by Function – Selected Provinces1
Spending by Function2
British Columbia Ontario Alberta Quebec Nova Scotia Manitoba
Per
Capita
% of
total
Per
Capita
% of
total
Per
Capita
% of
total
Per
Capita
% of
total
Per
Capita
% of
total
Per
Capita
% of
total
General Government
Protection, (fire and police, etc)
Health, Social Services and Housing
Planning and Development
Roads, streets, parking, public transit
Parks, recreation & culture
Water & Sewer
Solid waste management & recycling
Other services
Environmental Health
Environmental Development
Amortization3
TOTAL
$
196
386
13
48
159
253
198
61
43
---
---
235
1,591
%
12.3
24.3
0.8
3.0
10.0
15.9
12.4
3.9
2.7
---
---
14.8
100.0
$
133
477
864
61
652
268
283
96
22
---
---
0
2,854
%
4.6
16.7
30.3
2.1
22.8
9.4
9.9
3.3
0.8
---
---
0.0
100.0
$
336
454
121
113
729
342
263
114
136
---
---
0
2,610
%
12.9
17.4
4.6
4.3
27.9
13.1
10.1
4.4
5.2
---
---
0.0
100.0
$
226
345
24
102
503
253
200
104
30
10
---
139
1,937
%
11.6
17.8
1.2
5.3
26.0
13.1
10.3
5.4
1.6
0.5
---
7.2
100.0
$
230
354
34
---
322
141
---
---
---
227
69
---
1,371
%
16.8
25.8
2.5
---
23.5
10.3
---
---
---
16.5
5.1
---
100.0
$
189
353
6
52
548
140
208
---
38
44
---
---
1,578
%
12.0
22.4
0.4
3.3
34.7
8.9
13.2
---
2.4
2.8
---
---
100.0
1 Data for British Columbia, Ontario and Alberta municipalities are for 2010. Data for Nova Scotia, Manitoba, and Quebec municipalities are for 2009.
2 The provincial data are not always organized according to these functions, so the authors of this report reorganized the provincial data into these functions.
3 Amortization expenditures were reported as a separate category of expenditures in two provinces, but are included in the functional spending categories in
the other provinces.
--- data were not listed for these expenditure categories.
Source: Compiled from provincial summaries of municipal statistics in each province.

6
below that in Ontario, Alberta, and Quebec; almost the same as Manitoba and above that of Nova
Scotia, a much smaller province. Municipal spending in Ontario is much higher than in BC in
large part because Ontario municipalities play a much larger role in funding social services,
social housing, and land ambulance - $864 per capita in Ontario versus $13 in BC.
Separating municipal services into those that are primarily private or primarily public or a mix of
both is important for funding purposes. Property taxes (including payments in lieu or PILs) are
the major source of local revenue and are important for funding services with public goods
characteristics and for partial funding of services that exhibit a mix of public and private goods
characteristics. User fees constitute the second major source of locally generated revenues. User
fees are important for funding services that display private good characteristics and partial
funding of those services that display a mix of public and private good traits. Table 2 illustrates
revenues per capita and the relative importance of the major revenue sources for funding
municipal services in the selected provinces. Municipal property taxes (including PILS) are the
most important source of locally-generated revenue in every province. Property taxes are levied
on a range of properties including residential, farm, multi-residential, commercial, industrial,
pipelines, utilities, and forest properties. Table 2 indicates that per capita total revenue in BC is
considerably below that in Ontario, Alberta, and Quebec, marginally lower than in Manitoba, but
higher than in Nova Scotia. In terms of property tax revenues, per capita property taxes (from all
classes of property) in BC are considerably lower than in Quebec, Ontario and Alberta,
marginally below the level in Nova Scotia, and marginally higher than in Manitoba. In BC,
however, the property tax accounts for a significantly larger percentage of municipal revenues
than in either Ontario or Alberta, but a lower percentage than in Quebec.
User fees, the other major source of locally generated revenue, are the same in per capita terms
in BC and Ontario, but lower than Alberta and higher than Manitoba, Quebec, and Nova Scotia.
User fees, however, account for a much higher percentage of municipal revenues in BC than in
the other four provinces. The remaining own-source revenues (revenues that exclude transfers),
while important at the margin, account for a relatively small proportion of municipal revenue.

7
Table 2: Municipal Revenue by Source – Selected Provinces1
Revenue Source
British Columbia Ontario Alberta Quebec2
Nova Scotia Manitoba
Per
Capita
% of
total
Per
Capita
% of
total
Per
Capita
% of
total
Per
Capita
% of
total
Per
Capita
% of
total
Per
Capita
% of
total
Property taxation & PILs
User fees
Federal transfers
Provincial transfers
Transfers from other local govts.
Developer contributions
Investment Income
Other
Total
$
893
604
45
123
26
180
48
23
1,942
%
46.0
31.1
2.3
6.3
1.3
9.3
2.5
1.2
100.0
$
1,271
605
169
693
59
---
---
531
3,328
%
38.2
18.2
5.1
20.8
1.8
---
---
15.9
100.0
$
1,325
709
78
613
17
37
101
585
3,364
%
39.4
21.1
2.3
18.2
0.5
1.1
3.0
17.4
100.0
$
1,565
323
---
382
---
34
2
134
2,440
%
64.1
13.2
---
15.7
---
1.4
0.1
5.5
100.0
$
919
186
---
166
---
---
---
114
1,396
%
65.8
13.3
---
12.0
---
---
---
8.1
100.0
$
853
572
109
296
---
---
62
228
2,121
%
40.2
27.0
5.2
14.0
---
---
2.9
10.8
100.0
1 Data for British Columbia, Ontario and Alberta municipalities are for 2010. Data for Nova Scotia, Manitoba, and Quebec municipalities are for 2009.
2 All federal transfers must pass through the provincial government.
--- data were not listed in these categories.
Source: Compiled from provincial summaries of municipal statistics in each province.

8
3. The Property Tax in British Columbia
Before describing the current property tax system in BC, this section reviews some of the recent
history of property taxation that has affected business properties in particular.
Recent history of property taxes in BC2
Prior to 1983, BC used a system of assessment ratios to determine property taxes payable to
provincial and municipal taxing authorities. Under that system, the actual value of a property
(determined by BC Assessment) was discounted by a percentage rate or “assessment ratio” to
arrive at a taxable “assessed value.” The assessment ratios, which were set by the Province and
applied province-wide for school and hospital purposes, were different for each property class.
Municipalities had limited flexibility to implement alternative assessment ratios. Once the
taxable portion of assessment had been determined, taxing jurisdictions applied a single rate of
tax (called a “mill rate”)3 to the discounted values in all property classes. This mechanism meant
that both the provincial and municipal governments had limited flexibility to change the
distribution of taxes payable among property class taxpayers.
In 1983, the Province introduced a variable tax rate system which enabled municipalities to levy
general-purpose taxes on the actual value of land and improvements and to set a different tax rate
for each class of property. This variable rate system was extended to school, hospital, and other
taxes. Assessed values were set at 100 percent of actual value for all property classes and
assessment ratios were abandoned. The new flexibility at the local level put the policy decision
of determining the distribution of the municipal tax burden among the property classes in the
hands of municipalities. According to Berniaz (2009), the business community opposed the
move to a variable rate system because they were afraid that businesses would face significantly
higher tax rates. At the time, the business community recommended a maximum ratio of 2:1.
Municipalities opposed tax limits and none were imposed.
2 This historical account is based on Municipal Port Property Taxation Fairness Commission, 2010 and Berniaz,
2009. 3 One mill was equal to one dollar for each $1,000 of taxable value.

9
Over the period from 1983 to 1988, the Province made further changes to respond to industry
concerns on specific issues. In 1984, a $10,000 exemption was created for all industrial and
commercial properties and the exemption for the Machinery and Equipment class was increased
to $50,000. This latter exemption had the effect of removing all of the taxable value for
thousands of properties in the Machinery and Equipment class from the rolls. In 1986, the
Machinery and Equipment property class was removed from the 1987 assessment roll.
The following changes to specific classes and uses were also made over the years:
Industrial Class: In 1988, the Industrial property class was divided into two: Class 4
(Major Industry) and Class 5 (Light Industry). Class 4 improvements were assessed
according to a prescribed cost approach (minus straight-line depreciation) as
subsequently formulated in the Major Industrial Properties (MIPS) manual.
Utilities: Property tax rates on utilities (Class 2) were capped in 1996.4 Municipal tax
rates for Class 2 could not exceed the greater of $40 per $1000 assessed value and 2.5
times the Class 6 property rate set by the municipality. These changes were phased in
from 1997 to 2000 for specific municipalities.
The assessment of railways was also adjusted in 1996 and phased in between 1997 and
2000. In 2000, the taxable values for school tax purposes were set at 91 percent of
assessed values. For municipal, regional district, and the rural tax purposes, taxable
values were set at 55 percent of assessed values inside municipalities and 40 percent
outside municipalities. Railway bridges were removed from the definition of
“improvements” for assessment; this change was also phased in between 1997 and 2000
and non-right-of-way lands were no longer valued and classified as Class 2 but as Class 6
(e.g. rail yards).
4 The impetus for the tax limit on Class 2 began in the 1980s with changes to railway assessment. The assessment
changed from values that were similar to adjacent land to a standardized per kilometre assessment. Some rural land
with low assessed values experienced increases; some urban land with high assessed values experienced decreases.
Urban municipalities tended to increase tax rates to maintain revenues and rural municipalities tended to keep tax
rates the same and receive larger revenues.

10
Port Properties: The tax treatment of port properties changed in 2004, following the BC
Ports Competitiveness Initiative the year before. For eligible port properties, the tax rate
was capped at $27.50 for Class 4 (Major Industry) per thousand dollars for existing
facilities from 2004 to 2008 (subsequently extended to 2018). A capped rate of $22.50
per thousand dollars applied to new investments, for 10 years (subsequently extended to
2019). The Province agreed to compensate port property host jurisdictions for forgone
municipal tax revenues. As part of the BC Ports Competitiveness Initiative, berth
corridors were exempted from property taxes.5
In response to additional concerns that land assessment values for port properties subject
to restricted (port) uses were escalating unfairly because they were being compared to
neighbouring unrestricted property values, the province established a land assessment
value mechanism in 2007 whereby property assessment values are set out in the Port
Land Valuation Regulation for each Class 4 (Major Industry) property with either a 2007
or 2009 base period. The regulation provides for an annual adjustment in the base value
equal to the July-over-July percentage change in the BC consumer price index.
Other Changes: In 2007, municipalities were enabled to provide tax exemptions to
encourage different forms of revitalization in their communities. Municipalities could
offer reductions in property taxes for individual properties or properties of a specific type
or properties within a specific geographic area. In 2009, the government announced a 50
percent rebate on school property taxes for light and heavy industrial properties (Class 4
and Class 5) for 2009 and 2010. Effective in 2011, the property tax credit is 60 percent of
the school tax payable.
The Current Property Tax System in British Columbia
5 Berth corridors are improvements constructed to allow ships to dock (or berth) beside a port terminal so that goods
can be transported from ships to land-based transportation or storage facilities.

11
The property tax is levied by a number of different taxing authorities, as set out in Table 3:
municipalities, schools, regional districts, hospital districts, transit authorities (Translink and
Victoria Transit), as well as BC Assessment (BCA) and the Municipal Finance Authority
(MFA).
Table 3: Municipal Property Tax Revenues, BC, 2011
Value ($millions) Percent of
total taxes
School
General Municipal
Regional District
Hospital*
GVTA, Victoria Transit
BCA, MFA, and other
Total Variable Rate Taxes
2,104
3,380
215
99
316
88
6,202
34
55
3
2
5
1
100
*Note: The Greater Vancouver Regional District municipalities do not pay hospital
district taxes.
Source: Ministry of Community, Sport and Cultural Development
The Assessment Authority of British Columbia Act, passed in July 1974, established the British
Columbia Assessment Authority (BCA) as the sole authority in BC responsible assessing
property in the province for taxation purposes. The Assessment Act, also passed in July 1974,
clearly established that the assessed property value appearing on the assessment rolls would be
the actual value of the property determined on a uniform basis across the province in accordance
with the Assessment Act.
Assessment Methods
Three principal methods are used by BCA to value property: market (or sales) method, income
method, and cost method. The market approach determines property values based on the sale
price of comparable properties. For properties where there are similar or comparable properties
and recorded sales, property assessments are generally based on observed market transactions
with adjustments to reflect differences (location, size, condition, etc.) between the subject
property and the observed sales. The market method is generally used for residential properties
(Class 1).

12
Where there is a scarcity of observed sales, BCA assessors may use the income method or
replacement cost (with depreciation) to establish assessed values. The income method determines
property values based on the earning power of an income producing property. This method is
applied to business properties (Class 6) and some light industry properties (Class 5). The cost
approach determines property value based on a standardized estimate of construction costs. This
method is used for properties that do not trade in the market and applies to properties in Class 2
and Class 4. The standardized costs for improvements in the major industrial class are based on
the Major Industrial Properties System (MIPS) manual.6
Although market and income approaches are more responsive to changes in market conditions
than the cost approach, the latter is necessary for Classes 2 and 4 because these classes contain
specialized properties. They do not generally have a well established earning history needed for
the income approach and they have little sales evidence needed for the market approach
(Premier’s Task Force on Community Opportunities, 2006).
Classification of Properties
The classification of properties for taxation purposes is determined by BC Assessment and is
governed by provincial legislation and regulations. The main determinant of property class is the
actual current use of the property. Municipalities have the authority to tax different classes of
property at different tax rates but the Lieutenant Governor can set limits on the tax rates imposed
on a specific class of property. As noted earlier, for example, the Province capped property tax
rates on Class 2 properties in 1996 and it capped tax rates on port terminals in 2004.
Table 4 shows the percentage of municipal tax collected from each of the nine property classes in
2011. The two major classes in terms of municipal tax revenues are Class 1 (residential) and
Class 6 (business/other). Together, they accounted for 90 percent of all property taxes in BC in
2011.
6 A similar manual is used for improvements in the utilities class (Class 2).

13
Non-residential properties are contained in five different property classes – utilities (Class 2),
major industry (Class 4), light industry (Class 5), business and other properties (Class 6), and
recreational and non-profit organizations (Class 8). Table 5 shows the distribution of non-
residential properties along with their total taxable values by class of non-residential property for
ten cities in British Columbia: Vancouver, Surrey, Abbotsford, Kelowna, Kamloops, Cranbrook,
Prince George, Fort St. John, Victoria, and Nanaimo.
Table 4: Share of Municipal Tax by Property Class, BC, 2011 Property Class Share of Municipal
Tax
Class 1 – Residential
Class 2 – Utilities
Class 3 – Supportive housing
Class 4 – Major industry
Class 5 – Light industry
Class 6 – Business/other
Class 7 – Managed forest land
Class 8 – Recreational/non-profit organization
Class 9 – Farm land
59.69%
1.49%
0.0%
4.56%
3.45%
30.37%
0.01%
0.22%
0.21%
Source: Local Government in British Columbia, Statistics and Facts, December 31, 2011
Table 5 shows that the majority of properties and taxable value of non-residential properties can
be found in Class 6 but there is considerable variation among the cities in terms of its relative
importance:
The average for the ten cities indicates that over 80 percent of all non-residential
properties fall in the business/other category (class 6) and over 90 percent of taxable
properties are associated with these properties.
Considerable variation can be found in the relative importance of the number of
businesses in Class 6 – Surrey, Abbotsford, Nanaimo, Prince George, and Kamloops are
the lowest with between 66 percent and 76 percent of all non-residential properties
14
Table 5: Number of Non-Residential Properties and Taxable Value by Non-Residential Category in Ten BC Cities
Non-residential
category (class no.)
Victoria Nanaimo
Number of
Properties
% of
Properties
Taxable
Value ($000)
% of Tax
Value
Number of
Properties
% of
Properties
Taxable
Value
% of Tax
Value
Utilities (2)
Major Industry (4)
Light Industry (5)
Business/other (6)
Rec/Non Profit (8)
Total
37
1
52
2,728
312
3,130
%
1.2
0.0
1.7
87.2
10.0
100.0
$
63,320
10,341
53,230
3,895,016
23,779
4,045,686
%
1.6
0.3
1.3
96.3
0.6
100.0
105
24
63
1,656
389
2,237
%
4.7
1.1
2.8
74.0
17.4
100.0
$
58,388
102,098
714,336
1,692,136
20,271
1,944,229
%
3.0
5.3
3.7
87.0
1.0
100.0
Non-residential
category (class no.)
Vancouver Surrey
Number of
Properties
% of
Properties
Taxable
Value ($000)
% of Tax
Value
Number of
Properties
% of
Properties
Taxable
Value ($000)
% of Tax
Value
Utilities (2)
Major Industry (4)
Light Industry (5)
Business/other (6)
Rec/Non Profit (8)
Total
189
16
454
13,516
870
15,045
%
1.3
0.1
3.0
89.8
5.8
100.0
$
318,388
196,363
694,336
31,115,469
288,422
32,612,978
%
1.0
0.6
2.1
95.4
0.9
100.0
367
44
807
6,750
2,203
10,171
%
3.6
0.4
7.9
66.4
21.7
100.0
$
247,739
105,046
1,506,463
8,548,225
123,869
10,531,343
%
2.4
1.0
14.3
81.2
1.2
100.0
Non-residential
category (class no.)
Abbotsford Kelowna
Number of
Properties
% of
Properties
Taxable
Value ($000)
% of Tax
Value
Number of
Properties
% of
Properties
Taxable
Value ($000)
% of Tax
Value
Utilities (2)
Major Industry (4)
Light Industry (5)
Business/other (6)
Rec/Non Profit (8)
Total
166
0
243
2,064
433
2,906
%
5.7
0.0
8.4
71.0
14.9
100.0
$
156,109
0
375,683
2,573,114
13,327
3,118,234
%
5.0
0.0
12.0
82.5
0.4
100.0
113
0
83
1,825
139
2,160
%
5.2
0.0
3.8
84.5
6.4
100.0
$
88,140
0
180,428
2,176,991
58,715
2,504,273
%
3.5
0.0
7.2
86.9
2.3
100.0

15
Non-residential
category (class no.)
Cranbrook Kamloops
Number of
Properties
% of
Properties
Taxable
Value ($000)
% of Tax
Value
Number of
Properties
% of
Properties
Taxable
Value ($000)
% of Tax
Value
Utilities (2)
Major Industry (4)
Light Industry (5)
Business/other (6)
Rec/Non Profit (8)
Total
26
0
22
854
63
965
%
2.7
0.0
2.3
88.5
6.5
100.0
$
17,306
0
13,364
413,773
8,507
452,951
%
3.8
0.0
3.0
91.4
1.9
100.0
197
21
51
1,782
276
2,327
%
8.5
0.9
2.2
76.6
11.9
100.0
$
109,461
93,351
46,897
1,658,615
15,057
1,923,421
%
5.7
4.9
2.4
86.2
0.8
100.0
Non-residential
category (class no.)
Prince George Fort St. John
Number of
Properties
% of
Properties
Taxable
Value ($000)
% of Tax
Value
Number of
Properties
% of
Properties
Taxable
Value ($000)
% of Tax
Value
Utilities (2)
Major Industry (4)
Light Industry (5)
Business/other (6)
Rec/Non Profit (8)
Total
146
40
94
1,837
308
2,425
%
6.0
1.6
3.9
75.8
12.7
100.0
$
74,040
245,935
83,918
1,327,699
4,948
1,736,535
%
4.3
14.2
1.8
76.5
0.3
100.0
34
3
14
1,175
34
1,260
%
2.7
0.2
1.1
93.3
2.7
100.0
$
12,099
40,904
8,704
675,229
1,389
738,325
%
1.6
5.5
1.2
91.5
0.2
100.0
Non-residential
category (class no.)
Average for The Ten B.C. Cities
Number of
Properties
% of
Properties
Taxable
Value ($000)
% of Tax
Value
Utilities (2)
Major Industry (4)
Light Industry (5)
Business/other (6)
Rec/Non Profit (8)
Total
1,380
149
1,883
34,187
5,027
42,626
%
3.2
0.3
4.4
80.2
11.8
100.0
$
1,144,986
794,039
3,034,361
54,076,267
558,321
59,607,973
%
1.9
1.3
5.1
90.7
0.9
100.0
Source: Calculated from BC Business Tax Study Data
16
falling in this class whereas Kelowna, Victoria, Cranbrook, Vancouver, and Fort St.
John are the highest with between 85 percent and 93 percent of non-residential
properties in Class 6.
There is also considerable variation in the percentage of taxable values that fall in Class
6. Over 80 percent of all taxable values in every city except for Prince George are in
Class 6. Victoria and Vancouver are the highest at 96 percent; Cranbrook and Fort St
John follow with between 91 percent and 92 percent; and Prince George is the lowest at
almost 77 percent.
Unlike Class 1 for which the primary actual uses are fairly homogeneous, the definition of other
classes includes a variety of property uses. The business/other category (Class 6), for example,
includes store and commercial services, office/commercial space, big box and shopping centres,
hotels, storage and warehouses, and strata non-residential among others.7 Table 6 provides a
breakdown of Class 6 by category of use for ten BC cities. Table 6 is suggestive since many
properties have more than one use; for example, many office buildings have retail space on the
main floor and many retail properties have office or residential space. Table 6 indicates the
following:
Commercial properties account for around 90 percent of taxable properties in most cities
with stores, office properties and shopping centres dominating Class 6 property use. The
percentage of properties falling in this category is much smaller than the relative
importance of taxable values.
Strata non-residential property use accounts for less than 10 percent of taxable values in
most cities but this category accounts for a much higher percentage of properties.
7 Class 4 includes the following sub-sectors: pulp and paper mills, sawmills, docks and wharves, smelting and
refining, mining and milling (metallic), grain elevators, mining (coal), oil refining plants, chemical and chemical
products industries, gas scrubbing plants, primary metal industries, cement plants, plywood mills, mining and
milling (non-metallic), shipyards, shingle mills, and planer mills.
17
Table 6: Composition of Business/Other (Class 6) by Major Type of Use in Ten B.C. Cities
Major Use
Victoria Nanaimo Vancouver Surrey
% of
taxable
value
% of
properties
% of
taxable
value
% of
properties
% of
taxable
value
% of
properties
% of
taxable
value
% of
properties
Stores and commercial services
Stores and office
Office building (primary use)
Big box & shopping centre
Hotel
Storage and Warehousing
Total Commercial
Strata non-residential
Other
10.5
13.9
19.4
14.4
8.1
6.9
91.4
6.9
1.7
6.7
3.0
5.2
0.4
0.7
4.7
36.1
26.4
37.5
4.4
2.7
10.6
38.0
2.6
16.1
91.1
3.1
5.8
8.1
3.6
11.6
1.9
0.6
13.6
70.0
10.7
19.3
16.5
8.3
34.4
2.8
5.0
6.4
88.2
8.6
3.2
15.9
4.3
4.7
0.1
0.5
6.5
43.8
48.8
7.4
10.8
2.4
8.9
21.9
1.1
16.4
78.6
13.8
7.6
8.8
1.1
2.8
0.8
0.2
6.8
29.7
54.0
16.3
Major Use
Abbotsford Kelowna Cranbrook Kamloops
% of
taxable
value
% of
properties
% of
taxable
value
% of
properties
% of
taxable
value
% of
properties
% of
taxable
value
% of
properties
Stores and commercial services
Stores and office
Office building (primary use)
Big box & shopping centre
Hotel
Storage and Warehousing
Total Commercial
Strata non-residential
Other
10.7
3.8
8.1
25.8
2.2
15.8
84.4
8.6
7.0
13.6
2.1
4.4
1.3
0.3
9.0
46.0
30.7
23.3
12.3
3.2
4.5
27.1
2.6
16.2
84.6
8.3
7.1
10.1
2.1
2.7
0.8
0.3
8.4
51.9
28.8
19.3
14.7
4.9
8.5
22.1
6.0
12.5
93.3
1.1
5.6
24.6
4.1
7.7
0.7
0.8
12.2
74.9
3.9
21.2
11.1
2.3
8.4
27.6
6.5
11.4
89.1
5.4
5.5
21.9
3.1
7.0
1.2
1.5
8.2
65.0
17.1
17.9

18
Major Use
Prince George Fort St. John Average of Ten BC Cities
% of
taxable
value
% of
properties
% of
taxable
value
% of
properties
% of
taxable
value
% of
properties
Stores and commercial services
Stores and office
Office building (primary use)
Big box & shopping centre
Hotel
Storage and Warehousing
Total Commercial
Strata non-residential
Other
10.7
2.0
9.8
24.4
5.6
21.4
93.9
0.8
5.2
24.6
2.7
8.8
1.1
0.7
19.1
78.3
5.3
16.4
20.6
1.5
7.2
4.7
9.0
20.0
97.7
0.8
1.5
51.0
1.4
6.3
0.3
0.9
11.6
92.0
2.6
5.4
14.0
6.7
24.2
11.3
4.5
9.9
87.0
8.9
4.1
14.9
3.0
5.1
0.6
0.5
7.9
47.2
36.9
15.9
Source: Calculated from BC Business Tax Study Data

19
Trends in Assessment and Tax Shares, Tax Ratios, and Taxes per Capita
To understand whether the property tax burden on business properties is too high, three measures
are analyzed-- tax shares, tax ratios, and taxes per capita. Figure 1 shows the trend, over the past
25 years, in the distribution of the tax burden compared to the composition of the assessment
base for all local governments in BC. Only Class 1 and Class 6 are shown because together they
represent over 90 percent of the assessment base. Class 1 assessment as a share of total
assessment increased from 74 percent in 1985 to 85 percent in 2011. At the same time, the Class
6 share fell from 19 percent to 13 percent of total assessment.
Over the entire period, for the province as a whole, the Class 1 share of assessment is
significantly higher than its share of taxes; the Class 6 share of assessment is less than its share
of taxes. Although business properties pay a higher share of taxes than their share of the
assessment base, their relative tax burden has been declining. Business properties paid over 31
percent of total taxes in 1985. This share rose to 33 percent over the period from 2002 to 2008
and has declined to just over 30 percent in 2011. For residential properties, the share of taxes was
54 percent in 1985 and has risen to almost 60 percent in 2011.
Table 7 shows the distribution of tax burden and composition of assessment for ten cities in BC
in 2011 for Classes 1,2,4,5, and 6. In all cases, Class 1 properties have a much higher share of
assessment than taxes. For all other property classes, the share of taxes exceeds the share of
assessment. For Class 6, the share of taxes is approximately twice the share of assessment in
most of the ten cities.

20
Table 8 looks at municipal tax shares for the residential and each of the non-residential property
classes for the ten cities in 1988 and 2011. Overall for the province, the share of taxes in Class 1
increased; Classes 2, 4, and 6 decreased; and Class 5 increased. The change in tax shares
between 1988 and 2011 follows no pattern among the cities, however. In five cities, the tax share
for Class 1 increased; in four cities, it decreased; and in one city (Kamloops), it stayed the same.
Similarly, for Class 6 properties, the tax share increased in four cities and decreased in six cities.
The tax share for Class 2 fell in all ten cities but there was some variation in Classes 4 and 5.
Class 1 Share of Taxes
Class 6 Share of Taxes
Class 1 Share of Assessment
Class 6 Share of Assessment
0.0%
10.0%
20.0%
30.0%
40.0%
50.0%
60.0%
70.0%
80.0%
90.0%
19
85
19
87
19
89
19
91
19
93
19
95
19
97
19
99
20
01
20
03
20
05
20
07
20
09
20
11
Shar
eFigure 1:
Shares of Assessment and Taxes, Class 1 and Class 6, BC, 1985-2011

21
Table 7: Distribution of the Tax Burden by Property Class, Selected Municipalities, 2011 Municipality Class 1 Class 2 Class 4 Class 5 Class 6 All other classes
Share of
total
assessed
value
Share
of total
taxes
Share of
total
assessed
value
Share
of total
taxes
Share of
total
assessed
value
Share of
total
taxes
Share of
total
assessed
value
Share
of
total
taxes
Share of
total
assessed
value
Share
of total
taxes
Share of
total
assessed
value
Share
of total
taxes
Vancouver
Prince George
Surrey
Kelowna
Nanaimo
Abbotsford
Cranbrook
Fort St. John
Victoria
Kamloops
Provincial
Average
%
83
77
87
85
85
83
82
70
78
85
85
%
53
54
68
70
67
63
60
43
49
59
60
%
0
0
0
0
0
0
0
0
0
1
0
%
1
1
1
0
1
3
1
0
1
3
2
%
0
3
0
0
1
0
0
2
0
1
1
%
1
15
1
0
3
0
0
6
0
8
5
%
0
1
2
1
1
2
0
0
0
0
1
%
1
3
4
2
1
4
1
1
1
1
4
%
16
18
11
14
13
13
17
28
22
13
13
%
44
27
26
27
28
28
37
49
49
28
30
%
1
1
0
0
0
2
1
0
0
0
0
%
0
0
0
1
0
2
1
1
0
1
0
Source: Information provided by the Ministry of Community, Sport and Cultural Development

22
Table 8: Municipal Tax Shares, Residential and Business Classes, Selected Municipalities,
1988 and 2011
(%) Municipality 1988 2011
Class
1
Class
2
Class
4
Class
5
Class
6
Class
1
Class
2
Class
4
Class
5
Class
6
Vancouver
Prince George
Surrey
Kelowna
Nanaimo
Abbotsford
Cranbrook
Fort St. John
Victoria
Kamloops
Provincial
Average
39.8
56.8
70.7
65.3
57.1
66.7
46.8
43.8
47.2
59.0
53.8
1.3
4.5
1.3
1.2
1.6
5.2
4.7
1.7
1.4
6.2
2.3
1.7
17.1
0.7
0.5
10.9
0.1
1.6
0.0
0.7
7.5
9.2
1.7
0.8
3.5
4.3
0.7
1.5
0.8
2.1
0.6
1.4
2.2
55.4
20.7
23.0
27.4
29.3
22.4
45.7
52.1
49.2
25.5
31.7
53.0
54.0
68.0
70.0
67.0
63.0
60.0
43.0
49.0
59.0
59.7
1.0
1.0
1.0
0.0
1.0
3.0
1.0
0.0
1.0
3.0
1.5
1.0
15.0
1.0
0.0
3.0
0.0
0.0
6.0
0.0
8.0
4.6
1.0
3.0
4.0
2.0
1.0
4.0
1.0
1.0
1.0
1.0
3.5
44.0
27.0
26.0
27.0
28.0
28.0
37.0
49.0
49.0
28.0
30.4
Note: The information in this table starts in 1988 because the industrial property class was divided into
two classes in that year: Class 4 (Major Industry) and Class 5 (Light Industry).
Source: Information provided by the Ministry of Community, Sport and Cultural Development
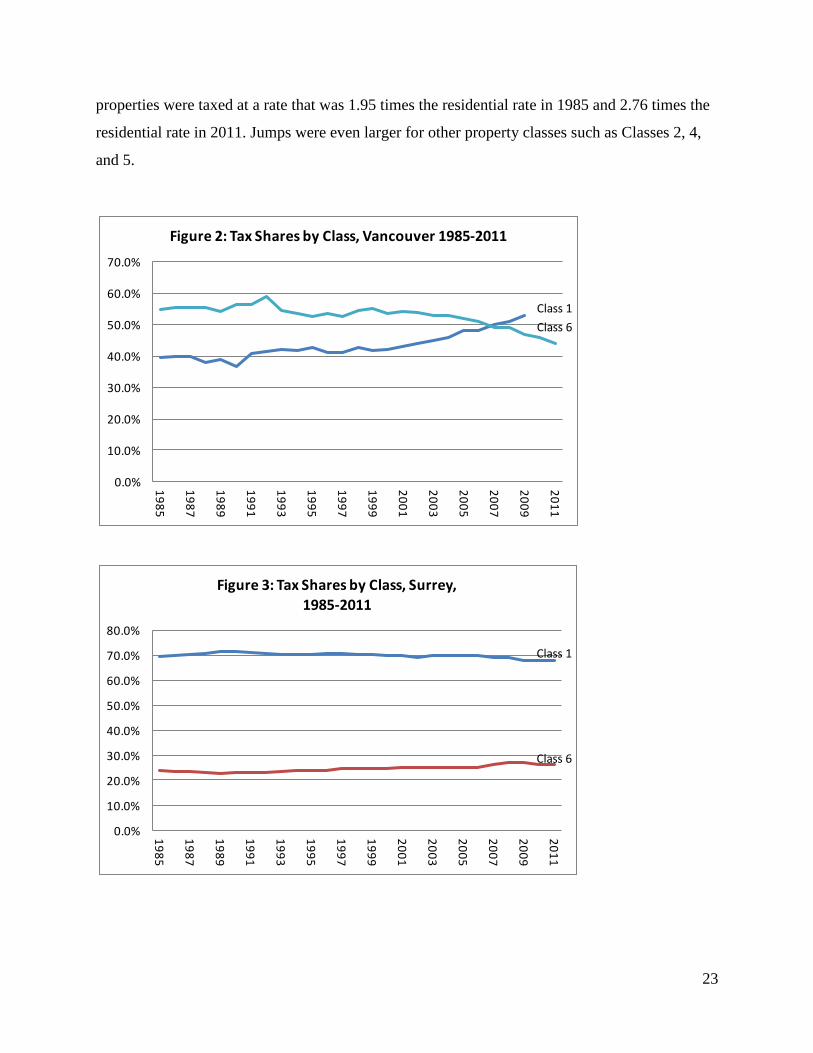
Figures 2 and 3 show how tax shares for Class 1 and Class 6 have changed over the period from
1985 to 2011 for Vancouver and Surrey. Similar figures for the other eight cities can be found in
Appendix A. In Vancouver, the share of taxes in Class 6 exceeded the share for Class 1 up until
2007 and then fell below. For Surrey, the tax shares for Class 1 and Class 6 have remained fairly
constant over the period with a slight rise in Class 6 in recent years and a slight decline in Class
1. As can be noted in Appendix A, tax shares were also fairly constant for Class 1 and Class 6
over the period from 1985 to 2011 in Kelowna and Kamloops.
Tax rates and tax ratios provide another way to look at the tax burden. Even though the share of
business taxes has declined, the rate at which business is taxed (dollars of tax per thousand
dollars of assessed value) increased relative to the rate at which residential property is taxed. The
increase results because non-residential land values have not risen as quickly as residential land
values. Figure 4 shows tax rate ratios by property class from 1985 to 2011. The ratio is expressed
as a multiple of the residential tax rate which is set at a value of 1.0. For the province as a whole,
the ratio on Class 6 properties went from 1.95 in 1985 to 2.76 in 2011. In other words, business
23
properties were taxed at a rate that was 1.95 times the residential rate in 1985 and 2.76 times the
residential rate in 2011. Jumps were even larger for other property classes such as Classes 2, 4,
and 5.
Class 1
Class 6
0.0%
10.0%
20.0%
30.0%
40.0%
50.0%
60.0%
70.0%
19
85
19
87
19
89
19
91
19
93
19
95
19
97
19
99
20
01
20
03
20
05
20
07
20
09
20
11
Figure 2: Tax Shares by Class, Vancouver 1985-2011
Class 1
Class 6
0.0%
10.0%
20.0%
30.0%
40.0%
50.0%
60.0%
70.0%
80.0%
19
85
19
87
19
89
19
91
19
93
19
95
19
97
19
99
20
01
20
03
20
05
20
07
20
09
20
11
Figure 3: Tax Shares by Class, Surrey,
1985-2011

24
Figures 5 and 6 illustrate the trend in municipal tax ratios for Vancouver and Surrey from 1985
to 2011. Similar figures for the other eight cities can be found in Appendix B. In both cities,
Class 2 tax ratios have been steadily rising. Class 4 ratios have been rising in Vancouver but
have started to decline in Surrey. In both cities, the tax ratios for Class 5 and Class 6 are similar
to each other and, in both cities, they appear to have been declining in recent years.
Class 2Class 4
Class 5
Class 6
0.00
1.00
2.00
3.00
4.00
5.00
6.00
7.00
8.00
9.00
19
85
19
87
19
89
19
91
19
93
19
95
19
97
19
99
20
01
20
03
20
05
20
07
20
09
20
11
Tax
rati
o
Figure 4: Municipal Tax Ratios, BC, 1985-2011

25
Table 9 shows municipal tax ratios for ten cities in 1985 and 2011. The Class 2 ratio has more
than doubled over the 25-year period. With the exception of Vancouver, the Class 5 ratio has
also increased over the period. With the exception of Fort St. John, the Class 6 tax ratio has
increased over the period.
Class 2
Class 4
Class 5Class 6
0.00
2.00
4.00
6.00
8.00
10.00
12.00
14.00
16.00
18.00
20.001
98
5
19
87
19
89
19
91
19
93
19
95
19
97
19
99
20
01
20
03
20
05
20
07
20
09
20
11
Figure 5: Municipal Tax Ratios, Vancouver, 1985-2011
Class 2
Class 4
Class 5Class 6
0.00
2.00
4.00
6.00
8.00
10.00
12.00
14.00
16.00
19
85
19
87
19
89
19
91
19
93
19
95
19
97
19
99
20
01
20
03
20
05
20
07
20
09
20
11
Figure 6: Municipal Tax Ratios, Surrey, 1985-2011

26
Table 9: Municipal Tax Ratios, Business Classes, Selected Municipalities, 1988 and 2011 Municipality 1988 2011
Class 2 Class 4 Class 5 Class 6 Class 2 Class 4 Class 5 Class 6
Vancouver
Prince George
Surrey
Kelowna
Nanaimo
Abbotsford
Cranbrook
Fort St. John
Victoria
Kamloops
Provincial Average
4.40
2.00
3.22
2.21
3.05
2.56
4.07
3.63
4.90
2.00
3.20
5.24
1.33
2.27
1.74
2.40
2.11
2.98
0.00
2.16
1.59
2.97
5.24
1.16
2.27
1.74
2.44
2.11
2.99
3.10
2.16
1.59
2.54
3.40
1.16
2.27
1.74
2.10
1.88
3.10
3.02
2.16
1.43
1.99
17.89
5.34
13.84
5.67
7.99
8.38
7.50
7.86
8.77
7.76
7.44
14.79
6.28
4.92
3.32
4.44
0.00
0.00
5.19
3.59
15.40
7.14
4.32
3.59
2.78
2.37
3.00
2.56
3.00
5.07
3.59
5.01
4.15
4.32
2.13
3.12
2.37
2.76
2.75
3.00
2.81
3.59
3.11
2.76
Note: The information in this table starts in 1988 because the industrial property class was divided into
two classes in that year: Class 4 (Major Industry) and Class 5 (Light Industry).
Source: Information provided by the Ministry of Community, Sport and Cultural Development
An increase in tax ratios does not necessarily mean an increase in tax burden. Depending on how
assessed values change over time, the relative tax burden may not change even if tax ratios
increase. Municipalities in BC see the change in property tax rates as a consequence of an
explicit property tax policy to keep the share of property taxes raised from each property class
constant (except for differences in net investment and shifts among the classes). When a policy
of fixed property tax shares is applied consistently, property tax rates are adjusted to keep the
average rate of increase in property taxes paid uniform from class to class (on the basis of the
class average). Under these circumstances, an increasing property tax ratio for a property class
results from much lower growth in assessed values in that class compared to residential values.
As noted earlier, for at least some of the ten cities, class shares have remained fairly constant
over the last 25 years.
Because the assessment methodology is different for Class 4 than for other classes and, in
particular, the assessment base does not increase with market factors, the growth of the tax base
for Class 4 has been more modest than for other classes. As a result, Class 4 assessment has

27
increased slowly relative to other property classes. In response, many municipalities have
increased their tax rates to compensate for the slow rise in assessment.
Some studies have indicated that the declining assessment base for Class 4, for example, has
resulted in municipalities relying on tax increases to maintain their revenue from major industry
(see, for example, Adams, 2004 and Premier’s Task Force on Community Opportunities, 2006).
Adams (2004) argues that major industry inside municipalities declined largely due to
depreciation, plant closures, and assessment appeals. Municipalities offset this decline with an
increase in property tax rates on major industry and, in some communities, tax rate increases
have more than offset the assessment declines. The province-wide share of municipal revenue
from the major industry class nevertheless fell.
The third measure of tax burden – property taxes per capita – is illustrated in Table 10 which
shows property taxes per capita for each of the business classes for ten cities in 1988 and 2011. It
also shows the annual average increase in municipal property taxes per capita over the period
(not taking inflation into account). In nominal terms, property taxes per capita have increased in
all classes for the province as a whole but the annual average increase is greatest for Class 1
properties followed by Class 5 and Class 6 properties. In terms of the ten cities, with the
exception of Class 2 properties in four municipalities and Class 4 properties in five
municipalities, municipal property taxes per capita increased in all ten cities in all classes. For
five municipalities, the largest increase in per capita municipal property taxes was in Class 1. For
most of the other municipalities, the largest increase was in Class 6.
The conclusion from the information provided on tax shares, tax ratios, and taxes per capita for
municipal property taxes is that, on average across the province, tax shares for most business
properties (with the exception of Class 5) have fallen, tax ratios are higher for all classes than 25
years ago but have begun to decline in recent years, and property taxes per capita have increased
more for residential properties than business properties. Another important conclusion, however,
is that there is significant variation among the ten cities. It is thus difficult to provide general
conclusions about the property tax on businesses for the province as a whole based on these
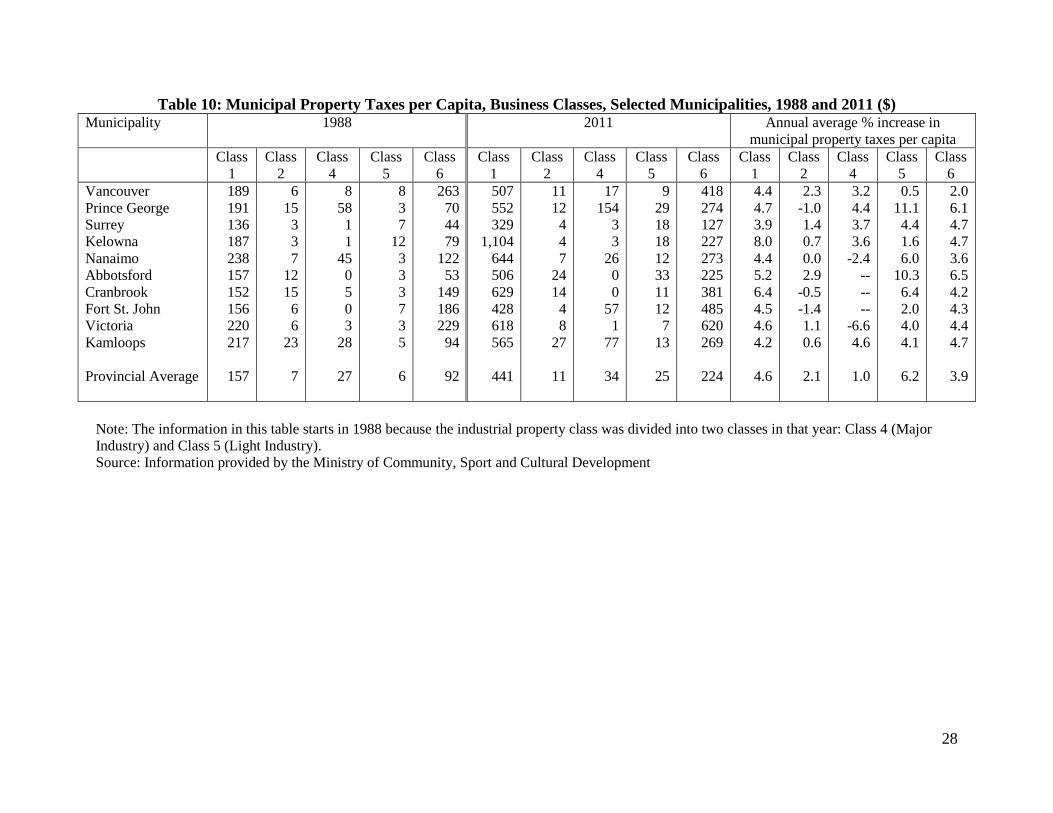
28
Table 10: Municipal Property Taxes per Capita, Business Classes, Selected Municipalities, 1988 and 2011 ($) Municipality 1988 2011 Annual average % increase in
municipal property taxes per capita
Class
1
Class
2
Class
4
Class
5
Class
6
Class
1
Class
2
Class
4
Class
5
Class
6
Class
1
Class
2
Class
4
Class
5
Class
6
Vancouver
Prince George
Surrey
Kelowna
Nanaimo
Abbotsford
Cranbrook
Fort St. John
Victoria
Kamloops
Provincial Average
189
191
136
187
238
157
152
156
220
217
157
6
15
3
3
7
12
15
6
6
23
7
8
58
1
1
45
0
5
0
3
28
27
8
3
7
12
3
3
3
7
3
5
6
263
70
44
79
122
53
149
186
229
94
92
507
552
329
1,104
644
506
629
428
618
565
441
11
12
4
4
7
24
14
4
8
27
11
17
154
3
3
26
0
0
57
1
77
34
9
29
18
18
12
33
11
12
7
13
25
418
274
127
227
273
225
381
485
620
269
224
4.4
4.7
3.9
8.0
4.4
5.2
6.4
4.5
4.6
4.2
4.6
2.3
-1.0
1.4
0.7
0.0
2.9
-0.5
-1.4
1.1
0.6
2.1
3.2
4.4
3.7
3.6
-2.4
--
--
--
-6.6
4.6
1.0
0.5
11.1
4.4
1.6
6.0
10.3
6.4
2.0
4.0
4.1
6.2
2.0
6.1
4.7
4.7
3.6
6.5
4.2
4.3
4.4
4.7
3.9
Note: The information in this table starts in 1988 because the industrial property class was divided into two classes in that year: Class 4 (Major
Industry) and Class 5 (Light Industry).
Source: Information provided by the Ministry of Community, Sport and Cultural Development

29
findings. It appears that some municipalities have reduced the tax burden on business properties
while others have increased it.
4. Comparison of the Institutional Framework for Property Taxes across Canada
How do property taxes in BC compare with other parts of Canada? Table 11 records the different
property assessment categories and municipal tax rate structure in each province and territory.
Some of the more salient features of this inter-provincial comparison include the following.
All provinces and territories have established at least two assessment categories –
residential and non-residential. Many, however, have a number of assessment categories
with Alberta, Saskatchewan, Ontario, and British Columbia leading the way.
In most provinces, there is a provincial property tax. In a few provinces, there is only a
municipal property tax.
In some provinces, municipalities are free to set their own property tax rates without
provincial involvement while in other provinces, the province is involved in the local tax
structure through direct controls or limitations on what can be done. For example, in New
Brunswick, each municipality sets its own local property tax rate but it is a provincial
requirement that the non-residential municipal tax rate must be equal to 1.5 times the residential
municipal tax rate. In Ontario, municipalities are permitted to set different tax rates (related to the
residential rate) for different property categories although provincially set ranges of fairness limit
a municipality’s flexibility in setting differential rates. In Manitoba, except for Winnipeg where
differential tax rates may be used, municipalities are not allowed to apply differential tax rates to
different property types.
Where variable or differential property tax rates are used, the residential rate (except for
farm land and resource properties) is always lower than the rate on multi-residential and
commercial/industrial properties.

30
Table 11: Assessment Categories and Municipal Tax Rate Structure
Province
Assessment Categories
Municipal Tax Rates
Newfoundland
and Labrador
Three categories:
- Residential, - commercial, - part residential and part commercial.
Tax rates are set locally. The province places no restrictions on tax rates.
Uniform rates apply everywhere except for St. John’s where there may be 2
rates – one for residential and one for commercial.
Prince Edward
Island
Two categories:
- Commercial (excludes farm property and
buildings, nurseries and market gardens,
and timberland). and - non-commercial (residential, institutional,
etc.).
Two property taxes are used:
The province levies a provincial property tax at a fixed rate - $1.50 per $100 of
assessed value on both commercial and non-commercial property. Provincial tax
rates are lower for residents than for non-residents – the difference is $0.50 per
$100 of assessed residential value.
Each municipality sets two municipal property taxes - one for commercial
assessment and another for non-commercial assessment. In some municipalities,
the commercial rate is higher than the non-commercial rate and in others it is the
same. There are no provincial restrictions on these rates.
Nova Scotia
Three categories:
- Residential,
- Commercial (everything that is not
residential or resource), - resource which includes farm properties,
forest properties if less than 50,000 acres,
community buildings used for
commercial fishing boats, and the land of
municipal water utilities.
No provincial property tax for municipal services.
Two municipal tax rates are set locally – one for residential and one for
commercial with the commercial rate exceeding the residential rate in every
municipality
The residential rate applies to resource property.
The municipal property tax in Halifax is further separated into three basic rates -
urban, suburban and rural. As well, Halifax has a number of different area rates
to reflect differentials in services provided.
New Brunswick
Two categories: - Residential
- non-residential which is commercial and
industrial.
There are two property taxes.
A provincial tax of $1.50 and $2.25 per $100 of assessed value is levied on
residential and non-residential property, respectively.
Each municipality sets its own local property tax rate but the non-residential

31
municipal tax rate must be equal to 1.5 times the residential municipal tax rate –
this is a provincial requirement.
Owner-occupied residential properties within cities, towns and villages receive a
full credit on the provincial tax rate.
Owner-occupied residential properties outside of these municipalities receive a
credit of $0.85 per $100 of assessed value.
Quebec
Properties are not differentiated except for
farms, natural gas, electricity, and
telecommunications systems.
The general property tax rate is set by local councils without provincial
restrictions. They have the opportunity to levy up to 6 tax rates depending on the
property category: residential, multi-residential (six or more units), commercial,
industrial, vacant land, and residual.
Ontario
There are seven main property classes:
- residential/farm, - multi-residential, - commercial, - industrial, - pipe lines, - farmlands,
- managed forests. In addition, the province permits
municipalities to adopt additional classes
including new multi-residential, office
buildings, shopping centers, parking lots,
large industrial properties, sports facilities
and resort condominiums.
Municipalities are permitted to set different tax rates (related to the residential
rate) for the different property categories although provincially set ranges of
fairness limit a municipality’s flexibility in setting differential rates. Where there
are two-tier governments (a region or county and lower tiers), the upper tier is
required to set the relative tax burden between the property classes. By
legislation, farm buildings and agricultural land must be taxed at 25 percent of
the residential rate as must managed forests. Farm house and one acre of land
are taxed at the residential rate. Municipalities may also choose to apply
differential rates to any of the following optional classes; new multi-residential,
shopping centres, office towers, parking lots and vacant land, and large
industrial.
Manitoba
There are ten property classes:
- residential 1 (1-4 units) - residential 2 (5 or more units)
- residential 3 (owner occupied
condominium and co-operative housing) - farm
Mill (tax) rates are set by municipal councils. With the exception on Winnipeg
where differential tax rates may be used, municipalities are not allowed to apply
differential tax rates to different property types.

32
- institutional - pipeline - railway
- designated recreational property - other
Saskatchewan
Assessment categories include:
- residential, - commercial/industrial, - agricultural, - pipelines, - resource production equipment,
- heavy industrial, - railway roadway. Cities may also set additional subclasses for
residential and commercial/industrial.
Tax rates are determined locally and municipalities may apply different tax rates
to different property categories and subcategories. Municipalities are also
permitted to impose a minimum tax or a base tax (base plus mill rate levy) to all
property classes.
Alberta There are a number of assessment categories:
- residential, - non-residential (commercial and
industrial), - farm land,
- machinery and equipment. Municipal councils may also divide the
residential class into subclasses on any basis
it chooses and it may divide the non-
residential class into vacant and improved
sub-classes.
Municipal councils have the power to levy differential tax rates on different
property categories. Municipalities may also impose a business tax, business
revitalization zone tax, special tax, well-drilling equipment tax, or local
improvement taxes.
British
Columbia
There are nine classes of assessable property:
- residential - utilities - supportive housing
Municipal property tax (mill) rates are set by local councils and variable tax
rates are allowed for the different classes of property.

33
- major industry - light industry - business/ other
- managed forest land. - recreational/non-profit property - farm land.
Northwest
Territories and
Nunavut
In municipal taxation areas, land is assessed
at market value and improvements
(buildings, machinery and equipment) at
replacement cost. Land, improvements,
mobile units, pipelines, railway works, and
transmission lines are assessed separately.
General property tax rates, set by the Territorial governments, are levied at
uniform mill rates in non-taxed based municipalities. Within taxed based
municipalities (incorporated), mill rates are set locally and may vary by class of
property.
Yukon
Buildings, machinery and equipment are
assessed at depreciated replacement cost.
Public utilities, railroads, and pipelines are
assessed as prescribed by regulation.
Municipal property tax rates are set by local councils. The tax rates may vary by
class of property and across regions.

34
Table 12 summarizes the role of property taxes in funding elementary and secondary schooling.
In general, the following can be noted:
Most provinces fund a portion of local schooling costs from the property tax.
Newfoundland and Labrador is an exception.
New Brunswick levies provincial property taxes which go into general revenues and are
not dedicated to education.
With the exception of Manitoba where local school boards still set the local education tax
rate, property taxes for education are controlled by the province.
The provincial property tax on each class of property is generally uniform across the
province. Differential rates may apply to different classes of property, however.
Table 13 records the frequency of assessment. Assessment practice over the past two decades has
moved towards more frequent and up-to-date reassessments in most provinces and territories.
There is variation across provinces in the taxation of machinery and equipment. Machinery and
equipment affixed to property is included in the assessment base in Newfoundland, Quebec,
Manitoba, Alberta, Northwest Territories and Nunavut, and the Yukon. In Prince Edward Island,
New Brunswick, and Saskatchewan, only when machinery, equipment and other fixtures provide
services to the buildings are they liable to property taxation. British Columbia and Nova Scotia
exclude all machinery and equipment from the property tax base. In Alberta, machinery and
equipment are excluded from the uniform province-wide property tax on education but may be
taxed by municipalities. Edmonton and Calgary, however, exempt machinery and equipment
from municipal property taxes. Ontario exempts machinery used for manufacturing, farming, ore
smelting and so on.
35
Table 12: School Property Tax Structure
Newfoundland
& Labrador Property taxes are not used to finance elementary and secondary school expenditures.
Prince Edward
Island The province funds 100 percent of education costs from general revenues, which include the
revenues generated by a province-wide property tax. This revenue is not earmarked
specifically for education, however. The School Act allows regional administrative units to
levy and collect a local tax for supplementary education programs (upon approval by the
Ministry and a plebiscite), but this power has not yet been used.
Nova Scotia Public schools are financed from the general revenues of the province and municipalities.
The provincial share of school financing comes from the province's general revenues. The
municipal portion comes from a uniform property tax rate set by the province plus the
Halifax Regional Municipality has discretion to levy an additional property tax.
New
Brunswick All public education costs are funded from general provincial revenues. Included in these
revenues is a provincial property tax on all properties. The property tax is not earmarked
specifically for schools, however. Legislative provision for using local property taxes to raise
revenue for supplementary programs is permitted but seldom used.
Quebec The province funds about eighty-five percent of all public school costs from general
revenues and school boards fund the remaining 15 percent from a local property tax levy.
There is no provincial property tax. Local school boards must levy a property tax but it
cannot exceed $0.35 per $100 of standardized assessment unless referendum approval is
obtained from the taxpayers within the school district. No such referendum has ever been
held. Local property taxes are used to finance the maintenance of school facilities.
The province sets the property tax revenue to be collected by each board (or grouping of
school boards on the island of Montreal) as follows: it sets the dollar amount per school
board (set annually by Ministry of Education) plus per student dollar amount times the
number of students.
Ontario Education is 100% provincially funded. Part of this funding comes from a property tax. The
province sets the property tax rate (residential) or amount to be raised (commercial and
industrial) for education. The tax rate on residential/farm and multi-residential properties is
uniform across the province. The province sets the amount that is to be raised by the tax on
commercial and industrial properties. All education tax revenues are collected by the
municipality and remitted to school boards. In 2007, the province agreed to lower the
property tax rate for education on business properties by 14 percent over the following seven
years. In 2008, further reductions in the business education tax were announced for the
sparsely populated northern part of the province (this mainly affects forest based industrial
properties).
Manitoba Provincial funding comes from the general revenues of the province and from locally
generated school board revenues (almost entirely from property taxes on both non-residential
and residential property). Local school boards have the power to set local property tax rates
and this power is used extensively.
Saskatchewan The province sets a uniform property tax rate for each of three major property classes.
Alberta The province is responsible for funding education. About half of its funding requirement is
supported from general provincial revenues and the remainder from a uniform province-wide
mill rate on residential property and a higher uniform rate on commercial/industrial property.
Municipalities collect the tax and remit it to the province. School boards may also seek

36
elector approval to levy an additional property tax to a maximum of 3 percent of their
budget. Since the province assumed responsibility for education property taxes in 1994, the
province has reduced its reliance on property taxes for financing education. For 2012, the
education property tax rate was frozen at the 2011 rate.
British
Columbia Schools are funded entirely by provincial grants generated from provincial government
revenue that includes provincially imposed non-residential and residential property taxes.
Everyone within a school district pays the same residential tax rate, but the province varies
the rate between districts in order to moderate the effects of differences in assessed values
across the provinces. If school boards wish to spend more than their provincial grant, the
board must seek local taxpayer approval through a referendum for additional expenditures to
be financed through local property taxes. This has never been used, however.
Northwest
Territories Education funding comes from a territorial school levy (property tax) and from local
property taxes.
Nunavut Same as NWT
Yukon Education is funded by the territorial government and it does not levy a property tax for
education.
Table 13: Frequency of Assessment
Newfoundland & Labrador Three year cycle with the lag in assessed values being twenty-two months.
Prince Edward Island In 2009, the provincial government froze all residential assessment at 2007
values until time of sale. Beginning in 2010, the property assessment freeze
was replaced by annual increases based on the change in the CPI to a
maximum annual increase of 5 percent. Commercial and industrial property
is assessed annually.
Nova Scotia Annually with each year’s assessed value based on the property’s value two
years prior.
New Brunswick Annually as of Jan. 1 each year.
Quebec Three year cycle with the assessed value being finalized by April 30 (for
appeals) of the first year of the cycle.
Ontario Four year cycle.
Manitoba Four year cycle
Saskatchewan Four year cycle
Alberta Annual
British Columbia Annual
Yukon Five year cycle
Northwest Territories and
Nunavut
Must be assessed at least once every nine years.

37
Inter-provincially, there is considerable variation in the extent to which business occupancy taxes
(a local tax which is frequently, but not always, based on the assessed value of commercial and
industrial property with statutory liability for payment almost always falling on the occupant) are
used and in the way in which they are imposed. Over the past two decades, the trend has been to
move away from business occupancy taxation to higher property tax rates on commercial and
industrial properties. The business occupancy tax, as a separate tax, does not exist in Prince
Edward Island, New Brunswick, Ontario, the Northwest Territories, Nunavut, the Yukon, and
will be eliminated in Nova Scotia by 2013. The business tax is optional in Alberta,
Saskatchewan, and Manitoba. It tends not to be used in British Columbia; instead, municipalities
impose higher tax rates on non-residential property. Provinces without a business occupancy tax
generally impose higher real property tax rates or licence fees on non-residential property in lieu
of a business tax. For example, Prince Edward Island levies a tax on business properties
(commercial and industrial) that is twice the rate on non-commercial property (residential). In
New Brunswick, the tax on non-residential property is 1.5 times the residential rate. In Ontario,
effective property tax rates are higher on non-residential property.
5. Municipal Property Tax Approaches to Achieve Economic Development Objectives
A few provinces have passed legislation that permits municipalities to reduce property taxes on
business properties as a way to stimulate economic development. In BC, as noted earlier, the
Community Charter and the Vancouver Charter provide municipalities with the authority to
exempt property from municipal property taxes. In order to provide the exemption, the municipal
council is required to establish a revitalization program with reasons and objectives of the
program. Exemptions may apply to the value of the land or improvements, or both. Councils are
free to specify the amounts and extent of tax exemptions available.
In Alberta, the Community Revitalization levy (CRL) came into effect through an amendment to
the Municipal Government Act in 2005. The CRL is similar to the tax increment financing (TIF)

38
programs used in the US.8 A TIF is an economic development tool used to encourage the
redevelopment of areas in need of revitalization and brownfield remediation. Cities designate a
TIF area for capital improvements and then earmark any future growth in property taxes to pay
for investments in infrastructure and other economic development initiatives.
Under the CRL program in Alberta, municipalities can dedicate future property tax revenues in a
specific area to pay for a new public facility or new infrastructure in that area. These projects are
designed to encourage new development and revitalize a specific part of the city and encourage
private sector investment. It works as follows: cities invest in public infrastructure in a particular
area and the improvement spurs new development. The property tax revenue from the
development plus any revenue from the increment in property values is dedicated to paying the
cost of the infrastructure (including financing costs) over the next 20 years. After 20 years, the
revenues go back into the city’s general tax levy. The provincial government also contributes the
education portion of the new tax revenue. There is no grant portion to the CRL; it merely diverts
the revenues from the increment in property values arising from the investment to pay for the
investment.
In Saskatchewan, Regina follows a competitive property tax exemption policy targeted at
attracting new business to the region. The policy is designed to encourage plans that bring in new
investment, belong to one of the key sectors in Regina’s economic development, locate
businesses in designated locations, be a global or national leader in new technology, have a
significant R&D focus, and/or use sustainable technologies/practices in construction or
operations. The policy involves full and partial property tax exemptions for up to several years
and are considered on a project-by-project basis.
In Ontario, under section 28 of the Planning Act, municipalities can designate an area or the
entire municipality as a community improvement project area. They can then implement a
community-improvement plan (CIP) with grants and/or loans which can, if the municipality
8 TIFs were first introduced in California in 1952 and, since that time, they have spread to almost all US states. TIFs
are a much newer instrument in Canada and not nearly as widespread as in the US. TIF legislation was passed in
Manitoba in 2008 but TIFs are not yet being used in that province. TIF legislation was passed by the provincial
government in Ontario in 2006 but the regulations have yet to be promulgated.
39
chooses, be calculated on a tax increment basis. In other words, the municipality can offer
developers a grant or loan that is based on the higher property tax that is generated from
development (the tax increment). Such incentives are known as tax increment equivalent grants
(TIEGs) and are used in a number of communities across Ontario. TIEGs are different than TIFs
because they include a subsidy component. TIEGs only apply to the municipal property tax and
not the education property tax.
Montreal introduced a program to enable property owners who invest in their industrial facilities
to be reimbursed for their property tax increase. The rationale for this incentive is to strengthen
the business environment in the face of competition from other major urban centres in North
America. The program, which was announced in October 2007, is designed to encourage the
owners of industrial buildings in the metropolitan area to accelerate investment in buildings,
improve the competitiveness of Montreal, maintain a diversified economic structure in Montreal,
and increase the value of the stock of industrial buildings.
The program offers owners of non-residential buildings the possibility of a grant to reimburse
them for any increase in their property taxes as a result of improving their property (through
construction, conversion, or increasing the size of the building) for five years. Eligible property
owners have three years to do the upgrades. The grant covers 100 percent of the property tax
increase in the first three years, 80 percent of the tax increase in the fourth year, and 60 percent
of the tax increase in the fifth year. Eligible activities include: manufacturing in general, film and
video production, data processing systems, software, call centres, head offices, and research and
development in the physical sciences, engineering, and life sciences. Properties in some locations
(e.g. industrial zones that are on the verge of transformation, properties near transit stations, etc.)
can receive an additional bonus. In those cases, the grant will cover 100 percent of the property
tax increase for five years.
6. Inter-provincial Comparison of Property Taxes
Table 14 records property taxes plus payments in lieu of taxes per capita by class of property for
municipal and education purposes in six representative provinces. Across these provinces,

40
property taxes per capita9 were highest in Ontario at $1,785 per capita, followed by Alberta at
$1,738, Quebec at $1,566, British Columbia at $1,342, Manitoba at $1,156, and Nova Scotia at
$1,140.
The municipal portion of the property tax plus payments in lieu per capita in BC ($830) was
lower than in Quebec ($1,566), Ontario ($1,251), Alberta ($1,325), and Nova Scotia ($919) but it
was higher than in Manitoba ($787). Education property taxes per capita were highest in Ontario
($534), followed by roughly comparable levels in British Columbia ($512) and Alberta ($502),
but considerably higher than in Manitoba ($369) and Nova Scotia ($221). The per capita
education property tax in Quebec is less than $1.
A comparison of property taxes by property type reveals some variation across provinces. For
municipal purposes, residential properties contribute the majority of property taxes in every
province except for Alberta where the property taxes on non-residential and linear properties
contribute the majority. Property taxes for education show a similar pattern where property taxes
are used to fund elementary and secondary schooling – the majority of taxes are levied on the
residential sector in every province except for Ontario where the commercial and industrial
sectors pay more.
When municipal and education taxes per capita are combined, the residential sector contributes
over 50 percent in every province except for Alberta where all other properties account for more
than 50 percent of the total.
9 Property taxes include property taxes levied plus payments in lieu of taxes.

41
Table 14: Inter-provincial Comparison of Property Taxes plus Payments In Lieu of Taxes1
Panel A: British Columbia
Source of Property Taxes & PILs
Municipal Only Education Only Municipal plus Education
Per Capita % of total Per Capita % of total Per Capita % of total
Residential
Utilities
Major Industry
Light Industry
Business
Other
Total property taxes
Payments in Lieu of Taxes (PILs)
Total Property Tax and PILs
$
473
12
38
27
247
4
801
29
830
%
57.0
1.5
4.6
3.2
29.8
0.4
96.5
3.5
100.0
$
297
24
7
17
165
2
512
---
512
%
58.1
4.7
1.4
3.2
32.2
0.4
100.0
---
100.0
$
770
36
45
43
412
5
1,312
29
1,342
%
57.4
2.7
3.4
3.2
30.7
0.4
97.8
2.2
100.0
Panel B: Ontario
Source of Property Taxes & PILs2
Municipal Only Education Only Municipal plus Education
Per Capita % of total Per Capita % of total Per Capita % of total
Residential & Farm
Commercial
Industrial
Pipelines
Other
TOTAL
$
883
279
61
6
22
1,251
%
70.6
22.3
4.9
0.5
1.7
100.0
$
225
239
52
6
13
534
%
42.0
44.7
9.8
1.1
2.4
100.0
$
1,108
519
113
12
34
1,785
%
62.0
29.1
6.3
0.7
1.9
100.0

42
Panel C: Alberta
Source of Property Taxes & PILs2
Municipal Only Education Only Municipal plus Education
Per Capita % of total Per Capita % of total Per Capita % of total
Residential & Farm Properties
Non-residential Properties
Linear Property
Railway
Other
Total
$
511
495
229
1
88
1,325
%
38.6
37.3
17.3
0.1
6.6
100.0
$
319
183
0
0
0
502
%
63.5
36.5
0.0
0.0
0.0
100.0
$
830
678
229
1
88
1,738
%
45.4
37.1
12.6
0.1
4.8
100.0
Panel D: Quebec
Source of Property Taxes & PILs
Municipal Only Education Only Municipal plus Education
Per Capita % of total Per Capita % of total Per Capita % of total
General Property Taxes
Business Taxes
Total Property Taxes
Payments in Lieu (PILS)
Property Taxes plus PILs
$
1,094
371
1,465
101
1,566
%
69.9
23.7
93.6
6.4
100.0
$
0
0
0
0
<1
%
0
0
0
0
0
$
1,094
371
1,465
101
1,566
%
69.9
23.7
93.6
6.4
100.0
Panel E: Nova Scotia
Source of Property Taxes & PILs
Municipal Only Education Only Municipal plus Education
Per Capita % of total Per Capita % of total Per Capita % of total
Assessable Properties
Special Assessments
Business Property
Other Property Related Taxes
Total Property Taxes
Payments in Lieu (PILS)
Property Taxes plus PILs
$
n.a.
n.a.
n.a.
n.a.
862
51
919
%
n.a.
n.a.
n.a.
n.a.
94.5
5.5
100.0
$
n.a.
n.a.
n.a.
n.a.
221
n.a.
221
%
n.a.
n.a.
n.a.
n.a.
100.0
n.a.
100.0
$
947
13
71
52
1,083
51
1,140
%
83.6
1.2
6.2
4.6
95.5
4.5
100.0

43
Panel F: Manitoba
Source of Property Taxes & PILs
Municipal Only Education Only Municipal plus Education
Per Capita % of total Per Capita % of total Per Capita % of total
General Municipal Property Taxes
Business Taxes
Other Property Tax Levies
Total Property Taxes
Payments in Lieu (PILS)
Property Taxes plus PILs
$
525
54
169
749
38
787
%
66.8
6.8
21.5
95.2
4.8
100.0
$
369
n.a.
n.a.
369
n.a.
369
%
100.0
n.a.
n.a.
100.0
n.a.
100.0
$
894
54
169
1,118
38
1,156
%
77.3
4.7
14.6
96.7
3.3
100.0 1 Sources of property taxes and PILs reflect the way in which the data are presented for each province.
2 Payments in lieu are included in the property tax categories. n.a. – breakdown was not available.
Source: Compiled from provincial summaries of municipal statistics in each province

44
7. Inter-city Comparison of Property Taxes
Table 14 was an aggregation of all municipalities in each of the provinces. For this reason, it had
the potential to hide variations in property taxes by source across municipalities of different size
and importance. Tables 15 (only for BC) and Table 16 (for the rest of Canada) record property
taxes and PILS for the major cities.
For BC cities (Table 15), the range of municipal taxes and PILS was quite large extending from
highs of $1,263 per capita in Victoria and $1,024 in Prince George to lows of $483 in Surrey and
$788 in Abbotsford. Such a wide variation from city to city is similar to the variation noted in
earlier parts of this report.
For competitive purposes, the municipal tax on the business class of property is likely to be of
greatest interest. In BC, the per capita average for the ten cities was $321; however, there was
considerable variation across cities. For example, the tax ranged from a high of $605 per capita
in Victoria to a low of $123 per capita in Surrey. Five of cities recorded per capita business taxes
in the $200 range.
As with municipal taxes, education property taxes showed variation across BC cities with
levels extending from highs of $639 per capita in Vancouver and $617 per capita in Victoria to
lows of $267 in Prince George and $392 and $394 in Abbotsford and Surrey, respectively. The
business class contribution to education taxes also shows wide variation across the cities. Per
capita levels ranged from highs of $313 and $288 in Victoria and Vancouver respectively to lows
of $110 in Prince George, $113 in Surrey, and $117 in Abbotsford and Kamloops.
The sum of all municipal and education property taxes varied considerably, ranging from
highs of $1,879 and $1,592 per capita in Vancouver and Victoria, respectively to lows of $877
and $1,180 per capita in Surrey and Abbotsford.

45
Table 15: Per Capita Property Taxes Plus Payments In Lieu of Taxes in Ten BC Cities
Source of Property Taxes & PILs
Vancouver Prince George
Municipal
Education
Municipal &
Education
Municipal
Education
Municipal &
Education
Residential (class 1)
Utilities (class 2)
Major Industry (class 4)
Light Industry (class 5)
Business/other (class 6)
Other (classes 7 & 8)
Total property taxes
Payments in Lieu of Taxes (PILs)
Total Property Tax and PILs
$
460
11
9
8
413
1
902
51
953
$
332
13
1
3
288
2
639
---
639
$
792
24
10
11
701
2
1,540
51
1,592
$
533
15
155
27
254
1
984
39
1,024
$
228
23
11
3
110
0
376
---
376
$
761
38
166
30
363
1
1,360
39
1,399
Source of Property Taxes & PILs
Surrey Kelowna
Municipal
Education
Municipal &
Education
Municipal
Education
Municipal &
Education
Residential (class 1)
Utilities (class 2)
Major Industry (class 4)
Light Industry (class 5)
Business/other (class 6)
Other (classes 7 & 8)
Total property taxes
Payments in Lieu of Taxes (PILs)
Total Property Tax and PILs
$
320
4
3
18
123
1
468
16
483
$
251
19
1
9
113
1
394
---
394
$
571
22
3
27
236
2
862
16
877
$
565
4
3
16
221
2
811
4
815
$
323
16
1
6
182
3
531
---
531
$
889
20
4
22
403
5
1,343
4
1,346

46
Source of Property Taxes & PILs
Nanaimo Abbotsford
Municipal
Education
Municipal &
Education
Municipal
Education
Municipal &
Education
Residential (class 1)
Utilities (class 2)
Major Industry (class 4)
Light Industry (class 5)
Business/other (class 6)
Other (classes 7 & 8)
Total property taxes
Payments in Lieu of Taxes (PILs)
Total Property Tax and PILs
$
617
7
32
11
268
2
937
14
951
$
276
17
4
2
131
1
431
---
431
$
893
23
36
14
399
3
1,368
14
1,382
$
488
20
0
31
216
19
774
14
788
$
236
27
0
9
117
4
392
---
392
$
724
47
0
40
333
23
1,166
14
1,180
Source of Property Taxes & PILs
Cranbrook Fort St. John
Municipal
Education
Municipal &
Education
Municipal
Education
Municipal &
Education
Residential (class 1)
Utilities (class 2)
Major Industry (class 4)
Light Industry (class 5)
Business/other (class 6)
Other (classes 7 & 8)
Total property taxes
Payments in Lieu of Taxes (PILs)
Total Property Tax and PILs
$
589
14
0
11
370
6
991
12
1,003
$
252
20
0
2
138
2
414
---
414
$
841
34
0
13
508
8
1,404
12
1,417
$
405
4
58
12
483
1
963
20
983
$
221
12
8
1
229
0
471
---
471
$
625
16
66
14
712
1
1,434
20
1,454

47
Source of Property Taxes & PILs
Victoria Kamloops
Municipal
Education
Municipal &
Education
Municipal
Education
Municipal &
Education
Residential (class 1)
Utilities (class 2)
Major Industry (class 4)
Light Industry (class 5)
Business/other (class 6)
Other (classes 7 & 8)
Total property taxes
Payments in Lieu of Taxes (PILs)
Total Property Tax and PILs
$
575
8
1
6
605
2
1,197
66
1,263
$
283
17
0
2
313
1
617
---
617
$
858
25
1
8
919
3
1,813
66
1,879
$
539
27
75
13
259
3
916
26
942
$
272
26
4
2
117
1
422
---
422
$
811
53
79
15
376
4
1,338
26
1,364
n.a. not available.
Source: Compiled from information provincial by the Ministry of Community, Sport and Cultural Development.

48
A review of property taxes by source in BC indicates that the residential (Class 1) and business
class (Class 6) were by far the most important revenue generators in each of the cities. The other
categories were important at the margin, but only in Prince George did the industrial property tax
exceed $100 per capita.
Inter-provincial comparisons of municipal property taxes must be treated with caution because
property taxes may fund different services in different provinces. One would thus expect
property taxes per capita to be higher in provinces where municipalities are responsible for
funding a wider range of local services, for example. In spite of this cautionary note, there is
merit in noting differences in the level of property taxes and the role that these may have on
competitiveness. Table 16 shows property taxes and PILs for municipal and education purposes10
in eight Canadian cities outside BC – Toronto, Ottawa, Calgary, Edmonton, Montreal, Quebec
City, Halifax, and Winnipeg (data are not available for property taxes for education).
With respect to municipal property taxes per capita, Vancouver’s per capita tax at $953 is
lower than seven of the other Canadian cities and only above that in Winnipeg. In particular,
Vancouver’s municipal property tax per capita is:
below Toronto’s comparable tax by about $390 per capita;
below Ottawa and Calgary’s comparable tax by more than $500 per capita;
below Edmonton comparable tax by almost $570 per capita;
below Montreal’s comparable tax by more than $825 per capita;
below Quebec City’s comparable tax by about $515 per capita;
below Halifax’s comparable tax by almost $260 per capita; and
above Winnipeg’s comparable tax by $100 per capita
Property taxes in nine other BC municipalities can also be compared to the selected cities across
Canada by comparing the information in Table 15 with the information in Table 16. Victoria,
which has the highest per capita municipal tax ($1,263) in BC, for example, is just above Halifax
($1,210) and well below the other six cities (they range from $1,342 to $1,784). Surrey, on the
10
Property taxes in Quebec fund very small proportions of elementary and secondary schooling costs.

49
other hand has the lowest per capita municipal tax in BC at $483. This amount is considerably
lower than all other cities in this comparison.
A breakdown of the municipal taxes into residential and business taxes11
suggests that the
average per capita property tax on the non-residential sector in Vancouver is lower than four
cities but higher than Winnipeg. The non-residential property tax per capita in Vancouver is:
below Toronto’s by about $100 per capita;
below Ottawa’s by about $25 per capita;
below Calgary’s by about $190 per capita; and
below Edmonton’s by about $200 per capita; and
considerably higher than Winnipeg’s comparable tax.
With respect to education property taxes in some of the cities12
in this study, Table 16 shows
that the average per capita tax in Vancouver ($639) for funding education is:
below Toronto’s by about $80 per capita;
above Ottawa’s by about $35 per capita;
above Calgary’s by about $75 per capita;
above Edmonton’s by about $210 per capita; and
above Halifax’s by about $335 per capita.
Of this total, the contribution from the business class in Vancouver was about $290 per capita.
This was below the contribution from similar properties in Toronto (about $450) and Ottawa
(about $465), but higher than Calgary (about $180) and Edmonton (about $130).13
Combining property taxes for both municipal and education purposes suggests that the per
capita average property tax for Vancouver is considerably lower than similar taxes for Toronto,
Ottawa, Calgary, Edmonton, Montreal, and slightly above Quebec City and Halifax.14
Finally,
11
Data availability did not permit a comparable comparison for Halifax, Quebec City, and Montreal. 12
Data availability did not permit a comparable comparison for Winnipeg and property taxes for education are very
low in Quebec. 13
Comparable data were not available for Halifax and Winnipeg. 14
Comparable data were not available for Winnipeg.

50
Table 16: Property Taxes plus Payments In Lieu of Taxes Per Capita in Other Representative Canadian Cities1
Panel A: Ontario
Source of Property Taxes & PILs2
Toronto Ottawa
Municipal
Education
Municipal &
Education
Municipal
Education
Municipal &
Education
Residential & Farm
Commercial
Industrial
Pipelines
Other
TOTAL
$
771
478
48
1
43
1,342
$
256
408
41
2
12
719
$
1,027
886
90
3
55
2,061
$
936
423
35
3
69
1,465
$
217
334
27
4
22
604
$
1,153
757
61
7
90
2,069
Panel B: Alberta
Source of Property Taxes & PILs2
Calgary Edmonton
Municipal
Education
Municipal &
Education
Municipal
Education
Municipal &
Education
Residential & Farm Properties
Non-residential Properties
Linear Property
Railway
Other
Total
$
830
620
14
0
0
1,465
$
384
178
0
0
0
562
$
1,214
798
14
0
0
2,027
$
855
634
30
0
0
1,520
$
298
131
0
0
0
429
$
1,154
765
30
0
0
1,948
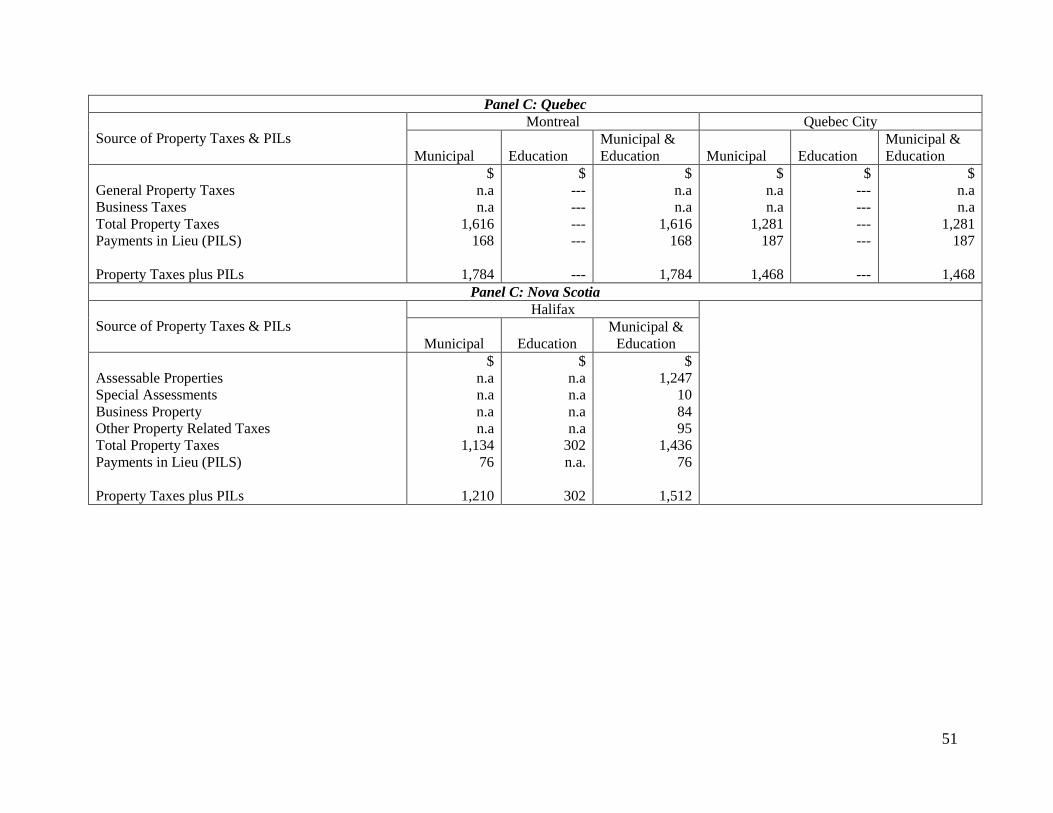
51
Panel C: Quebec
Source of Property Taxes & PILs
Montreal Quebec City
Municipal
Education
Municipal &
Education
Municipal
Education
Municipal &
Education
General Property Taxes
Business Taxes
Total Property Taxes
Payments in Lieu (PILS)
Property Taxes plus PILs
$
n.a
n.a
1,616
168
1,784
$
---
---
---
---
---
$
n.a
n.a
1,616
168
1,784
$
n.a
n.a
1,281
187
1,468
$
---
---
---
---
---
$
n.a
n.a
1,281
187
1,468
Panel C: Nova Scotia
Source of Property Taxes & PILs
Halifax
Municipal
Education
Municipal &
Education
Assessable Properties
Special Assessments
Business Property
Other Property Related Taxes
Total Property Taxes
Payments in Lieu (PILS)
Property Taxes plus PILs
$
n.a
n.a
n.a
n.a
1,134
76
1,210
$
n.a
n.a
n.a
n.a
302
n.a.
302
$
1,247
10
84
95
1,436
76
1,512

52
Panel D: Manitoba
Source of Property Taxes & PILs
Winnipeg
Municipal
Education
Municipal &
Education
General Municipal Property Taxes
Business Taxes
Other Property Tax Levies
Total Property Taxes
Payments in Lieu (PILS)
Property Taxes plus PILs
$
629
89
106
824
29
853
$
n.a
n.a
n.a
n.a
n.a
n.a
$
n.a
n.a
n.a
n.a
n.a
n.a
1 Sources of property taxes and PILs reflect the way in which the data are presented for each province.
2 Payments in lieu are included in the property tax categories.
n.a. – breakdown was not available.
Source: Compiled from provincial summaries of municipal statistics in each province.

53
the average per capita municipal and education property tax on the business class in Vancouver
is lower than in Toronto, Ottawa, Calgary and Edmonton.15
Table 17 shows the ratio of education property taxes to municipal property taxes on commercial
and industrial properties for the ten cities in BC and four other Canadian cities (those for which
data were available). This ratio is lower for BC cities than Ontario cities but much higher than in
Alberta cities suggesting that the non-residential sector in BC pays proportionately more in
education property taxes compared to Alberta cities but less than Ontario cities.
Table 17: Ratio of Education Property Tax to Municipal Property Tax
on Commercial and Industrial Properties BC and 10 Cities Ratio Other Provinces &
Cities
Ratio
British Columbia Average
Surrey
Kelowna
Vancouver
Abbotsford
Victoria
Nanaimo
Fort St. John
Cranbrook
Kamloops
Prince George
Ten City Average
0.57
0.86
0.79
0.68
0.51
0.51
0.44
0.43
0.37
0.35
0.29
0.49
Ontario Average
Toronto
Ottawa
Alberta Average
Calgary
Edmonton
Nova Scotia Average
Halifax
Manitoba
Winnipeg
0.86
0.85
0.79
0.31
0.29
0.21
n.a.
n.a.
n.a.
n.a.
n.a. not available in this format.
Source: BC ratios calculated from data in Tables 6 and 7. Ratios for other
provinces calculated from data in Tables 6 and 8.
To compare business property taxes across cities in Canada, it would be useful to have
information on the property tax on comparable properties in each city. These data are very
difficult to obtain, however. Nevertheless, Tables 18, 19, and 20 provide information on business
property taxes for various Canadian cities from different sources. Table 18 looks at property tax
rates for commercial properties, Table 19 focuses on property taxes per square foot for
15
Comparable data were not available for Halifax, Winnipeg, Montreal, and Quebec City..
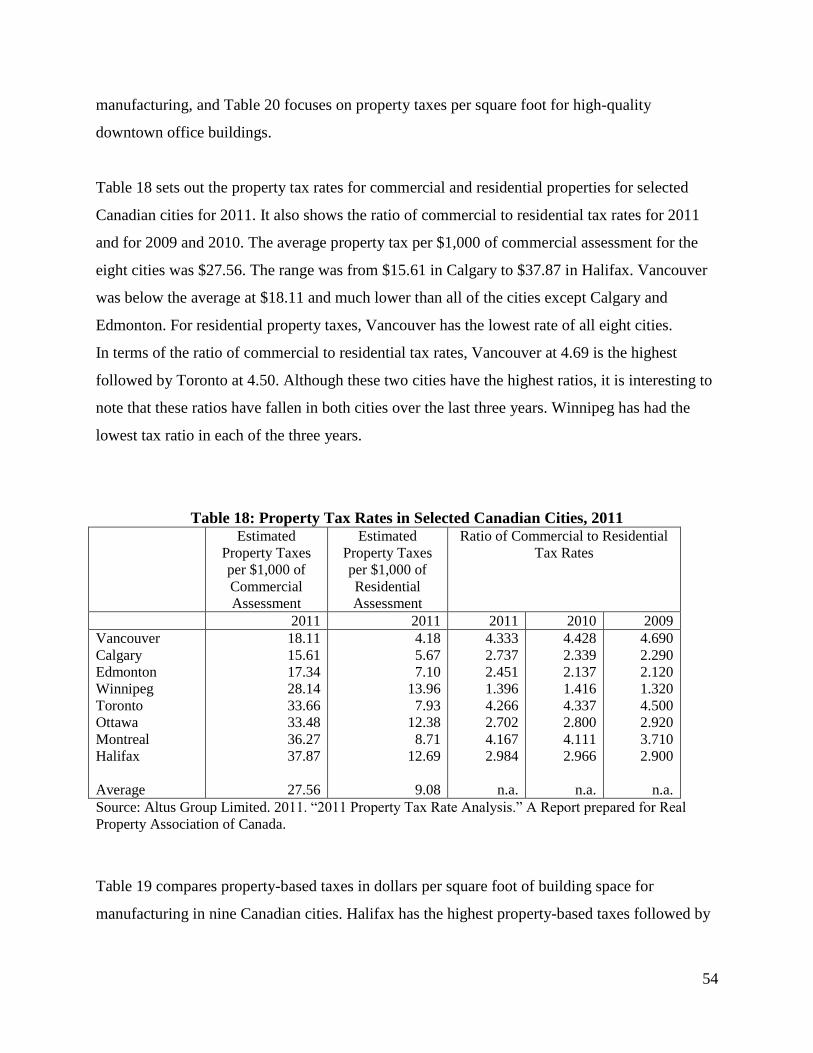
54
manufacturing, and Table 20 focuses on property taxes per square foot for high-quality
downtown office buildings.
Table 18 sets out the property tax rates for commercial and residential properties for selected
Canadian cities for 2011. It also shows the ratio of commercial to residential tax rates for 2011
and for 2009 and 2010. The average property tax per $1,000 of commercial assessment for the
eight cities was $27.56. The range was from $15.61 in Calgary to $37.87 in Halifax. Vancouver
was below the average at $18.11 and much lower than all of the cities except Calgary and
Edmonton. For residential property taxes, Vancouver has the lowest rate of all eight cities.
In terms of the ratio of commercial to residential tax rates, Vancouver at 4.69 is the highest
followed by Toronto at 4.50. Although these two cities have the highest ratios, it is interesting to
note that these ratios have fallen in both cities over the last three years. Winnipeg has had the
lowest tax ratio in each of the three years.
Table 18: Property Tax Rates in Selected Canadian Cities, 2011 Estimated
Property Taxes
per $1,000 of
Commercial
Assessment
Estimated
Property Taxes
per $1,000 of
Residential
Assessment
Ratio of Commercial to Residential
Tax Rates
2011 2011 2011 2010 2009
Vancouver
Calgary
Edmonton
Winnipeg
Toronto
Ottawa
Montreal
Halifax
Average
18.11
15.61
17.34
28.14
33.66
33.48
36.27
37.87
27.56
4.18
5.67
7.10
13.96
7.93
12.38
8.71
12.69
9.08
4.333
2.737
2.451
1.396
4.266
2.702
4.167
2.984
n.a.
4.428
2.339
2.137
1.416
4.337
2.800
4.111
2.966
n.a.
4.690
2.290
2.120
1.320
4.500
2.920
3.710
2.900
n.a.
Source: Altus Group Limited. 2011. “2011 Property Tax Rate Analysis.” A Report prepared for Real
Property Association of Canada.
Table 19 compares property-based taxes in dollars per square foot of building space for
manufacturing in nine Canadian cities. Halifax has the highest property-based taxes followed by
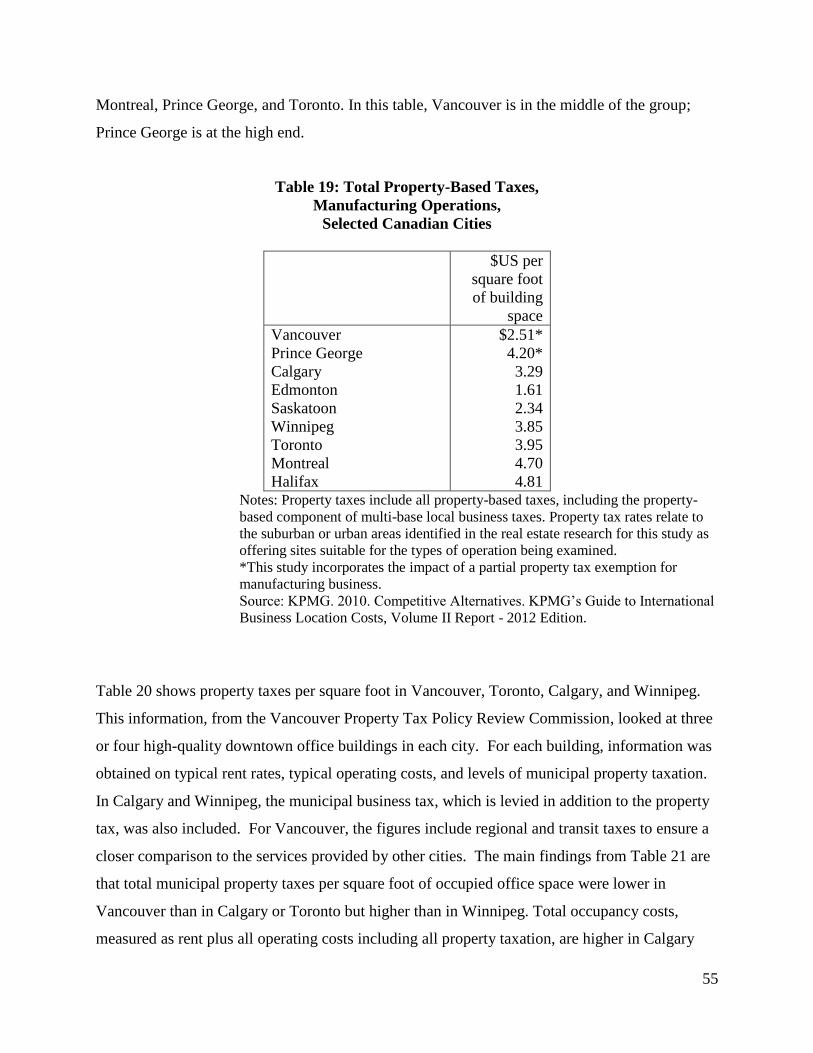
55
Montreal, Prince George, and Toronto. In this table, Vancouver is in the middle of the group;
Prince George is at the high end.
Table 19: Total Property-Based Taxes,
Manufacturing Operations,
Selected Canadian Cities
$US per
square foot
of building
space
Vancouver
Prince George
Calgary
Edmonton
Saskatoon
Winnipeg
Toronto
Montreal
Halifax
$2.51*
4.20*
3.29
1.61
2.34
3.85
3.95
4.70
4.81 Notes: Property taxes include all property-based taxes, including the property-
based component of multi-base local business taxes. Property tax rates relate to
the suburban or urban areas identified in the real estate research for this study as
offering sites suitable for the types of operation being examined.
*This study incorporates the impact of a partial property tax exemption for
manufacturing business.
Source: KPMG. 2010. Competitive Alternatives. KPMG’s Guide to International
Business Location Costs, Volume II Report - 2012 Edition.
Table 20 shows property taxes per square foot in Vancouver, Toronto, Calgary, and Winnipeg.
This information, from the Vancouver Property Tax Policy Review Commission, looked at three
or four high-quality downtown office buildings in each city. For each building, information was
obtained on typical rent rates, typical operating costs, and levels of municipal property taxation.
In Calgary and Winnipeg, the municipal business tax, which is levied in addition to the property
tax, was also included. For Vancouver, the figures include regional and transit taxes to ensure a
closer comparison to the services provided by other cities. The main findings from Table 21 are
that total municipal property taxes per square foot of occupied office space were lower in
Vancouver than in Calgary or Toronto but higher than in Winnipeg. Total occupancy costs,
measured as rent plus all operating costs including all property taxation, are higher in Calgary
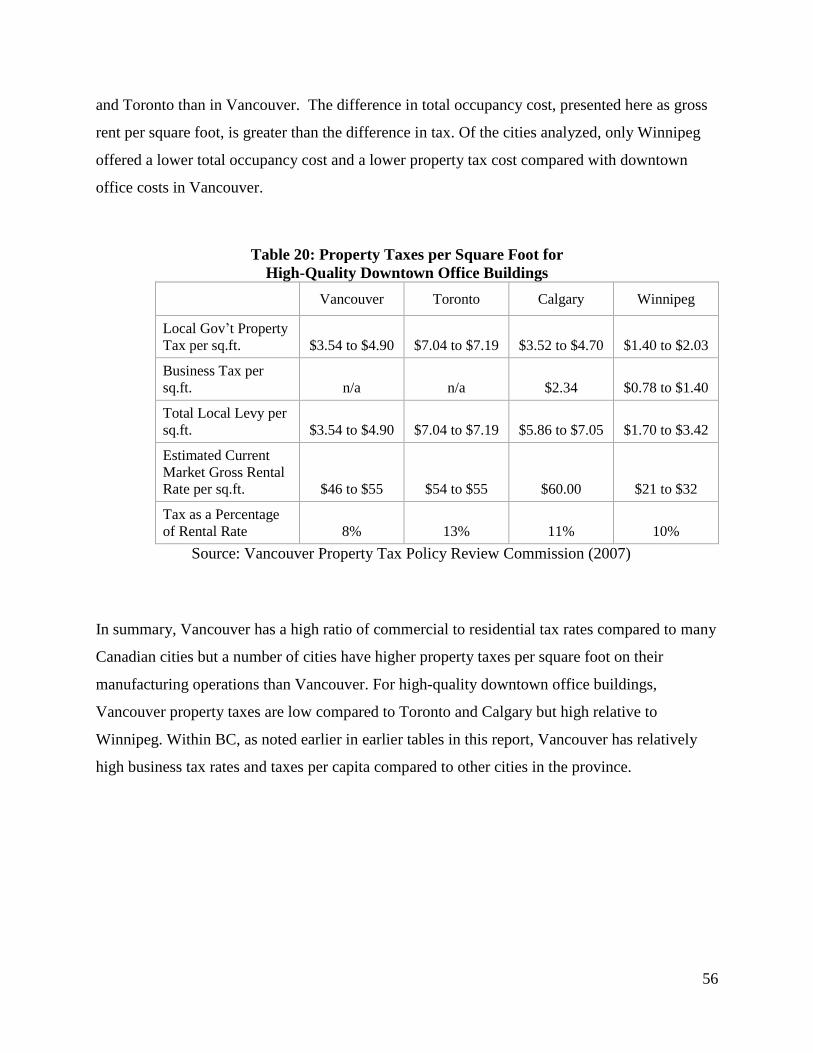
56
and Toronto than in Vancouver. The difference in total occupancy cost, presented here as gross
rent per square foot, is greater than the difference in tax. Of the cities analyzed, only Winnipeg
offered a lower total occupancy cost and a lower property tax cost compared with downtown
office costs in Vancouver.
Table 20: Property Taxes per Square Foot for
High-Quality Downtown Office Buildings
Vancouver Toronto Calgary Winnipeg
Local Gov’t Property
Tax per sq.ft. $3.54 to $4.90 $7.04 to $7.19 $3.52 to $4.70 $1.40 to $2.03
Business Tax per
sq.ft. n/a n/a $2.34 $0.78 to $1.40
Total Local Levy per
sq.ft. $3.54 to $4.90 $7.04 to $7.19 $5.86 to $7.05 $1.70 to $3.42
Estimated Current
Market Gross Rental
Rate per sq.ft. $46 to $55 $54 to $55 $60.00 $21 to $32
Tax as a Percentage
of Rental Rate 8% 13% 11% 10%
Source: Vancouver Property Tax Policy Review Commission (2007)
In summary, Vancouver has a high ratio of commercial to residential tax rates compared to many
Canadian cities but a number of cities have higher property taxes per square foot on their
manufacturing operations than Vancouver. For high-quality downtown office buildings,
Vancouver property taxes are low compared to Toronto and Calgary but high relative to
Winnipeg. Within BC, as noted earlier in earlier tables in this report, Vancouver has relatively
high business tax rates and taxes per capita compared to other cities in the province.
57
8. Impact of Property Taxation on Business Properties
The strongest economic and fiscal arguments for assigning a tax to local governments come from
the literature on fiscal federalism where there is widespread agreement on general principles that
should be followed. In short, this theory prescribes a limited tax base for local governments
(McClure, 2001). The best local taxes are those that have the following characteristics (Bird and
Slack, 2004; Bird, 2001; and Bird and Bahl, 2008, Inman, 2005): they are based on an immobile
tax base and therefore, borne primarily by local residents (not exported). They do not create
problems with harmonization or harmful competition between local governments or local
governments and other orders of government. They generate sufficient, stable and predictable
revenues. They are visible to ensure accountability and transparency. They are perceived to be
fair and they are easy to administer at the local level.
The tax on residential property meets the criteria for a solid municipal tax better than any other
tax. Its base is largely immobile. Revenue is generally predictable and stable in that it does not
vary with the cyclical swings in economic activity as much as personal income and consumption-
based taxes. The part of the tax that is on residential property is unlikely to be exported. It is
highly visible and fair as long it covers the cost of providing those services that provide
collective benefits to the local community. If the property tax is a local tax only (the federal and
provincial governments do not levy the tax), harmonization problems and wasteful tax
competition should not be a problem. A potential downside of a local property tax is that it may
be more expensive to administer than other local taxes (income, sales, fuel, for example) that
could be piggybacked onto existing federal or provincial taxes. This cost may be a small price to
pay, however, if local governments are to have autonomy and flexibility in setting tax policy -
important ingredients of responsible, efficient, and accountable local governments (Bird, 2001, at
3).
Although the residential property tax is considered to be a good tax for local government, the
same cannot be said for the non-residential property tax. The literature on property taxation of
business properties (commercial and industrial) concentrates on a few issues that are of particular

58
concern and importance to this sector (Kitchen and Tassonyi, 2012). These issues are reviewed
briefly in this section.
Are non-residential properties overtaxed relative to benefits received?
The taxation of business properties (commercial and industrial) at higher tax rates than
residential properties is a common practice across Canada, as it is in other countries (Bird and
Slack, 2004). Higher property taxation of commercial and industrial properties is generally done
in one of two ways; either through assessing business properties at higher values than residential
properties with the same tax rate applied to both property types; or through the simple
application of higher tax rates on business properties. Higher taxation of business properties
creates a number of efficiency and equity concerns. Efficiency in municipal service levels will
not be achieved if revenues collected from property taxes on business properties are used to
subsidize services consumed by the residential sector. Since service levels in any municipality
are driven primarily by the demands of the residential sector (they vote),16
their subsidization
means that the residential tax rate will be less than it would be in the absence of the subsidy and
an oversupply of municipal services could follow. Equity is not achieved either if those
benefiting from the services are not paying full costs.17
This heavy taxation of the non-residential sector has been addressed in a few Canadian studies.
All of these estimated the benefits that the non-residential sector gets from the consumption of
local public services and compared this value to the property tax paid by the non-residential
sector. All studies found that the residential sector receives proportionately more benefits from
local government services than the non-residential sector. For example, the non-residential sector
relies less heavily on social services, social housing elementary and secondary education,
libraries, recreational facilities, and it is often responsible for providing its own garbage
collection, security, and fire protection. The following summarizes the Canadian studies that
examined the over-taxation of businesses based on benefits received from local services:
16
The point that businesses do not vote is also made by CFIB (2011a) and Bish (2004). CFIB uses this point to call
for a cap on business property taxes in BC at a 2:1 ratio. 17
A recent court challenge of tax rates in the District of North Cowichan by Catalyst Paper, a major pulp and paper
mill in BC, on the grounds that they were not consistent with the cost of services provided, was decided in favour of
the municipality.

59
A review of property taxes and municipal expenditures in eight municipalities in Ontario
in 1990 concluded that non-residential property taxes ranged from 28 to 51 percent of
total local property taxes but accounted for only 31 to 40 percent of municipal
expenditures (Kitchen & Slack, 1993).
A fairly recent study in the City of Vancouver (MMK Consulting, 2007) compared the
consumption of services to taxes paid by the different property classes and concluded that
the non-residential sector paid $2.42 in taxes for each $1 of benefit received, while the
residential sector paid $0.56 for each $1 of benefit.18
The study also concluded that the
non-residential share of services consumed was 24 percent of the total; the residential
share was 76 percent.
In a Commentary by the C.D. Howe Institute (Mintz and Roberts, 2006), the authors
concluded that the non-residential sector is over taxed relative to the residential sector
when compared with the benefits that each of these sectors receives.
The over-taxation of the non-residential sector has generated some policy initiatives. Beginning
in 1995, for example, Vancouver city council moved to correct this discrepancy. Over the
ensuing five years, it shifted some of its tax burden from the commercial and industrial sector
onto the residential sector. In response to the recommendations of the Vancouver Property Tax
Policy Review Commission in 2007, the city continued to shift some of the burden of the
business class onto the residential class.
Beginning in 1998 in Ontario, as part of the property tax reforms, the provincial government
introduced policies to reduce the over-taxation of non-residential property. Transitional tax ratios
were regulated by the Province as upper limits on the municipal ability to shift more of the
relative tax burden onto non-residential property. The transitional tax ratios reflected the relative
tax burden by comparing the notional effective tax rate (taxes as a percent of assessed value) of a
particular property class (e.g. commercial property) to the effective tax rate of the residential
18
As noted in the Report of the Vancouver Property Tax Policy Review Commission (2007), the MMK study only
looks at the direct benefit from services. It does not consider the quality of life in a city, the perceived level of
safety, the availability of a high quality park and recreation system, and the provision and maintenance of high
quality infrastructure all of which are important factors in attracting skilled labour to a community (Vancouver
Property Tax Policy Review Commission, 2007). Another key consideration not included in the MMK Report is
that property tax is a deductible expense, for income tax purposes, for taxable businesses. This shift would suggest
that in 2006 the business share of services would rise to about 32 percent.
60
property class. Subsequently, the relative burden of taxation has been measured by “tax ratios”
for each class of property. The ratio is calculated by dividing the tax rate for each class by the tax
rate for the residential property class. At the same time, ‘ranges of fairness’ were established to
block any increase in the relative tax burdens of the non-residential property classes. In 2001, the
provincial government in Ontario announced that tax increases in municipalities where the ratios
were beyond the provincially established average ratios - must be imposed on the residential
sector and not on the commercial/industrial sector. In 2003, greater flexibility was provided to
allow an increase in the tax rate on these classes of property of up to 50 percent of the increase in
the residential rate. (Bird, Slack, and Tassonyi, 2012).
Once the path was set by provincial policy, the City of Toronto began reducing the ratio between
the tax rates on non-residential and residential properties. The target was to reduce the ratio from
4:1 in 2004 to 2.5:1 by 2013 for small businesses and by 2017 for all non-residential properties.
Should taxes on non-residential properties be used to fund education?
Most provinces in Canada levy a provincial property tax mostly to fund elementary and
secondary public schools. Newfoundland is an exception in that there are no provincial property
taxes. New Brunswick sets provincial tax rates but the funds go into general revenues and are not
specifically directed to education. Manitoba is the only remaining province where school boards
set their own property tax rate for funding a portion of local education costs. Elsewhere, the
province sets the property tax rate for funding public schools.
Using property taxes to fund public education raisers two issues: first, is there a role for local
funding of schools and should this funding come from property taxes on both residential and
non-residential properties? Second, is there a role for provincial property tax funding of schools?
The public education system in Canada provides direct benefits to its students along with indirect
or collective benefits for residents of that community. If one adheres to the benefits model of
financing public services, there may be merit in a finance system that assigns some direct
responsibility for funding to local residents. Accountability and economic or allocative efficiency

61
may be advanced because of the more direct link between the level of government raising the
revenue and the level of government making the expenditure. The flexibility and autonomy of
local school boards, districts, or divisions, may also be enhanced through access to locally
generated revenues from the residential sector, allowing them to accommodate more easily the
desires of the local community.
Given the arguments in support of local funding and, therefore, property taxation since it is the
only tax available at this level, there is a further issue of whether non-residential (commercial
and industrial) and residential properties should both contribute. Making a case for local funding
from the commercial and industrial sector is far more difficult than for the residential sector.
Although commercial and industrial property owners benefit from a well-educated and highly
skilled labour force, this benefit tends to be linked to the education system across the province, if
not the country, and not directly to the expenditures made in a particular school jurisdiction
(Bartik, 1985). As long as the local education system provides no collective or direct benefits to
local non-residential property owners, the imposition of non-residential property taxes to fund a
portion of local education costs is both inefficient and unaccountable. It is inefficient because
the commercial/industrial sector pays taxes for services that primarily benefit the residential
sector. This type of cross subsidization has the potential for leading to an oversupply of services
for the residential sector. Further, it lacks accountability since those who pay are not the
recipients of the service for which they have paid.
While there is a solid argument against funding schools from a local property tax on non-
residential property, such cannot be claimed for a local tax on residential property. Moreover, the
arguments against the taxation of commercial and industrial properties for funding local schools
should not be confused with the arguments in support of province-wide property taxation of non-
residential properties for school purposes. They are quite different as is noted below.
As long non-residential property taxes are used to finance education, there may be good reasons
to pool non-residential assessment and assign the tax revenues to the Province (British Columbia,
1988). For example, it is unlikely that the local commercial/industrial sector directly benefits
from the local education system although it is almost certain to benefit from a province-wide

62
system (Bartik, 1985). Furthermore, if the local tax is exported or partially exported, much of the
burden is likely to be borne by residents of other taxing jurisdictions and the initial intent, which
was to tax the local non-residential sector, will not be achieved.19
Furthermore, a uniform
province-wide tax on business may be desirable on allocative efficiency grounds so that
industrial or commercial location is based on economic considerations and not the tax (Kitchen
and Auld, 2006).
Province-wide pooling of non-residential assessment would also have the advantage of injecting
more `wealth neutrality' into the funding system in those provinces that currently do not have it.
British Columbia (British Columbia, 1988), for example, has a scheme of this type whereby the
situation where a school board located in an industrially or commercially rich area can raise
more tax revenue without raising the tax on residential property when compared with an area
where the commercial/industrial mix is relatively low is prevented.
Do non-residential property taxes impact economic activity and competitiveness?
The concern with the over-taxation of the commercial/industrial sector arises because this tax
represents a fixed charge that must be paid. The tax is fixed in the sense that it is unrelated to the
value of municipal services used or profits earned. As long as the tax rate is greater than the
marginal cost of municipal services consumed or if there are no economic rents for it to capture,
resources will be allocated inefficiently. This over-taxation of the non-residential sector can lead
to less economic activity, lower output, fewer jobs and a less competitive business environment
(Ottawa, 1998, chapter 2). Because property taxes on business properties increase the marginal
effective tax rate on capital, they discourage investment on structures and reduce the
competitiveness of the business sector (Dahlby, 2012).
A very important issue is whether the higher taxes on business properties plays a role in location
decisions. Firms and businesses generally locate where they can maximize profits, so property
taxes can influence a firm’s location decision in the same way as any other cost of production.
The impact on location decisions of property tax differentials depends on a number of factors
19
Tax exporting is discussed further below.
63
including the size of the differential between competing municipalities and whether this
differential is sufficient to offset differentials in other costs or market factors.
There is no general agreement about the importance of property taxes in location decisions. The
available evidence, most of which is drawn from the United States, suggests that property tax
differentials are relatively unimportant in inter-municipal or inter-regional location decisions but
do play a role in intra-municipal or intra-regional location decisions (Kitchen and Slack, 1993).
In other words, differences in property taxes are unlikely to play a significant role in a firm’s
decision whether to locate in the metropolitan areas of Vancouver, Calgary, Montreal, Halifax or
Toronto. They are likely to play a role, however, once a firm or business decides to locate in a
certain region such as the Greater Toronto Area, Metro Vancouver or the Region around
Montreal. Indeed, one might expect property tax differentials to produce a heavy concentration
of all firms and businesses in the jurisdictions with the lowest effective tax rates. In other words,
intra-municipal tax competition may be destructive if it leads to a race to have the lowest tax
rates.
One study of 147 municipalities in British Columbia in 1987 and 1991 found some evidence that
municipalities reacted to increases in their neighbours’ taxes but no evidence of widespread
destructive competition for capital (Brett and Pinske, 2000). A second Canadian study using
data for 100 municipal governments in New Brunswick from 1983 to 2003 found that
neighboring jurisdictions show more similarity in their tax policies than non-neighboring
jurisdictions, but it found no evidence of tax competition (Brett & Tardif, 2005). Similar studies
in the U.S., however, have concluded that property tax competition among neighbouring
municipalities is much more prevalent and widespread (Brueckner and Saavedra, 2001). A recent
study of Massachusetts suggested that municipalities choose to classify properties so they can
vary taxes based on employment and income effects (Lee and Wheaton, 2010). A major reason
for these different findings in Canada and the US likely arises because Canadian municipalities
are relatively new to property tax incentives.20
20
Property tax incentives in Canadian jurisdictions were described in section 5 above.

64
In practice, of course, the extent to which firms and businesses respond to differences in property
taxes depends on many factors, including the importance of being in the region’s or the city’s
core; the extent of opportunities to shift the difference in taxes on to consumers (of the final
service or product), employees or owners; and the enhanced amenities that may be offered by a
‘downtown location.’
A study of office buildings in downtown Chicago found that 45 percent of the amount by which
the property tax in one building exceeded the tax in another was shifted forward onto tenants as
higher gross rents per square foot and 55 percent was borne by the owner (McDonald, 1993).
The fact that some firms, such as large financial institutions, are willing to pay a premium for a
location in the downtown core suggests that these firms/businesses benefit from “economic
rents” created by that location. Taxing these rents is economically efficient, since it will not
affect the location decision. It is difficult, however, to know the extent of the economic rent; that
is, it is difficult to know at what level of rent (or property tax) a firm will choose to move out of
the downtown location.
There are other more positive effects that could arise from shifting the relative tax burden away
from the business sector (Damus et. al., 1987; and Devarajan et. al, 1980). First, a reduction in
the relative property tax burden on this sector reduces the potential for exporting the property tax
to non-residents (see discussion below). Second, since there is some evidence suggesting that
capital invested in real property is, on average, taxed at higher rates than capital invested in other
factors of production at least in Canada, the variation in capital tax rates is reduced if this burden
is altered. On balance, the reduction in tax exporting and the decrease in the variance in tax rates
could result in an improved allocation of resources for the Canadian economy as a whole and
overall efficiency gains (Economic Council of Canada, 1987, at 103 and 106).
One argument for higher property taxes on businesses is that they can deduct all expenses
incurred in earning income (including property taxes) and owner-occupiers of residential
dwellings are not allowed similar deductions, The extra tax on business is justified on the
grounds that it evens out the disparities in taxes that would otherwise exist. While it is true that
owner-occupiers are not able to deduct property taxes, it is also the case that owner-occupiers are

65
not required to include in taxable income either imputed income from their owner-occupied
dwellings or capital gains earned on the disposal of their principal residences (Boadway and
Kitchen, 1999, chapter 3). Such exclusion is similar to a deduction from income for tax purposes
(as in the case of the tax on businesses) in that both reduce the taxable economic income of the
taxpaying unit.
Are property taxes on commercial and industrial properties exported?
The opportunity for the commercial/industrial sector to export its property tax burden onto
residents of other municipalities has the potential for misallocating resources and lowering
municipal accountability. Of course, the ability of a firm to export will depend on the elasticity
of demand (the extent to which a change in quantity demanded is sensitive to a price change) for
the exported product.
Tax exporting refers to situations in which some portion of the local tax burden is borne by
people who live elsewhere either through a change in relative commodity prices or a change in
the net return to non-locally owned factors of production (inputs in the production process). For
example, if higher effective tax rates on commercial and industrial properties lead to relatively
higher prices charged on the sale of that community's exports to other communities, the taxing
jurisdiction will have effectively shifted part of its tax burden onto residents of other
communities. If the commercial/ industrial property tax in every jurisdiction is exported to some
extent, those jurisdictions exporting relatively more of the tax will be better off than those
jurisdictions exporting relatively less. In particular, if the burden of this tax is shifted from
residents of high income jurisdictions to those of low income jurisdictions, the distribution of
income among jurisdictions is worsened.
There is almost no evidence on tax exporting in Canada. One study on a sample of large
municipalities in Ontario concluded that the degree of exporting ranged from a low of 16 percent
of the commercial/industrial tax burden to a high of 106 percent (Thirsk, 1982). More than this,
relatively rich municipalities (in terms of per family income) had relatively high exporting rates
whereas relatively poor municipalities had relatively low tax exporting rates. Tax exporting thus

66
resulted in an implicit transfer from relatively low income municipalities to relatively high
income municipalities.
Finally, when the commercial/industrial sector exports its tax burden, municipal government
accountability is weakened because the direct link between the municipal government
responsible for local services and the ultimate person paying the tax is absent.
Should property taxes be used to stimulate economic development?
Although there is some consensus in the academic literature that property taxes have a small but
significant influence on business location within metropolitan areas (but not between
metropolitan areas), there is no consensus that property tax incentives are an effective strategy to
achieve economic growth.
Those who favour property tax incentives argue that the firms that receive them provide benefits
to the community that exceed the costs to the municipality for business services and
environmental degradation caused by the businesses (Glaeser, 2002). Moreover, new investment
can bring in other benefits to a municipality in addition to increasing production, wages, and
property tax revenues. Specifically, there will be benefits from agglomeration economies
(Garcia-Mila & Mc Guire, 2002): firms benefit from locating near each other. Finally, tax
incentives are an indication that the municipality is pro-business (Brunori, 2007).
Opposition to tax incentives focus on the zero-sum game aspects of tax competition:
development at one location will be at the expense of development at another location (Kitchen,
1985). Tax incentives are often wasted on firms that would have located there anyway.
Moreover, tax incentives can lead to unfair competition among businesses and can lead to a
situation where no major investments occur without them. Tax cuts need to be financed in some
way and, if they are financed by cutting public services that businesses want, the net effect on
economic development could be negative.
67
The literature against property tax incentives argues that the provision of services that, at the
same time, provides direct benefits to existing residents and firms is preferable to tax incentives
(Bartik, 1991), (Fisher, 1997). In particular, the provision of infrastructure would not only
influence firms to locate in the municipality but it would also provide a tangible resource to the
community. Moreover, these studies argue that lowering non-residential property taxes for all
businesses in the municipality is preferable to tax concessions to any specific business. In other
words, policy-makers should concentrate more on the issues of general tax policy for all firms
(such as equity and efficiency) than on tax incentives for specific firms (Wasylenko, 1997).
What is the impact of property taxes on competitiveness in BC?
The objective of the BC Jobs Plan is to create long-term jobs and investment in the province. The
Plan identifies eight sectors where the province is believed to have a competitive advantage and
is critical for BC’s growth: forestry, mining, natural gas, agrifoods, technology/clean technology/
green energy, tourism, transportation/ports/marine/aerospace, and international education.
Assessment and tax data do not permit the identification of each of these sectors but a few recent
studies in BC have analyzed the impact of property taxes on the competitiveness of some of
these sectors. The findings of these studies are summarized below.
In general, the studies suggest that the impact of property taxes on business competitiveness
depends on a number of factors – the nature of the business decision (investment in new
facilities, ongoing operations, etc.), the business in question (pulp and paper, shipbuilding,
mining, etc.), plus some other factors.
The Report of the City of Vancouver Property Tax Policy Commission (2007) examined the
property tax burden on businesses in Vancouver. The evidence for Vancouver showed that,
although the tax ratio on Class 6 properties had increased from 2.6 in 1984 to 6.15 in 2007, the
tax share for non-residential properties had fallen from 90.2 percent to 52.8 percent. A
comparison of property taxes per square foot of occupied office space in selected Canadian cities
suggested that municipal property taxes for quality office buildings are lower in Vancouver than

68
Toronto or Calgary but higher than in Winnipeg.21
Within Metro Vancouver, the findings show
that businesses of all types (office, industrial, retail) in Vancouver do pay more taxes per square
foot than in Burnaby and Richmond. For many jurisdictions, however, the tax differential was
less than the rent differential. Although the over-taxation of business properties relative to the
benefits received from city services was recognized, the report found little evidence to suggest
that property taxes have had a negative impact on business investment (measured by value of
building permits and new construction, for example) or the demand for commercial space.
The Report of the Municipal Port Property Taxation Fairness Commission (2010) indicated that
some individual port property taxpayers in certain port municipalities experienced problems in
2003 prior to the capping of port property taxes. Nevertheless, the Commission did not believe
that the problem with port property taxes in 2003 was widespread. Evidence provided by the
Commission showed that municipal property tax rates and tax ratios increased on major
industrial properties since 1985, but suggested that increasing property tax rates and tax ratios by
themselves were not evidence of an increasing property tax burden. The analysis suggested that,
in most municipalities in most time periods, property tax rate and ratio increases were consistent
with the municipal policy of keeping the property tax share constant for Class 4 properties.
The limited data available to the Commission suggested that property taxes represent a small
portion of the total costs faced by port operators and thus it could not reach a firm conclusion on
the significance of property taxes to the operations of the port operators. Nevertheless, the
Commission agreed with the argument that ever-increasing property tax rates would add to the
cost of new investment and could therefore discourage investment. Indeed, the potential impact
on investment was probably the strongest argument for the introduction of the tax cap.
The Commission noted that property tax rates on ports are higher in BC than they are for their
US counterparts but it also recognized that other differences in the assessment and taxation of
ports in the US compared with Canada make the comparison of the property tax burden difficult
to determine. Notwithstanding higher property tax rates in Metro Vancouver, the number of
21
This information was summarized in Table 20 above.

69
containers handled has increased faster in Port Metro Vancouver than other western ports in
North America, but some sectors (for example, break bulk) experienced difficulties. In the end,
the Commission was uncertain about the true impact of property taxes on the competitiveness of
ports in Metro Vancouver.
A recent study undertaken by Davies Transportation Consulting Inc. et al. (2011) for the Union
of British Columbia Municipalities (UBCM) and the BC Ministry of Community, Sport and
Cultural Development analyzed the impact of property taxes on the most important business
decisions of major industrial facilities (Class 4 properties). Their case studies included: pulp and
paper, sawmills, mining, aluminum and smelting, shipbuilding and repair, and marine terminals
and grain elevators. The study analyzed the impact on four decisions: investment in new
facilities, ongoing operations and temporary closures, re-investment in existing plants, and
economic obsolescence and plant closure.
Their review of Statistics Canada data showed that, for Canada, the share of total indirect taxes
(including municipal property taxes) averaged .54 percent of total industry operating costs from
2005 to 2009. The range was from .17 percent for the petroleum and coal sector to 1.19 percent
for marine terminals. In their analysis of a sample of individual companies in BC, with the
exception of marine terminals, property taxes did not account for “a dramatically
disproportionate share of costs relative to national averages.”
In terms of the impact of property taxes on competitiveness, their findings from interviews with
several major companies were similar for each of the sectors that they interviewed. The findings
suggest the following:
Property taxes are not a major competitive issue under typical operating conditions. As
noted above, property taxes represent a relatively small portion of overall costs and, as
long as industries are operating profitably, have little impact on business operating
decisions.

70
Property taxes are not a significant factor in investment in major capital projects because
the anticipated costs are small relative to total costs and potential revenue from the new
investment. These investments tend to be undertaken when commodity prices are high
and investors see a potential for extraordinary profits.
Property taxes do have an impact on decision around re-investment in existing facilities,
however. These investments tend to be undertaken when commodity prices are low in
order to maintain production capacity or reduce operating costs.
Property taxes also have a larger impact on firms with many different locations. These
firms will optimize the allocation of capital to those projects which have the highest
return. Other things being equal, firms will thus have an incentive to favour investments
in jurisdictions with lower major industrial tax rates.
Finally, property taxes become a major factor for firms in financial distress because these
taxes may contribute a large portion of the firm’s fixed costs.
9. Final Observations
As was noted in the introduction to this Report, there is no single index or measure that
unequivocally determines whether the property tax on the business sector affects
competitiveness. The answer depends on a variety of factors including the location of the
business, the timing of the business cycle, and the type of business that is taxed, for example. In
trying to gain insights into whether the business tax in British Columbia plays a role in
competitiveness, this report has done a number of things. It used a variety of comparative
statistical measures on property tax levels and trends in British Columbia, completed a number
of inter-provincial and inter-city comparisons of both the institutional framework for property
taxation and tax levels, drew from previous studies on this topic, and reviewed the literature on
property taxation and its impact on competitive decisions making.
Based on this research, the following observations can be made:

71
Municipal spending responsibilities and reliance on municipal revenues in British
Columbia are lower than in other large provinces in Canada (Alberta, Ontario, and
Quebec).
Total property taxes per capita for municipal purposes are lower in BC than they are in
Alberta, Ontario, Quebec, and Nova Scotia.
Municipal property taxes per capita on business are low in BC when compared with the
other large Canadian provinces and cities.
Education property taxes per capita on business properties in BC are generally higher
than in Alberta but lower than in Ontario. This may be partially attributed to provincial
decisions in each of these provinces in recent years to lower the property tax for
education on business properties.
Although tax rates on business properties have been rising in British Columbia, tax shares
for most business property classes have been falling. Property taxes per capita have
increased more rapidly on residential properties than for business properties, with the
exception of Class 5 properties.
On average across British Columbia, tax rates are higher for all business property classes
than they were 25 years ago but they have begun to decline in recent years. Tax shares for
most business properties (with the exception of Class 5) have fallen and property taxes
per capita have increased more for residential properties than business properties.
Most important, however, is that the trends in the previous two bullets do not apply to all
municipalities. There is a great deal of diversity in the tax treatment of business
properties among BC cities. It is difficult, therefore, to offer general conclusions about
the property tax on businesses for the province as a whole. It appears that some
municipalities have reduced the tax burden on business properties while others have
increased it. There is no single story to describe the tax treatment of the business sector.
On the basis of benefits received, the empirical evidence in Canada, limited as it may be,
suggests that the non-residential sector is over taxed relative to the residential sector. This
over-taxation is potentially harmful if it reduces the level of economic activity.
The literature, almost all of it based on U.S. studies, suggests that property tax
differentials are relatively unimportant in inter-municipal or inter-regional location
decisions but do play a role in intra-municipal or intra-regional location decisions. Two

72
Canadian studies on tax competition find no evidence of harmful competition for capital
and that neighboring jurisdictions show more similarity in their tax policies than non-
neighboring jurisdictions.
Some provinces permit municipalities to reduce property taxes on business properties as a
way of stimulating economic development. Based on the literature, there is no consensus
that property tax incentives are an effective strategy to achieve economic growth.
For competitiveness purposes, studies suggest that the impact of property taxes on
business competitiveness depends on a number of factors – the nature of the business
decision (investment in new facilities, on-going operations, etc.), the business in question
(pulp and paper, shipbuilding, mining, etc.), plus other factors. More specifically,
property taxes on business properties are not a concern unless the firm is in financial
distress and the tax is a large component of its fixed cost, and when commodity prices are
low and operating costs must be reduced.

73
Bibliography
Auld, Douglas and Harry Kitchen. 2006. Financing Education and Training in Canada, Second
Edition, Canadian Tax Foundation, Toronto, Ontario.
Adams, Peter. 2004. “Major Industry Assessment and Taxes.” Prepared for Richard Taylor,
Union of British Columbia Municipalities.
Bartik, Timothy J. 1985. “Business Location Decisions in the United States: Estimates of the
Effects of Unionization, Taxes, and Other Characteristics of States”, 3 Journal of Business and
Economic Statistics 14-22
Bartik, T. J. 1991. Who Benefits from State and Local Economic Development Policies?
Kalamazoo, MI: W.E. Upjohn Institute.
BC Ministry of Community, Sport and Cultural Development. 2011. Local Government in
British Columbia: Statistics and Facts.
Berniaz, Kate. 2009. “Municipal Property Tax in BC: Principles and Provincial Strategies to
Shape Local Tax Distribution Policy.” Advanced Management Report prepared for the Ministry
of Community and Rural Development.
Bird, Richard M. 2001. “Subnational Revenues: Realities and Prospects,” (Washington: World
Bank Institute).
Bird, Richard M. and Roy Bahl. 2008. “Subnational Taxes in Developing Countries: the Way
Forward,”Institute for International Business Paper No. 16 (Toronto: Joseph L. Rotman School
of Management, University of Toronto).
Bird, Richard, M. And Enid Slack. 2004. International Handbook on Land and Property
Taxation. UK: Edward Elgar.
Bird, Richard M. and Enid Slack. 2004. “Fiscal Aspects of Metropolitan Governance”
International Tax Program Paper 0401 (Toronto: Joseph L. Rotman School of Management,
University of Toronto).
Bird, Richard M., Enid Slack, and Almos Tassonyi. 2012. A Tale of Two Taxes: Property Tax
Reform in Ontario (Cambridge, Mass: Lincoln Institute of Land Policy).
.
Bish, Robert L. 2004. “Property Taxes on Business and Industrial Property in British Columbia.”
Fraser Institute Digital Publication.
Boadway, Robin W. and Harry Kitchen. 1999. Canadian Tax Policy, third edition (Toronto:
Canadian Tax Foundation).

74
Brett, Craig and Joris Pinkse. 2000. “The determinants of municipal tax rates in British
Columbia,” Canadian Journal of Economics, vol. 33, no. 3, 695-714.
Brett, C., & Tardif, C. 2005. Yardstick Competition and Tax Base Competition in Local Tax
Setting in New Brunswick. Sackville, New Brunswick: Mount Allsion University unpublished
paper.
Brueckner, Jan K. and Luz A. Saavedra. 2001. “Do Local Governments Engage in Strategic
Property-Tax Competition?” National Tax Journal, Vol. LIV, No. 2, 203-229.
British Columbia. 1988. Report of the Royal Commission on Education: A Legacy for Learners,
Victoria, B.C.
Brunori, D. 2007. Local Tax Policy: A Federalist Perspective. 2nd
edition. Washington, DC: The
Urban Institute Press.
Canadian Federation of Independent Business. 2011. BC Municipal Spending Watch. 4th Annual
Report.
Canadian Federation of Independent Business. 2011a. The Municipal Property Tax Gap: Small
Business Still Feeling the Squeeze in BC.
Dahlby, Bev. 2012. “Reforming the Tax Mix in Canada.” SPP Research Papers, The School of
Public Policy, University of Calgary, Vol. 5, Issue 14.
Damus, Sylvester, Paul Hobson and Wayne Thirsk. 1987. “The Welfare Effects of the Property
Tax in an Open Economy,” Discussion Paper No. 320 (Ottawa: Economic Council of Canada).
Davies Transportation Consulting Inc, Wave Point Consulting Ltd., and Lane Property Advisors
Inc. 2011. “Major Industrial Property Taxation Impacts.” A report prepared for the Union of
British Columbia Municipalities and the BC Ministry of Community, Sport and Cultural
Development.
Devarajan, Shantayanan, Don Fullerton, and Richard A. Musgrave. 1980. "Estimating the
Distribution of Tax burdens: A Comparison of Different Approaches," Journal of Public
Economics, 13 (April), 155-82.
Economic Council of Canada. 1987. The Taxation of Savings and Investment, A Research Report
Prepared for the Economic Council of Canada (Ottawa: Economic Council of Canada).
Fisher, R. C. 1997. The Effects of State and Local Public Services on Economic Development.
New England Economic Review , March/April, 53-66.
Garcia-Mila, T., & Mc Guire, T. J. 2002. Tax Incentives and the City. Brookings-Wharton
Papers on Urban Affairs, 95-132.
75
Glaeser, E. 2002. Comment on 'Tax Incentives and the City'. Brookings-Wharton Papers on
Urban Affairs, 115-24.
Inman, Robert P. 2005. “Financing Cities”, Working Paper 11203.(Cambridge, MA: National
Bureau of Economic Research). Available from http://www.nber.org/papers/w11203.
Kitchen, H. 1985. The Role for Local Governments in Economic Development. Toronto: Ontario
Economic Council.
Kitchen, Harry M. and Almos Tassonyi (2012), “Municipal Taxes and User Fees” in Tax Policy
in Canada, edited by Heather Kerr, Ken McKenzie and Jack Mintz, (Canadian Tax Foundation,
Toronto, 2012), ch. 9.
Kitchen, Harry M. and Enid Slack. 2003. Business Property Taxation, Discussion Paper No. 93-
24, Government and Competitiveness Project, School of Policy Studies, Queen's University,
Kingston
Lee, Nai Jai and William C. Wheaton. 2010. “Property Taxes under “Classification”: Why do
Firms pay more?” Centre for Real Estate Working Paper (Cambridge, Mass: MIT Department of
Economics).
McClure Jr., Charles E. 2001. “The Tax Assignment Problem: Ruminations on How Theory and
Practice Depend on History.” National Tax Journal, Vol. 54, No. 2, 339-363.
McDonald, John F. “Incidence of the Property Tax on Commercial Real Estate: The Case of
Downtown Chicago (1993),” National Tax Journal, 109-120.
MMK Consulting. 2007. “Consumption of Tax-Supported Municipal Services.” Vancouver.
City of Vancouver Property Tax Policy Review Commission. 2007. Final Report.
Mezynska, Urszula. 2005. “Major Industry Property Taxation in British Columbia”. Prepared
and submitted in partial fulfilment of the requirements for the degree of Master of Public
Administration at the University of Victoria.
Mintz, Jack M. and Tom Roberts. 2006. “Running on Empty: A Proposal to Improve City
Finances” Commentary No. 226. (Toronto: C.D. Howe Institute).
Municipal Port Property Taxation Fairness Commission. 2010. Final Report.
Ottawa (1998) Report of the Technical Committee on Business Taxation, (Ottawa: Department of
Finance).
Premier’s Task Force on Community Opportunities. 2006. Component 1 – Industrial Tax
Analysis.

76
Slack, Enid. 2008. “Property Tax Incentives and Economic Development: A Review of the
Literature and Implications for Toronto”, a report prepared for the Toronto Office Coalation.
Thirsk, Wayne R. 1982. "Political Sensitivity Versus Economic Sensibility: A Tale of Two
Property Taxes," in Wayne R. Thirsk and John Whalley, eds., Tax Policy Options in the 1980s
Canadian Tax Paper no. 66 (Toronto: Canadian Tax Foundation), pp. 384-40.
Union of BC Municipalities (UBCM). 2011. Comment on Fiscal Management in British
Columbia Municipalities. May.
Wasylenko, M. 1997. “Taxation and Economic Development: The State of the Economic
Literature.” New England Economic Review , March/April, 37-52.
77
Appendix A: Municipal Tax Shares
Class 1
Class 6
0.0%
10.0%
20.0%
30.0%
40.0%
50.0%
60.0%
70.0%
19
85
19
87
19
89
19
91
19
93
19
95
19
97
19
99
20
01
20
03
20
05
20
07
20
09
20
11
Figure A-1: Tax Shares by Class, Prince George,1985-2011
Class 1
Class 6
0.0%
10.0%
20.0%
30.0%
40.0%
50.0%
60.0%
70.0%
80.0%
19
85
19
87
19
89
19
91
19
93
19
95
19
97
19
99
20
01
20
03
20
05
20
07
20
09
20
11
Figure A-2: Tax Shares by Class, Kelowna
1985-2011

78
Class 1
Class 6
0.0%
10.0%
20.0%
30.0%
40.0%
50.0%
60.0%
70.0%
80.0%
19
85
19
87
19
89
19
91
19
93
19
95
19
97
19
99
20
01
20
03
20
05
20
07
20
09
20
11
Figure A-3: Tax Shares by Class, Nanaimo
1985-2011
Class 1
Class 6
0.0%
10.0%
20.0%
30.0%
40.0%
50.0%
60.0%
70.0%
80.0%
19
85
19
87
19
89
19
91
19
93
19
95
19
97
19
99
20
01
20
03
20
05
20
07
20
09
20
11
Figure A-4: Tax Shares by Class, Abbotsford
1985-2011

79
Class 1
Class 6
0.0%
10.0%
20.0%
30.0%
40.0%
50.0%
60.0%
70.0%
19
85
19
87
19
89
19
91
19
93
19
95
19
97
19
99
20
01
20
03
20
05
20
07
20
09
20
11
Figure A-5: Tax Shares by Class, Cranbrook
1985-2011
Class 1
Class 6
0.0%
10.0%
20.0%
30.0%
40.0%
50.0%
60.0%
19
85
19
87
19
89
19
91
19
93
19
95
19
97
19
99
20
01
20
03
20
05
20
07
20
09
20
11
Figure A-6: Tax Shares by Class, Fort St. John
1985-2011

80
Class 1
Class 6
40.0%
42.0%
44.0%
46.0%
48.0%
50.0%
52.0%
54.0%
19
85
19
87
19
89
19
91
19
93
19
95
19
97
19
99
20
01
20
03
20
05
20
07
20
09
20
11
Figure A-7: Tax Shares by Class, Victoria
1985-2011

81
Appendix B: Municipal Tax Ratios
Class 2
Class 4
Class 5
Class 6
0.00
1.00
2.00
3.00
4.00
5.00
6.00
7.00
8.00
19
85
19
87
19
89
19
91
19
93
19
95
19
97
19
99
20
01
20
03
20
05
20
07
20
09
20
11
Figure B-1: Municipal Tax Ratios, Prince George, 1985-2011
Class 2
Class 4
Class 5Class 6
0.00
2.00
4.00
6.00
8.00
10.00
12.00
14.00
16.00
19
85
19
87
19
89
19
91
19
93
19
95
19
97
19
99
20
01
20
03
20
05
20
07
20
09
20
11
Figure B-2: Municipal Tax Ratios, Kelowna, 1985-2011

82
Class 2
Class 4
Class 5
Class 6
0.00
1.00
2.00
3.00
4.00
5.00
6.00
7.00
8.00
9.00
10.001
98
5
19
87
19
89
19
91
19
93
19
95
19
97
19
99
20
01
20
03
20
05
20
07
20
09
20
11
Figure B-3: Municipal Tax Ratios, Nanaimo, 1985-2011
Class 2
Class 4
Class 5
Class 6
0.00
2.00
4.00
6.00
8.00
10.00
12.00
19
85
19
87
19
89
19
91
19
93
19
95
19
97
19
99
20
01
20
03
20
05
20
07
20
09
20
11
Figure B-4: Municipal Tax Ratios, Abbotsford, 1985-2011
83
Class 2
Class 4
Class 5 Class 6
0.00
1.00
2.00
3.00
4.00
5.00
6.00
7.00
8.00
9.001
98
5
19
87
19
89
19
91
19
93
19
95
19
97
19
99
20
01
20
03
20
05
20
07
20
09
20
11
Figure B-5: Municipal Tax Ratios, Cranbrook, 1985-2011
Class 2
Class 4
Class 5
Class 6
0.00
1.00
2.00
3.00
4.00
5.00
6.00
7.00
8.00
9.00
19
85
19
87
19
89
19
91
19
93
19
95
19
97
19
99
20
01
20
03
20
05
20
07
20
09
20
11
Axi
s Ti
tle
Figure B-6: Municipal Tax Ratios, Fort St. John, 1985-2011

84
Class 2
Class 4Class 5
Class 6
0.00
1.00
2.00
3.00
4.00
5.00
6.00
7.00
8.00
9.00
10.001
98
5
19
87
19
89
19
91
19
93
19
95
19
97
19
99
20
01
20
03
20
05
20
07
20
09
20
11
Figure B-7: Municipal Tax Ratios, Victoria, 1985-2011
Class 2
Class 4
Class 5
Class 6
0.00
2.00
4.00
6.00
8.00
10.00
12.00
14.00
16.00
18.00
19
85
19
87
19
89
19
91
19
93
19
95
19
97
19
99
20
01
20
03
20
05
20
07
20
09
20
11
Figure B-8: Municipal Tax Ratios, Kamloops, 1985-2011

85
Appendix C: Municipal Tax Review – Terms of Reference
The purpose of this study is to provide a basis for the Expert Panel to:
consider the impact of municipal property taxes on business on the overall competitiveness
of the British Columbia tax system; and,
evaluate options – within the panels overall terms of reference - that could address areas
where the analysis suggest municipal property taxation challenges the overall competiveness
of British Columbia’s tax system.
In undertaking this work the contractors will:
consult with the appropriate B.C. Government agencies (B.C. Assessment, Ministry of
Finance, Ministry of Community, Cultural and Sport Development) to assemble the existing
analytical work that has been done within the B.C. Govt’;
consult with any other parties that they consider have done substantial analytical work on the
subject;
determine what additional analytical work they will need to complete, and to provide the
Panel with:
1. an estimate of BC’s overall property tax load on businesses compared with other
provinces. This should include an overview of variations among classes of businesses
(commercial, industrial, etc.) and where possible and appropriate, key economic sectors;
2. trends in the proportion of municipal property taxes received from businesses in BC
including variations among regions, economic sectors (where possible) or local
governments within BC.
3. a description of how BC’s institutional framework (e.g. legislation, Community Charter
requirements) for municipalities’ authority to levy differential property taxes compares
with other provinces.
4. a review of approaches used in other provinces/jurisdictions to align municipal taxation
policies with provincial economic development objectives.