a report on preliminary considerations of sampling plan …€¦ · a report on preliminary...
TRANSCRIPT
A REPORT ON PRELIMINARY CONSIDERATIONS
OF SAMPLING PLAN DESIGN
FOR THE HAT CREEK COAL DEPOSIT
A sampling plan cannot be designed to meet all eventualities unless
those eventualities are specified. No such specifications have been forth-
coming ! HeXICe ) the approach adopted at present has been to confine our
efforts to characterizing the variability of different variables of Hat
Creek coal on the basis of available data. Such data are available in
reasonable abundance only for samples with core lengths of 20 feet or more
(up to 100 to 200 feet), and, in the 20 to 40 foot range, for proximate
data only.
Variability of analytical data is obviously a function of sample size.
Long core samples, even 20 to 40 feet long for example, smooth out local
variations that exist over distances of a few feet. An examination of
local variability appears desirable because
(1) it is imperative' in plant design to take into account local varia-
bility of feed that might be received in hoppers and subsequently
in the furnace, and
(2) local variability studies provide the most fundamental basis on
which to base an optimal sampling plan, where optimal refers to
an acceptable tradeoff between certainty of estimations and cost.
It should be clear that item (1) above cannot be resolved only by core
analyses, or any analyses that relate purely to in situ coal because the
coal will be subjected to various homogenizing and segregating influences
prior to introduction as furnace feed. However, knowledge of local varia-
bility is knowledge of the starting condition for the coal, a condition
2.
that can be estimated, and which provides a base of comparison for the
effects that subsequent operations have on variability of the coal.
A second point that must be made clear is that we are concerning our-
selves at present with samples of a particular support or supports. Support
here means a particular size and shape of sample (e.g. one half of a 20-foot
cylinder of drill core). The kind of variability observed in such samples
does not bear any as yet established relationship to the kind of variability
to be expected in a shovel scoop!
At the present phase of evaluation of Hat Creek coal a relatively wide-
spaced drilling grid (eventually with holes on SOO-foot centres) is antici-
pated. Such a spacing assumes that lateral variability of coal over dis-
tances less than 500 feet is negligible or at least is low relative to
variability encountered along drill holes that cut layering in the coal at
or near 9o". This assumption is not necessarily true for many variables
even within the same gross stratum (A, B, C, or D) and the writer is present-
ly examining lateral variability, as far as existing data permit, using
analysis of variance.
A data base is required that will serve as a basis for designing a
sampling plan that will provide information for mine and plant design. The
writer, in conjunction with others, has come to the conclusion that such a
data base could be provided by an absolute minimum of 2 drill holes that
provide analytical data for all four major strata (A, B, C, and D). Each
of these holes should provide information on each of the major strata but
the two holes should be located such that they indicate something of the
variability in a lateral sense. Because of geometric restrictions, dif-
ficulties of access, and locations of other holes already drilled, these
holes cannot be chosen randomly. Two sites have been selected based on
3. I J r ’ J
r a
II II
;I il J il
the above criteria and within the framework of the planned locations of
holes at or near 5oo-fOOt Centres. All samples from both these holes
&ould be assayed for Prbximate, ultimate and ash elemental values, details
of which need not be recorded here. Such a procedure has the considerable
advantage that simple and multiple correlation studies among all groups of
variables are possible at a variety of sample sizes.
The question of sample Size (core length to be analyzed) is an important
me for rexmns of cost of analyses if ncme other. For plant design 5-foot
samples are.desired in the 2 test holes. Such a data base would certainly~.
serve as a sound basis for designing a sampling plan and is to be recommend-
ed. A modification will be suggested based on the following discussion.
Examination of geological drill logs shows a surprising homogeneity of
megascopic characteristics. Geophysical logs show appreciably more varia-
bility and, in many holes, permit the unambiguous recognition of 4 major
strata,, A, B, C and D, each characterized by its own variability of physi-
cal measurements (density, resistance, gamma radiation). An examination of
zone A shows that there are several levels of extreme local variability,
one on a scale of 1 to 2 feet, the next being at a scale of 15 to 20 feet.
1n this case lo-foot samples should provide e&ally good information as
would 5-foot samples--both would smooth out the very small scale variations
but both would indicate the 15 to 20-foot variation. Similarly, the two
zones of relatively uniform coal, B and D, appear to have sufficiently
uniform physical properties that little would be added to our knowledge of
variability by using 5-foot samples instead of lo-foot samples. Zone c,
on the other hand, is characterized by a short-range physical variability
that would be smoothed out significantly by lo-foot samples and 5-foot
samples are desirable.
4.
d This discussion of adequate sample lengths for a study of variability
of various measured quantities is based on the realistic assumption that
physical variations reflect lithologic variations which, in turn, reflect
chemical variations. Put another way, the geometry (interlayered nature)
of physical variables should also reflect the major component of the chemi-
cal variability. Although this is certainly trae it must be remembered
that even a well-defined lithological unit that is apparently homogeneous
megascopically can have substantial variations of chemistry. To offset
this problem the following approach to sample size for analysis is recom-
meded:
Zone A: Zone B: 2 lo-foot samples followed by 2 5-foot
Zone D: 1 samples repeated as required
zone c: 5-foot samples
Samples should be systematic.
The foregoing plan has been devised using geophysical and geological
logs for drill holes near the sites of the two test holes. If logs are
available from the test holes themselves prior to analyses being done, it is
obviously more appropriate to refine the sampling plan using test hole logs
as a guide. This option can be kept open by collecting 5-foot samples and
combining some of them to form lo-foot samples prior to analysis.
. . . . . . . . . . . . . . . .
A.J. Sinclair June 23, 1976
i Ll INTER AND INTR4 LABORATORY RFaPRODUCIBILITY
HAT CREEK COAL ANALYSES
' I
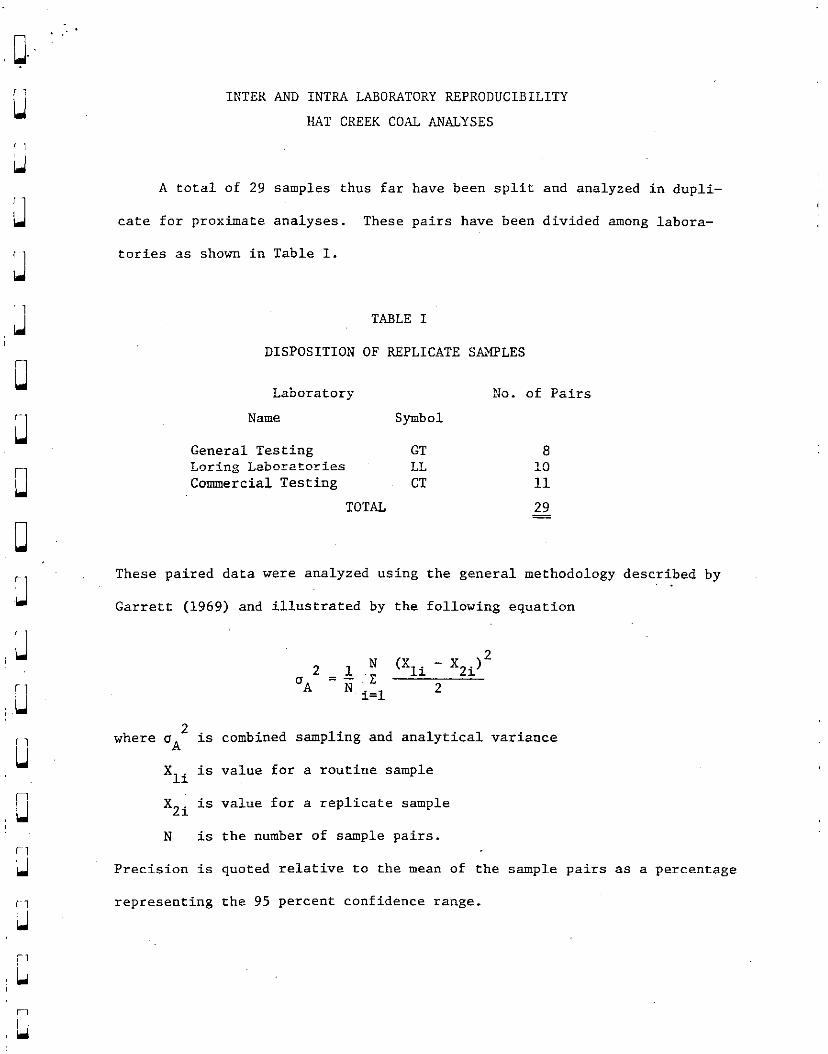
u A total of 29 samples thus far have been split and analyzed in dupli-
cate for proximate analyses. These pairs have been divided among labora-
tories as shown in Table I.
'1
d TABLE I
DISPOSITION OF REPLICATE SAMFLES
ii
r
Ll
r Li
0
Laboratory No. of Pairs
Name Symbol
General Testing GT a Lnring Laboratories LL 10 Commercial Testing CT 11
TOTAL 2
These paired data were analyzed using the general methodology described by
Garrett (1969) and illustrated by the following equation
where o 2
I] A
1s combined sampling and analytical variance
Xii is va+ for a routine sample
u X2i is value for a replicate sample
N is the number of sample pairs. r~i u Precision is quoted relative to the mean of the sample pairs as a percentage
r~i representing the 95 percent confidence range.
u
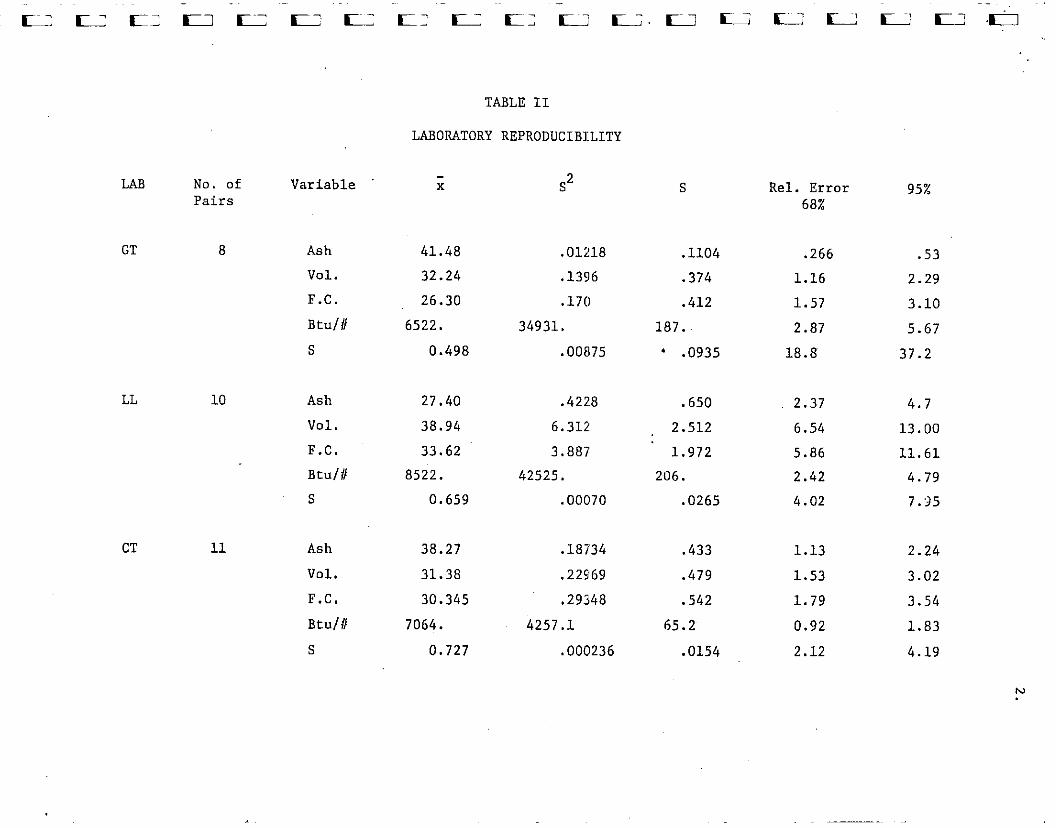
TABLE II
LABORATORY REPRODUCIBILITY
LL 10
CT 11
LAB No. of Variable Pairs
x S2 S Rel. Error 68%
95%
GT a Ash 41.40 Vol. 32.24 F.C. 26.30
Btu/i/ 6522.
S 0.498
.01218 .1104 .266 .53
.1396 .374 1.16 2.29
.170 .412 1.57 3.10 34931. 187.~ 2.87 5.67
.00875 * .0935 18.8 ~37.2
Ash
Vol.
F.C. Btu/# S
27.40 .4228 .650 2.37 4.7 38.94 6.312 2.512 6.54 13.00 33.62 3.887 1.972 5.86 11.61
8522. 42525. 206. 2.42 4.79 0.659 .00070 .0265 4.02 7.35
Ash 38.27 .18734 ,433 1.13 2.24
Vol. 31.38 .22569 .479 1.53 3.02 F.C. 30.345 .29348 .542 1.79 3.54
Btu/# 7064. 4257.1 65.2 0.92 1.83
S 0.727 .000236 .0154 2.12 4.19
3.
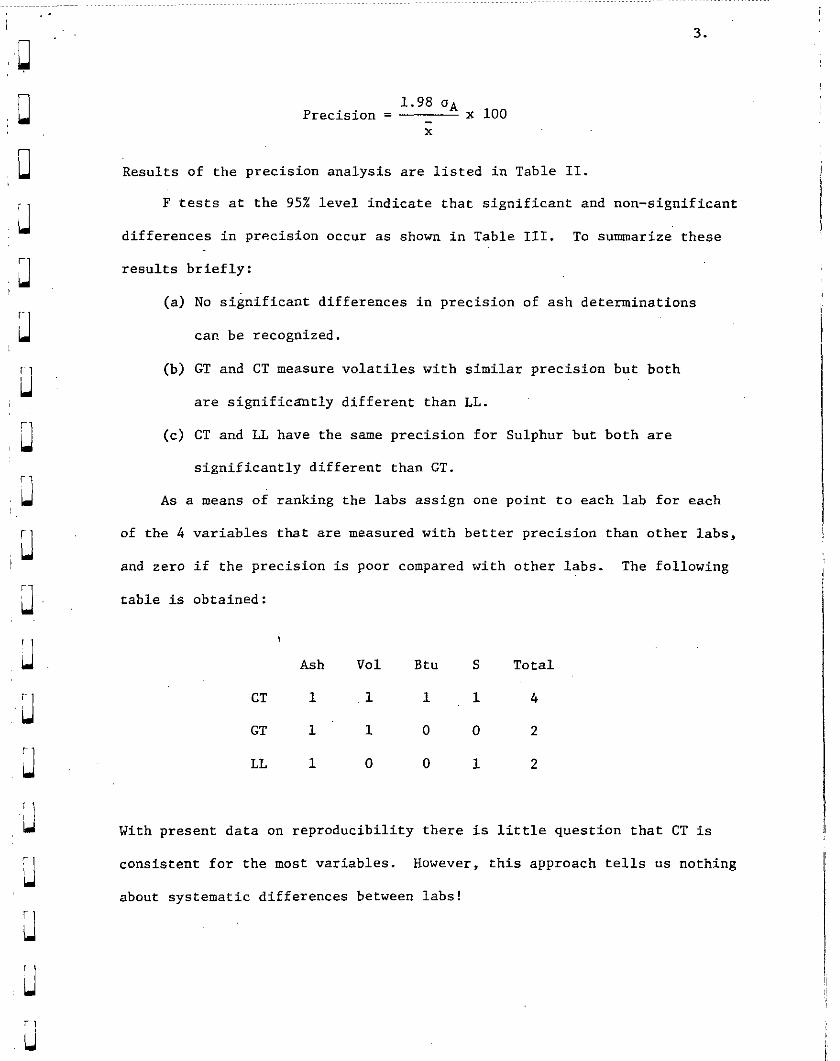
Precision = 1.98 cJ*
x 100 x
Results of the precision analysis are listed in Table II.
F tests at the 95% level indicate that significant and non-significant
differences in precision occur as shown in Table III. To summarize these
results briefly:
(a) No significant differences in precision of ash determinations
car. be recognized.
(b) GT and CT measure volatiles with similar precision but both
are significantly different than LL.
(c) CT and LL have the same precision for Sulphur but both are
significantly different than GT.
As a means of ranking the labs assign one point to each lab for each
of the 4 variables that are measured with better precision than other labs,
and zero if the precision is poor compared with other labs. The following
table is obtained:
Ash Vol Btu S Total
CT 1 .l 1 1 4
GT 1 1 0 0 2
LL 1 0 0 1 2
With present data on reproducibility there is little question that CT is
consistent for the most variables. However, this approach tells us nothing
about systematic differences between labs!
4.
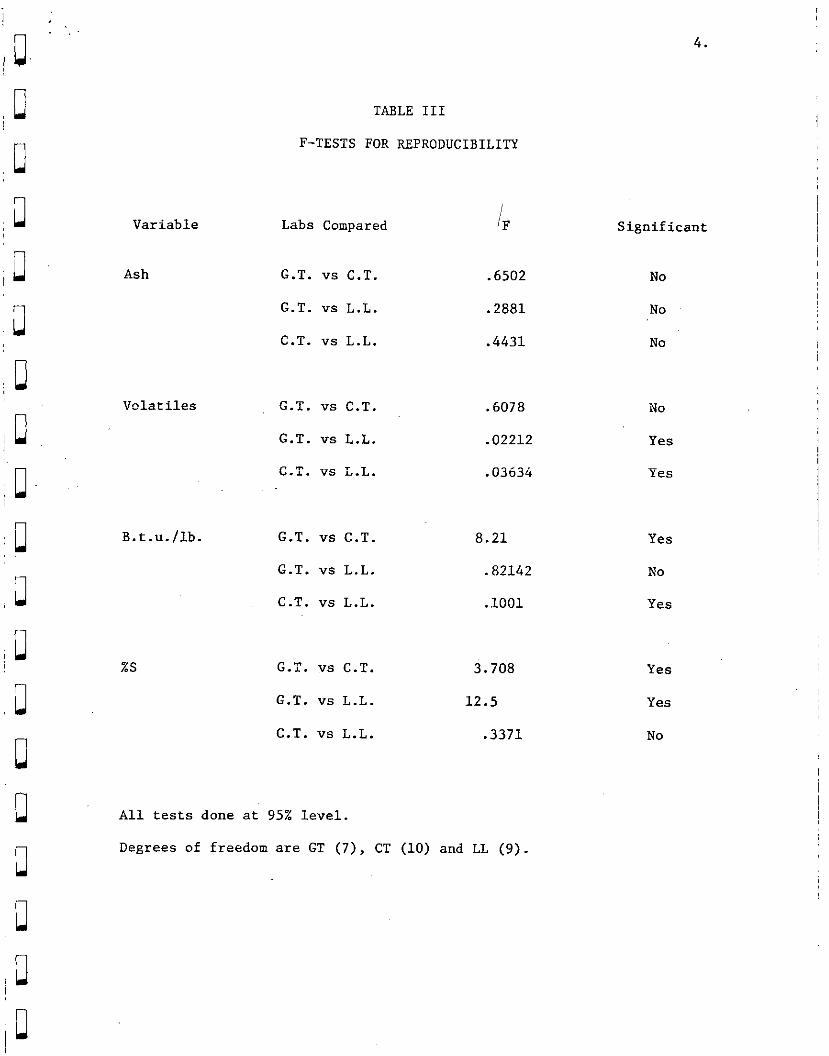
u TABLE III
II
F-TESTS FOR REPRODUCIBILITY
u Variable Labs Compared
u Ash G.T. vs C.T. .6502
1 G.T. vs L.L. .2881 u C.T. vs L.L. .4431
n Id
Volatiles G.T. YS C.T. .6078
c. G.T. vs L.L. .02212
C.T. "S L.L. .03634
B.t.u./lb. G.T. YS C.T. 8.21 Yes
G.T. vs L.L. .82142 NO
C.T. vs L.L. .:1001 Yes
u u c
%S G.T. YS C.T. 3.708
G.T. vs L.L. 12.5
C.T. vs L.L. .3371
All tests done at 95% level.
Degrees of freedom are GT (7), CT (10) and LL (9).
Significant
NO
No
NO
NO
Yes
Yes
Yes
Yes
NO
Lab Pair*
GT vs LL (1) (2)
CT vs GT (1) ,(a
CT vs LL (1) (2)
Variable
Ash Btu s Vol.
Ash Btu S Vol.
Ash Btu S Vol.
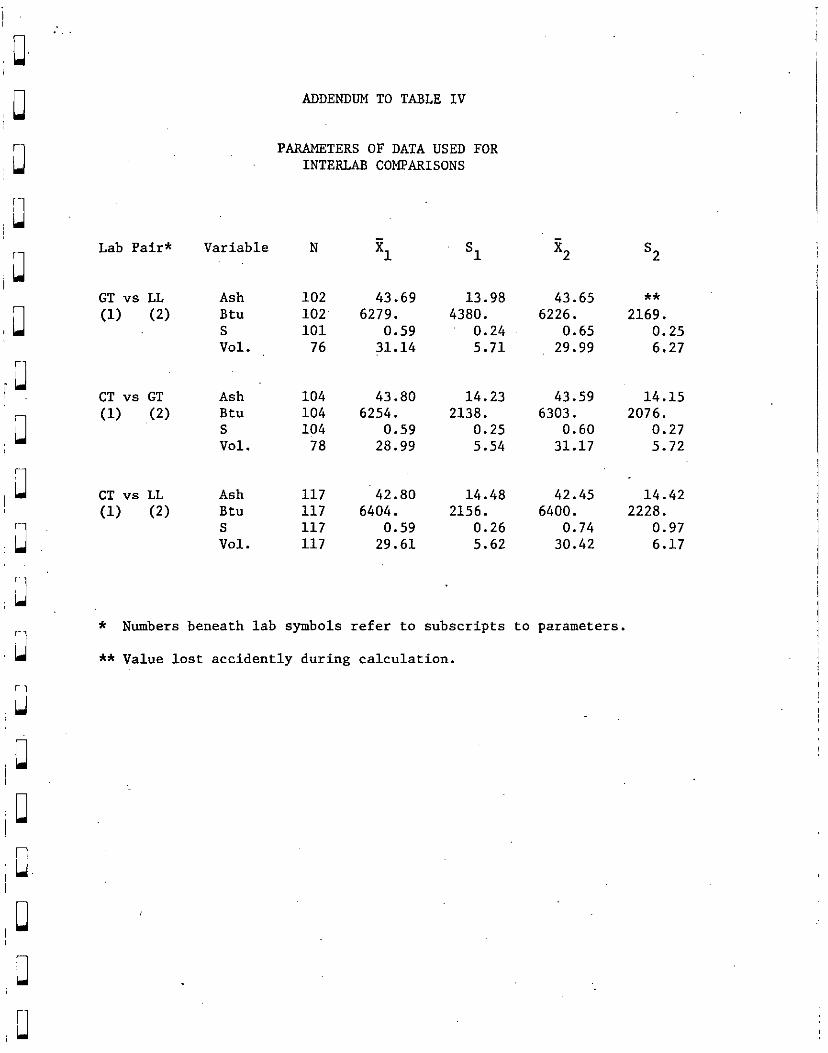
ADDENDUM TO TABLE IV
PARAMETERS OF DATA USED FOR INTERLAB COMPARISONS
N
102 102. 101
76
104 104 104
78
117 117 117 117
s1 s2
43.69 13.98 6279. 4380.
0.59 0.24 31.14 5.71
43.65 ** 6226. 2169.
0.65 0.25 29.99 6.27
43.80 14.23 43.59 14.15 6254. 2138. 6303. 2076.
0.59 0.25 0.60 0.27 28.99 5.54 31.17 5.72
42.80 14.48 42.45 14.42 6404. 2156. 6400. 2228.
0.59 0.26 0.74 0.97 29.61 5.62 30.42 6.17
* Numbers beneath lab symbols refer to subscripts to parameters.
** Value lost accidently during calculation.
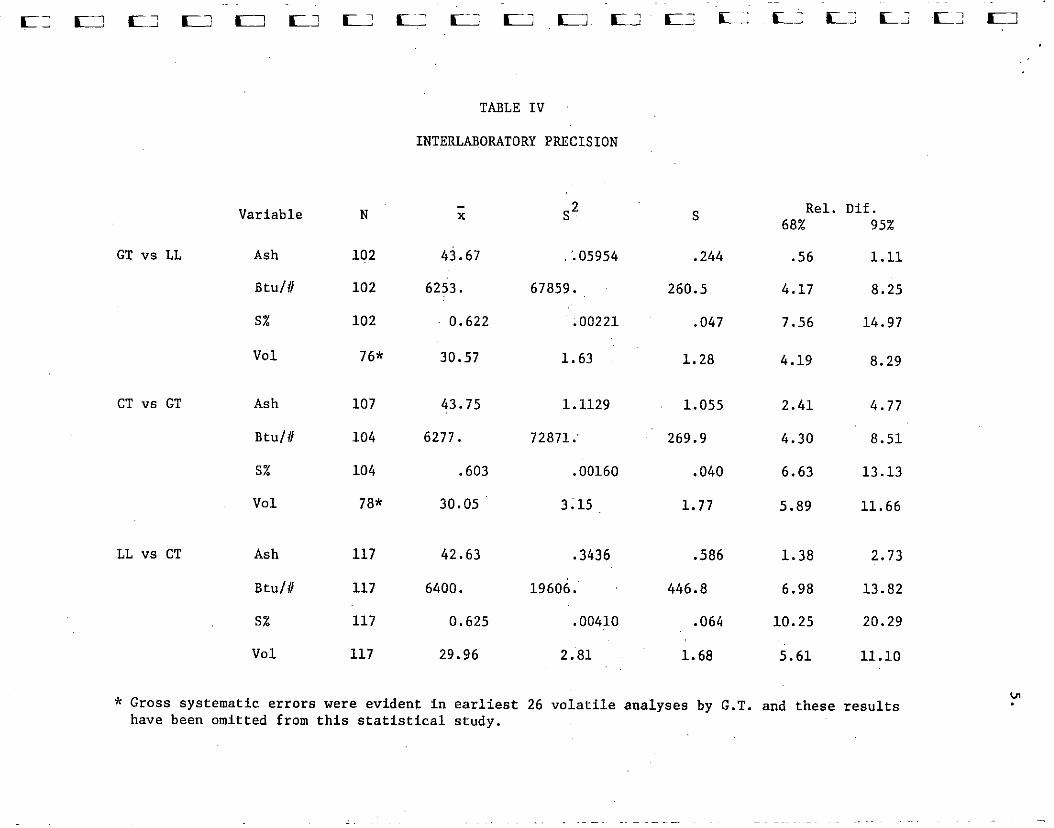
TABLE IV
INTERLABORATORY PRECISION
GT vs LL
CT vs GT
LL vs CT
Variable S
Ash
Btu/#
S%
VOl
N
102
102
102
76*
41.67
62i3.
0.622
.244
260.5
.047
30.57
: 05954
67859.
.00221
1.63 1.28
Rel. Dif. 68% 95%
.56 1.11
4.17 8.25
7.56 14.97
4.19 a.29
Ash 107 43.75 1.1129 1.055 2.41 4.77
Btu/# 104 6277. 72871.' 269.9 4.30 8.51
S% 104 .603 .00160 .040 6.63 13.13
VOl 7a* 30.05 3:15 1.77 5.89 11.66
Ash 117 42.63 .3436 .586
Btu/# 117 6400. 19608.~ 446.8
S% 117 0.625 .00410 .064
VOl 117 29.96 2.81 1.68
1.38 2.73
6.98 13.82
10.25 20.29
5.61 11.10
* Gross systematic errors were evident in earliest 26 volatile analyses by G.T. and these results have been omitted from this statistical study.
6.
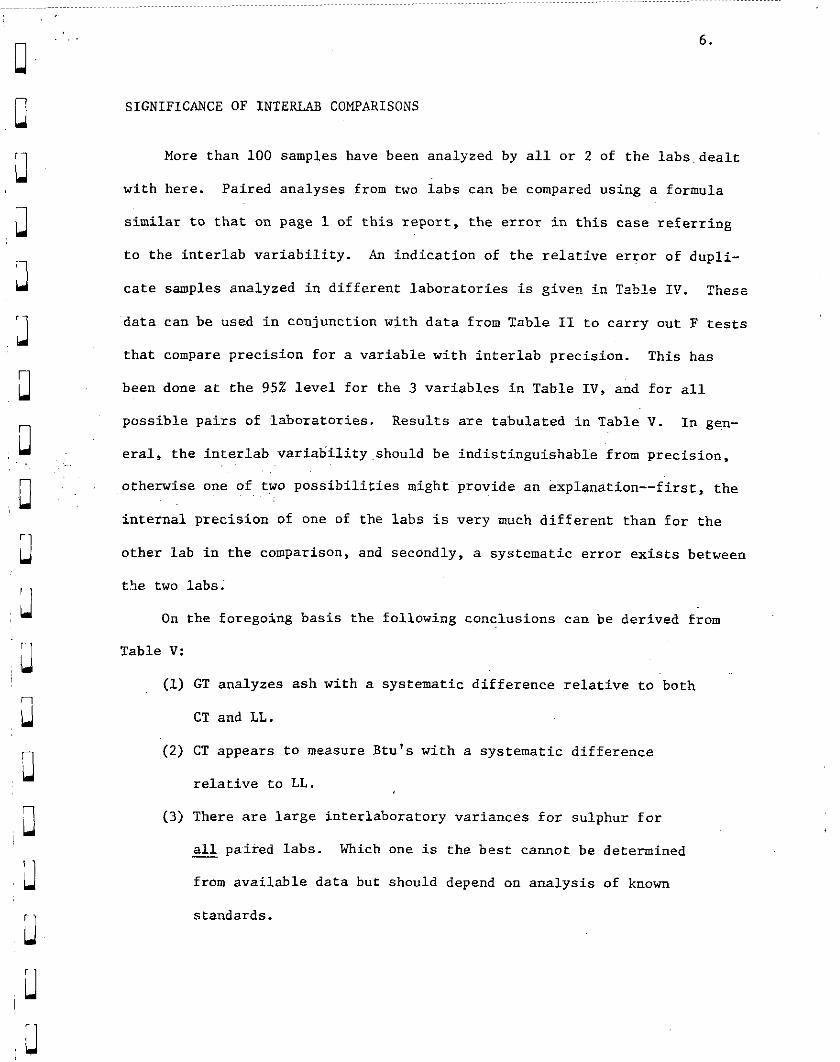
SIGNIFICANCE OF INTERLAB COMPARISONS
More than 100 samples have been analyzed by all or 2 of the labs.dealt
with here. Paired analyses from two labs can be compared using a formula
similar to that on page 1 of this report, the error in this case referring
to the interlab variability. An indication of the relative error of dupli-
cate samples analyzed in different laboratories is given in Table IV. These
data can be used in conjunction with data from Table II to carry out F tests
that compare precision for a variable with interlab precision. This has
been done at the 95% level for the 3 variables in Table IV, and for all
possible pairs of laboratories. Results are tabulated in Table V. In gen-
eral, the interlab variability.should be indistinguishable from precision,
otherwise one of two possibilities might~provide an &xplanation--first, the
internal precision of one of the labs is very much different than for the
other lab in the comparison, and secondly, a systematic error exists between
the two labs.
On the foregoing basis the following conclusions can be derived from
Table V:
(1) GT analyzes ash with a systematic difference relative to both
CT and LL.
(2) CT appears to measure Btu's with a systematic difference
relative to LL.
(3) There are large interlaboratory variances for sulphur for
all paired labs. Which one is the best cannot be determined
from available data but should depend on analysis of known
standards.
7.
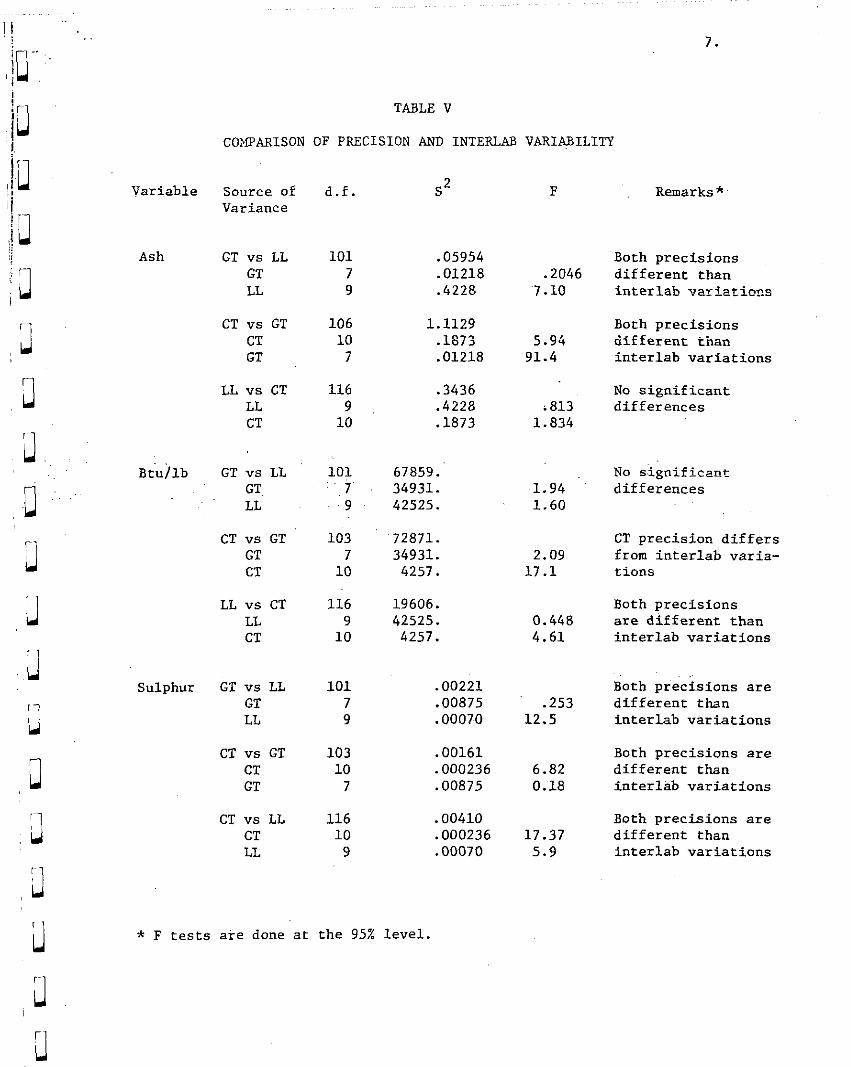
TABLE V
cOMFARISON OF PRECISION AND INTERLAB VARIABILITY
Variable Source of Variance
Ash GT vs LL GT LL
CT vs GT CT GT
LL vs CT LL CT
B&lb GT vs LL GT. LL
CT vs GT GT CT
LL vs CT LL CT
Sulphur GT vs LL GT LL
CT vs GT CT GT
CT vs LL CT LL
d.f. S2 F Remarks"
101 .05954 7 -01218 9 .4228
106 1.1129 10 .1873
7 .01218
116 .3436 9 .4228
10 .1873
101 67859. : ~,7' 34931.
.9 ~, 42525.
103 '72871. 7 34931.
10 4257.
116 19606. 9 42525.
10 4257.
101 .00221 7 .00875 9 .00070
103 .00161 10 .000236
7 .00875
116 .00410 10 .000236
9 .00070
* F tests a+ done at the 95% level.
.2046 ~7.10
5.94 91.4
;813 1.834
.1.94 1.60
2.09 17.1
0.448 4.61
.253 12.5
6.82 0.18
17.37 5.9
Both precisions different than interlab ~zaristiccs
Both precisions different than interlab variations
No significant differences
No significazzt differences
CT precision differs from interlab varia- tions
Both precisions are dlffesent than interlab variations
Both precisions are' different than interlab variations
Both precisions are different than interlab variations
Both precisions are different than interlab variations
r J
?a.
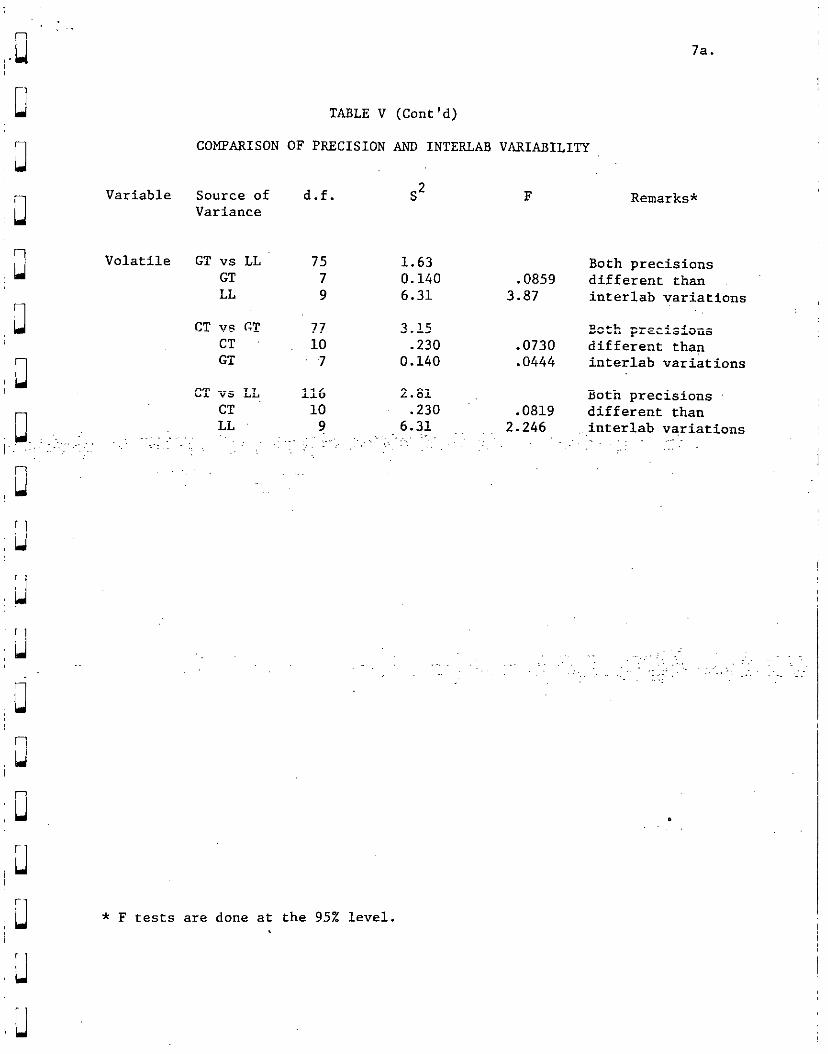
TABLE V (Cont'd)
COMPARISON OF PRECISION AND INTERLAB VARIABILITY
Variable Source of d.f. ValXi.EllbX?
Volatile GT vs LL 75 GT 7 LL 9
CT vs CT 77 CT 10 GT ~7
CT V6 LL 116 CT 10 LL 9
: : :-',
S2 F Remarks*
1.63 Both precisions 0.140 .0859 different than 6.31 3.87 interlab variations
3.15 PC3 ~zccf6ians .230 .0730 different than
0.140 .0444 interlab variations
2.8i Both precisions .230 .0819 different than
6.31 2.246 ~ interlab variations ., .
.
* F tests are done at the 95% level.
I 8.
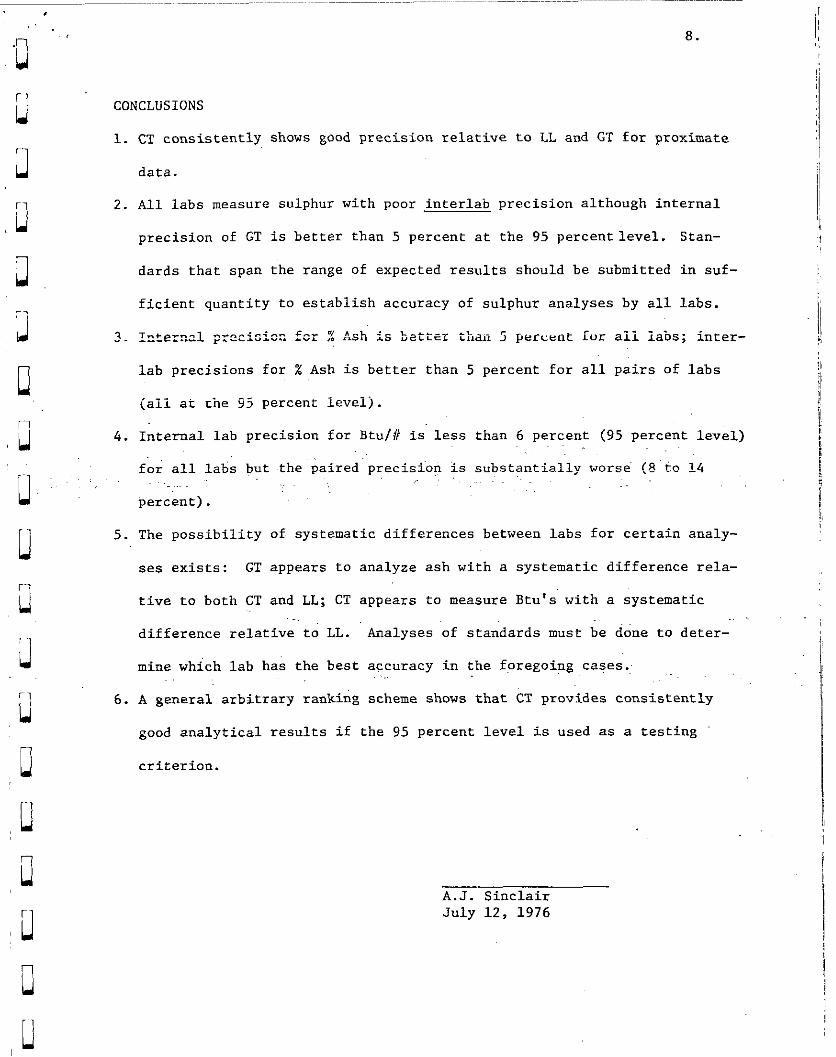
CONCLUSIONS
1. CT consistently shows good precision relative to LL and GT for proximate
data.
2. All labs measure sulphur with poor interlab precision although internal
precision of GT is better than 5 percent at the 95 percent level. Stan-
dards that span the range of expected results should be submitted in suf-
ficient quantity to establish accuracy of sulphur analyses by all labs.
3 . II1c-P'-"0 1 ;rxioicr: fcr X Ash is batter than 5 percent ior aii iabs; inter-
lab precisions for % Ash is better than 5 percent for all pairs of labs
(ali at the 95 percent ievelj.
4. I&rnal lab precision for Btu//i is'less than 6 percent (95 percent lev&)
for all labs but ~the paired'precisioq is substantially wors& <S'to 14 .,
percent).
5. The possibility of. systematic differences between labs for certain analy-
ses exists: GT appears to analyze ash with a systematic difference rela-
tive to both CT and LL; CT appears to measure Btu's with a systematic .
difference relative to LL. Analyses of standards must be done to deter-
mine which lab has the best accuracy in the fpregoing cakes: ,_ . .
6. A general~arbitrary ranking scheme shows that CT provides consistently
good analytical results if the 95 percent level is used as a testing
criterion.
A.J. Sinclair July 12, 1976
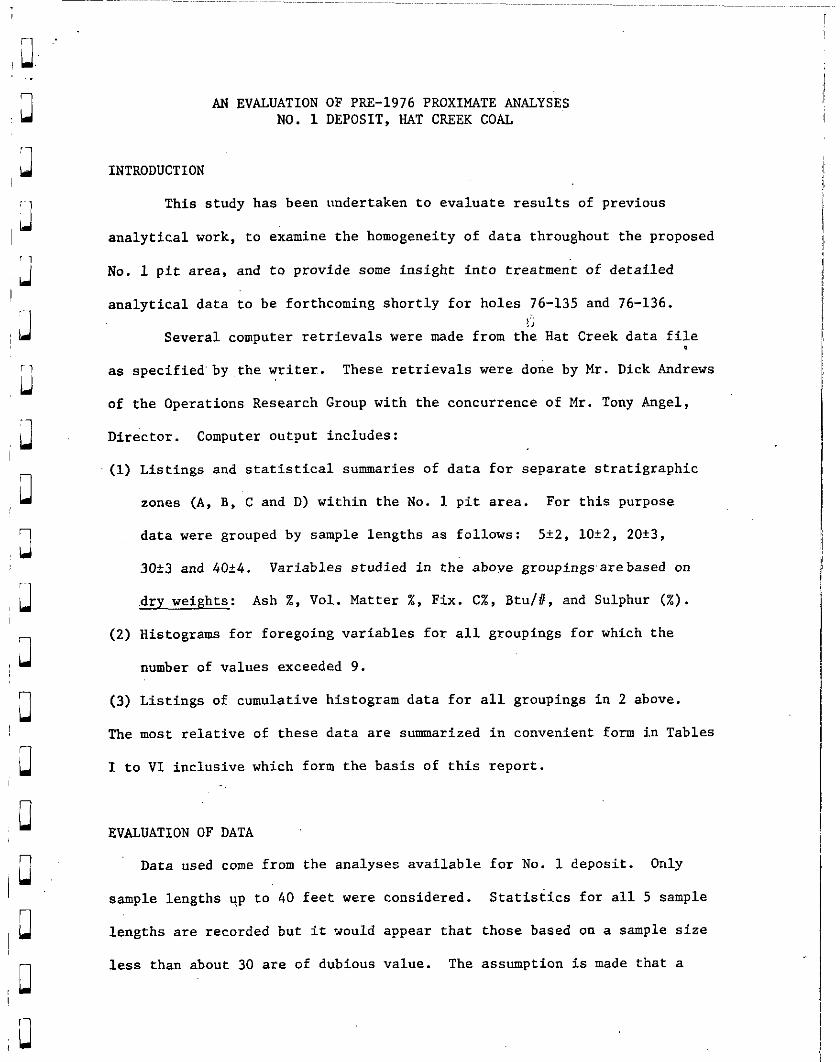
AN EVALUATION OF Pm-1976 PROXIMATE ANALYSES NO. 1 DEPOSIT, HAT CREEK COAL
INTRODUCTION
This study has been undertaken to evaluate results of previous
analytical work, to examine the homogeneity of data throughout the proposed
No. 1 pit area, and to provide some insight into treatment of detailed
analytical data to be forthcoming shortly for holes 76-135 and 76-136. !;
Several computer retrievals were made from the Hat Creek data file *
as specified'by.the writer. These retrievals were done by Mr. Dick Andrew
of the Operations Research Group with the concurrence of Mr. Tony Angel,
Director. Computer output includes:
(1) Listings and statistical summaries of data for separate stratigraphic
zones (A, B, C and D) within the No. 1 pit area. For this purpose
data were grouped by sample lengths as follows: 522, 1022, 20?3,
3023 and 4Oi4. Variables studied in the aboye groupingsarebased on
.dry weights: Ash %, Vol. Matter %, Fix. C%, Btu/#, and Sulphur (X).
(2) Histograms for foregoing variables for all groupings for which the
number of values exceeded 9.
(3) Listings of cumulative histogram data for all groupings in 2 above.
The most relative of these data are summarized in convenient form in Tables
I to VI inclusive which form the basis of this report.
EVALUATION OF DATA
Data used come from the analyses available for No. 1 deposit. Only
sample lengths up to 40 feet were considered. Statistics for all 5 sample
lengths are recorded but it would appear that those based on a sample size
less than about 30 are of dubious value. The assumption is made that a
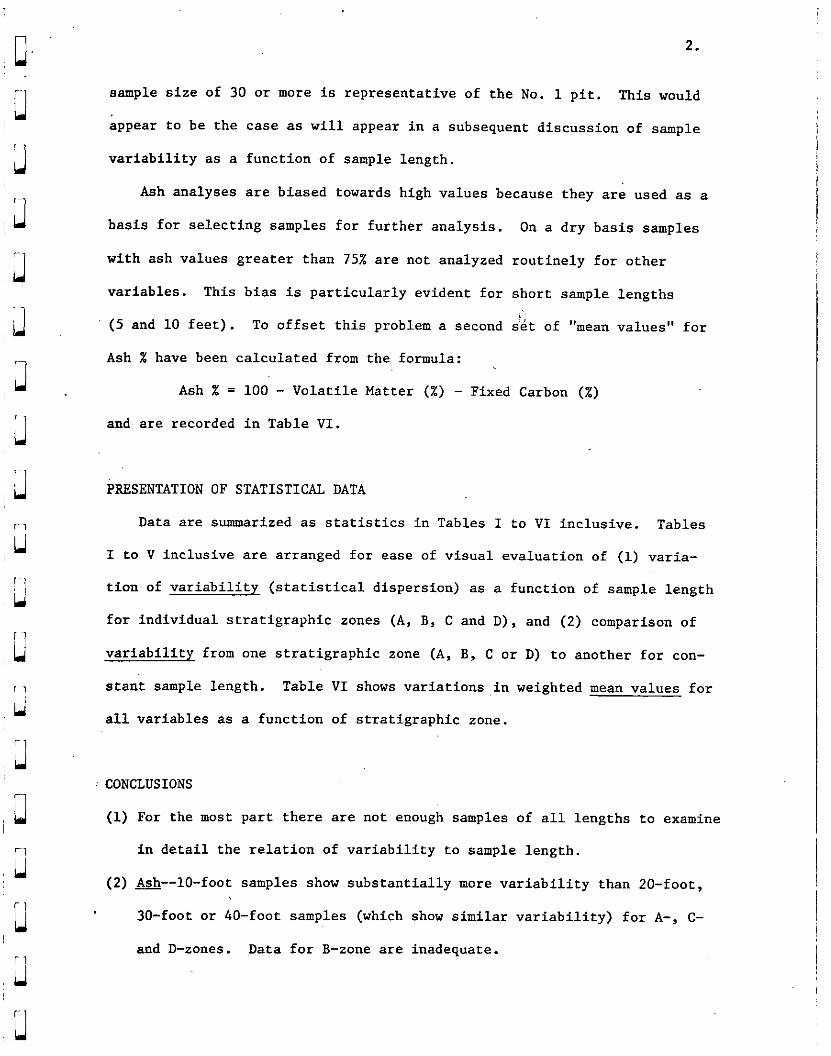
2.
sample size of 30 or more is representative of the No. 1 pit. This would
appear to be the case as will appear in a subsequent discussion of sample
variability as a function of sample length.
Ash analyses are biased towards high values because they are used as a
basis for selecting samples for further analysis. On a dry basis samples
with ash values greater than 75% are not analyzed routinely for other
variables. This bias is particularly evident for short sample lengths ,~',
(5 and 10 feet). To offset this problem a second &t of "mean values" for
Ash % have been calculated from the formula:
Ash % = 100 - Volatile Matter (X) - Fixed Carbon (%)
and are recorded in Table VI.
PRESENTATION OF STATISTICAL DATA
Data are summarized as statistics in Tables I to VI inclusive. Tables
I to V inclusive are arranged for ease of visual evaluation of (1) varia-
tion of variability (statistical dispersion) as a function of sample length
for individual stratigraphic zones (A, B, C and D), and (2) comparison of
variability from one stratigraphic zone (A, B, C or D) to another for con-
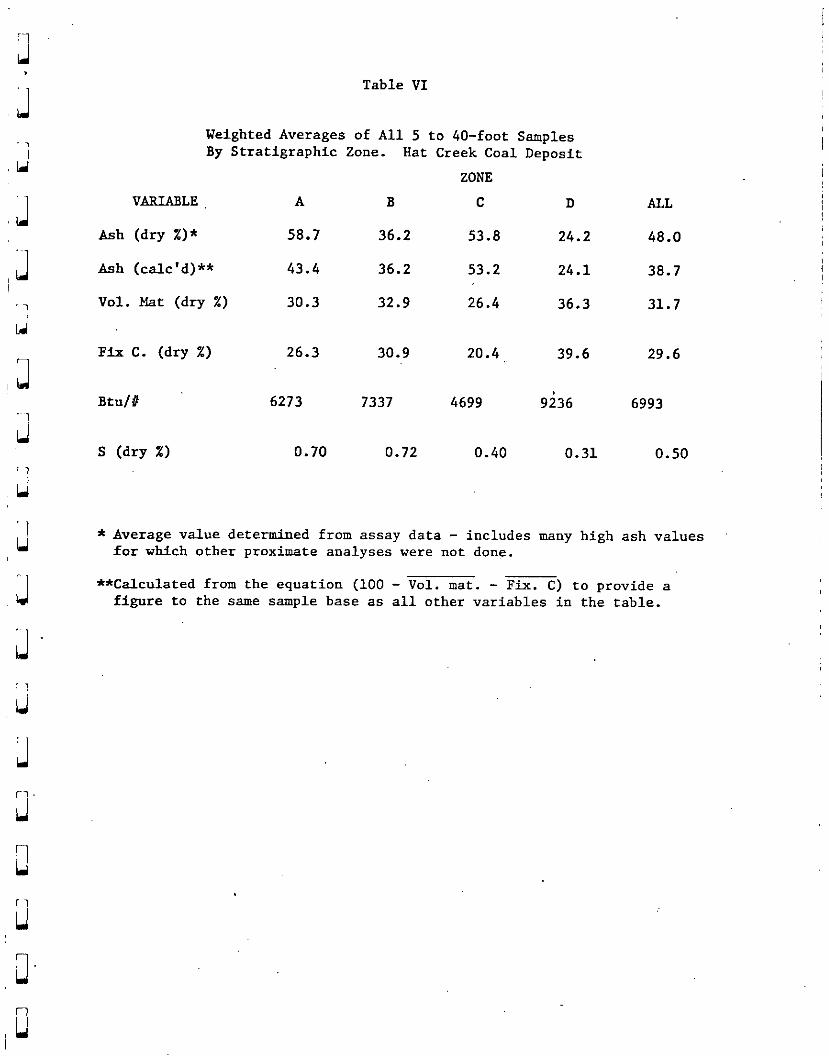
stant sample length. Table VI shows variations in weighted mean values for
all variables as a function of stratigraphic zone.
: CONCLUSIONS
(1) For the most part there are not enough samples of all lengths to examine
in detail the relation of variability to sample length.
(2) &--lo-foot samples show substantially more variability than 20-foot,
30-foot or ho-foot samples (which show similar variability) for A-, C-
and D-zones. Data for B-zone are inadequate.
3.
(3) Volatile Matter--A zone shows a regular decrease in variance with in-
crease in sample length. B-zone data are inadequate but the one
sample length (20 feet) with substantial values (n = 35) shows vari-
ability somewhat akin to D-zone data. C-zone data are inadequate but
20-foot and 30-foot samples show variability similar to A-zone. D-zone
d,ata for 20-, 30- and 40-foot samples show comparable variability.
Data for shorter samples are inadequate.
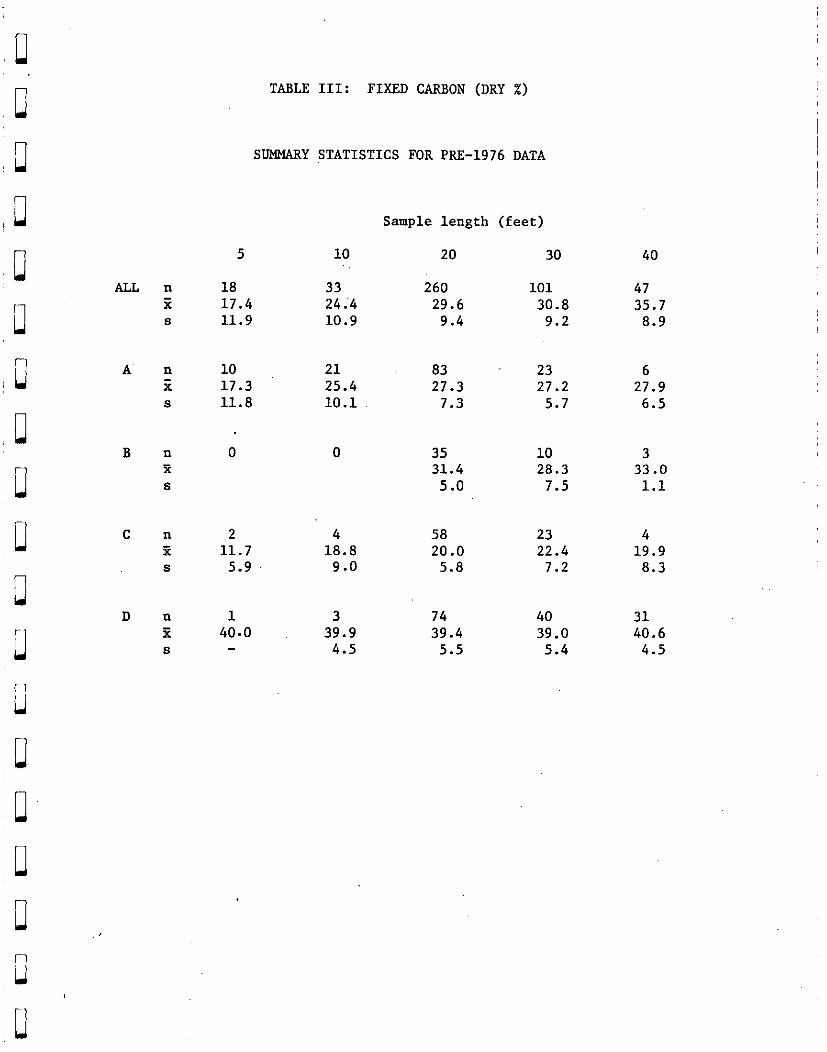
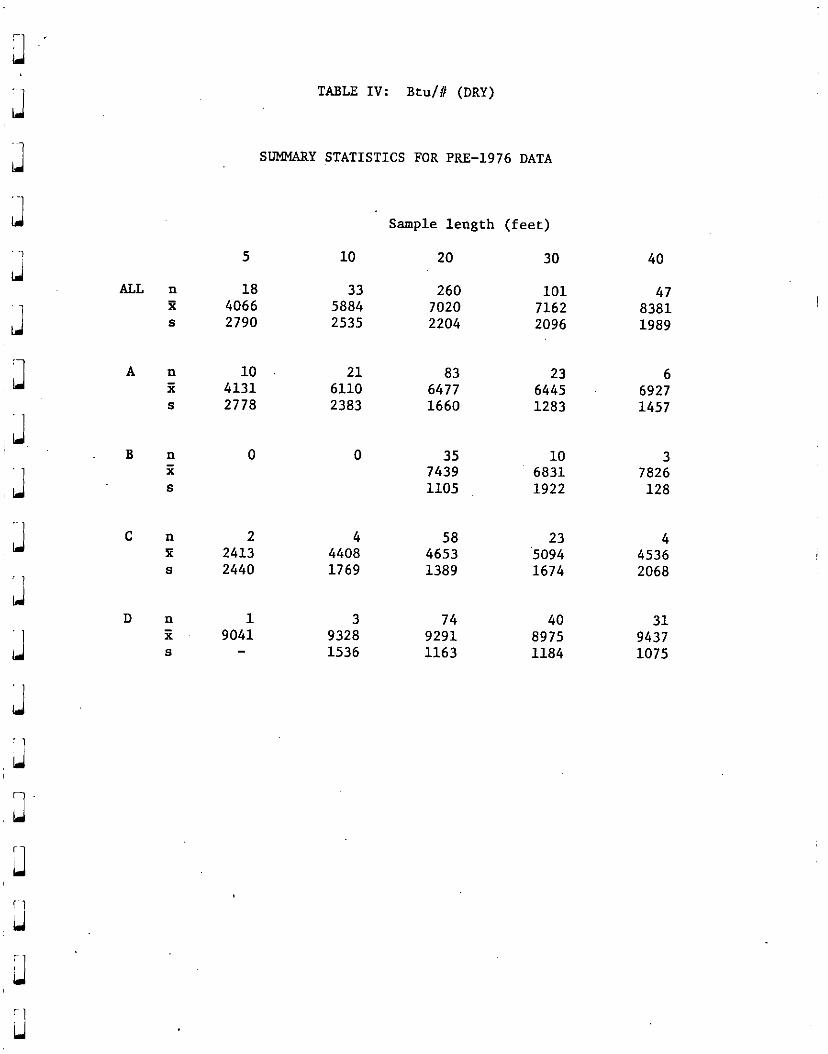
(4) Btu/#--A-zone data show fairly good decrease in%ariability with in-
crease in sample size. B-zone data are inadequate but 20-foot sample
lengths,have a variability comparable with D-zone. C-zone data are
~inadequate but variability is high, akin to A-zone as indicated by
sample data for lengths of 20 and 30 feet. D-zone data show similar
variability for 20-, 30- and 40-foot samples but data for smaller
sample lengths are inadequate.
(5) Sulphur--A-zone shows significantly lower variability for 20- and 30-
foot sample lengths than for lo-foot lengths. B-zone data are in-
adequate but variability is low for ZO-foot samples. C-zone sulphur
shows comparable high variability in 20-, 30- and 40-foot samples but
data for shorter sample lengths are inadequate. D-zone data show a
. regular decrease in variability for 20-, 30- and 40-foot samples. Data
for 5- and lo-foot samples are inadequate.
,.(6) Surrrmary by Zones: A-zone data show an evident decrease in variability
between lo- and 20-foot sample lengths. The data indicate little dif-
ference in variances for sample lengths of 20, 30 and 40 feet for all
variables although there is a slight tendancy for variance to decrease
with increasing sample length (as might be expected).
Little can be said regarding sample length in the B-zone because
!’ LJ
4.
r
Ll
,- Ll 3 J J
.J '1
u
r 11
ci
adequate data are available only for ZO-foot lengths. The statistics
for this length compare with equivalent data from the D-zone.
C-zone data are adequate only for 20- and 30-foot samples and vari-
ability of 20-foot samples is consistently higher than for 30-foot
samples for all variables.
D-zone has adequate data for 20-, 30- and 40-foot samples all of
which show comparable variances for Ash, V~olatile Matter,.Fixed Carbon
and Btu/#. Sulphur has a low variance but shows; an abrupt decrease
between 20- and 30-foot sample lengths.
(7) Available data suggest that fdr proximate data 20-, 30- and 40-foot
samples provide very comparable indications of variability; and, of
course, they are more-or-less comparable as an estimator of the mean.
Where adequate data exist there is an indication of slight decreases
in variances as sample lengths increase from 20 to 40 feet.
(8) Data are inadequate to evaluate the usefulness of 5- and lo-foot sample
lengths as indicators of short range variability.
(9) Evaluation of mean.va1ue.s (Table VI): Extreme differences between
means of all zones and the grand average for each of the variables is
apparent by examination of Table VI. Note, in particular, the follow-
ing:
1. Grand average values for any variable give little real indication
of what exists in individual zones.
2. Sulphur is noticeably much higher (nearly twice as high) in zones
A and B compared with zones C and D.
3. Zones C and D show greatest contrast for Btu/#, Fixed Carbon,
Volatile'Matter and Ash. Each of these variables except for
Volatile Matter differ by a factor of 2 between these two zones. ~
rl 5.
u. ,li
4. A and B zones have intermediate values for Btu/#, Volatile
Matter, Fixed Carbon and Ash,'and, in fact, the two zones are
,3 very similar with the proviso that zone A is systematically of
lower quality than zone B in all variables considered here.
,3
/ ,u .
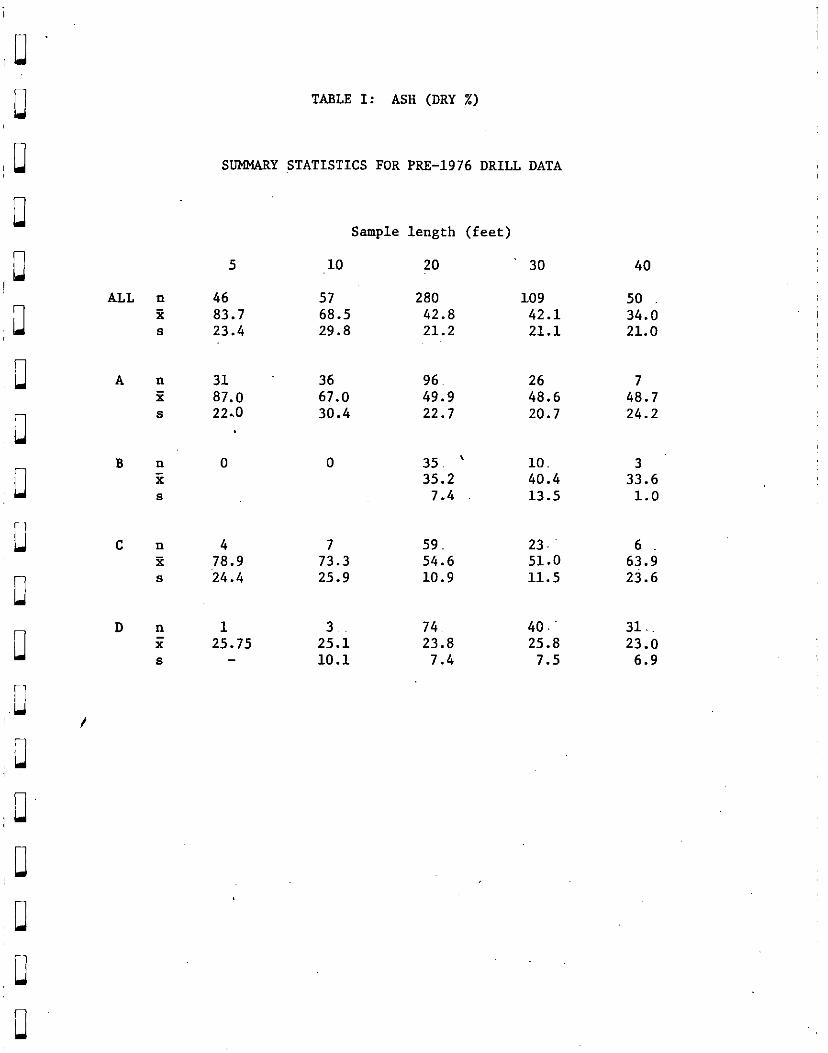
TABLE I: ASH (DRY x)
ALL n 46 57 280 109 z 03.7 68.5 42.8 42.1 s 23.4 29.8 21.2 21.1
A n z s
B n 2 8
c n 4 7 59. 23: 6. B 78.9 73.3 54.6 51.0 63.9 8 24.4 25.9 10.9 11.5 23.6
D n 1 3~. 74. 40.. 31.. x 25.75 25.1 23.8 25.8 23.0 8 10.1 7.4 7.5 6.9
SUMMARY STATISTICS FOR Pm-1976 DRILL DATA
Sample length (feet)
5 10 20 30
31 36 96. 26 7 87.0 67.0 49.9 48.6 48.7 22-O 30.4 22.7 20.7 24.2
0 0 35. ' 10. 3 35.2 40.4 33.6 7.4 13.5 1.0
40
50 34.0 21.0
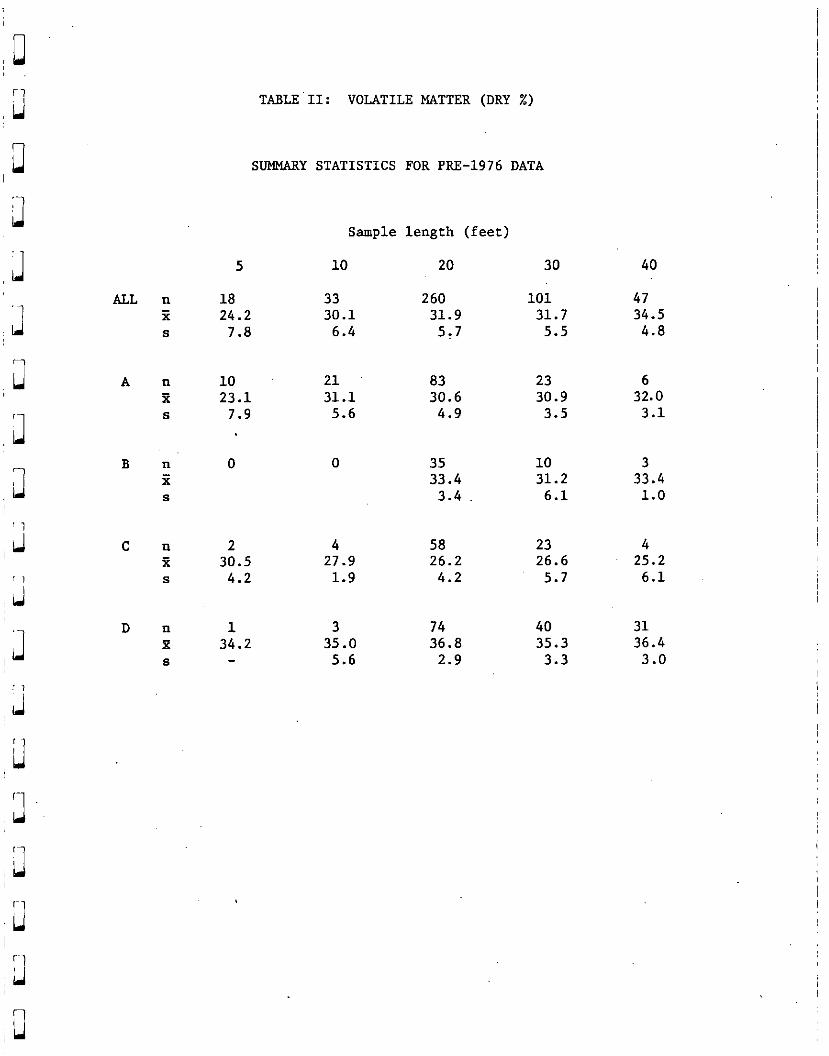
;;j TABLE II: VOLATILE MATTER (DRY Z)
il SUMNARY STATISTICS FOR PRE-1976 DATA
J II II z 3 J
5
ALL II 18 2 24.2 s 7.8
A n 10 21 83 23 6 E 23.1 31.1 30.6 30.9 32.0 s 7.9 5.6 4.9 3.5 3.1
B n 0 0 35 10 3 it 33.4 31.2 33.4 .s 3.4 6.1 1.0
c n 2 4 58 23 4 z 30.5 27.9 26.2 26.6 25.2 s 4.2 1.9 4.2 5.7 6.1
D n 1 3 74 40 31 x 34.2 35.0 36.8 35.3 36.4 8 5.6 2.9 3.3 3.0
Sample length (feet)
10 20
33 260 30.1 31.9
6.4 5:7
30 40
101 47 31.7 34.5
5.5 4.8
.u 4 !U J u ALL ,u Jl A'
u B
,u
,u C
u D
r
1;
r 1 Ll
,u
:u,
;u
0
:I]
II
TABLE III: FIXED CARBON (DRY I)
SUMMARY STATISTICS FOR PRE-1976 DATA
5 10 20 30
18 33 260 101 17.4 24.4 29.6 30.8 11.9 10.9 9.4 9.2
10 21 83 ,, 23 6 17.3 25.4 27.3 27.2 27.9 11.8 10.1 7.3 5.7 6.5
0 0
2 4 58 23 4 11.7 18.8 20.0 22.4 19.9 5.9 9.0 5.8 7.2 8.3
1 3 74 40 31 40.0 39.9 39.4 39.0 40.6
4.5 5.5 5.4 4.5
Sample length (feet)
35 10 3 31.4 28.3 33.0
5.0 7.5 1.1
40
47 35.7
8.9
ALL
A
B
C
D
n 18 33 B 4066 5884 s 2790 2535
n ji 8
n 2 4 58 23 4 x 2413 4408 4653 5094 4536 s 2440 1769 1389 1674 2068
TABLE IV: stu/# (DRY)
SUMMARY STATISTICS FOR PRE-1976 DATA
5
10 21 a3 23 6 4131 6110 6477 6445 6927 2778 2383 1660 1283 1457
0
1 9041
10
0
3 74 40 31 9328 9291 a975 9437 1536 1163 1184 1075
Sample length (feet)
20 30
260 101 7020 7162 2204 2096
35 10 7439 6831 1105 1922
40
47 8381 1989
3 7826 128
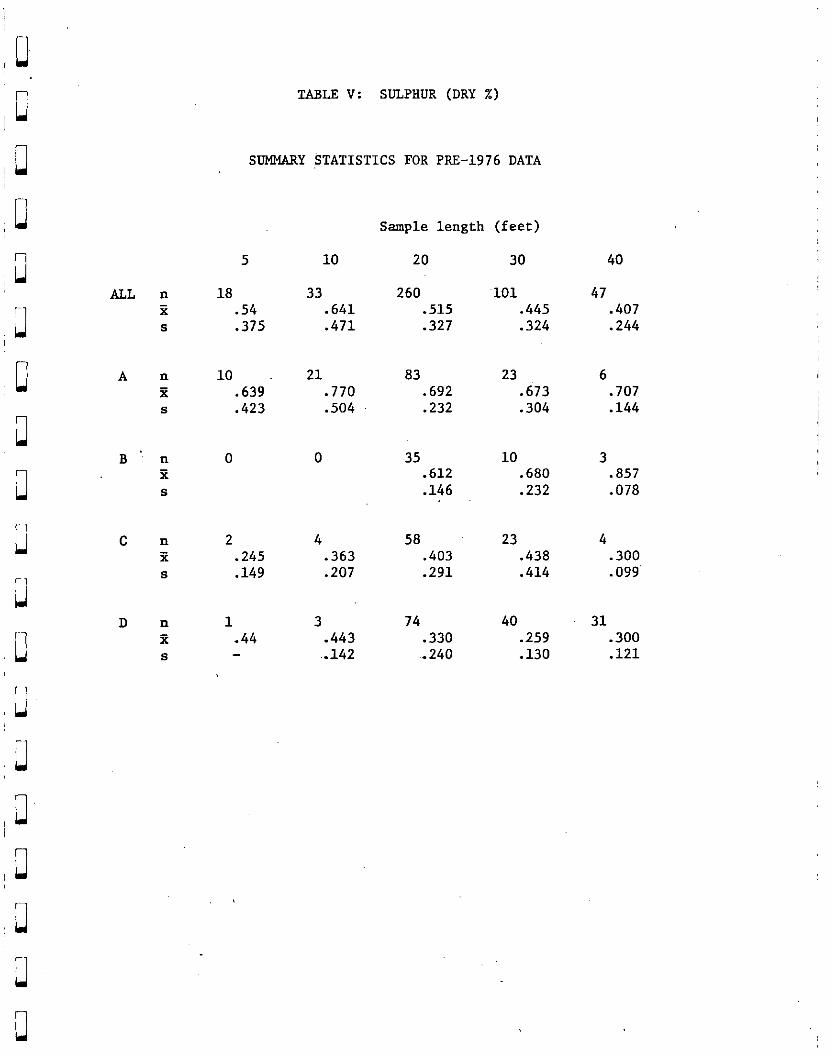
TABLE v: SDLPHUR (DRY x)
SUMMARY STATISTICS FOR PRE-1976 DATA
Sample length (feet)
5 10
18 33 .54 .641 .375 .471
20 30 40
260 101 47 .515 .445 .407 .327 .324 .244
10 21 83 23 6 .639 .770 .692 .673 .707 .423 .504 .232 .304 .I44
0 0 35 10 3 .612 .680 .857 .146 .232 .078
2 4 58 23 .245 .363 .403 .438 .149 .207 .291 .414
1 -44
3 .443 ..142
40 .259 .130
4 .300 .099
31 .300 .121
,3 J
Table VI
Weighted Averages of All 5 to 40-foot Samples By Stratigraphic Zone. Hat Creek Coal Deposit
VARIABLE,
Ash (dry %)*
Ash (calc'd)**
Vol. Mat (dry X)
A B
58.7 36.2
43.4 36.2
30.3 32.9
ZONE
C
53.8
53.2
26.4
D ALL
24.2 48.0
24.1 38.7
36.3 31.7
Fix C. (dry %) 26.3 30.9 20.4,. 39.6 29.6
Btul# 6273 7337 4699 9i36 6993
0.70 0.72 0.40 0.31 0.50
* Average value determined from assay data - includes many high ash values for which other proximate analyses were not done.
**Calculated from the equation (100 - Vol. mat. - Fix. C) to provide a figure to the same sample base as all other variables in the table.
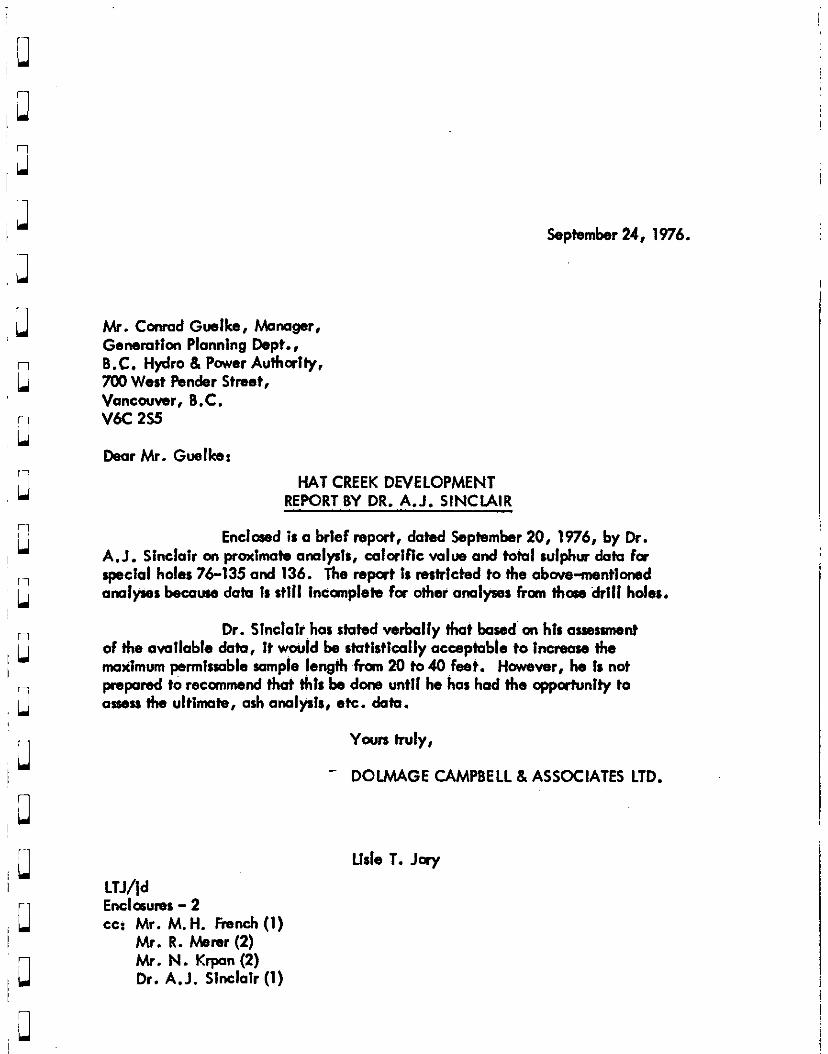
September 24,1976.
Mr. Conrad Guelhe, hkmagar, Genemtfon Planning Dept., B.C. Hydra 3, Power Authalty, 700 West Psnder Street, Vancouwr, B.C. v6c 2S!i
Dear Mr. Guelke:
HAT CREEK DEVELOPMENT REPORT BY DR. A.J. SINCLAIR
Enclosed is a brief report, dated September 20, 1976, by Dr. A.J. Sinclair on proxtmah amlyslt, calorifk value and total sulphw data for special holes 76-135 and 136. The repat 1s restricted to the obove-mentlonad analyses because data is still Incomplete for other analyses from thm .drill holes.
Dr. Slnclafr,hos stated verbally that based’ on his assessment of the avallablo data, It w,onld be statistically acceptable to Increase the madmum pennfsmble sample length from 20 to 40 feet. Hover, he is not propored to recamnend that thtr be done until he has had the opportunlty to assess the ultimate, ash analysis, etc. data.
Yom truly,
- DOLMAGE CAMPBELL 8, ASSOCIATES LTD.
Llsls T. Jay
LTJ/jd En&surer - 2 WI Mr. M. H. French (1)
Mr. R. Menu (2) Mr. N. Krpon (2) Dr. A.J. Sinclair (1)
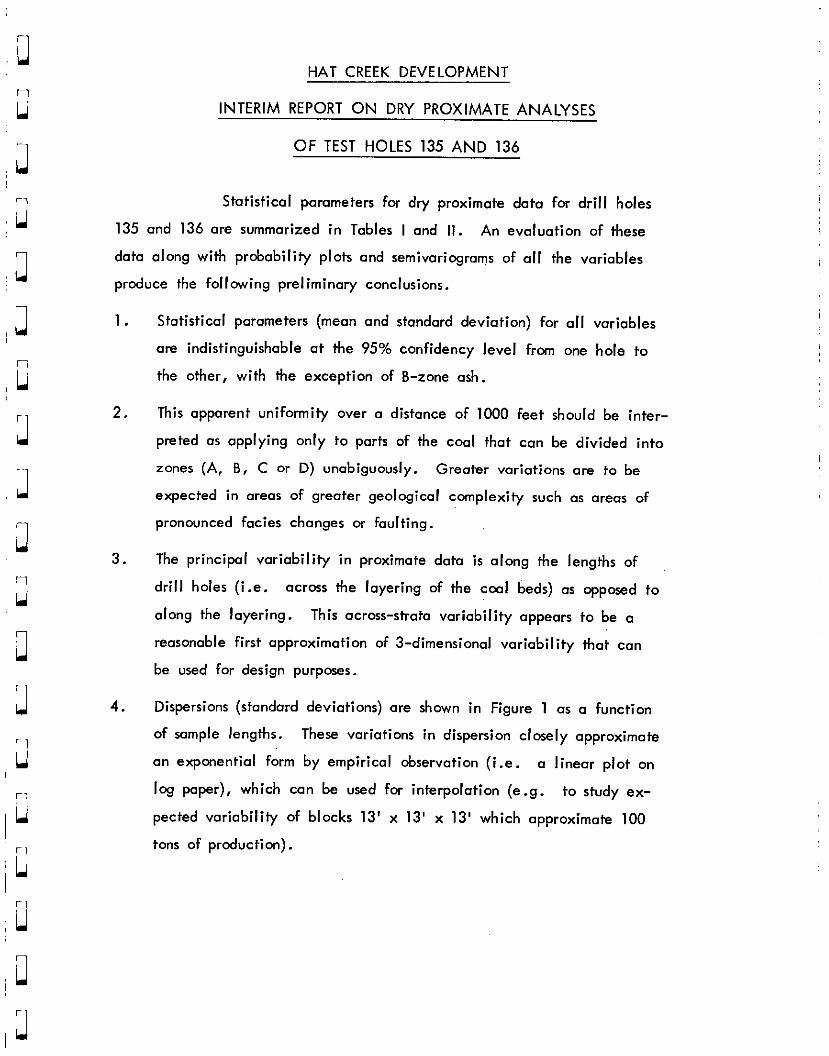
HAT CREEK DEVELOPMENT
INTERIM REPORT ON DRY PROXIMATE ANALYSES
OF TEST HOLES 135 AND 136
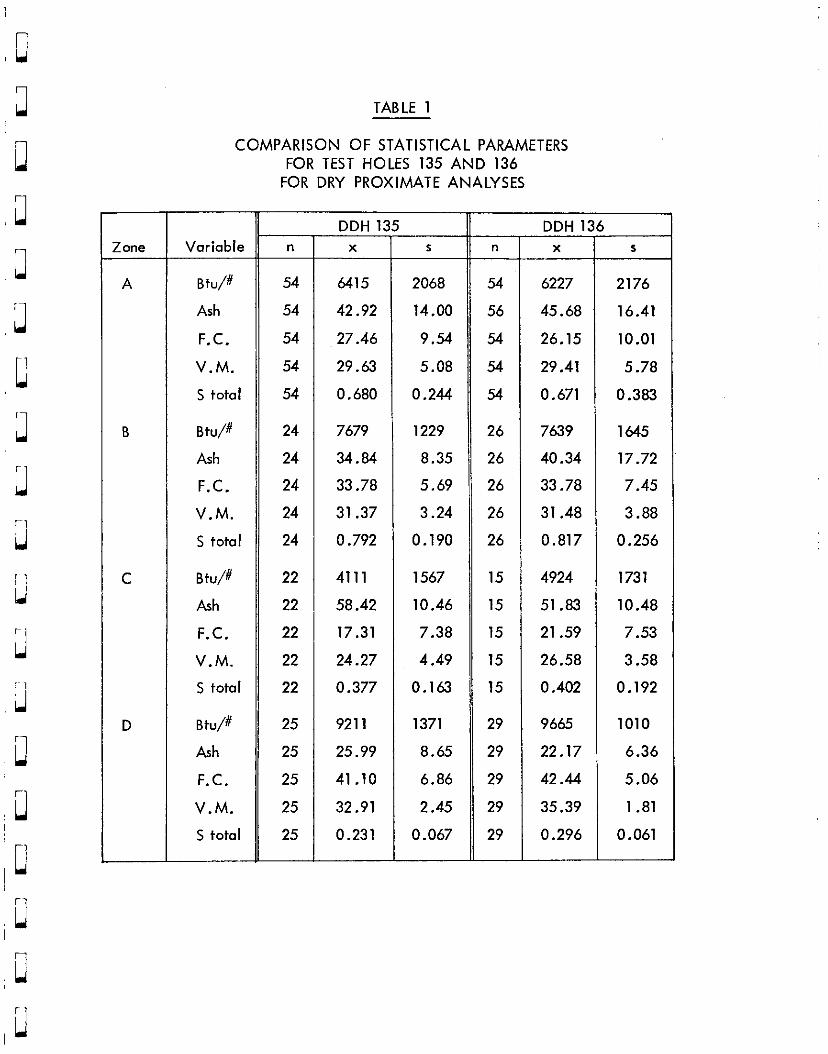
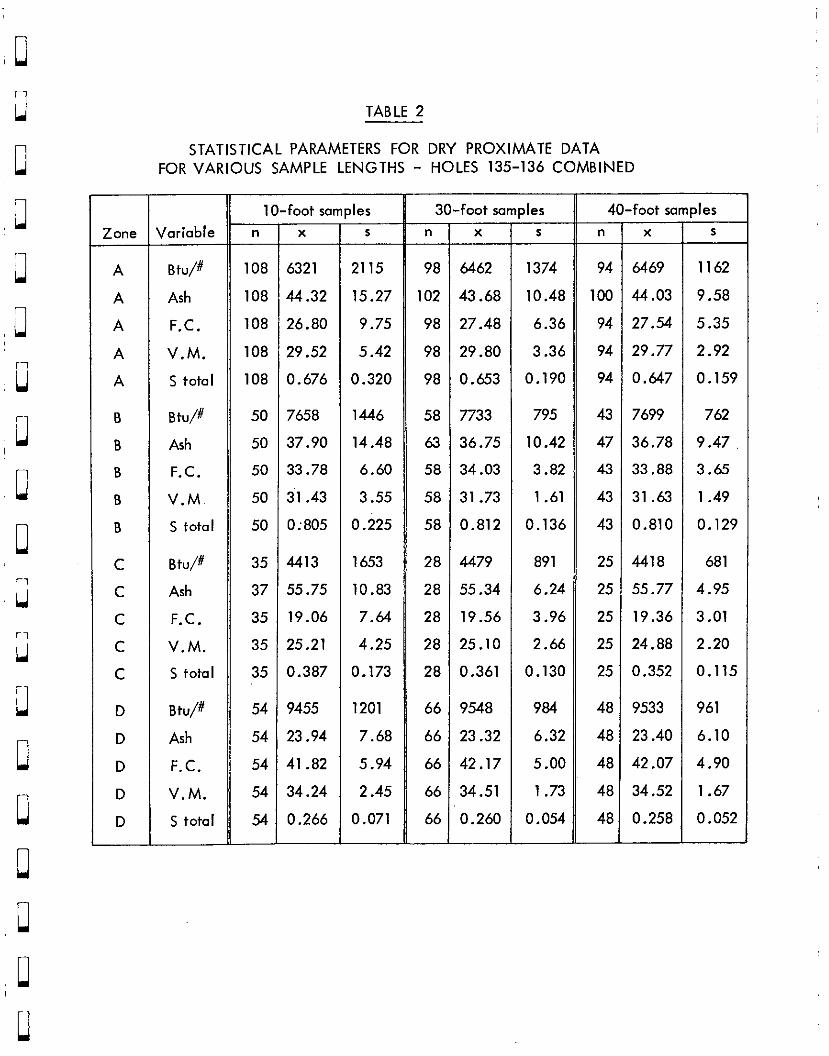
Statistical parameters for dry proximate data for drill holes
135 and 136 are summarized in Tables I and II. An evaluation of these
data along with probability plots and semivaricgrams of all the variables
produce the following preliminary conclusions.
1. Statistical parameters (mean and standard deviation) for all variables
are indistinguishable at the 95% confidency level from one hole to
the other, with the exception of B-zone ash.
2. This apparent uniformity over a distance of 1000 feet should be inter-
preted as applying only to parts of the coal that can be divided into
zones (A, B, C or D) unabiguously. Greater variations are to be
expected in areas of greater geological complexity such as areas of
pronounced facies changes cr faulting.
3. The principal variability in proximate data is along the lengths of
drill holes (i.e. across the layering of the cwl beds) as Opposed to
along the layering. This across-strata variability appears to be a
reasonable first approximation of 3-dimensional variability that can
be used for design purposes.
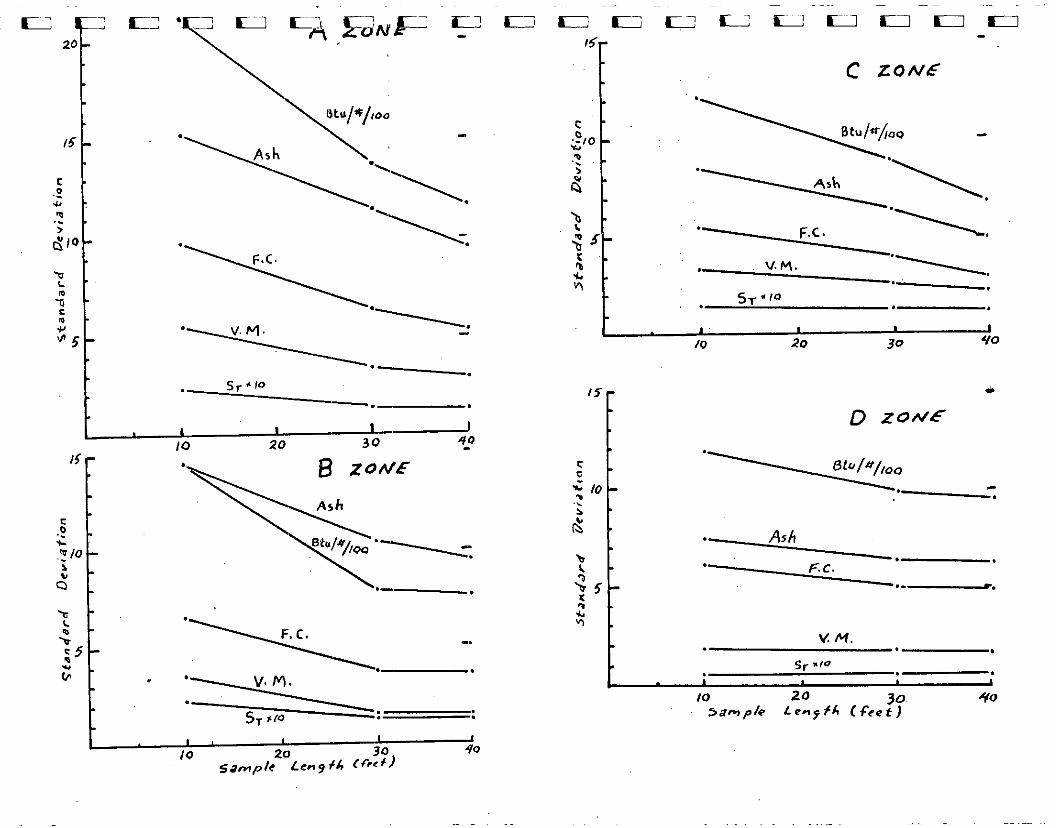
4. Dispersions (standard deviations) are shown in Figure 1 as a function
of sample lengths. These variations in dispersion closely approximate
an exponential form by empirical observation (i.e. a linear plot on
log paper), which can be used for interpolation (e.g. to study ex-
pected variability of blocks 13’ x 13’ x 13’ which approximate 100
tons of production).
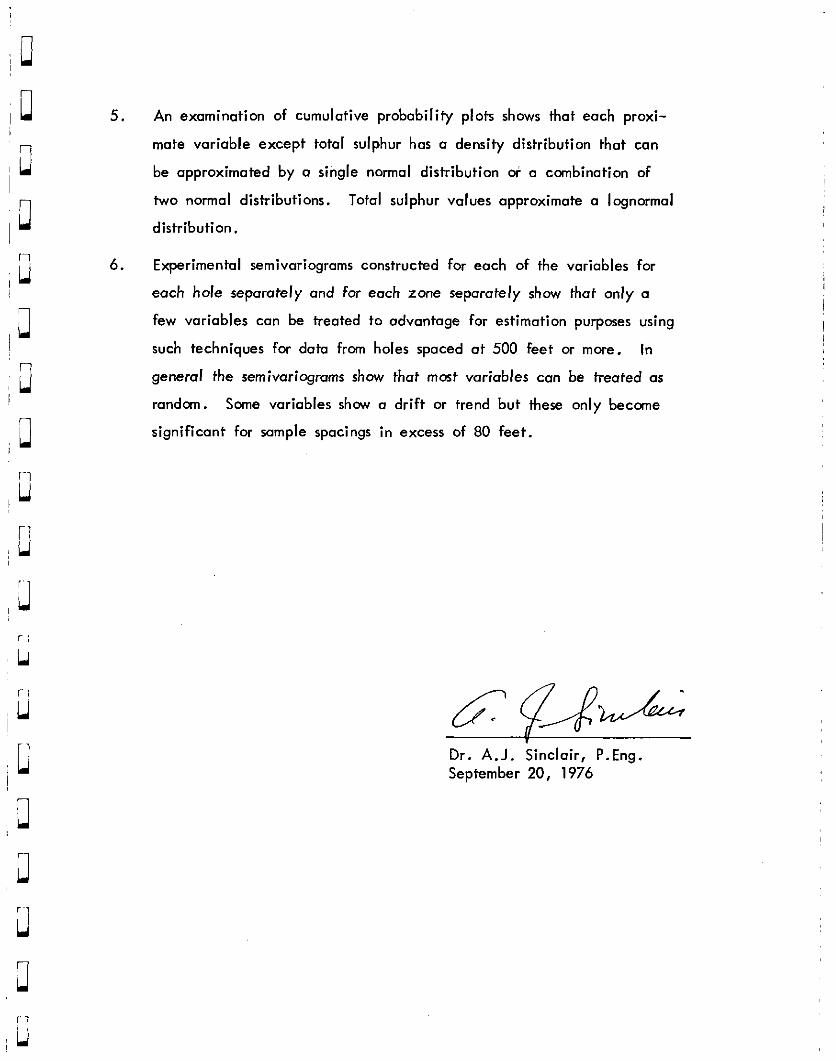
5. An examination of cumulative probability plots shows that each proxi-
mate variable except total sulphur has a density distribution that can
be approximated by a single normal distribution M: a combination of
two normal distributions. Total sulphur values approximate a lognormal
distribution.
6. Experimental semivariograms constructed for each of the variables for
each hole separately and for each zone separately show that only a
few variables can be treated to advantage for estimation purposes using
such techniques for data from holes spaced at 500 feet or mere. In
general the semivariograms show that most variables can be treated as
randcm. Some variables show a drift or trend but these only become
significant for sample spacings in excess of 80 feet.
Dr. A.J. Sinclair, P.Eng. September 20, 1976
Zone
A
B
C
D
TABLE 1
COMPARISON OF STATISTICAL PARAMETERS FOR TEST HOLES 135 AND 136
FOR DRY PROXIMATE ANALYSES
Variable ”
DDH 1: x 5 f ”
DDH 1: x 5
Btu/# 54 6415 2068 54 6227 2176
Ash 54 42.92 14.00 56 45.68 16.41
F.C. 54 ,27.46 9.54 54 26.15 10.01
V.M. 54 29.63 5.08 54 29.41 5.78
5 total 54 0.680 0.244 54 0.671 0.383
Btu/# 24 7679 1229 26 7639 1645
Ash 24 34.84 8.35 26 40.34 17.72
F.C. 24 33.78 5.69 26 33.78 7.45
V.M. 24 31.37 3.24 26 31.48 3.88
5 total 24 0.792 0.190 26 0.817 0.256
Btu/# 22 4111 1567 15 4924 1731
Ash 22 58.42 10.46 15 51.83 10.48
F.C. 22 17.31 7.38 15 21.59 7.53
V.M. 22 24.27 4.49 15 26.58 3.58
s total 22 0.377 0.163 15 0.402 0.192
Btu/#
Ash
F.C.
V.M.
s total
25 9211 1371 29 9665 1010
25 25.99 8.65 29 22.17 6.36
25 41 .lO 6.86 29 42 A.4 5.06
25 32.91 2.45 29 35.39 1 .81
25 0.231 0.067 29 0.296 0.061
Zone
A
A
A
A
A
6
B
B
B
B
C
C
C
C
C
D
D
D
D
D
1 O-foot sa mp
” x
108
108
108
108
108
50
50
50
50
50
35
37
35
35
35
54
54
54
54
54
6321
44.32
26.80
29.52
0.676
7658
37.90
33.78
31 .43
0~805
4413
55.75
19.06
25.21
0.387
9455
23.94
41 .82
34.24
0.266
2115
15.27
9.75
5.42
0.320
1446
14.48
6.60
3.55
0.225
1653
10.83
7.64
4.25
0.173
1201
7.68
5.94
2.45
0.071
”
98
102
98
98
98
58
63
58
58
58
28
28
28
28
28
66
66
66
66
66
TABLE 2
STATISTICAL PARAMETERS FOR DRY PROXIMATE DATA FOR VARIOUS SAMPLE LENGTHS - HOLES 135-136 COMBINED
loriable x
h
S ” x
Btu/#
Ash
F.C.
V.M.
s total
6462
43.68
27.48
29.80
0.653
1374
10.48
6.36
3.36
0.190
94
100
94
94
94
6469
44.03
27.54
29.77
0.647
Btu/#
Ash
F.C.
V.M~
s total
7733
36.75
34.03
31.73
0.812
795
10.42
3.82
1 .61
0.136
43
47
43
43
43
7699
36.78
33.88
31 .a
0.810
Btu/#
Ash
F.C.
V.M.
s total
4479
55.34
19.56
25.10
0.361
891
6.24
3.96
2.66
0.130
25
25
25
25
25
4418
55.77
19.36
24.88
0.352
Btu/#
Ash
F.C.
V.M.
s total
9548
23.32
42.17
34.51
0.260
984
6.32
5.00
1 .73
0.054
48
48
48
4%
4%
9533
23.40
42.07
34.52
0.258
des
S
1162
9.58
5.35
2.92
0.159
762
9.47.
3.65
1 .49
0.129
681
4.95
3.01
2.20
0.115
961
6.10
4.90
1 .67
0.052
. ST’10 -. .
t 1 I I I
10 20 30 4,o
‘--.
‘G - ,‘ - > :” ;;; - . ’
. : :
I5 i D ZONE
IO 24 30, 40 Sample Le.ryfX (feet)