a report on assembling a geophysical database for
TRANSCRIPT

A REPORT ON ASSEMBLING A GEOPHYSICAL DATABASE FOR KIMBERLITE EXPLORATION CENTRED ON THE MERLIN AND ABNER
KIMBERLITE FIELDS IN THE NORTHERN TERRITORY AND THE SELECTION OF POTENTIAL KIMBERLITE RELATED GEOPHYSICAL
ANOMALIES
Undertaken on behalf of Legend International Holdings Inc
R.K.Jones
Geophysical Consultant September 2009

2
Executive Summary Legend International Holdings Inc is currently carrying out a regional exploration programme for kimberlites in an area encompassing both the Merlin kimberlite field and those kimberlites which occur on the Abner Range. The company holds extensive tenement areas both in its own right and through joint venture agreements As part of this re-assessment of the potential of this area for diamondiferous kimberlites Legend has conducted detailed proprietary airborne geophysical surveys and assembled semi regional survey data and historical company survey data which is available through NTGS. One of the main objectives of this study has been to merge these datasets wherever possible into a coherent database against which heavy mineral indicator results can be assessed in terms of likely kimberlite sources evident in the geophysical data. The project has been broken down into two essential datasets consisting of Legend’s proprietary data and those which are available in the public domain. The proprietary data is in the form of detailed surveys acquired along flight lines spaced 100 metres apart whereas the public domain data consists of more widely spaced flight line data with flight line spacing ranging between 200 and 400 metres. Both datasets have been re-processed to some degree to produce coherently merged databases. Much of the older company data was acquired in the early 1980s with visual navigation methods when imaging of data was in its infancy and has required a significant amount of re-processing. Following the merging of both the proprietary and publicly available surveys the data has been analyzed to locate discrete anomalies that may reflect kimberlite targets. It must be stressed that the assessment of the geophysical data is based purely on the assembled geophysical data. Google and publicly available Landsat imagery has been sourced to assist with the selection of kimberlite targets along with SRTM, radiometric and bouguer gravity data. In the Glyde North project area which lies immediately south of the Merlin kimberlites a limited number of targets (7) have been identified which will need to be assessed in relation to the results of heavy mineral indicator sampling result acquired in this area. Previous discoveries of kimberlites in the Merlin and Abner areas have resulted from the joint application of heavy mineral sampling and geophysical methods. Based purely on the observed geophysical responses none of the targets identified in the Glyde North area fall into the category of high priority anomalies but considering the protracted nature of the discovery of the Abner kimberlites following the initial discovery of anomalous kimberlitic chromites it is recommended that the anomalies be followed up on the ground and by reference to the indicator database.

3
The regional bouguer gravity data indicates the presence of a significant density contrast along a NNE trending line on which the Merlin and E.Mu pipes are located. This sharp gradient in the bouguer field can be traced southwards into the Glyde North Project area and applying a simplistic spatial relationship such as is seen at Merlin the eastern half of EL 23121 may be considered the most prospective. Based on other simple spatial observations derived from the re-processed open file data the north east and south west corners of the EL may be of most interest. It must be stressed that these observations are based purely on a preliminary assessment of the geophysical data and should be treated accordingly. In the Foelsche Project area which lies to the south east of Merlin merging of EM data sets has produced an image which allows for continuity in the interpreted geology. The merged EM data should only be assessed qualitatively and any quantitative analysis should be undertaken on the original data. The geology of the Foelsche project area provides a marked contrast in the geophysical responses within the project area. Bukalara sandstones are predominantly resistive and essentially non magnetic whereas the outcropping Proterozoic sediments are in places both highly conductive and magnetic. In areas where the host rock is highly conductive it is probable that any intrusive kimberlite may form a resistor rather than the conductor as is observed at Merlin. Eight target anomalies have been identified within the Foelsche project area including anomalies within the Bukalara along the northern boundary of the EL which on geophysical grounds is considered to be an area of interest. As in the Glyde North area prioritizing these anomalies is best done in relation to heavy mineral indicator databases. Within the broader project area which includes the Abner Range where there is no detailed proprietary data available re-processing and merging of the NTGS and open file data has produced both magnetic and radiometric datasets against which positive indicator results can be tested. A significant amount of structural information is also evident in the assembled data. A total of 45 anomalies have been selected from the re-processed and merged geophysical datasets which are consistent with possible kimberlite targets. A number of these anomalies occur within the Abner Range where Legend has a significant tenement holding. Prioritizing of these anomalies should be undertaken in relation to the regional results of indicator sampling. It must be borne in mind that this anomaly selection process is based on widely spaced data and in the case of the historical company surveys data that was acquired some 25 years or more ago prior to the introduction of GPS positioning and digital technology. This point should be borne in mind during the field checking process as there might be slight positional errors due to visual navigation techniques and a sufficiently broad area should be considered to fully assess the anomalies. In should also be borne in mind that in relatively widely spaced survey data the recorded magnetic response may not fully reflect the true response of the kimberlite.

4
These anomalies have been screened against Google and Landsat imagery to eliminate cultural anomalies wherever possible. The project has assembled functional databases which will provide useful sources of reference as the re-assessment of the area for diamondiferous kimberlites progresses. A separate report will be submitted in relation to the production of CDI s from the HEM surveys in the Foelsche Project Area.

5
Contents Executive Summary Contents 5 1. Project Description 8 1.1 Introduction 8
1.2 The Scope of the Project 8 1.3 Data provided by Legend 9 1.4 Historical Company Survey Data 10
1.5 Additional Datasets referenced during the project 10 1.6 Data formats, datums and projections 13 2. Brief history of the successful application of geophysics at Merlin 15 3. Expected geophysical response of kimberlite in the project area 18 4. Discussion of Legend’s Proprietary Data 20
4.1 Description of the data 20 4.2 Discussion of the Foelsche Project area 21 4.2.1 Introduction 21
4.2.2 Brief Description of Geophysical survey Data and 21 procedures that have been utilized to merge the data.
4.2.3 Target Selection 28 4.2.4 Recommendations 4.2.5 ArcView Compatible Files of processed data
4.3 Glyde North Area 31 4.3.1 Introduction 31
4.3.2 Brief Description of Geophysical survey Data and 32 procedures that have been utilized to merge the data.
4.3.3 Target Selection 34 5. Regional Geophysical Database 37 5.1 NTGS Data 37 5.2 Open File Company Data 40 5.3 Comparing NTGS AND Historical Company Data 42 5.4 Target Selection Process 44 5.4.1 Automated Anomaly Selection Methods 45 5.5 Anomaly Selection 46 5.5.1 Abner Range 49 5.6 Recommendations 54 List of Text Figures Figure 1.1- showing the location of the project area 9 Figure 1.2- Location of Proprietary and NTGS Data 10 Figure 1.3-Location of Open File Company surveys 12

6
Figure 1.4- SRTM Digital Terrain Image –Project Area 13 Figure 1.5- Bouguer Gravity Image – Project Area 14 Figure 2.1 –Geophysical Response of Excalibur Kimberlite 15 Figure 2.2- Airborne and Ground Geophysical Response E.Mu kimberlite 16 Figure 2.3- Drill Section across Palomides-Sacramore kimberlites 17 Figure 3.1- Idealized magnetic response of kimberlite 18 Figure 3.2- Aeromagnetic profile across Ector kimberlite 19 Figure 3.3- Aeromagnetic profile across E.Mu kimberlites 20 Figure 4.1- RTP TMI Image merged Foelsche HEM surveys 23 Figure 4.2- Merged 8200Hz Resolve, 6000Hz Geotech HEM surveys 24 Figure 4.3- Ternary RGB Image Hummingbird apparent resistivities 25 Figure 4.4- Ternary RGB Image RESOLVE apparent resistivities 26 Figure 4.5- Ternary RGB K_Th_U Image Foelsche Area 27 Figure 4.6- Screen capture of anomaly selection process 29 Figure 4.7- Location of selected targets –Foelsche Area 30 Figure 4.8- Proximity of Glyde North Area to Merlin Google Image 32 Figure 4.9- Relationship of magnetic anomalies to drainage-Glyde North 33 Figure 4.10- Calculated VD1 with selected anomalies superimposed 34 Figure 4.11- Anomaly GN_KJ1 35 Figure 4.12- Regional Bouguer Gradient Merlin Area 36 Figure 5.1- Merged NTGS TMI Image-Project Area 38 Figure 5.2- Ternary RGB K_Th_U Image –NTGD Data 39 Figure 5.3- Stacked Profiles VD1 – NTGS Data 39 Figure 5.4- Bandpass Filter Image –Open File Company Data 41 Figure 5.5- Stacked Profiles TMI superimposed on Bandpass Filtered Image 42 Figure 5.6- High frequency Residual of merged Open File Company Data 43 Figure 5.7- Keating Kimberlite Solutions – Merged NTGS Data 44 Figure 5.8- Euler Solutions SI-2 NTGS Data 45 Figure 5.9- Keating Kimberlite Solutions Merged Company Data 46 Figure 5.10-Selected Anomalies on Regional Google Image 48 Figure 5.11-Selected Anomalies on Bandpass Filter 2 Image 49 Figure 5.12-Location Abner Anomalies on vertical shade component RTP TMI 50 Figure 5.13- Abner anomalies superimposed on Landsat 147 image 51 Figure 5.14- Landsat image showing prominent NNE fractures Abner pipe 52 Figure 5.15- Landsat image showing NNE fractures at E.Mu kimberlite 53 Figure 5.16- Location Glyde North-Foelsche-Glyde anomalies on Landsat image 54 Tables in Text Table listing selected anomalies –Foelsche Project Area 28 Table listing selected anomalies Glyde North Area 34 Table listing coordinates of selected anomalies Regional Project 47

7
Appendix A- listing ArcView products on accompanying disc. 55

8
1. Project Description 1.1Introduction Legend International Holdings Inc (hereafter referred to as Legend) is presently re-evaluating the potential of an area which encompasses the Merlin and Abner Range diamondiferous kimberlites in the NT. Through tenements held in its own right and through joint ventures with other tenement holders Legend has acquired a substantial land holding to explore for further diamondiferous kimberlites. Part of this re-assessment of the area includes interpretation of geophysical data which is available in both proprietary and publicly available forms. Proprietary data is in the form of HEM (Helicopter EM) surveys flown by Legend (and its subsidiaries) in the Glyde North and Foelsche project areas (See figure 1.2). Publicly available data is in the form of airborne surveys flown by NTGS as part of its semi detailed coverage of the NT and through historical surveys flown by other explorers during past exploration. The extent of the project area is outlined in figure 1.2 This report describes the process of merging the various survey data that is available into a coherent and readily useable database and the subsequent selection of potential target anomalies from this data. The scope of the project is outlined in the following section. 1.2 Scope of the Project. The project requirements as defined in discussions with Legend are as listed below: 1. Integrate NADL and Legend surveys as far as possible (i.e. merge surveys to form seamless grids) 2. Produce magnetic profiles over images as a base for detailed target selection 3. Produce EM depth slice images, select targets and produce profile slices for selected target responses. 4. Profile by profile anomaly search for small discrete kimberlite signature 5. Automatic cross correlation for a modeled kimberlite target response 6. Provide digital output using MGA53 and output compatible with ArcView 7. Integrate the latest work from one of Legend’s geophysical contractors who have started with this project. 8. A target plan and listing 9. Produce a report 10. Add regional data i.e. 400/300m magnetic data as requires to cover Glyde S and NAD tenements

9
Figure 1.1 showing the location of the project area
1.3 Data provided by Legend There are essentially two major data components which make up the total project. There are datasets which are proprietary data acquired by Legend or its subsidiary companies which are referred to in the context of this report as “Legend Proprietary Data. These include data acquired by negotiation with NADL which holds title to adjoining ground. These datasets consist essentially of HEM (Helicopter EM) detailed surveys flown at flight line spacing of 100 metres. In the Glyde North Project area it also includes detailed fixed wing aeromagnetic data.

10
Figure 1.2- Location of Proprietary Company Surveys and NTGS Survey Data In the broader regional area included in the defined project area (see Figure 1.2) the available data is in the form of semi regional data acquired by NTGS as part of its ongoing project of providing total aeromagnetic coverage of the Northern Territory and historical surveys flown by previous exploration companies. NTGS data is at a flight line spacing of 400 metres and a nominal flying height of 70 metres. Legend provided digital copies of the NTGS data which included both magnetic and radiometric data. For reference purposes this data is referred to as “NTGS Data” in this report

11
1.4 Historical Company Survey Data The project area is prospective for both kimberlites and base metals and has historically been extensively explored. Previous explorers have acquired airborne survey data in the form of conventional aeromagnetic/ radiometric data and airborne EM survey data which is generally in the form of GEOTEM TDEM data and these data are available through the NTGS as open file datasets. Much of the historical survey data was acquired in the early 1980s by technology that has now been superseded and processed by non imaging techniques. In many of the surveys navigation was by visual means with flight path recovery plotted from photographic film onto photo mosaics and then digitized. Despite the age of much of the data it forms a useful supplement to the NTGS surveys which were acquired using GPS navigation and processed with the benefit of modern imaging techniques. Historical company survey data has been acquired at varying flight line intervals ranging from 200metres (Foelsche-Normandy Poseidon survey) to 1000 metres (BHPB GEOTEM surveys). The historical survey has been flown for the purposes of exploring for kimberlites and base metals. For the purposes of this report these datasets are referred to as “Company Survey Data” Further details regarding both the NTGS and Company Survey Data are discussed in a later section of this report. If the reader requires additional data information is available through NTGS through the NTGS airborne Survey Database and through Company Reports submitted to NTGS. 1.5 Additional Datasets referenced during the course of the project To assist in the target selection process reference has been made to additional datasets that are readily available in the public domain which include regional Bouguer Gravity data, SRTM (Shuttle Radar Topography Mission), Landsat and Google imagery. Examples of these datasets are included as figures 1.4-1.5. The Google imagery is high resolution data and is invaluable in determining whether cultural sources may be the cause of recorded geophysical responses. The spectral bandwidth of Google data is however limited but can be supplemented by referring to multiband Landsat data which has a much broader spectral bandwidth. SRTM data is readily available through NASA and provides uniform (90m grid cell size) coverage of the terrain. This can be useful in assessing the likelihood of a geophysical anomaly being due to kimberlite.

12
Figure 1.3 showing the location of Open File historical company surveys utilized in the project The Bouguer gravity data available through GA (Geoscience Australia) is very regional with stations spaced on an approximate 11 km grid. Despite this useful regional information can be gleamed from this data and incorporated into the interpretation. The reader is referred to the section on the Glyde North Project area where certain ideas are proposed based on the regional gravity database.

13
Figure 1.4 SRTM Digital Terrain Image-Project Areas 1.6 Data formats, Datum and Projections As requested by Legend data products are presented in a form which enables easy input into ArcView. Images are provided as registered ArcView tiff images, line work such as contours as shape files and merged images and line work as ER Mapper ecw files. All registered data are in GDA94 datum and MGA53 projection, unless otherwise specifically stated.

14
Figure 1.5- Bouguer Gravity Image –Project area Source of data –Geoscience Australia

15
2. Brief History of the successful application of geophysics in the discovery of the E.Mu, Merlin and Abner kimberlites. For a detailed description of the history of the discovery of the E.Mu and Merlin kimberlites the reader is referred to a presentation by Reddicliffe in “Diamond Exploration Techniques” published by the Centre for Teaching and Research for Strategic Mineral Deposits, 1999. This paper also includes detailed information regarding the geophysical responses of the Merlin kimberlites. Figures 2.1 and 2.2 are extracts from this paper and provide excellent summaries of both airborne and ground geophysical responses of the Excalibur and Ector kimberlites. A similar summary of the discovery of the Abner pipe is not available but in many respects has followed a similar path. With the exception of the E.Mu kimberlites which were discovered at the early stage of exploration the discoveries of the Merlin and Abner kimberlites have been quite protracted following the initial discovery of kimberlitic chromite indicators followed by the discovery of breccia pipes leading ultimately to the discovery of kimberlite.
Figure 2.1 illustrating the geophysical response of the Excalibur Kimberlite
(Source Reddicliffe 1999 figure 12)

16
Figure 2.2 Airborne and ground geophysical responses over the Ector Pipe
(Source-Reddicliffe 1999 figure 13)
The Merlin kimberlites are known to be small in size as is evident in Google imagery of the Merlin Mine. Subsequent to the publication of the paper by Reddicliffe further information has emerged regarding the shape of the kimberlites with depth. Figure 2.3 shows an interpreted drill section released by Ashton Mining Ltd (Reference Lamont Mining Conference 2000) in the area of the Palomides and Sacramore pipes which shows the two bodies merging at the unconformity between the Bukalara Sandstones and the Proterozoic sediments at a depth of approximately 100 metres.

17
Figure 2.3 Drill section across Palomides-Sacramore kimberlites (Merlin Mine area) showing progressive merging of pipes at the unconformity between Bukalara and Proterozoic sediments. The Proterozoic is marked in purple on the drill section, Bukalara –light red.

18
3. Expected Geophysical Response of kimberlite in project area and the effects of flight line spacing on the recorded response At the magnetic latitude (-47˚) of the project area the expected response assuming only induced magnetization of a vertical cylindrical source (approximating a kimberlite) is as shown in Figure 3.1. In this model of an idealized kimberlite the diameter of the body is 200 metres. Ideally to properly recognize the anomaly as being a possible kimberlite a traverse directed N-S would best define the body identifying the dipolar form of the anomaly with the negative on the pole side (south) of the body.
Figure 3.1- Idealised magnetic response of a kimberlite assuming a vertical cylindrical shape and only induced magnetization at the magnetic latitude of the project area N.B Where flight lines are at an angle to N-S as is much of the Historical Company Data the recorded response may only approximate the true shape of the anomaly. Similarly where NTGS survey flight lines are oriented E-W it is possible that only the positive or

19
negative will be recorded where a small source lies between 400 metre spaced flight lines. Examples of actual kimberlite responses
Figure 3.2-Aeromagnetic profile across Ector pipe 1982 CRAE fixed wing survey Note vertical amplitude scale on left

20
Figure 3.3 –Aeromagnetic profile across E.Mu pipes CRAE 1982 fixed wing survey Note change in amplitude scale compared to Figure 3.2 4. Discussion of Legend Proprietary Data including the selection of target anomalies. 4.1Description of the available data The location of the project areas in which Legend has access to proprietary data are shown in figures 1.2. In 2005 Fugro conducted HEM surveys in two areas of the Foelsche Project area with the frequency domain RESOLVE system along flight lines flown N-S and spaced 100metres apart. In 2007 GPX were commissioned to fly a TDEM helicopter based system in the northern half of EL 23121(Glyde North Project area) which occurs immediately south of the Merlin kimberlite field. Legend has also negotiated with NADL (North Australian Diamonds Limited) to gain access to HEM data acquired by Rio Tinto whilst operating the Merlin Mine. This data was acquired by Geoinstruments using the Geotech Hummingbird frequency domain system and the area lies immediately adjacent to the Fugro RESOLVE survey area. The Hummingbird survey covers part of the same area as the second RESOLVE survey. Both the RESOLVE and HUMMINGBIRD surveys were flown with the EM bird at approximately 30 metres. In the Glyde North area Legend has negotiated with NADL for access to fixed wing aeromagnetic data which extends over the southern half of the EL. The fixed wing survey
21
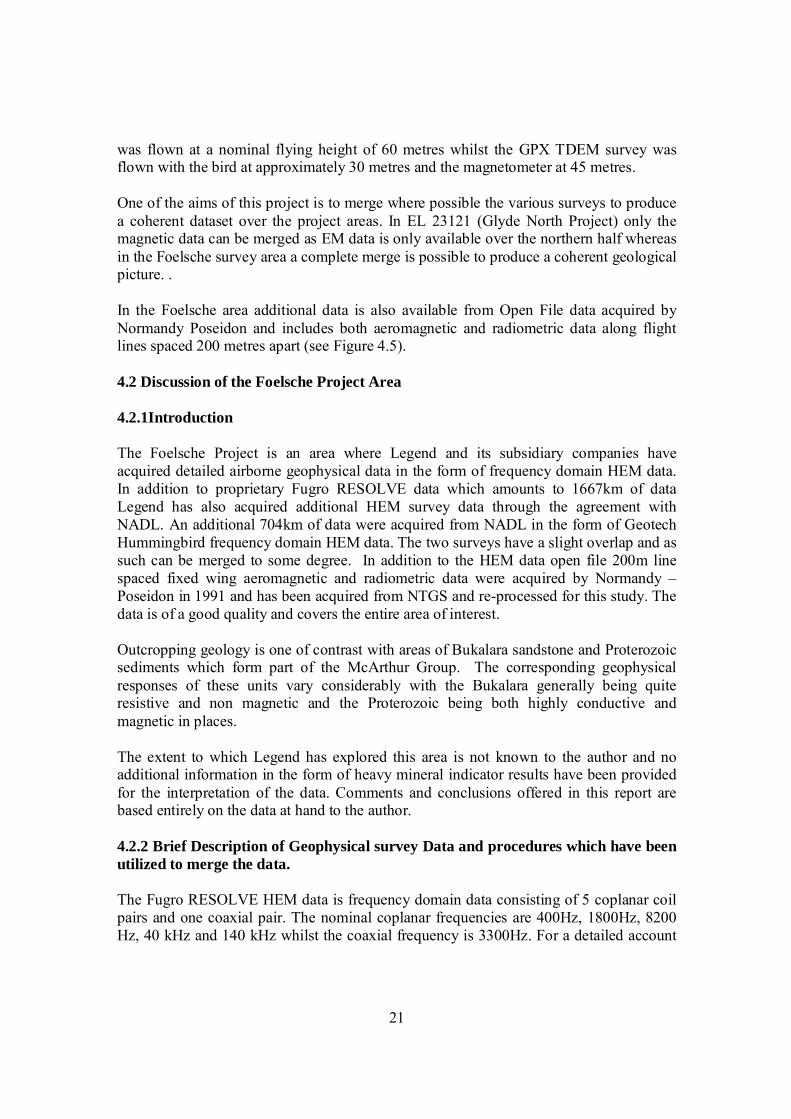
was flown at a nominal flying height of 60 metres whilst the GPX TDEM survey was flown with the bird at approximately 30 metres and the magnetometer at 45 metres. One of the aims of this project is to merge where possible the various surveys to produce a coherent dataset over the project areas. In EL 23121 (Glyde North Project) only the magnetic data can be merged as EM data is only available over the northern half whereas in the Foelsche survey area a complete merge is possible to produce a coherent geological picture. . In the Foelsche area additional data is also available from Open File data acquired by Normandy Poseidon and includes both aeromagnetic and radiometric data along flight lines spaced 200 metres apart (see Figure 4.5). 4.2 Discussion of the Foelsche Project Area 4.2.1Introduction The Foelsche Project is an area where Legend and its subsidiary companies have acquired detailed airborne geophysical data in the form of frequency domain HEM data. In addition to proprietary Fugro RESOLVE data which amounts to 1667km of data Legend has also acquired additional HEM survey data through the agreement with NADL. An additional 704km of data were acquired from NADL in the form of Geotech Hummingbird frequency domain HEM data. The two surveys have a slight overlap and as such can be merged to some degree. In addition to the HEM data open file 200m line spaced fixed wing aeromagnetic and radiometric data were acquired by Normandy –Poseidon in 1991 and has been acquired from NTGS and re-processed for this study. The data is of a good quality and covers the entire area of interest. Outcropping geology is one of contrast with areas of Bukalara sandstone and Proterozoic sediments which form part of the McArthur Group. The corresponding geophysical responses of these units vary considerably with the Bukalara generally being quite resistive and non magnetic and the Proterozoic being both highly conductive and magnetic in places. The extent to which Legend has explored this area is not known to the author and no additional information in the form of heavy mineral indicator results have been provided for the interpretation of the data. Comments and conclusions offered in this report are based entirely on the data at hand to the author. 4.2.2 Brief Description of Geophysical survey Data and procedures which have been utilized to merge the data. The Fugro RESOLVE HEM data is frequency domain data consisting of 5 coplanar coil pairs and one coaxial pair. The nominal coplanar frequencies are 400Hz, 1800Hz, 8200 Hz, 40 kHz and 140 kHz whilst the coaxial frequency is 3300Hz. For a detailed account

22
of the RESOLVE system the reader is referred to the relevant operations report. The data provided includes calculated apparent resistivities for each of the frequencies. The Geotech Hummingbird system is an older frequency domain system which has three coplanar coils and two coaxial pairs. For the data acquired by Rio Tinto the coplanar frequencies were nominally set at 880Hz, 6000Hz and 34000Hz and the coaxial at 980Hz and 7000Hz. The calculated apparent resistivity values have been provided by the contractor but two values are included based on different methods of calculating the result and these differ. One of the values is based on a similar method to that which Fugro have applied to the RESOLVE data (Pseudo-layer Method) but for the lower 880Hz coplanar frequencies excessive noise has prevented the calculation of the apparent resistivity in places. The values determined by the alternative method (Altitude-Amplitude Method) have been calculated as the method is more tolerant to noisy data. For a detailed discussion of these various methods the reader is referred to a paper by Valleau (Reference-Exploration Geophysics 2000, Vol 31 p584-594) which offers an excellent summary of the methodology of calculating apparent resistivities. Once again as for the RESOLVE survey the reader is referred to the Operations Report for further information regarding the Geotech Hummingbird System. It should be noted that for both systems the magnetometer was located in the HEM bird. N.B. Merging of the two survey data sets is readily possible for the magnetic data but is only possible in a qualitative way for the EM data due to the different frequencies and systems used. For quantitative analysis of the EM data the reader is referred to the individual survey datasets.

23
Figure 4.1 Reduced to Pole TMI Image of the merged Fugro RESOLVE and Geotech Hummingbird HEM Surveys

24
For the purely qualitative merging of the HEM data similar frequencies have been selected in both systems i.e. 40 kHz RESOLVE and 34 kHz Hummingbird and 8200 Hz RESOLVE and 6000 Hz Hummingbird data.
Figure 4.2 which shows the image resulting from the merging of 8200Hz apparent resistivity RESOLVE data with the 6000Hz Geotech Hummingbird data. N.B this image should only be utilized in a qualitative sense. For quantitative analysis the reader is referred to the original survey data.

25
Ternary images have been created to emphasize the apparent resistivity at different frequencies. These are shown in Figures 4.3 and 4.4. Red emphasizes shallow conductors and mixtures of green and blue deeper conductors. The colour black indicates a conductor and colour white a resistive response at all three frequencies.
Figure 4.3 –RGB Ternary image of 34 kHz, 6000 Hz and 880 Hz apparent resistivity values-Geotech Hummingbird Survey

26
Figure 4.4 RGB Ternary representation of 40 kHz, 8200 Hz and 1800 Hz RESOLVE Survey apparent Resistivity values – Black indicates a conductor, white a resistor. Radiometric data acquired from the Normandy Poseidon survey data are shown in figure 4.5. This image has the benefit of effectively mapping the outcropping surface geology as radiometric data have no effective depth penetration. Where weathered surface geology reflects in situ weathered products it can be an effective mapping tool.

27
Maximum benefits can be generally achieved when viewed in conjunction with remote sensing data.
Figure 4.5 –RGB K_Th_U Ternary Image-Foelsche Project Area. The boundary of the merged HEM surveys is shown for reference.

28
4.2.3 Target Selection Within the Foelsche project area there are marked differences in the outcropping geology as described in the above introduction and in the target selection process one has to be cognizant of the fact that what geophysics responds to is a physical contrast between two different rock types. It is highly likely that kimberlites within the conductive Proterozoic may be reflected as resistors whereas kimberlites within the Bukalara will be apparent as conductors. As for all areas the target selection process has been in the form of manual inspection of individual profiles and gridded images and the use of automated methods such as Keating and Euler. In assessing the HEM data the merging of apparent resistivities as RGB images can significantly assist in assessing the contributions of the various frequencies which in turn has implications for the depth of the conductor (or resistor). The reader is referred to Figures 4.3 and 4.4. In the manual approach to anomaly selection multiple linked data sets are viewed at the same time and correlations established. Figure 4.6 which is a screen capture of anomaly F_KJ1 shows how this approach is applied. The target selection process is based purely on the observed geophysical responses. No additional information has been provided by Legend in the form of indicator sampling results or the results of any previous field work or earlier follow up of the survey data. The following table lists those anomalies which the author considers to be anomalous and warranting ground follow up. Table 4.2.2-listing selected anomalies-Foelsche Project Area Anomaly Easting Northing Comments Reference F1_KJ1 661900 8119788 Major discrete resistor F1_KJ2 661110 8138520 Coincident magnetic/EM anomaly F1_KJ3 662695 8137945 EM conductor in Bukalara Sndst. F1_KJ4 663090 8138440 EM conductor in Bukalara Sndst. F1_KJ5 662775 8136295 EM conductor in Bukalara Sndst. F1_KJ6 657328 8118512 Coincident mag/ EM anomaly (formerly F2_KJ1) F1_KJ7 657521 8126652 Coincident mag/EM response (formerly F2_KJ2) F1_KJ8 658551 8121787 discrete resistor with magnetic response The geophysical responses of some of these anomalies are summarized as shown in Figure 4.6 below in an appendix to this report.

29
Figure 4.6 shows a screen capture of the process of selecting target anomalies. In the above image all four windows are linked so that the location of an EM anomaly can be immediately assessed in terms of its location in the field through the Landsat image etc. The actual field locations are shown on Landsat and Google ArcView compatible images which accompany this report. Initial field checking conducted by Legend following the submission of the above targets in a preliminary report has confirmed that the resistor selected as F_KJ1 is not a kimberlite but that it represents a distinctly different rock type, sandstone, with potential base metal interest. 4.2.4Recommendations The priority targets in the above list are F1_KJ2, F1_KJ3, F1_KJ4 and F1_KJ6. Anomaly F1_KJ2 is of interest because there is a coincident EM/mag response in Bukalara Sandstone. The more regional datasets suggests that the anomaly may also lie on a significant WNW trending linear which can be traced to the Merlin kimberlites.

30
It is strongly recommended that the above anomalies be assessed in relation to Legend’s heavy mineral indicator database to determine whether any correlations exist between the anomalies and positive indicator results. It is also recommended that if priority areas are evident in the indicator data where no targets have been selected that the geophysical database be re-assessed.
Figure 4.7 –showing the location of the selected target anomalies in Foelsche Project Area.

31
A further separate report will be submitted in relation to the construction of CDI profiles from the HEM data in the Foelsche Project area. 4.2.5 ArcView compatible images and line work A complete listing of all of the images and vector data that has been produced as part of the project in ArcView compatible forms is given in Appendix A and the data are available on the accompanying data CD. 4.3 Glyde North Project Area 4.3.1 Introduction The Glyde North Project area encompasses Legend EL 23121 and covers an area totaling 58 sq km. EL23121lies immediately south of the Merlin Kimberlite Field. Bukalara sandstones make up the surface geology and overlie Proterozoic sediments which form part of the McArthur Group. Major faults including the southern extension of the Emu Fault bisect the EL. In 2007 Legend commissioned GPX to fly a helicopter TDEM survey over the northern half of the EL and a total of 378 km were flown. The survey was flown along N-S traverses spaced 100 metres apart. Through an agreement with NADL Legend has acquired a further 398 km of fixed wing aeromagnetic data which provides coverage for the southern half of the EL. These surveys form the basis of the data for this study. The extent of any previous exploration in this area by Legend and its subsidiaries are not known to the author and only the geophysical data described above has been included in the study. Comments and conclusions are based entirely on the data provided by Legend. 4.3.2 Brief Description of Geophysical survey Data and procedures which have been utilized to merge the data. The fixed wing survey data acquired from NADL forms part of a larger survey which covers an area to the south and east of EL23121. This survey was originally flown by Ashton Mining Ltd and consists only of aeromagnetic data acquired at a nominal flying height of 60 m metres. No radiometric data was acquired as part of the survey. Merging of data from the two surveys is therefore limited to the magnetic data. In the GPX TDEM survey the magnetometer is located in a separate bird positioned midway between the helicopter and EM coil approximately 45 metres above the ground. The EM coil is flown at a nominal 30 metres above the ground. In the EM system a total of 21 channels are sampled at times ranging from 78.33 to 11724 microseconds (window

32
centre time). For a detailed description of the GPX system the reader is referred to the operations report for the survey. The flying of the EM system requires that the coil is stable when each line is flown and in order to achieve this the flying is done on a system known as “race tracking” which results in blocks of adjoining flight lines (in this survey 5 lines) being flown in the same direction. This ensures that at the completion of a flight line the helicopter is able to fly a sufficient arc to arrive at the next flight line with the coil stabilized. In the Glyde North area the magnetic filed is extremely flat with little variation and as such any factors such as residual heading effects due to the helicopter/coil are amplified.
Figure 4.8 showing the proximity of anomalies within the Glyde North Project Area to the Merlin Kimberlites. The Glyde North anomalies are prefixed by GN. The image also highlights the major structures such as the Emu Fault which extends through the EL.
33
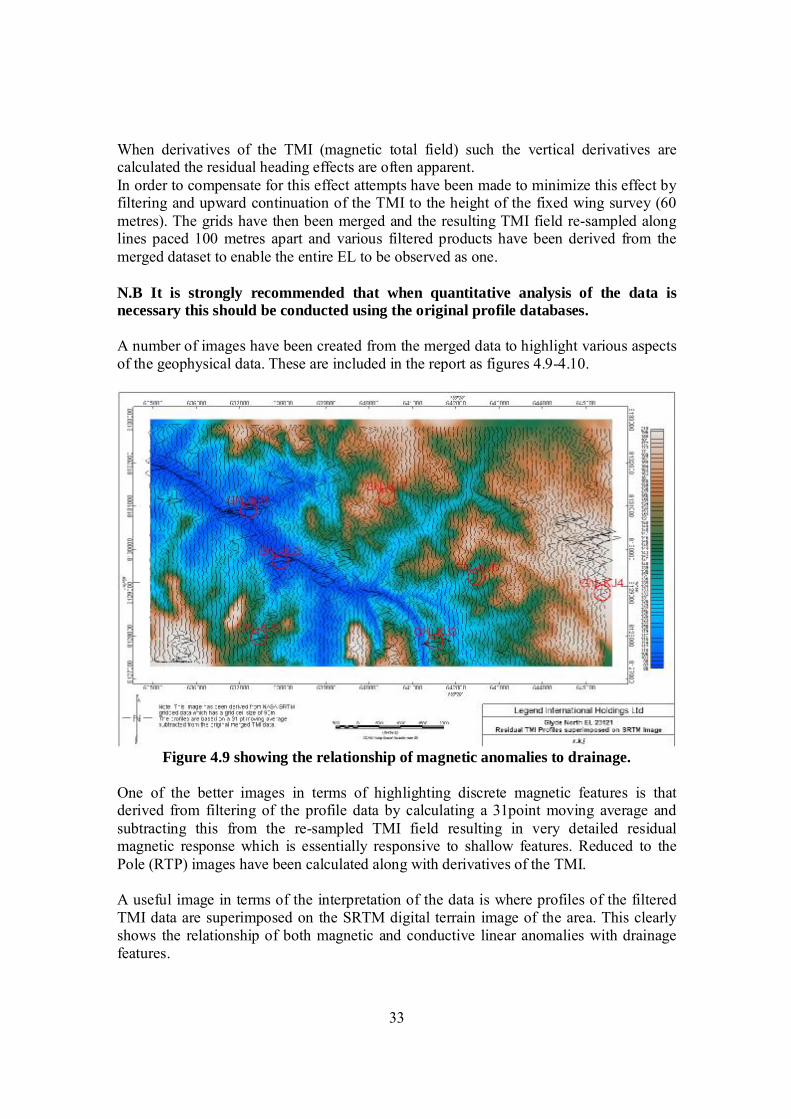
When derivatives of the TMI (magnetic total field) such the vertical derivatives are calculated the residual heading effects are often apparent. In order to compensate for this effect attempts have been made to minimize this effect by filtering and upward continuation of the TMI to the height of the fixed wing survey (60 metres). The grids have then been merged and the resulting TMI field re-sampled along lines paced 100 metres apart and various filtered products have been derived from the merged dataset to enable the entire EL to be observed as one. N.B It is strongly recommended that when quantitative analysis of the data is necessary this should be conducted using the original profile databases. A number of images have been created from the merged data to highlight various aspects of the geophysical data. These are included in the report as figures 4.9-4.10.
Figure 4.9 showing the relationship of magnetic anomalies to drainage. One of the better images in terms of highlighting discrete magnetic features is that derived from filtering of the profile data by calculating a 31point moving average and subtracting this from the re-sampled TMI field resulting in very detailed residual magnetic response which is essentially responsive to shallow features. Reduced to the Pole (RTP) images have been calculated along with derivatives of the TMI. A useful image in terms of the interpretation of the data is where profiles of the filtered TMI data are superimposed on the SRTM digital terrain image of the area. This clearly shows the relationship of both magnetic and conductive linear anomalies with drainage features.

34
Figure 4.10 Calculated vertical derivative of with selected anomalies superimposed 4.3.3Target Selection Based purely on the observed geophysical responses only a limited number of targets are evident in either the magnetic or EM datasets. The following Table lists the coordinates of these anomalies and in an appendix to this report images are provided which shows the geophysical response of the target area along with the Landsat and topographic expression of the area surrounding the selected anomaly. An example of this presentation is given in figure 4.11 below. Selected anomalies in the Glyde North area have the prefix GN to denote in which project area they occur. Table-4.3.1-listing selected targets- Glyde North Project Area Anomaly Easting Northing Comments Reference GN_KJ1 637195 8130910 A two line 3.5 nT anomaly in drainage GN_KJ2 637930 8129730 Three line 1nT anomaly GN_KJ3 641530 8127870 1.5 nT anomaly on topographic high GN_KJ4 645380 8129005 Three line 1nT anomaly GN_KJ5 637430 8127975 Single line 1 nT anomaly GN_KJ6 642470 8129360 0.5 nT anomaly GN_KJ7 640400 8131240 One line early channel EM response

35
Coordinates are GDA94 MGA53 datum and projection None of the selected targets represent truly coincident magnetic/EM anomalies and based purely on the geophysical data none are considered to be high priority kimberlite targets but are sufficiently anomalous to warrant ground follow up. Of these targets GN_KJ1 is the highest priority in that the magnetic response is well defined and a weak shallow EM response occurs immediately to the south. The anomaly lies in drainage close to the junction of two streams and may simply reflect the accumulation of heavy minerals in drainage material but certainly warrants further investigation.
Figure 4.11 Anomaly GN_KJ1 Anomaly GN_KJ7 reflects a very early time EM response with no obvious well defined associated magnetic response. It clearly reflects a very thin but conductive layer that may reflect infill or residual material. It is not considered to be high priority target but of interest in terms of what the thin-shallow conductor represents. Regional bouguer gravity data points acquired by GA (Geoscience Australia) are spaced at intervals of approximately 11 km and as such reflect only regional features. The observed regional bouguer field surrounding EL 23121 is shown in Figure 4.12 and the horizontal gradient maxima derived from this data are also indicated. The latter highlights the major gradients in the bouguer field which occur on or close to major basement boundaries reflecting significant changes in density.

36
Figure 4.12 showing the sharp gravity gradient that the Merlin kimberlites are spatially related to and the extension of this feature along the eastern margin of Legend EL 23121

37
The Merlin kimberlites clearly lie on or close to one of these major gradients which extends southwards into EL 23121. If the Merlin kimberlites are related in any way to this structure it would suggest that the eastern half of EL 23121 may be more prospective for a southern extension of the Merlin kimberlite field. Note: In a detailed structural study of the McArthur Basin, Leaman (Ref –Australian Journal of Earth Sciences vol 45:1 p 3-20) defined a similar structure. It is strongly recommended that a review of any in-house heavy mineral indicator data along the eastern half of the EL be undertaken to test this interpretation of the bouguer gravity data. At Merlin there are indications that WNW trending structures which are possible extensions of the Calvert Fault System intersect the orthogonal NNE trending gravity gradient. Similar parallel WNW trending structures are inferred to intersect the NNE gravity gradient in the north east and south east corners of EL 23121. 4.3.4 ArcView compatible images and line work A complete listing of all of the images and vector data that has been produced as part of the project in ArcView compatible forms is given in Appendix A and the data are available on the accompanying data CD. 5. Regional Geophysical Database A requirement of the project is to assemble a regional geophysical database made up of NTGS surveys and open file company data. The following sections briefly describe the processes involved and wherever possible illustrate this with images of the merged data. 5.1 NTGS Data As part of the NTGS policy to provide 400metre spaced aeromagnetic coverage of the NT a number of surveys have been flown on an annual basis and four of these surveys cover the project area as defined by Legend. The extent and details of the surveys which make up the project area are outlined in figure 1.2. All four surveys acquired both magnetic and radiometric data and the relevant data has been merged as pert of this project to provide continuous and wherever possible seamless coverage of the project area. The compiled TMI image is shown in figure 5.1 and a ternary RGB image of K, Th and U is shown in figure 5.2. Various filters have been applied to the TMI data to generate RTP (Reduce to Pole), vertical derivative and other filtered products some of which are included in the figures below. Similarly for the radiometric data images of the individual Potassium, Thorium and Uranium channels have been constructed.

38
To assist with interpretation stacked profiles of the data have been constructed and are included as ArcView shape files to overlay the various imaged products. Due to the variation in magnetic response observed over the volcanics to the south with the subdued response over sediments to the north a logarithmic plot has been created to dampen the higher amplitude magnetic responses and still see the more subtle responses over the non magnetic sediments.
Figure 5.1 Merged TMI Image –Project Area

39
Figure 5.2 Ternary RGB K_Th_U Merged Data
Figure 5.3 showing stacked profiles of the vertical derivative of TMI. The profiles are a logarithmic plot to amplify the lower amplitude anomalies

40
The main problem which arises in the NTGS data is the marked difference in flight directions which exist between the Bauhinia2 survey and the Glyde-Foelsche area (see Figure 1.2). In the TMI image this can be largely obscured but in images such as the vertical derivative of the TMI it becomes more apparent. The normal associated with wide line spacing and low flying heights are evident where local high frequency responses are not perpendicular to the flight lines and the ‘string of beads” effect is observed. 5.2 Open File Company Survey Data The project area has been extensively explored not only for diamonds but also for base metals as a result of which historical survey data are available. In the early 1980s CRAE flew a number of surveys for diamonds which cover virtually the entire Legend project area. These surveys were flown with flight lines in a consistent direction, N45˚E, and at a flying height of 80 metres. In all surveys radiometric data were also acquired. In all but one of these surveys the same contractor flew the surveys and as such there is some consistency in the data. Only the survey known as Glyde, for the purposes of this study (see figure 1.3), which includes the Merlin kimberlite field was flown by a different contractor and with a lesser crystal volume as part of the spectrometer system. The full extent of the surveys is shown in Figure 1.3. More detailed but more restricted surveys have been flown subsequently by companies such as Normandy Poseidon. BHPB as part of a regional base metal exploration programme flew large areas with the GEOTEM TDEM airborne system but along widely spaced 1km flight lines. This data covers much of the project area and has some value in providing some indication of the conductivity of surface rocks in areas where detailed HEM surveys might be considered. The open file data has been merged into a regional dataset and various filters have been applied to enhance the high frequency responses which are likely to be associated with kimberlite sources. Due to the age of the data and the very “flat” magnetic field that is observed over much of the project area re-processing of the data has been directed towards minimizing the effects of leveling problems in the original data. Re-leveling of the entire database is beyond the scope of this project but many of the visual problems that arise from leveling issues can be removed by applying suitable filters to the profile data and then re-gridding these to form a suitable image. An example of this is the application of a 31point moving average filter to the original TMI values and then subtracting the averaged values from the original to produce a high frequency residual image. This has the effect of removing all of the longer wavelength anomalies and highlighting the higher frequency responses potentially associated with kimberlites.

41
Various bandpass filters have been applied to remove the effects of the longer wavelength anomalies which include leveling errors to focus on the higher frequency responses which contain the responses of interest in relation to kimberlites. To assist with the interpretation of the data ArcView compatible products have been constructed both for the individual survey areas and for the merged datasets. This applies to the re-processed radiometric data as well. Examples of these products are shown in the accompanying text figures below.
Figure 5.4 – Bandpass Filtered image of merged open file company data Due to the use of visual navigation in these earlier surveys flight line spacing is nowhere near as consistent as in the later GPS navigated NTGS surveys. Where the flight line spacing has exceeded 500 metres (nominal spacing 300 metres) a gap is shown in the imagined data to highlight the fact that information is lacking in these specific areas.

42
Figure 5.5 showing same imagine as in Figure 5.4 but with the addition of stacked profiles and selected anomaly locations. Each of these layers of information is available in ArcView format. 5.3 Comparison of NTGS and Historical Company Data The closer spacing of the historical company data does provide in most areas a more coherent picture but it is recommended that the NTGS and historical company datasets be used in a complimentary manner in areas of interest. The main benefit of having both databases is that there is a greater density of surveyed points bearing in mind that company open file data is always at an angle to the NTGS data and therefore surveying areas between the NTGS data points.
43
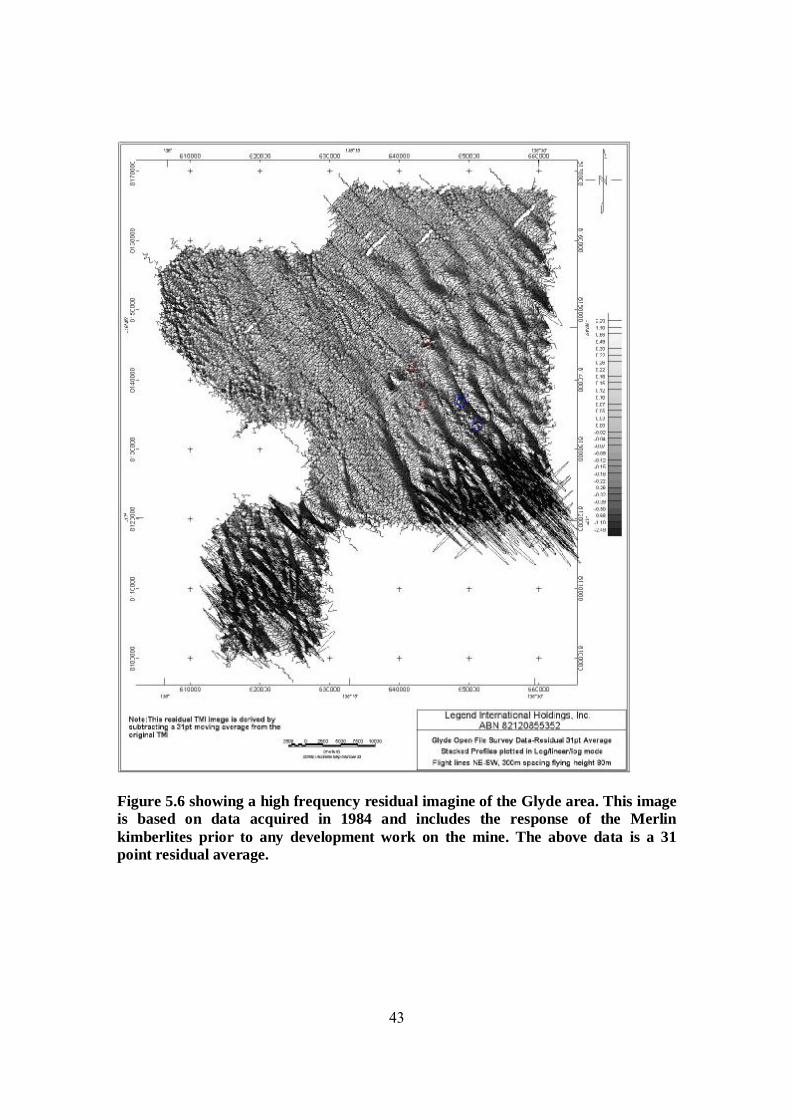
Figure 5.6 showing a high frequency residual imagine of the Glyde area. This image is based on data acquired in 1984 and includes the response of the Merlin kimberlites prior to any development work on the mine. The above data is a 31 point residual average.

44
5.4 Target Selection Process In principal the same procedure has been applied to the regional data in the anomaly selection process as was applied to the detailed proprietary survey data. Individual profiles have been visually examined in conjunction with constructed images of the data and supplementary information such as Landsat, Google and SRTM imagery. 5.4.1 Automated methods of identifying potential kimberlite targets Automated methods of identifying potential kimberlite targets have also been applied. These include the Keating Method where an idealized kimberlite model is compared to the gridded TMI data and estimations of the goodness of the correlation with the idealized model established. The Euler method has also been applied assuming a structural index (SI) of 2 which is consistent with a vertical cylindrical type source. Examples of these are included below. These and the manually selected anomalies derived from the profile analysis have been assessed as possible kimberlite targets.
Figure 5.7 – Keating Kimberlite Target Solutions derived from Merged NTGS Data

45
Figure 5.8 Euler Solutions Structural Index (SI) 2 Merged NTGS data ER Mapper ecw images have been compiled for the automated Keating and Euler method solutions and these are included in the ArcView data package that accompanies this report. For the Euler SI 2 solutions a maximum depth of 100 metres below ground level has been chosen as a cut off to produce an effective image.

46
Figure 5.9 Keating Kimberlite Solutions –Merged Company Data The colour scheme for the solutions is based on the amplitude of the selected anomalies. These solutions are based on values of <5 nT (black). 5-10nT (red), 10-25nT (green), >25 NT (blue). The locations of the known kimberlites are shown. 5.5 Anomalies selected as possible kimberlite targets A total of 45 initial targets have been selected as possible kimberlite related anomalies. A number of these occur in the Abner Range area where Legend hold ground and are presently actively exploring.

47
Table listing coordinates (GDA94 MGA53) of Selected Anomalies-Regional Project Easting Northing Ref
589130 8138120 AB_KJ1
594830 8139625 AB_KJ2
599278 8137090 AB_KJ3596840 8136355 AB_KJ4
600885 8138497 AB_KJ6
602547 8140245 AB_KJ7
592620 8148388 AB_KJ8
586282 8143570 AB_KJ9
585938 8151037 AB_KJ10
584640 8148290 AB_KJ11
597765 8146240 AB_KJ12
598524 8144821 AB_KJ13600720 8137785 AB_KJ14
597468 8140747 AB_KJ15
597490 8139858 AB_KJ16
587426 8147700 AB_KJ17
585056 8149614 AB-KJ18
587518 8147745 AB_KJ19
582959 8145055 AB_KJ20
594675 8151939 AB_KJ21
595324 8148137 AB_KJ22576497 8148050 AB_KJ23
575504 8146519 AB_KJ24
651138 8134555 G_KJ1
648935 8136790 G_KJ2
652664 8139735 G_KJ3
653780 8143455 G_KJ4
649240 8088175 C_KJ1
649030 8087725 C-KJ2
645448 8083640 C_KJ3644870 8087455 C_KJ4
578770 8101430 TS_K_KJ1
585340 8094225 TS_K_KJ2
587663 8096485 TS_K_KJ3
588345 8094290 TS_K_KJ4
594662 8097708 TS_K_KJ5
596830 8095370 TS_K_KJ6
600614 8106023 TS_K_KJ7
600045 8108811 TS_K_KJ8607387 8119080 TS_K_KJ9
585470 8123320 TS_K_KJ10
583490 8123615 TS_K_KJ11
562642 8121555 TS_K_KJ12
577815 8125025 TS_K_KJ13
574260 8132330 TS_K_KJ14

48
No attempt has being made to prioritize these anomalies for the following reasons: In widely spaced surveys the recorded response can at best only approximate the actual response of a kimberlite and as explained in Section 3 of this report unless a flight line is directly over the body a distorted picture can emerge. A poorly defined kimberlite which is attributed a lower priority rating may be neglected as a result of this lower rating. The history of the successful discovery of kimberlites in both the Merlin and Abner Range has been the integration of positive indicator results and follow up geophysics. As observed in the discovery of the Abner pipes this can be a protracted and exacting process. The selected anomalies are based on evaluating both the manually picked targets (profile analysis) and targets generated by the Keating and Euler automated methods. Both methods are in close agreement as to where the potential kimberlite related anomalies occur. The anomalies as can be seen from Figures 5.8 &5.9 below occur predominantly in the western half of the total project area which includes the Abner Range where Legend has a significant land position. There are no significant anomalies present in the area between Abner Range and Merlin.
Figure 5.10 showing the locations of selected target anomalies superimposed on a registered Google image.

49
Figure 5.11 Selected Anomalies plotted on Merged Company Data Bandpass Filter 2 Stacked Profiles are included for reference. 5.5.1 Abner Range The Abner Range is a priority area for Legend at present and the following is a brief summary of the geophysical responses observed in this area. The difficulties encountered in locating the Abner kimberlites indicate that geophysical responses are likely to be subtle. The problem is complicated by the fact that the background magnetic response, based on the aeromagnetic survey, are likely to be quite

50
variable and “geologically noisy” in places. The problem is equally difficult in respect of the likely EM responses which range from resistive to highly conductive. For this reason the selection criteria for anomalies has been relaxed somewhat from that applied to the first pass selection and an additional 10 anomalies have been added to the original list of selected targets. The location of the selected anomalies is shown in Figure 5.10 in which anomalies are plotted onto a vertical shade component image of the calculated RTP TMI Image.
Figure 5.12–Location of Abner Range selected anomalies superimposed on vertical shade component of RTP TMI Image. The anomalies in this image correspond well to the anomalies which have been have been selected from the profile and other selection methods. Figure 5.13 shows the locations of these anomalies plotted onto RGB 147 Landsat Imagery of the Abner Range.

51
Figure 5.13 showing locations of selected anomalies plotted on RGB Bands 147 Landsat Imagery. In the ground follow up of individual magnetic anomalies the following recommendations are made: 1. A sufficient area around the anomaly location should be surveyed as the original company data flight path was recovered using visual means and locational errors may be present in the data 2. The airborne profile data suggests that there may be a noisy magnetic background in places due to lateritic materials. To combat this it is strongly recommended that a continuous reading magnetometer be used to over sample the field so that these effects can be recognized in the data.

52
There is at the sites of both the Abner and E.Mu kimberlites indication that NNE –NE trending structures may play an important role. Figure 5.12 below shows RGB 147 Landsat imagery surrounding the Abner pipe and these structures are clearly visible.
Figure 5.14 showing prominent NNE trending fractures both to south and north of the Abner Kimberlite. Regrettably the flight line direction of the original CRAE survey is at an acute angle to this trend.

53
Figure 5.15 showing presence of NNE trending fractures in the vicinity of the E.Mu pipes.

54
5.6 Recommendations It is recommended that all of the selected anomalies be assessed against the results of regional indicator sampling and prioritized accordingly. It is conceivable that some of the selected targets have been previously assessed during earlier exploration by companies such as CRAE and that additional information exists in company reports submitted to NTGS. The fact that anomalies have been previously investigated by previous explorers should not in itself negate the importance of an anomaly if there is strong evidence from indicator sampling of a likely source. In the Merlin area exploration undertaken prior to the discovery of the Ector pipe had failed to discover the pipe despite recognizing the presence of an airborne magnetic anomaly. Pisolitic iron formations at the surface contributed to the difficulty in accurately locating the anomaly with follow up ground magnetic surveys.
Figure 5.16 showing the locations of selected target anomalies on Landsat bands 147 for the eastern half of the project area.

55
Appendix A - Listing of data on accompanying CD
The following lists all of the ArcView compatible files which are present on the CD which accompanies this report Images are written in ArcView tiff format Vector data are written as ArcView shape files. These files include contours and stacked profiles. ECW files are provided for all created maps. N.B. it is strongly recommended that ECW files be viewed first so that any qualifying comments provided regarding either the original data or the processing of the data can be viewed and the data .judged accordingly. The data has been saved to a high resolution so that maps can be reproduced to a range of scales. The merged data sets of the larger project area are designed to be plotted at scales of 1:250,000, individual company Open File data at 1:100,000 and the Proprietary data at suitable scales up to 1:25,000. A. Proprietary Data 1. Foelsche Area Merged HEM Data- 40 kHz (Note Resolve system 40 kHz, Hummingbird 34 kHz) Merged HEM Data- 8200Hz (Note Resolve system 8200Hz, Hummingbird 6000Hz) Merged HEM Data- RTP TMI Merged HEM Data- TMI Foelsche Fixed wing Survey- Ternary RGB K_Th_U Image Foelsche Fixed wing Survey- Potassium channel Image Foelsche Fixed wing Survey-Uranium channel Image Foelsche Fixed wing Survey- Thorium channel Image Foelsche Fixed wing Survey- Total Count Channel Image SRTM Image of Project Area For related text figures –see Contents page in report 2. Glyde North Area Merged residual TMI Stacked Profiles on SRTM Data Merged RTP TMI -1VD Merged Residual RTP TMI-1VD Stacked Profiles Calculated 1vd –Grey Scale Residual TMI 31pt Moving Average Merged TMI Image with contours Merged RTP-TMI with contours SRTM Image – Project Area Landsat RGB Bands 147 of Project Area. For related text figures –see Contents page in report

56
3. Proprietary Data Anomalies Selected anomalies are plotted onto ECW Landsat Image B. Merged NTGS Data Merged NTGS TMI (Total Magnetic Intensity) with contours Merged NTGS RTP (Reduced to Pole) TMI with contours Merged NTGS TMI-1VD with stacked profiles Merged NTGS RGB K_Th_U Image Merged NTGS Potassium Channel Image Merged NTGS Thorium Channel Image Merged NTGS Uranium Channel Image Merged NTGS Data-Distribution of Euler Solutions SI-2 Merged NTGS Data-Distribution of Keating Solutions SRTM Image – Project Area SRTM Textural Image written as GEOPDF File C. Merged Open File Company Data Merged Company Data-TMI Image Merged Company Data- Residual TMI 31 pt moving Average Merged Company Data-Bandpass Filter1 (with stacked profiles) Merged Company Data-Bandpass Filter1 (with stacked profiles)-PDF VERSION Merged Company Data-Bandpass Filter2 (with stacked profiles) Merged Company Data-RGB K_Th_U Image Merged Company Data-Potassium Channel Image Merged Company Data-Thorium Channel Image Merged Company Data-Uranium Channel Image Merged Company Data- Keating Solutions TMI Data Merged Company Data-Keating Solutions RTP TMI Individual Surveys Images and maps have been created for individual survey areas in a similar way to which data has been created for the merged dataset. D. Location of Selected Anomalies The locations of the selected anomalies have been plotted onto images of: Landsat RGB Bands 147 Registered Google Images Bandpass Filter 2 image with stacked profiles E. Digital Files listing coordinates of Selected Anomalies Digital files accompanying images- listings of anomalies CSV (Excel) files. 1. Listing Selected Anomalies - Foelsche Project 2. Listing Selected Anomalies-Glyde North Project 3. Listing Selected Anomalies - Regional Project