a report on annual survey of...
TRANSCRIPT
GOVERNMENT OF GOA
A REPORT ON
ANNUAL SURVEY OF INDUSTRIES
2004-05
DIRECTORATE OF PLANNING STATISTICS AND EVALUATION
PANAJI-GOA

P R E F A C E
The “Annual Survey of Industries” (ASI) is the prime source of Industrial
Statistics which provides the basic statistics of industrial sector. The frame of
factories used for the survey corresponds to the list of factories registered under
the Factories Act, 1948, as maintained by the Chief Inspector of Factories &
Boilers, Government of Goa.
This Report on Annual Survey of Industries pertains to the year 2004-05 and is
the 32nd in the series. It is compiled based on the information collected by the
National Sample Survey Organization (NSSO), Field Operations Division (FOD),
Government of India, under the statutory provision of The Collection of Statistics
Act, 1953, and the rules framed thereunder in 1959. The detailed tables presented
in this report have been generated by Central Statistical Organization (CSO),
Kolkata. The report presents a broad picture of the pattern and growth of
organized industrial sector in Goa. It provides estimates of different variables of
industrial statistics viz., capital structure, employment, input, output, value added
by manufacture, etc. by certain industry groups.
Constructive suggestions to improve the publication are always welcome.
(Anand Sherkhane) Director
Panaji-Goa Dated: 17/12/2009

OFFICIALS ASSOCIATED WITH THE REPORT
hri. S. Shanbhogue Joint Director
hri. Jagdish N Shirodkar Research Assistant
hri. Ciril Carvalho Statistical Assistant
mt. Sunita Bhagat Investigator
mt. Sheetal Naik Investigator
S S S S S

REPORT ON ANNUAL SURVEY OF INDUSTRIES FOR THE YEAR 2004-05
CONTENTS Page No.
Chapter I Introduction
1
Chapter II Concepts and Definition
2 – 5
Chapter III Principal Characteristics by Major Industrial Activity
6 – 10
Chapter IV Distribution of Factories by Size of Employment
11 – 14
Chapter V Distribution of Factories by Size of Capital
15 – 19
Chapter VI Distribution of Factories by Type of Ownership
20 – 23
Chapter VII
Distribution of Factories by Type of Organization
24 – 27
Statistical Annexures, 2004-05
28 – 47
Important Indicators of Industries in Goa over the Years 1964 to 2004.
48 – 51
National Industrial Classification and Distribution (NIC-1998) An Extract.
52 - 53

1
CHAPTER ONE
INTRODUCTION
1.1 The present Report on Annual Survey of Industries (ASI) for the year 2004-05 is the thirty-second in the series of such reports brought out by this Directorate. It incorporates data in respect of industrial statistics collected through the Annual Survey of Industries in the organized factory sector in this State by the National Sample Survey Organisation (NSSO), Government of India, under the statutory provisions of the collection of Statistics Act, 1953 and the rules framed there under in 1959. 1.2 The Director General, Field Operations Division (FOD), N.S.S.O., Government of India is declared as the Statistics Authority in terms of the aforesaid Act, while the Director of Planning, Statistics and Evaluation (DPSE), Government of Goa, has been appointed as the Officer on Special Duty for Goa State by the Government of India to ensure proper supervision and control over the coverage of factories located in this State. Under this arrangement, the N.S.S.O., (FOD) supplies one copy of the A.S.I. return received from each registered factory in the State to the D.P.S.E. 1.3 Scope and coverage: The A.S.I. covers the factories registered under The Factories Act, 1948 on sample basis from the year 1999-2000 (accounting year of A.S.I. 1998-99), shifting from the existing pattern of selection of factories of complete enumeration or census in the State. The coverage includes manufacturing factories as also those service industries and activities like cold storage, water supply, repair of motor vehicles and other consumer durables such as watch etc. As against 549 factories covered under Annual Survey of Industries during 2003-04, the number of factories covered during 2004-05 were 518. The factories have been classified into 19 industrial groups in terms of the 2-digit code, as per the National Industrial Classification of 1998 (NIC-1998). Till the reporting year of A.S.I. 1997-98 the factories were classified into industry codes framed under NIC-1987, as no revision of the existing National Industrial Classification was done. With the advent of recent version of NIC-1998 the fresh classification of factories and allotment of codes, the structure as corresponding with that of earlier version has been totally changed. To meet the convertibility of codes in both versions, the interested may refer to the concordance table appearing in NIC-1998 booklet.

2
CHAPTER TWO
CONCEPTS AND DEFINITIONS
2.1 REFERENCE YEAR for ASI 2004-2005 is the accounting year of the factory ending on 31 st March 2005 while the survey was conducted in 2005-2006. 2.2 FACTORY is one, which is registered under sections 2m (i) and 2m (ii) of The Factories Act, 1948. The sections 2m (i) and 2m (ii) refer to any premises including the precincts thereof (a) whereon ten or more workers are working, or were working on any day of the preceding twelve months, and in any part of which a manufacturing process is being carried on with the aid of power, or is ordinarily so carried on or (b) whereon twenty or more workers are working or were working on any day of the preceding twelve months and in any part of which a manufacturing process is being carried on without the aid of power , or is ordinarily so carried on. 2.3 FIXED CAPITAL represents the depreciated value of fixed assets owned by the factory as on the closing day of the accounting year. Fixed assets are those that have a normal productive life of more than one year. Fixed capital includes land including lease- hold land, buildings, plant and machinery, furniture and fixtures, transport equipment, water system and roadways and other fixed assets such as hospitals, schools etc. used for the benefit of factory personnel. 2.4 PHYSICAL WORKING CAPITAL is the total inventories comprising raw materials and components, fuels and lubricants, spares, stores and others, semi-finished goods and finished goods as on the closing day of the accounting year. However, it does not include the stock of the materials, fuels, stores etc. supplied by others to the factory for processing and finished goods processed by the factory from raw materials supplied by others. 2.5 WORKING CAPITAL is the sum total of the physical working capital as already defined above and the cash deposits in hand and at bank and the net balance receivable over amounts payable at the end of the accounting year. Working capital, however, excludes unused overdraft facility, fixed deposits irrespective of duration, advances for acquisition of fixed assets, loans and advances by proprietors and partners irrespective of their purpose and duration, long-term loans including interest thereon and investments. 2.6 PRODUCTIVE CAPITAL is the total of fixed capital and working capital as defined above. 2.7 INVESTED CAPITAL is the total of fixed capital and physical working capital as defined above. 2.8 GROSS VALUE OF PLANT AND MACHINERY represents the total original (undepreciated) value of installed plant and machinery at the end of the accounting year. It includes the book value of the newly installed plants and machinery and the approximate value of rented in plant and machinery at the time of renting-in but excludes the value of rented-out plant and machinery. Total value of all the plants and machinery acquired on hire - purchase basis is also included.
3
2.9 OUTSTANDING LOANS represent all loans, whether short term or long term, whether interest bearing or not, outstanding according to the books of the factory as on the closing day of accounting year. 2.10 RENT PAID represents the amount of royalty paid in the nature of rent for the use of the fixed assets in the factory. 2.11 INTEREST PAID includes all interest paid on factory account on loans, whether short term or long term, irrespective of the duration and the nature of agency from which the loan was taken. Interest paid to partners and proprietors on capital or loan are excluded. 2.12 RENT RECEIVED represents the amount of royalty received in the nature of rent for the use of the fixed assets in the factory. 2.13 INTEREST RECEIVED includes all interest received on factory account on loans, whether short term or long term, irrespective of the duration and the nature of agency to which the loan was given. Interest received from partners and proprietors on capital or loan are excluded. 2.14 WORKERS are defined to include all persons employed directly or through any agency whether for wages or not and engaged in any manufacturing process or in cleaning any part of the machinery or premises used for manufacturing process or in any other kind of work incidental to or connected with the manufacturing process or the subject of the manufacturing process. Labour engaged in the repair and maintenance or production of fixed assets for factory’s own use or labour employed for generating electricity or producing coal, gas etc. are included. 2.15 EMPLOYEES include all workers defined above and persons receiving wages and holding supervisory or managerial positions engaged in administrative office, store keeping section and welfare section, sales department as also those engaged in purchase of raw materials etc. or purchase of fixed assets for the factory and watch and ward staff. 2.16 TOTAL PERSONS ENGAGED include the employees as defined above and all working proprietors and their family members who are actively engaged in the work of the factory even without any pay and the unpaid members of the co-operative societies who worked in or for the factory in any direct and productive capacity. The number of workers or employees is an average number obtained by dividing mandays worked by the number of days the factory had worked during the reference year. 2.17 MANDAYS represent the total number of days worked and the number of days paid for during the accounting year .It is obtained by summing-up the number of persons of specified categories attending in each shift over all the shifts worked on all days. 2.18 WAGES AND SALARIES are defined to include all remuneration in monetary terms and also payable more or less regularly in each pay period to workers as compensation for work done during the accounting year. It includes (a) direct wages and salary (i.e., basic wages/salaries, payment of overtime, dearness, compensatory, house rent and other allowances) (b) remuneration for the period not worked (i.e., basic wages, salaries and allowances payable for leave period, paid holiday, lay- off payments and
4
compensation for unemployment, if not paid from sources other than employers) (c) bonus and ex-gratia payment paid both at regular and less frequent intervals (i.e., incentive bonuses, productive bonuses, profit sharing bonuses, festival or year-end bonuses etc.) It excludes lay off payments which are made from trust or other special funds set up exclusively for this purpose i.e., payments not made by the employer. It also excludes imputed value of benefits in kind, employer's contribution to old age benefits and other social security charges, direct expenditure on maternity benefits crèches and other group benefits Traveling and other expenditure incurred for business purposes and reimbursed by the employer are excluded. The wages are expressed in terms of gross value i.e., before deduction for fines, damages, taxes, provident fund, employee's state insurance contribution etc. 2.19. CONTRIBUTION TO PROVIDENT FUND AND OTHER FUNDS includes old age benefits like provident fund pension, gratuity etc. and employers contribution towards other social security charges such as employees state insurance, compensation for work injuries and occupational diseases, provident fund- linked insurance, retrenchment and lay- off benefits. 2.20. WORKMEN AND STAFF WELFARE EXPENSES include group benefits like direct expenditure on maternity, crèches, canteen facilities, educational, cultural recreational facilities, and grants to trade unions, co-operative stores etc. meant for employees. 2.21. TOTAL EMOLUMENTS is defined as the sum of wages and salaries, employers contribution as provident fund and other funds and workmen and staff welfare expenses as defined above. 2.22. FUELS CONSUMED represent total purchase value of all items of fuels such as coal, liquefied petroleum gas, petrol, diesel, electricity, lubricants, water etc. consumed by the factory during the accounting year but excluding the items which directly enter into the manufacturing process. 2.23. MATERIALS CONSUMED represent the total delivered value of all items of raw materials, components, chemicals, packing materials and stores which actually enter into the production process of the factory during the accounting year. It also includes the cost of all materials used for the construction of building etc. for the factory's own use .It, however, excludes all intermediate products consumed during the accounting year. Intermediate products are those products, which are produced by the factory but are subject to further manufacturing. 2.24. EX-FACTORY VALUE of all products and by-products manufactured is attained at the rate of net sale-value (inclusive of subsidies etc.) with respect to each of the items. 2.25. TOTAL INPUT comprises total value of fuels, materials consumed as well as expenditures such as cost of contract and commission work done by others on materials supplied by the factory, cost of materials consumed for repair and maintenance of factory’s fixed assets including cost of repairs and maintenance, work done by others to the factory's fixed assets, inward freight and transport charges, rate and taxes (excluding income tax), postage, telephone and telex expenses, insurance charges, banking charges, cost of printing and stationery and purchase value of goods sold in the same condition as purchased. Rent paid and interest paid is not included. 2.26. TOTAL OUTPUT comprises total ex-factory value of products and by-products manufactured as well as other receipts from non industrial services rendered to others, work done for others on material supplied by them, value of electricity produced and sold, sale value of goods sold in the same
5
conditions purchased, addition in stock of semi- finished goods and value of own construction. Rent received and interest received is not being included from ASI 2001-02. 2.27. DEPRECIATION is consumption of fixed capital due to wear and tear and obsolescence during the accounting year and is taken as provided by the factory owner or is estimated on the basis of cost of installation and working life of the fixed assets. 2.28. NET VALUE ADDED is arrived by deducting total input and depreciation from total output. 2.29. COMPONENTS AND ACCESSORIES CONSUMED are the portion of materials consumed and shown separately to represent as a special type of consumption. 2.30. IMPORTED MATERIALS CONSUMED ON ACTUAL USE comprise the portion of materials consumed that are imported from other countries. It may be raw materials or fuels or components and accessories of the input basket. 2.31. SEMI-FINISHED GOODS refer to the imputed value of all materials which have been partially processed by the factory but which are not usually sold without further processing. It includes the work in progress for materials supplied by others, but excludes the value of semi- finished fixed assets produced for factory's own use. 2.32. FINISHED GOODS of the factory are the ultimate products ready for sale. It does not require further processing but needs packaging and labeling etc.

6
CHAPTER – THREE
PRINCIPAL CHARACTERISTICS BY MAJOR INDUSTRIAL ACTIVITY
3.1 Principal Aggregates :The distribution of some of the selected aggregates in absolute and percentage terms by the manufacturing and other sector of industrial activity in Goa covered by the Annual Survey of Industries, (ASI) 2004-05 compared with 2003-04 are given below :
TABLE NO. 3.1
Principal Characteristics by Major Economic Activity
Manufacturing Others All Principal Characteristics Unit
2003-04 2004-05 2003-04 2004-05 2003-04 2004-05 1 2 3 4 5 6 7 8
Number 534 500 15 18 549 518 Factories
(%) (97) (97) (3) (3) (100) (100) Rs. in crore 3563 3995 176 162 3739 4157 Fixed Capital
(%) (95) (96) (5) (4) (100) (100) Rs. in crore 5310 6048 188 174 5498 6222 Invested Capital
(%) (97) (97) (3) (3) (100) (100) Number 24601 27617 411 802 25012 28419 Workers
(%) (98) (97) (2) (3) (100) (100) Total persons Number 33923 36622 534 959 34457 37581 engaged (%) (98) (97) (2) (3) (100) (100) Wages to Rs. in crore 171 208 2 3 173 211 workers (%) (99) (99) (1) (1) (100) (100)
Rs. in crore 334 501 6 8 340 509 Total Emoluments (%) (98) (98) (2) (2) (100) (100)
Rs. in crore 8836 11875 146 163 8992 12038 Input (%) (98) (99) (2) (1) (100) (100)
Rs. in crore 11428 15221 192 202 11620 15423 Gross Output (%) (98) (99) (2) (1) (100) (100)
Rs. in crore 332 394 18 20 350 414 Depreciation (%) (95) (95) (5) (5) (100) (100)
Rs. in crore 2259 2952 29 19 2288 2971 Net Value Added (%) (99) (99) (1) (1) (100) (100)
Rs. in crore 1985 2690 26 19 2011 2709 Net Income (%) (99) (99) (1) (1) (100) (100)
Figures in bracket indicate percentages.
7
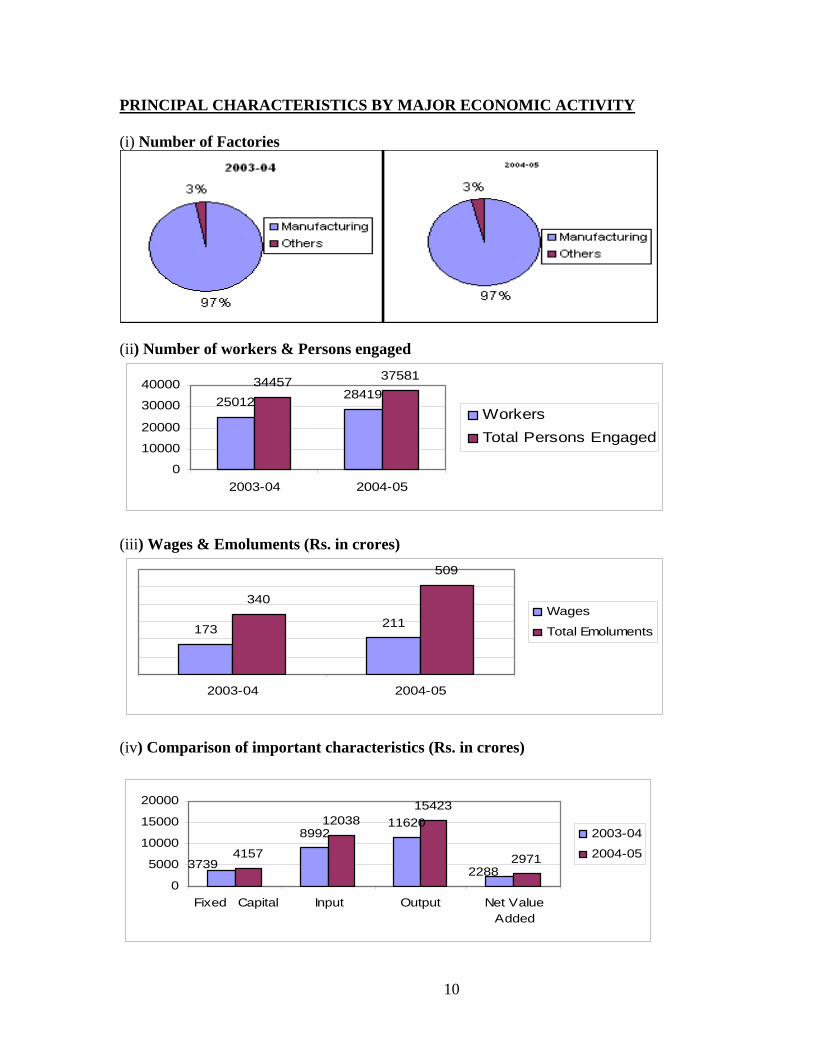
3.2 The number of factory units covered under the Annual Survey of Industries during 2003-04 was 549 as compared to 518 units during 2004-05. It is observed from Table 3.1 that 534 factory units engaged in the manufacturing activities in the year 2003-04 are decreased to 500 in 2004-05. However the units covered under other industrial activities were increased from 15 in 2003-04 to 18 in 2004-05.
3.3 The share of manufacturing sector in the total fixed capital has increased from 95%(Rs.3563 Crores) during 2003-04 to 96%(Rs.3995 Crores) during 2004-05.The percentage of fixed capital accounted for by the factories covered under other group of industries was 5% and 4% during 2003-04 and 2004-05 respectively. The number of workers employed were 98% & 97% each during both the years and were paid 99% of wages during both the years in the manufacturing sector. The Gross output produced under manufacturing sector was valued at Rs.11428 crore & Rs.15221 crore or 98% and 99% during the respective years considered for survey. Contribution of Net Value Added by manufacture was Rs.2259 crore and Rs.2952 crore (both 99%) of the respective totals during both the years. The percentage growth during 2004-05 over 2003-04 in respect of important characteristics is exhibited in table 3.2 below.
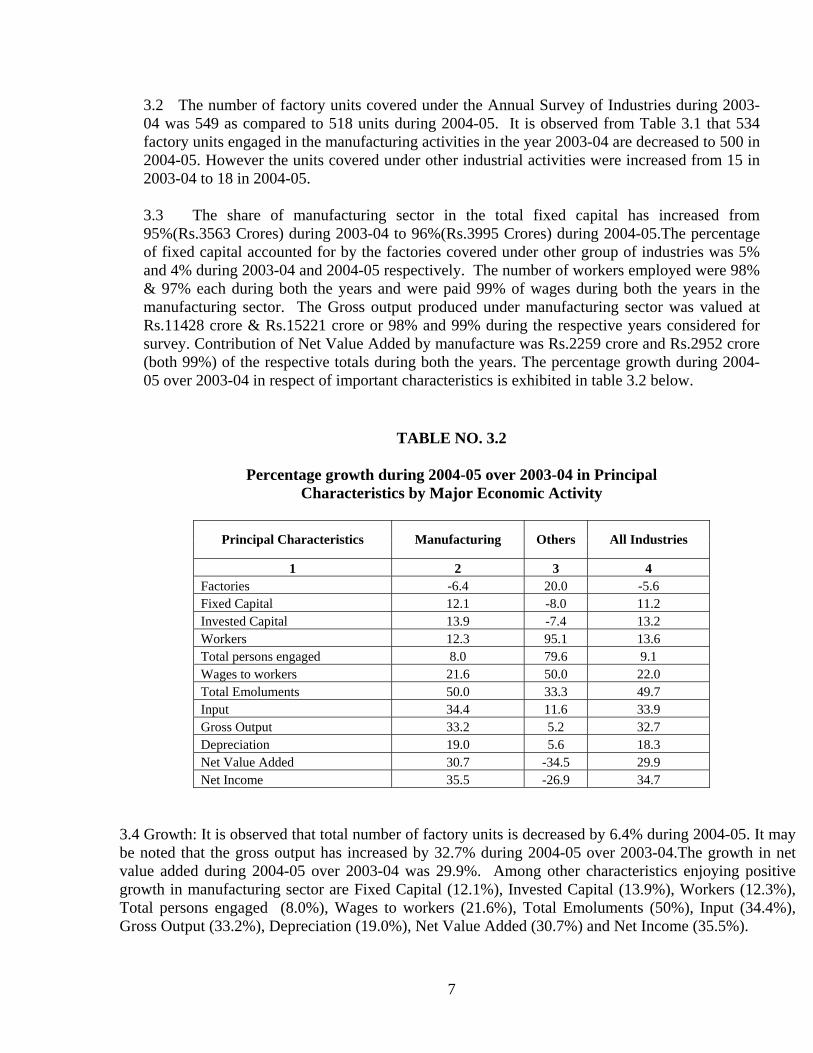
TABLE NO. 3.2
Percentage growth during 2004-05 over 2003-04 in Principal Characteristics by Major Economic Activity
Principal Characteristics Manufacturing Others All Industries
1 2 3 4 Factories -6.4 20.0 -5.6 Fixed Capital 12.1 -8.0 11.2 Invested Capital 13.9 -7.4 13.2 Workers 12.3 95.1 13.6 Total persons engaged 8.0 79.6 9.1 Wages to workers 21.6 50.0 22.0 Total Emoluments 50.0 33.3 49.7 Input 34.4 11.6 33.9 Gross Output 33.2 5.2 32.7 Depreciation 19.0 5.6 18.3 Net Value Added 30.7 -34.5 29.9 Net Income 35.5 -26.9 34.7
3.4 Growth: It is observed that total number of factory units is decreased by 6.4% during 2004-05. It may be noted that the gross output has increased by 32.7% during 2004-05 over 2003-04.The growth in net value added during 2004-05 over 2003-04 was 29.9%. Among other characteristics enjoying positive growth in manufacturing sector are Fixed Capital (12.1%), Invested Capital (13.9%), Workers (12.3%), Total persons engaged (8.0%), Wages to workers (21.6%), Total Emoluments (50%), Input (34.4%), Gross Output (33.2%), Depreciation (19.0%), Net Value Added (30.7%) and Net Income (35.5%).

8
TABLE NO. 3.3
Structural Ratios and Technical Coefficients by Major Economic Activity
Manufacturing Others All Item Unit 2003-
04 2004-
05 2003-
04 2004-
05 2003-
04 2004-
05 1 2 3 4 5 6 7 8
Structural Ratios Rs. in Fixed capital per
factory lakh 667.2 799.0 1173.3 900.0 681.1 802.5
Gross output per Rs. in factory lakh
2140.1 3044.2 1280.0 1122.2 2116.6 2977.4
Net value added per Rs. in factory lakh
423.0 590.4 193.3 105.6 416.8 573.6
Workers per factory
Number 46 55 27 45 46 55
Persons engaged per factory
Number 64 73 36 53 63 73
Fixed capital per Rs. in person engaged lakh
10.5 10.9 33.0 16.9 10.9 11.1
Gross output per Rs. in person engaged lakh
33.7 41.6 36.0 21.1 33.7 41.0
Net value added per Rs. in person engaged lakh
6.7 8.1 5.4 2.0 6.6 7.9
Total emoluments Rs. in per person engaged lakh
1.0 1.4 1.1 0.8 1.0 1.4
Wages per Rs. in worker lakh
0.7 0.8 0.5 0.4 0.7 0.7
Technical Coefficient Fixed capital to Net value added
1.58 1.35 6.07 8.53 1.63 1.40
Fixed capital to Gross output
0.31 0.26 0.92 0.80 0.32 0.27
Net value added to Gross output
0.20 0.19 0.15 0.09 0.20 0.19
Total emoluments to Net value added
0.15 0.17 0.21 0.42 0.15 0.14
3.5 Some technical structural ratios/coefficients: Above table reveals certain important structural ratios and coefficients which are the basic structure of the contribution to the economy. 3.6 The fixed capital utilized by each factory unit in case of all the activities and that under manufacturing sector, which also forms the major sector, works out to the value of Rs.681. lakh and Rs802.5 lakh and Rs.667.2 lakh and Rs. 799 lakh respectively during 2003-04 & 2004-05. The ratio of Net value added per factory shows an upward trend in the year 2004-05 as compared to 2003-04 under manufacturing sector but it has declined under “Others category”. Workers per factory have increased from 46 in 2003-04 to 55 in 2004-05. Gross Output & Net value added per person engaged shows an

9
increasing trend in manufacturing sector but depicts contra results in other group of industries. Average wages per worker per annum works out to Rs.70 thousand for both the years in respect of all activities. It can be seen that the coefficient of fixed capital to net value added stood at 1.63 and 1.40 as far as all activities are concerned for both years. The coefficient of Fixed Capital to Gross Output has declined from 0.32 in 2003-04 to 0.27 in 2004-05.However, the decline in the coefficient of net value added to gross output during 2004-05 over 2003-04 was marginal.
10
PRINCIPAL CHARACTERISTICS BY MAJOR ECONOMIC ACTIVITY (i) Number of Factories
(ii) Number of workers & Persons engaged
25012 2841934457 37581
0
10000
20000
30000
40000
2003-04 2004-05
WorkersTotal Persons Engaged
(iii) Wages & Emoluments (Rs. in crores)
173 211
340
509
2003-04 2004-05
Wages
Total Emoluments
(iv) Comparison of important characteristics (Rs. in crores)
899211620
4157
1203815423
297122883739
0
5000
10000
15000
20000
Fixed Capital Input Output Net ValueAdded
2003-04
2004-05

11
CHAPTER – FOUR
DISTRIBUTION OF FACTORIES BY SIZE OF EMPLOYMENT
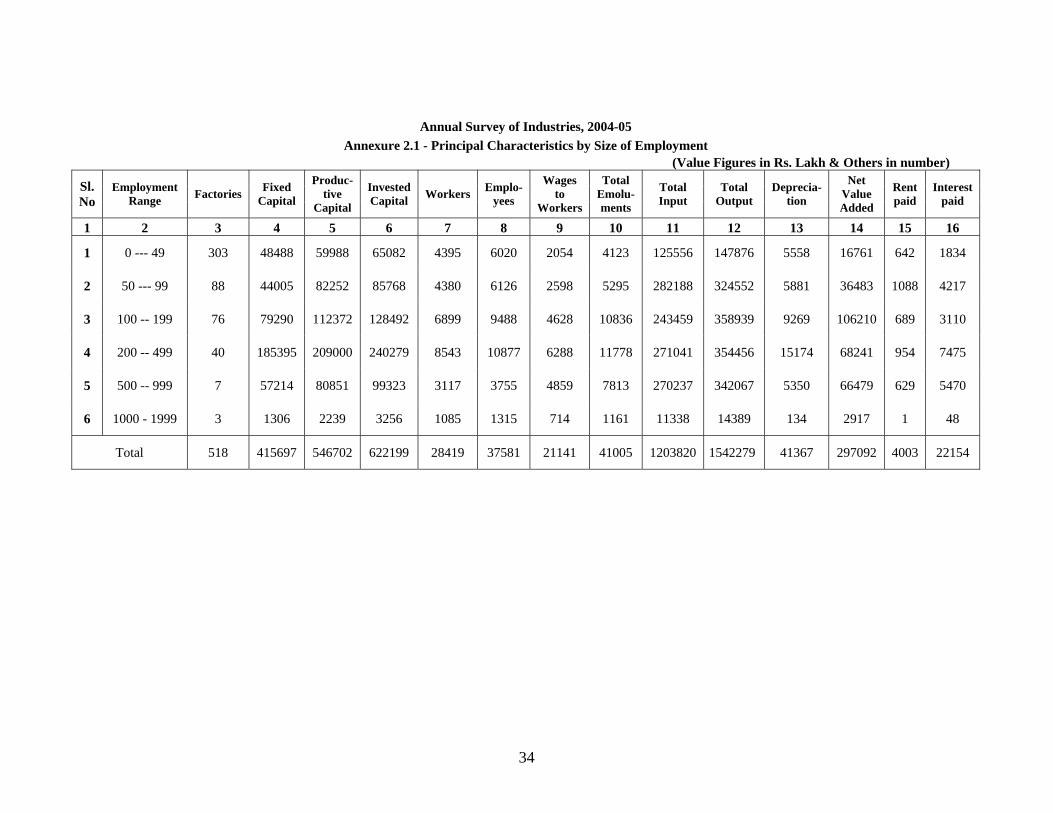
4.1 Table 4.1 reveal the distribution of factories in absolute and percentage terms, by employment range groups as regards certain selected characteristics associated with them. The results for the year 2004-05 are compared with the previous year figures indicating particular percentages.
Figures in bracket indicate percentages. Out of the total number of 518 factories canvassed during 2004-05, factory units employing less than 50 persons were found to be covering 58% or 303 units of the total and this coverage is less by three percentage points as compared to 2003-04. The units employing persons between 200-499 were found leading in utilization of fixed capital i.e. 45% and provided employment to the workers to the tune of 30%. 23% of the Gross output was recorded as the highest yield of the factory units that classified under the ranges 100-199, 200-499 and 500 & above while the factories in the range of 100-199 generated highest percentage of Net value added during the year in consideration which was worth 36% of the total.
TABLE NO. 4.1
Distribution of factories by size of employment (Rs. in crores)
Factories Fixed Workers Gross Net value (Number) Capital (Number) Output added Employment
range 2003-04
2004-05
2003-04
2004-05
2003-04
2004-05
2003-04
2004-05
2003-04
2004-05
1 2 3 4 5 6 7 8 9 10 11 0-49 335 303 523 485 4899 4395 1386 1479 194 168 (%) (61) (58) (14) (12) (20) (15) (12) (10) (8) (6) 50-99 109 88 735 440 5683 4380 2657 3246 475 365 (%) (20) (17) (20) (11) (23) (15) (23) (21) (21) (12) 100-199 67 76 680 793 5701 6899 2632 3589 736 1062 (%) (12) (15) (18) (19) (23) (24) (23) (23) (32) (36) 200-499 31 40 1383 1854 5793 8543 2628 3545 607 682 (%) (6) (8) (37) (45) (23) (30) (23) (23) (27) (23) 500 & above 7 10 417 585 2936 4202 2317 3565 274 694 (%) (1) (2) (11) (14) (12) (15) (20) (23) (12) (23) Total 549 518 3748 4157 25012 28419 11620 15423 2288 2971 (%) (100) (100) (100) (100) (100) (100) (100) (100) (100) (100)
12
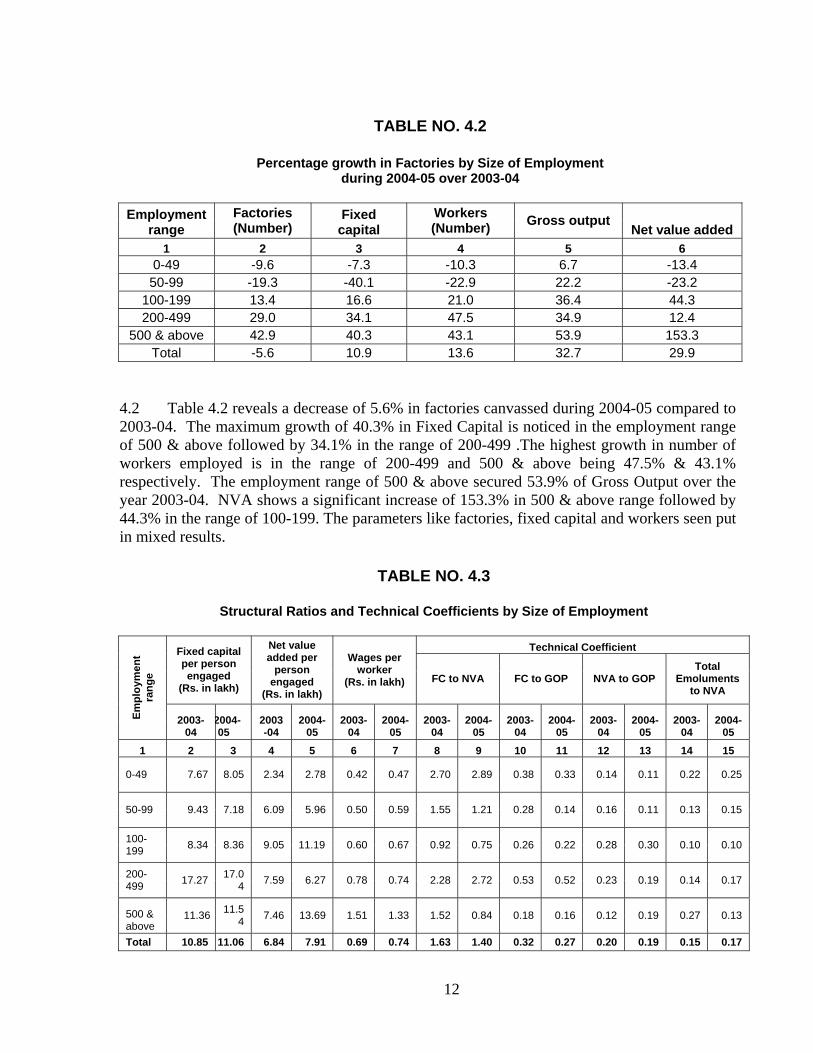
4.2 Table 4.2 reveals a decrease of 5.6% in factories canvassed during 2004-05 compared to 2003-04. The maximum growth of 40.3% in Fixed Capital is noticed in the employment range of 500 & above followed by 34.1% in the range of 200-499 .The highest growth in number of workers employed is in the range of 200-499 and 500 & above being 47.5% & 43.1% respectively. The employment range of 500 & above secured 53.9% of Gross Output over the year 2003-04. NVA shows a significant increase of 153.3% in 500 & above range followed by 44.3% in the range of 100-199. The parameters like factories, fixed capital and workers seen put in mixed results.
TABLE NO. 4.3
Structural Ratios and Technical Coefficients by Size of Employment
Technical Coefficient Fixed capital per person engaged
(Rs. in lakh)
Net value added per
person engaged
(Rs. in lakh)
Wages per worker
(Rs. in lakh) FC to NVA FC to GOP NVA to GOP Total
Emoluments to NVA
Empl
oym
ent
rang
e
2003-04
2004-05
2003-04
2004-05
2003-04
2004-05
2003-04
2004-05
2003-04
2004-05
2003-04
2004-05
2003-04
2004-05
1 2 3 4 5 6 7 8 9 10 11 12 13 14 15
0-49 7.67 8.05 2.34 2.78 0.42 0.47 2.70 2.89 0.38 0.33 0.14 0.11 0.22 0.25
50-99 9.43 7.18 6.09 5.96 0.50 0.59 1.55 1.21 0.28 0.14 0.16 0.11 0.13 0.15
100-199 8.34 8.36 9.05 11.19 0.60 0.67 0.92 0.75 0.26 0.22 0.28 0.30 0.10 0.10
200-499 17.27 17.0
4 7.59 6.27 0.78 0.74 2.28 2.72 0.53 0.52 0.23 0.19 0.14 0.17
500 & above
11.36 11.54 7.46 13.69 1.51 1.33 1.52 0.84 0.18 0.16 0.12 0.19 0.27 0.13
Total 10.85 11.06 6.84 7.91 0.69 0.74 1.63 1.40 0.32 0.27 0.20 0.19 0.15 0.17
TABLE NO. 4.2
Percentage growth in Factories by Size of Employment during 2004-05 over 2003-04
Employment
range Factories (Number)
Fixed capital
Workers (Number) Gross output
Net value added 1 2 3 4 5 6
0-49 -9.6 -7.3 -10.3 6.7 -13.4 50-99 -19.3 -40.1 -22.9 22.2 -23.2
100-199 13.4 16.6 21.0 36.4 44.3 200-499 29.0 34.1 47.5 34.9 12.4
500 & above 42.9 40.3 43.1 53.9 153.3 Total -5.6 10.9 13.6 32.7 29.9
13
Structural ratios and technical coefficient : Table 4.3 denotes certain important ratios and coefficient. The average least value of fixed capital utilized during 2004-05 in the range of 50-99 is Rs.7.18 lakh and highest in the range of 200-499 is Rs.17.04 lakh. Highest value of NVA of Rs.13.69 lakh per persons engaged among all the employment ranges was generated in the employment range employing 500 & above and also highest average wage remuneration was paid in the same employment range i.e. Rs.1.33 lakh during the year 2004-05. The Net value added co-efficient measured by value of Fixed Capital required to generate each rupee of net value added i.e. (FC to NVA) varies from a low value of 0.75 among factories of employment size class 100-199 to a high value of 2.89 in case of factories employing persons below 49 in the year 2004-05, while FC to Gross Output ranged from 0.14 to 0.52 among the factories employment range class of 50-99 and 200-499 respectively during the year 2004-05. The value of NVA to Gross output is highest in group100-199. Total emoluments to NVA resulted are observed ranging between 0.10 to 0.25 in employment range 100-199 and below 50 respectively, in other words 10% to 25% of NVA generated was disbursed as emoluments as least and highest remuneration during the current year in the whole set up.

14
DISTRIBUTION OF FACTORIES BY SIZE OF EMPLOYMENT (i) Number of factories
335
109
303
88 76
1067
73140
050
100150200250300350400
0-4950-99
100-199
200-499
500 & above
Factories(Number) 2003-04Factories(Number) 2004-05
(ii) Fixed Capital (Rs. in crores)
735 793
1854
585417
1383
680523 440485
0500
100015002000
0-49
50-99
100-1
99
200-4
99
500 &
abov
e
Fixed Capital(Number) 2003-04Fixed Capital(Number) 2004-05
15
CHAPTER – FIVE
DISTRIBUTION OF FACTORIES BY SIZE OF CAPITAL
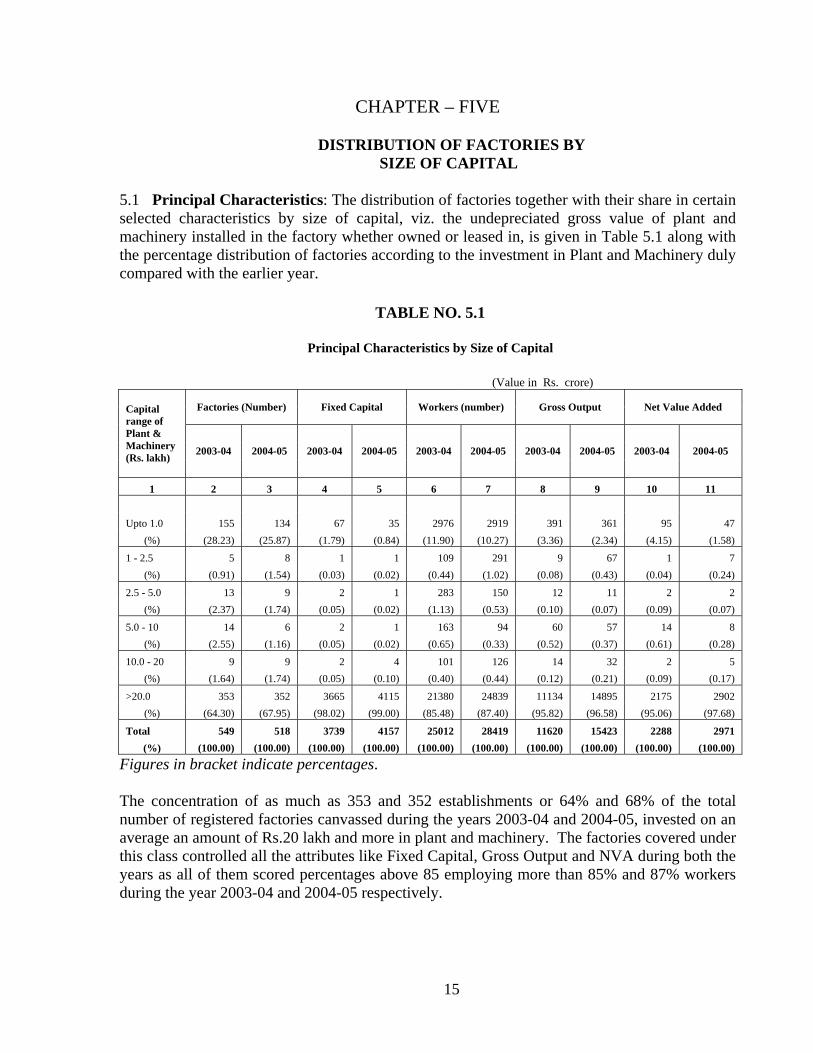
5.1 Principal Characteristics: The distribution of factories together with their share in certain selected characteristics by size of capital, viz. the undepreciated gross value of plant and machinery installed in the factory whether owned or leased in, is given in Table 5.1 along with the percentage distribution of factories according to the investment in Plant and Machinery duly compared with the earlier year.
TABLE NO. 5.1
Principal Characteristics by Size of Capital
(Value in Rs. crore)
Factories (Number) Fixed Capital Workers (number) Gross Output Net Value Added Capital range of Plant & Machinery (Rs. lakh) 2003-04 2004-05 2003-04 2004-05 2003-04 2004-05 2003-04 2004-05 2003-04 2004-05
1 2 3 4 5 6 7 8 9 10 11 Upto 1.0 155 134 67 35 2976 2919 391 361 95 47
(%) (28.23) (25.87) (1.79) (0.84) (11.90) (10.27) (3.36) (2.34) (4.15) (1.58)
1 - 2.5 5 8 1 1 109 291 9 67 1 7 (%) (0.91) (1.54) (0.03) (0.02) (0.44) (1.02) (0.08) (0.43) (0.04) (0.24)
2.5 - 5.0 13 9 2 1 283 150 12 11 2 2 (%) (2.37) (1.74) (0.05) (0.02) (1.13) (0.53) (0.10) (0.07) (0.09) (0.07)
5.0 - 10 14 6 2 1 163 94 60 57 14 8 (%) (2.55) (1.16) (0.05) (0.02) (0.65) (0.33) (0.52) (0.37) (0.61) (0.28)
10.0 - 20 9 9 2 4 101 126 14 32 2 5 (%) (1.64) (1.74) (0.05) (0.10) (0.40) (0.44) (0.12) (0.21) (0.09) (0.17)
>20.0 353 352 3665 4115 21380 24839 11134 14895 2175 2902 (%) (64.30) (67.95) (98.02) (99.00) (85.48) (87.40) (95.82) (96.58) (95.06) (97.68)
Total 549 518 3739 4157 25012 28419 11620 15423 2288 2971 (%) (100.00) (100.00) (100.00) (100.00) (100.00) (100.00) (100.00) (100.00) (100.00) (100.00)
Figures in bracket indicate percentages. The concentration of as much as 353 and 352 establishments or 64% and 68% of the total number of registered factories canvassed during the years 2003-04 and 2004-05, invested on an average an amount of Rs.20 lakh and more in plant and machinery. The factories covered under this class controlled all the attributes like Fixed Capital, Gross Output and NVA during both the years as all of them scored percentages above 85 employing more than 85% and 87% workers during the year 2003-04 and 2004-05 respectively.
16
These factories in the capital range of Rs.20.00 lakh and above utilized fixed capital worth Rs.3665crore and Rs.4115crore (98% and 99% each) of the total, which provided employment to 21380 and 24839 (85% & 87%) of all the workers engaged i.e. 25012 & 28419 for the year 2003-04 & 2004-05 respectively. The contribution of the factories of above 20 lakh capital range towards gross output and net value added by manufacture were of the tune of Rs.11134 crore and Rs.14895 crore or 96% & 97% and Rs.2175 crore or 95% and Rs.2902 crore or 98% respectively during the years compared and thereby controlled the whole set up. As against these, factories with gross investment in plant & machinery up to Rs.1.00 lakh which stood next covered 155 and 134 (28% and 26%) factories in number, used about Rs.67 crore and Rs.35 crore (2% & 0.84%) of the fixed capital. Further this group engaged 2976 and 2919 of the total workforce, it produced goods and services worth Rs.391 crore & Rs.361 crore of the total gross output and contributed Rs.95 crore & Rs.47 crore respectively of the total net value added by manufacture. The lowest numbers of factories covered during 2003-04 were noticed in the capital range 1 – 2.5 lakh and were 5 or 1% & 6 or 1% in the capital range group’s 5-10 lakh during 2004-05. The lowest fixed capital of Rs1.00crores (0.03%) was found in the capital range of 1-2.5 during 2003-04 and it was Rs. 1.00 crore (0.02%) in the capital range of 1-2.5, 2.5-5.0, and 5.0-10.0 during 2004-05. The least number of workers employed were 101 and 94 workers in the capital range 10-20 and 5-10 lakh respectively in the current and earlier year who produced goods/services of the value of Rs.14 crore & Rs.57 crore contributing to the net income in the form of Net value added of the order of Rs.2 crore & Rs.8 crore of the total Net Value added during the years 2003-04 and 2004-05.
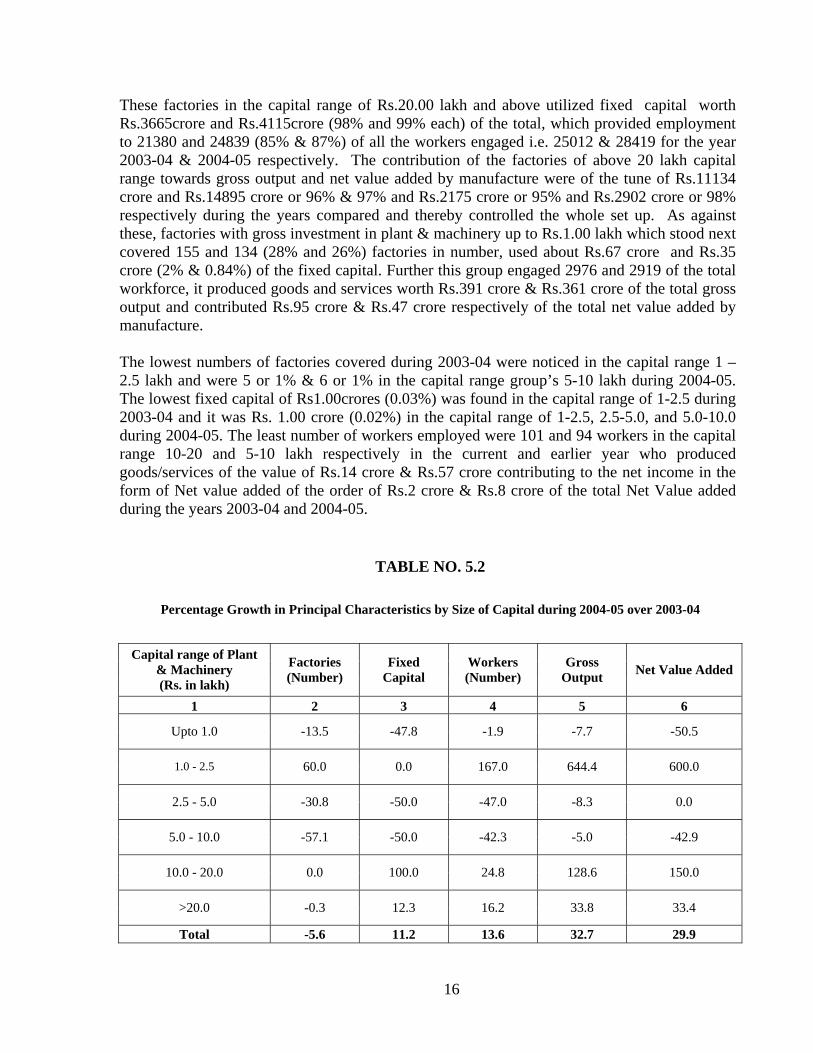
TABLE NO. 5.2
Percentage Growth in Principal Characteristics by Size of Capital during 2004-05 over 2003-04
Capital range of Plant
& Machinery (Rs. in lakh)
Factories (Number)
Fixed Capital
Workers (Number)
Gross Output Net Value Added
1 2 3 4 5 6
Upto 1.0 -13.5 -47.8 -1.9 -7.7 -50.5
1.0 - 2.5 60.0 0.0 167.0 644.4 600.0
2.5 - 5.0 -30.8 -50.0 -47.0 -8.3 0.0
5.0 - 10.0 -57.1 -50.0 -42.3 -5.0 -42.9
10.0 - 20.0 0.0 100.0 24.8 128.6 150.0
>20.0 -0.3 12.3 16.2 33.8 33.4
Total -5.6 11.2 13.6 32.7 29.9

17
5.2 Table 5.2 exhibits the growth in canvassed factories during 20004-05 over the previous year in terms of factories with gross investment in plant and machinery. Factories investing in plant and machinery between Rs.1 – 2.5 lakh have increased during 2004-05 by 60% and in all other ranges there was decline in the number of factories The additional fixed capital installed was of the order of 100% over the year 2003-04 followed by 12.3% observed in the range of 10-20lakhs and > 20lakhs group investment respectively. Gross output grew by 644.4% in capital range 1 to 2.5lakhs, as, also maximum growth in NVA i.e. 600% is observed in these factories investing in plant and machinery. The growth in NVA varied from -50.5% to 600% over the different capital ranges of investment in Plant and Machinery with average growth for all the units registering at 29.9%. 5.3 Structural Ratios and Technical Coefficients : Table 5.3 below reveals structural ratios and technical coefficient of factories, classified by size of capital invested in plant and machinery.
TABLE NO. 5.3
Structural Ratios and Technical Coefficients by Size of Capital
Technical Coefficient Fixed capital per person
engaged (Rs. in lakh)
Net value added per
person engaged
(Rs. in lakh)
Wages per worker
(Rs. in lakh) FC to NVA FC to GOP NVA to GOP Total
Emoluments to NVA
Capital range of Plant &
Machinery (Rs.)
2003-04
2004-05
2003-04
2004-05
2003-04
2004-05
2003-04
2004-05
2003-04
2004-05
2003-04
2004-05
2003-04
2004-05
1 2 3 4 5 6 7 8 9 10 11 12 13 14 15
Upto 1.0 1.76 0.97 2.5 1.30 0.29 0.31 0.71 0.74 0.17 0.10 0.24 0.13 0.16 0.30
1.0 - 2.5 0.45 0.31 0.65 2.12 0.23 0.23 0.70 0.15 0.06 0.02 0.09 0.11 0.51 0.15
2.5 - 5.0 0.52 0.84 0.6 1.22 0.37 0.37 0.89 0.69 0.14 0.14 0.15 0.20 0.56 0.35
5.0 - 10.0 0.97 0.55 5.9 6.56 0.61 0.34 0.16 0.08 0.04 0.01 0.23 0.15 0.07 0.07
10.0 - 20.0 1.7 2.30 1.24 3.19 0.55 0.31 1.38 0.72 0.17 0.12 0.12 0.17 0.36 0.14
>20.0 12.2 12.40 7.29 8.74 0.76 0.75 1.69 1.42 0.33 0.28 0.20 0.19 0.15 0.14
Total 10.85 11.06 6.64 7.91 0.69 0.74 1.63 1.40 0.32 0.27 0.20 0.19 0.15 0.14
The lowest and the highest ratio for Fixed Capital per person engaged during 2003-04 was Rs.0.45 lakh and Rs.12.20 lakh in the capital range of 1 – 2.5 and >20 lakh respectively, while during 2004-05 it was between Rs.0.31 lakh to Rs.12.40 lakh over the same capital ranges. The Net value added contributed by each person engaged was as high as Rs.7.29 lakh and Rs.8.74
18
lakh in the factories of investment in the capital range of Plant and Machinery above Rs.20 lakh for the year 2003-04 and 2004-05 respectively and the lowest being Rs.0.60lakh and Rs.1.22lakh respectively in the capital range of 2.5-10.0 in both the years. The workers employed in the capital range of investment Rs.20.0lakh & above were paid average highest remuneration to the tune of Rs.76000 and Rs.75000 per annum during the respective years, average remuneration of all the capital ranges being Rs.69 thousand and Rs.74 thousand respectively for the years under consideration. As far as co-efficient is concerned, least Fixed Capital utilized to generate Net Value Added worth a rupee noted during 2003-04 and 2004-05 is 0.16 and 0.08 in the capital range 5 to 10 lakhs during both the years. However, the highest is in the range of Rs.20.0 lakh and above in both the years. Highest Fixed Capital utilized to produce Gross Output is 0.28 and the least is 0.01 which falls in the range of >20.0 and 5-10 respectively for the year 2004-05. The Highest NVA to GOP is in the range of Rs 2.5 – 10.0 i.e. 0.20 and lowest is in the range of Rs.1.0 – 2.5 is 0.11, for the current year.

19
PRINCIPAL CHARACTERISTICS BY SIZE OF CAPITAL (i) Number of Workers
163291 126
24839
101283
109
2976
21380
94150
2919
0
5000
10000
15000
20000
25000
30000
Upto 1.0 1-2.5 2.5-5.0 5.0-10 10.0-20 >20.0
Workers 2003-04
Workers 2004-05
(ii) Gross Output (Rs. in crores)
391 12 6067
14895
11134
14932
57113610
2000
4000
6000
8000
10000
12000
14000
16000
Upto 1.0 1-2.5 2.5-5.0 5.0-10 10.0-20 >20.0
Gross Output2003-04Gross Output2004-05
20
CHAPTER – SIX
DISTRIBUTION OF FACTORIES BY
TYPE OF OWNERSHIP
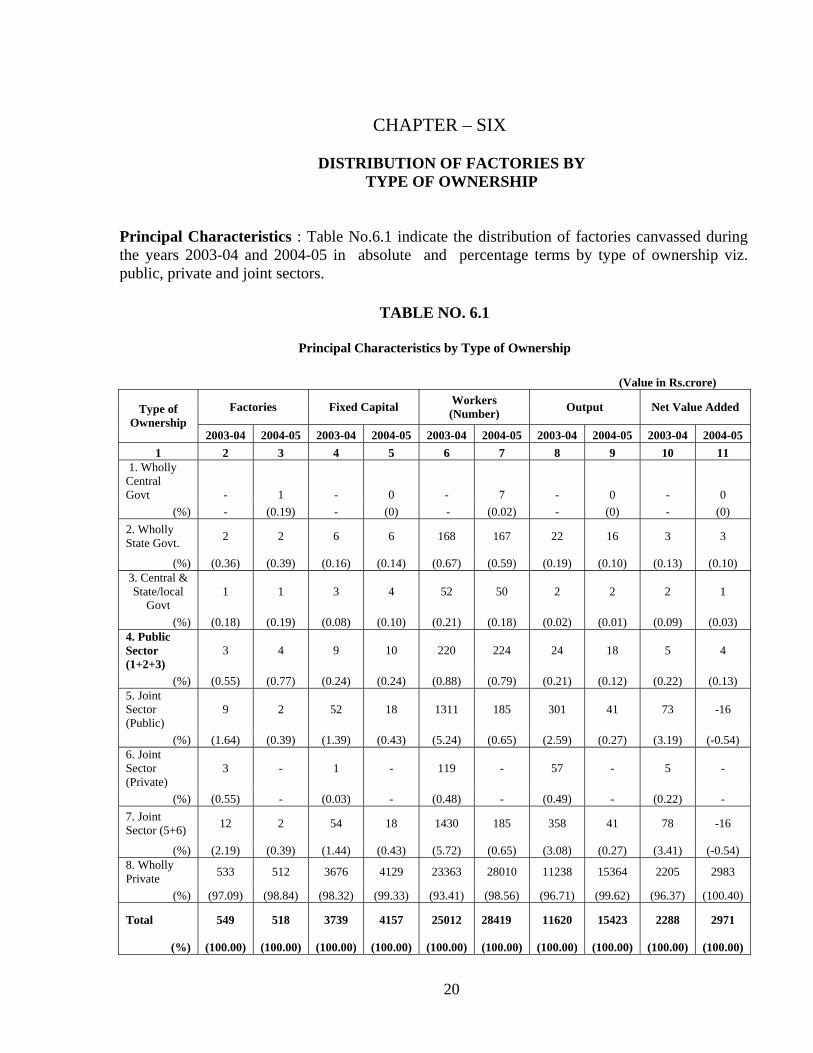
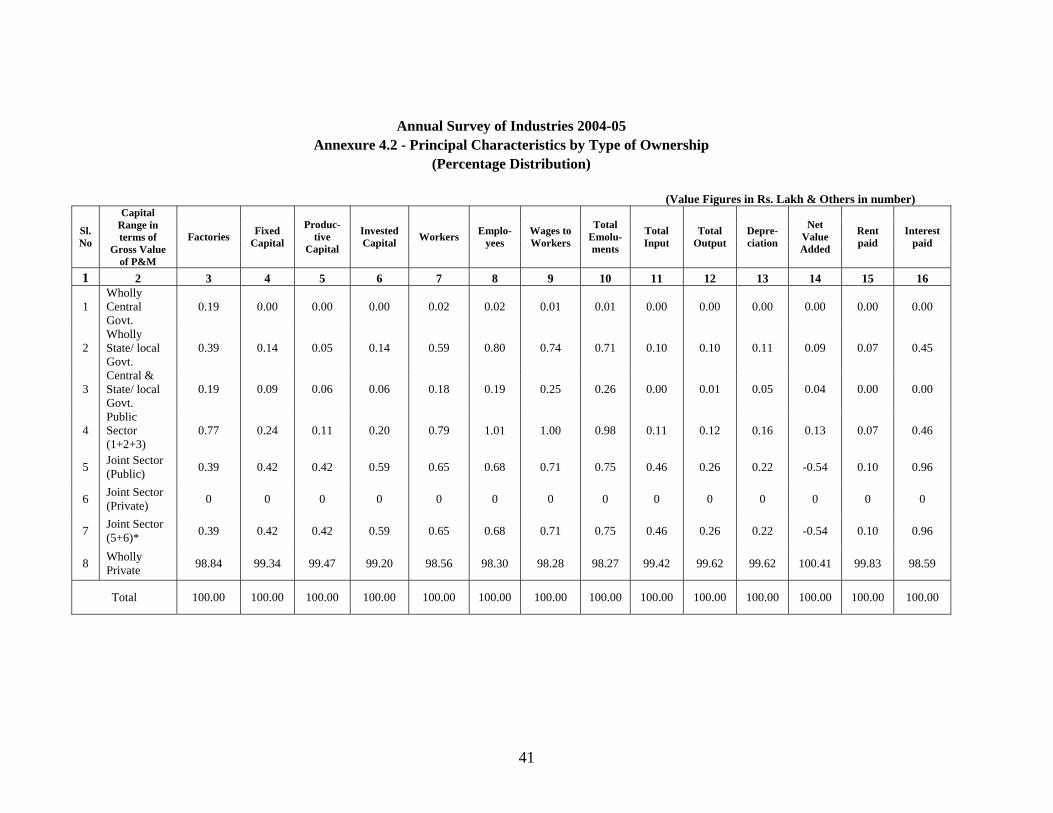
Principal Characteristics : Table No.6.1 indicate the distribution of factories canvassed during the years 2003-04 and 2004-05 in absolute and percentage terms by type of ownership viz. public, private and joint sectors.
TABLE NO. 6.1
Principal Characteristics by Type of Ownership (Value in Rs.crore)
Factories Fixed Capital Workers (Number) Output Net Value Added Type of
Ownership 2003-04 2004-05 2003-04 2004-05 2003-04 2004-05 2003-04 2004-05 2003-04 2004-05
1 2 3 4 5 6 7 8 9 10 11 1. Wholly Central Govt - 1 - 0 - 7 - 0 - 0
(%) - (0.19) - (0) - (0.02) - (0) - (0) 2. Wholly State Govt. 2 2 6 6 168 167 22 16 3 3
(%) (0.36) (0.39) (0.16) (0.14) (0.67) (0.59) (0.19) (0.10) (0.13) (0.10) 3. Central & State/local
Govt 1 1 3 4 52 50 2 2 2 1
(%) (0.18) (0.19) (0.08) (0.10) (0.21) (0.18) (0.02) (0.01) (0.09) (0.03) 4. Public Sector (1+2+3)
3 4 9 10 220 224 24 18 5 4
(%) (0.55) (0.77) (0.24) (0.24) (0.88) (0.79) (0.21) (0.12) (0.22) (0.13) 5. Joint Sector (Public)
9 2 52 18 1311 185 301 41 73 -16
(%) (1.64) (0.39) (1.39) (0.43) (5.24) (0.65) (2.59) (0.27) (3.19) (-0.54) 6. Joint Sector (Private)
3 - 1 - 119 - 57 - 5 -
(%) (0.55) - (0.03) - (0.48) - (0.49) - (0.22) - 7. Joint Sector (5+6) 12 2 54 18 1430 185 358 41 78 -16
(%) (2.19) (0.39) (1.44) (0.43) (5.72) (0.65) (3.08) (0.27) (3.41) (-0.54) 8. Wholly Private 533 512 3676 4129 23363 28010 11238 15364 2205 2983
(%) (97.09) (98.84) (98.32) (99.33) (93.41) (98.56) (96.71) (99.62) (96.37) (100.40)
Total 549 518 3739 4157 25012 28419 11620 15423 2288 2971
(%) (100.00) (100.00) (100.00) (100.00) (100.00) (100.00) (100.00) (100.00) (100.00) (100.00)
21
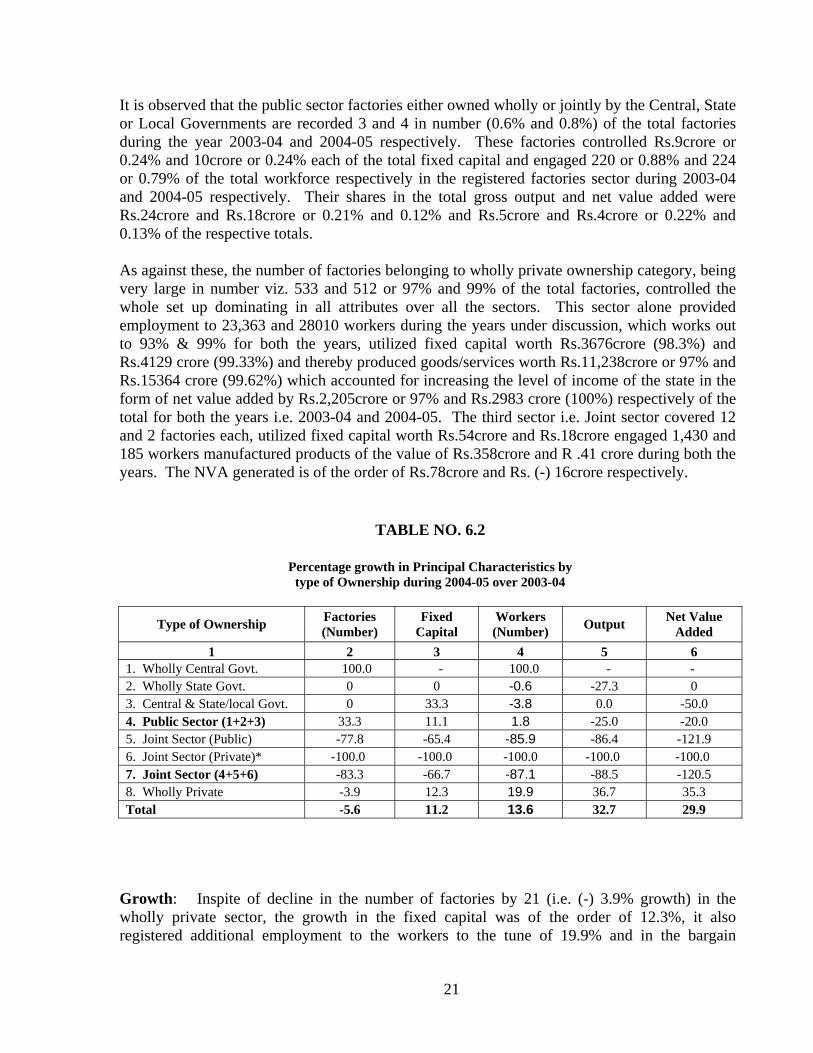
It is observed that the public sector factories either owned wholly or jointly by the Central, State or Local Governments are recorded 3 and 4 in number (0.6% and 0.8%) of the total factories during the year 2003-04 and 2004-05 respectively. These factories controlled Rs.9crore or 0.24% and 10crore or 0.24% each of the total fixed capital and engaged 220 or 0.88% and 224 or 0.79% of the total workforce respectively in the registered factories sector during 2003-04 and 2004-05 respectively. Their shares in the total gross output and net value added were Rs.24crore and Rs.18crore or 0.21% and 0.12% and Rs.5crore and Rs.4crore or 0.22% and 0.13% of the respective totals. As against these, the number of factories belonging to wholly private ownership category, being very large in number viz. 533 and 512 or 97% and 99% of the total factories, controlled the whole set up dominating in all attributes over all the sectors. This sector alone provided employment to 23,363 and 28010 workers during the years under discussion, which works out to 93% & 99% for both the years, utilized fixed capital worth Rs.3676crore (98.3%) and Rs.4129 crore (99.33%) and thereby produced goods/services worth Rs.11,238crore or 97% and Rs.15364 crore (99.62%) which accounted for increasing the level of income of the state in the form of net value added by Rs.2,205crore or 97% and Rs.2983 crore (100%) respectively of the total for both the years i.e. 2003-04 and 2004-05. The third sector i.e. Joint sector covered 12 and 2 factories each, utilized fixed capital worth Rs.54crore and Rs.18crore engaged 1,430 and 185 workers manufactured products of the value of Rs.358crore and R .41 crore during both the years. The NVA generated is of the order of Rs.78crore and Rs. (-) 16crore respectively.
TABLE NO. 6.2
Percentage growth in Principal Characteristics by type of Ownership during 2004-05 over 2003-04
Type of Ownership Factories (Number)
Fixed Capital
Workers (Number) Output Net Value
Added 1 2 3 4 5 6
1. Wholly Central Govt. 100.0 - 100.0 - - 2. Wholly State Govt. 0 0 -0.6 -27.3 0 3. Central & State/local Govt. 0 33.3 -3.8 0.0 -50.0 4. Public Sector (1+2+3) 33.3 11.1 1.8 -25.0 -20.0 5. Joint Sector (Public) -77.8 -65.4 -85.9 -86.4 -121.9 6. Joint Sector (Private)* -100.0 -100.0 -100.0 -100.0 -100.0 7. Joint Sector (4+5+6) -83.3 -66.7 -87.1 -88.5 -120.5 8. Wholly Private -3.9 12.3 19.9 36.7 35.3 Total -5.6 11.2 13.6 32.7 29.9
Growth: Inspite of decline in the number of factories by 21 (i.e. (-) 3.9% growth) in the wholly private sector, the growth in the fixed capital was of the order of 12.3%, it also registered additional employment to the workers to the tune of 19.9% and in the bargain
22
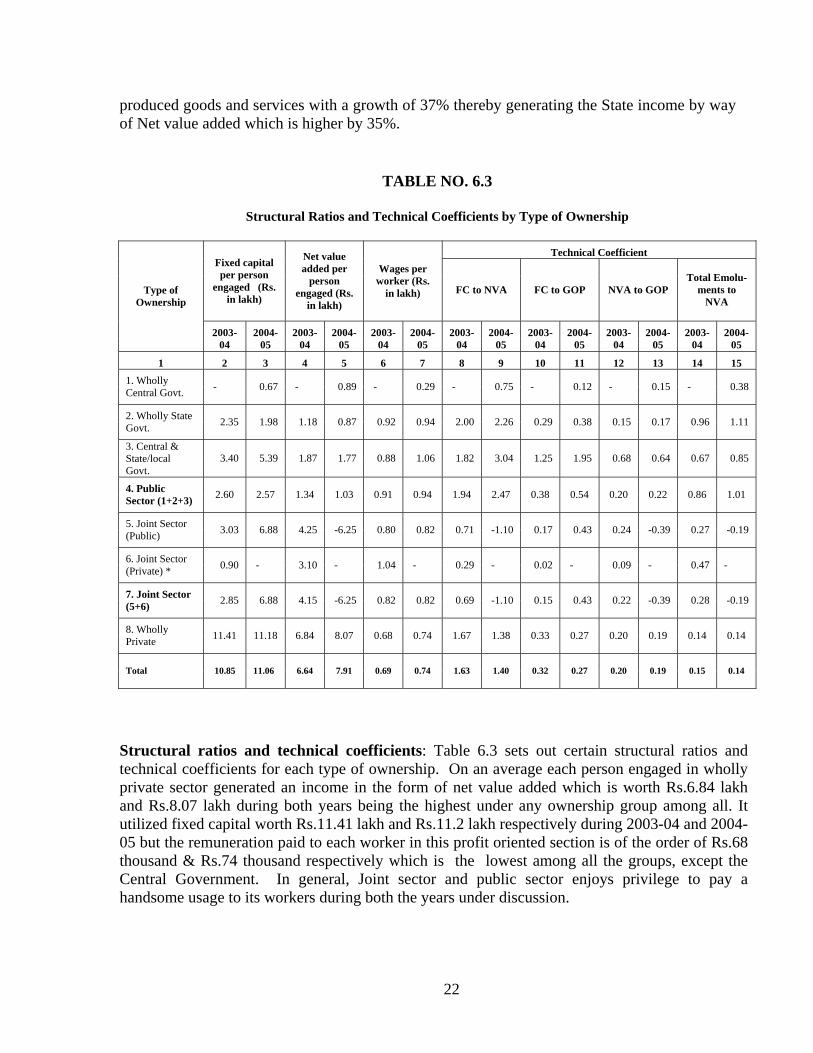
produced goods and services with a growth of 37% thereby generating the State income by way of Net value added which is higher by 35%.
TABLE NO. 6.3
Structural Ratios and Technical Coefficients by Type of Ownership
Technical Coefficient Fixed capital per person
engaged (Rs. in lakh)
Net value added per
person engaged (Rs.
in lakh)
Wages per worker (Rs.
in lakh) FC to NVA FC to GOP NVA to GOP Total Emolu-
ments to NVA
Type of Ownership
2003-04
2004-05
2003-04
2004-05
2003-04
2004-05
2003-04
2004-05
2003-04
2004-05
2003-04
2004-05
2003-04
2004-05
1 2 3 4 5 6 7 8 9 10 11 12 13 14 15 1. Wholly Central Govt. - 0.67 - 0.89 - 0.29 - 0.75 - 0.12 - 0.15 - 0.38
2. Wholly State Govt. 2.35 1.98 1.18 0.87 0.92 0.94 2.00 2.26 0.29 0.38 0.15 0.17 0.96 1.11
3. Central & State/local Govt.
3.40 5.39 1.87 1.77 0.88 1.06 1.82 3.04 1.25 1.95 0.68 0.64 0.67 0.85
4. Public Sector (1+2+3) 2.60 2.57 1.34 1.03 0.91 0.94 1.94 2.47 0.38 0.54 0.20 0.22 0.86 1.01
5. Joint Sector (Public) 3.03 6.88 4.25 -6.25 0.80 0.82 0.71 -1.10 0.17 0.43 0.24 -0.39 0.27 -0.19
6. Joint Sector (Private) * 0.90 - 3.10 - 1.04 - 0.29 - 0.02 - 0.09 - 0.47 -
7. Joint Sector (5+6) 2.85 6.88 4.15 -6.25 0.82 0.82 0.69 -1.10 0.15 0.43 0.22 -0.39 0.28 -0.19
8. Wholly Private 11.41 11.18 6.84 8.07 0.68 0.74 1.67 1.38 0.33 0.27 0.20 0.19 0.14 0.14
Total 10.85 11.06 6.64 7.91 0.69 0.74 1.63 1.40 0.32 0.27 0.20 0.19 0.15 0.14
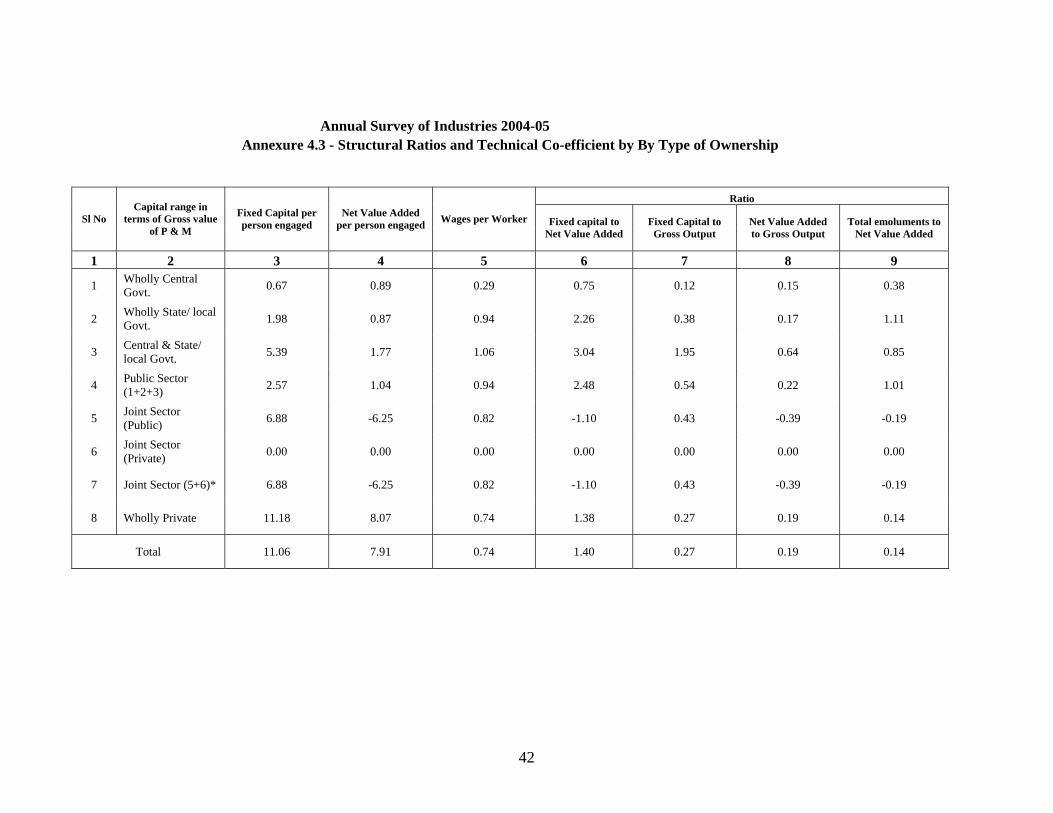
Structural ratios and technical coefficients: Table 6.3 sets out certain structural ratios and technical coefficients for each type of ownership. On an average each person engaged in wholly private sector generated an income in the form of net value added which is worth Rs.6.84 lakh and Rs.8.07 lakh during both years being the highest under any ownership group among all. It utilized fixed capital worth Rs.11.41 lakh and Rs.11.2 lakh respectively during 2003-04 and 2004-05 but the remuneration paid to each worker in this profit oriented section is of the order of Rs.68 thousand & Rs.74 thousand respectively which is the lowest among all the groups, except the Central Government. In general, Joint sector and public sector enjoys privilege to pay a handsome usage to its workers during both the years under discussion.
23
The net value added for each rupee of gross output produced in public sector has increased from 20paise in 2003-04 to 0.22paise in 2004-05 and in private sector it has declined from 20paise to 19paise for the same years. Each rupee of gross output produced came from utilization of fixed capital worth 38paise and 54paise respectively during 2003-04 and 2004-05 in the public sector and it was 33paise and 27paise in wholly private sector during respective years. Similarly each rupee of net value added has come from utilization of fixed capital worth of Rs.1.94 and Rs.2.47 during 2003-04 and 2004-05 respectively in public sector, while it was Rs1.67. and Rs.1.38 during respective years in wholly private sector. Among all the sectors, the average emoluments paid to persons engaged in production activity in relation to NVA generated was higher in pubic sector during both the years.

24
CHAPTER – SEVEN
DISTRIBUTION OF FACTORIES BY
TYPE OF ORGANISATION
7.1 Principal Characteristics: Table 7.1 gives the distribution of factories and other related aggregates in absolute and percentage terms respectively by type of organization. The organizations are classified as (i) Individual proprietorship, (ii) Joint family (iii) Partnership, (iv) Public limited company,(v) Private limited company,(vi) Khadi and village industry and (vii) Co-operative Society. The public limited companies and private limited company constitute the corporate sector. Table 7.1 Principal Characteristics by Type of Organisation (Value in Rs. Crore)
Factories (Number) Fixed Capital Workers (number) Gross Output Net Value Added
Type of Organisation 2003-04 2004-05 2003-04 2004-05 2003-04 2004-05 2003-04 2004-05 2003-04 2004-05
1 2 3 4 5 6 7 8 9 10 11 12
1 Individual proprietorship
77 64 15 12 1178 1106 223 239 40 35
(%) (14.03) (12.36) (0.40) (0.29) (4.71) (3.89) (1.92) (1.55) (1.75) (1.18)
2 Joint Family 1 6 0.08 2 2 43 0.02 4 0 1
(%) (0.18) (1.16) (0.00) (0.05) (0.01) (0.15) (0.00) (0.03) (0.00) (0.03)
3 Partnership 108 94 62 52 2404 2496 260 319 77 43
(%) (19.67) (18.15) (1.66) (1.25) (9.61) (8.78) (2.24) (2.07) (3.37) (1.45)
4 Public Limited Company
146 146 2808 3125 13356 15917 8536 11455 1762 2372
(%) (26.59) (28.19) (75.10) (75.17) (53.40) (56.01) (73.46) (74.27) (77.01) (79.84)
5 Private Limited Company
214 205 848 961 7740 8570 2530 3332 405 514
(%) (38.98) (39.58) (22.68) (23.12) (30.95) (30.16) (21.77) (21.60) (17.70) (17.30)
6
Corporate Sector (4+5) 360 351 3656 4086 21097 24487 11067 14787 2167 2886
(%) (65.57) (67.76) (97.78) (98.29) (84.35) (86.16) (95.24) (95.88) (94.71) (97.14)
7 Khadi & village Industry
1 1 3 4 220 178 13 14 -11 2
(%) (0.18) (0.19) (0.08) (0.10) (0.88) (0.63) (0.11) (0.09) (-0.48) (0.07)
8 Co-operative Society
2 2 1 2 111 108 57 60 5 5
(%) (0.36) (0.39) (0.03) (0.05) (0.44) (0.38) (0.49) (0.39) (0.22) (0.17) Total 549 518 3739 4157 25012 28419 11620 15423 2288 2971
(%) (100.00) (100.00) (100.00) (100.00) (100.00) (100.00) (100.00) (100.00) (100.00) (100.00)
25
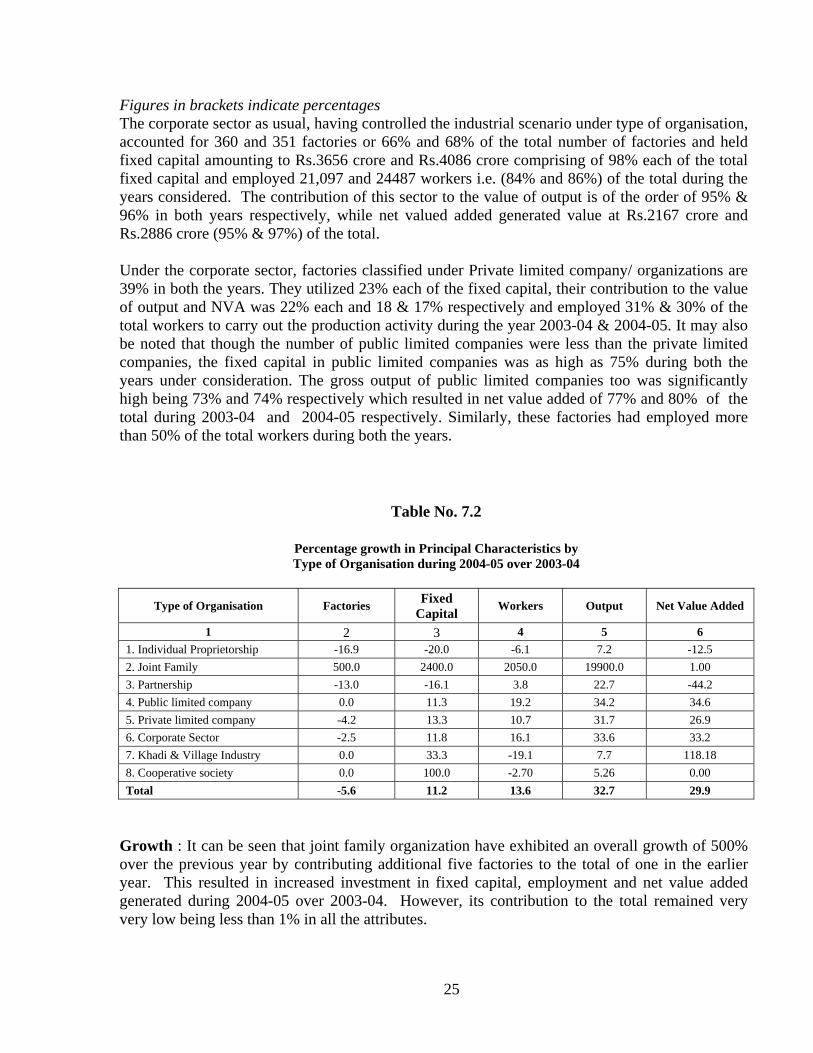
Figures in brackets indicate percentages The corporate sector as usual, having controlled the industrial scenario under type of organisation, accounted for 360 and 351 factories or 66% and 68% of the total number of factories and held fixed capital amounting to Rs.3656 crore and Rs.4086 crore comprising of 98% each of the total fixed capital and employed 21,097 and 24487 workers i.e. (84% and 86%) of the total during the years considered. The contribution of this sector to the value of output is of the order of 95% & 96% in both years respectively, while net valued added generated value at Rs.2167 crore and Rs.2886 crore (95% & 97%) of the total. Under the corporate sector, factories classified under Private limited company/ organizations are 39% in both the years. They utilized 23% each of the fixed capital, their contribution to the value of output and NVA was 22% each and 18 & 17% respectively and employed 31% & 30% of the total workers to carry out the production activity during the year 2003-04 & 2004-05. It may also be noted that though the number of public limited companies were less than the private limited companies, the fixed capital in public limited companies was as high as 75% during both the years under consideration. The gross output of public limited companies too was significantly high being 73% and 74% respectively which resulted in net value added of 77% and 80% of the total during 2003-04 and 2004-05 respectively. Similarly, these factories had employed more than 50% of the total workers during both the years.
Table No. 7.2
Percentage growth in Principal Characteristics by Type of Organisation during 2004-05 over 2003-04
Type of Organisation Factories Fixed Capital Workers Output Net Value Added
1 2 3 4 5 6 1. Individual Proprietorship -16.9 -20.0 -6.1 7.2 -12.5 2. Joint Family 500.0 2400.0 2050.0 19900.0 1.00 3. Partnership -13.0 -16.1 3.8 22.7 -44.2 4. Public limited company 0.0 11.3 19.2 34.2 34.6 5. Private limited company -4.2 13.3 10.7 31.7 26.9 6. Corporate Sector -2.5 11.8 16.1 33.6 33.2 7. Khadi & Village Industry 0.0 33.3 -19.1 7.7 118.18 8. Cooperative society 0.0 100.0 -2.70 5.26 0.00 Total -5.6 11.2 13.6 32.7 29.9
Growth : It can be seen that joint family organization have exhibited an overall growth of 500% over the previous year by contributing additional five factories to the total of one in the earlier year. This resulted in increased investment in fixed capital, employment and net value added generated during 2004-05 over 2003-04. However, its contribution to the total remained very very low being less than 1% in all the attributes.
26
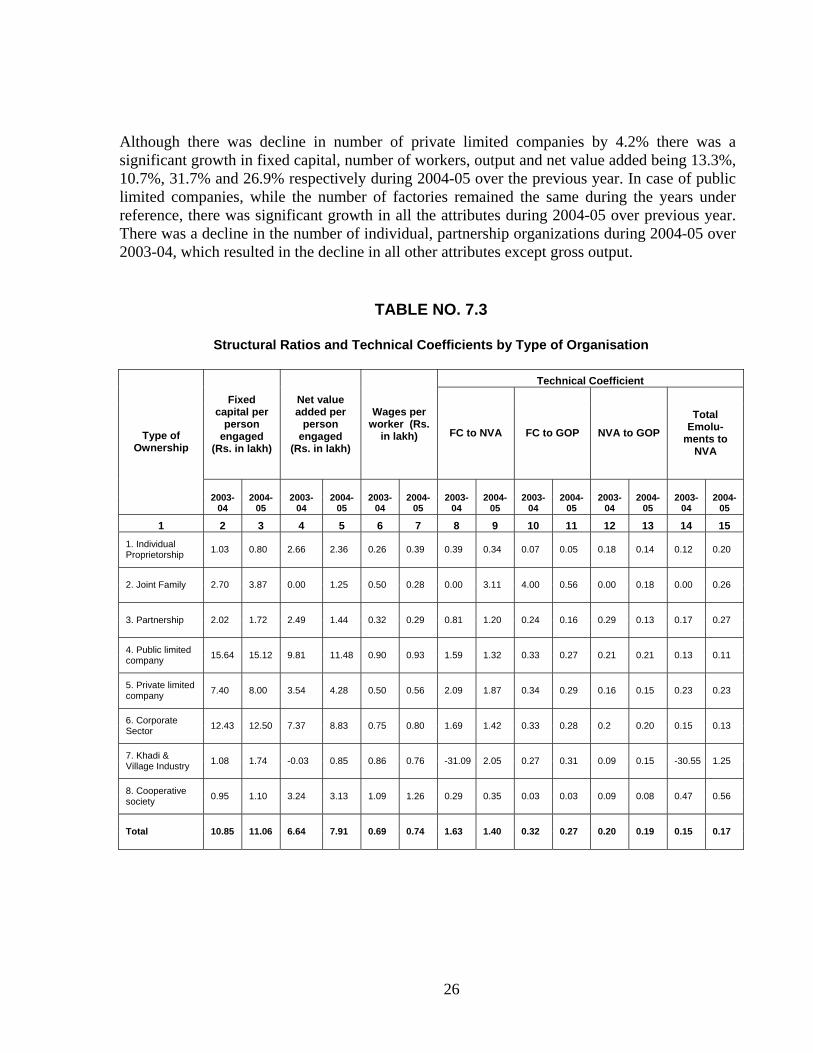
Although there was decline in number of private limited companies by 4.2% there was a significant growth in fixed capital, number of workers, output and net value added being 13.3%, 10.7%, 31.7% and 26.9% respectively during 2004-05 over the previous year. In case of public limited companies, while the number of factories remained the same during the years under reference, there was significant growth in all the attributes during 2004-05 over previous year. There was a decline in the number of individual, partnership organizations during 2004-05 over 2003-04, which resulted in the decline in all other attributes except gross output.
TABLE NO. 7.3
Structural Ratios and Technical Coefficients by Type of Organisation
Technical Coefficient
Fixed capital per
person engaged
(Rs. in lakh)
Net value added per
person engaged
(Rs. in lakh)
Wages per worker (Rs.
in lakh) FC to NVA FC to GOP NVA to GOP Total
Emolu- ments to
NVA Type of
Ownership
2003-04
2004-05
2003-04
2004-05
2003-04
2004-05
2003-04
2004-05
2003-04
2004-05
2003-04
2004-05
2003-04
2004-05
1 2 3 4 5 6 7 8 9 10 11 12 13 14 15 1. Individual Proprietorship 1.03 0.80 2.66 2.36 0.26 0.39 0.39 0.34 0.07 0.05 0.18 0.14 0.12 0.20
2. Joint Family 2.70 3.87 0.00 1.25 0.50 0.28 0.00 3.11 4.00 0.56 0.00 0.18 0.00 0.26
3. Partnership 2.02 1.72 2.49 1.44 0.32 0.29 0.81 1.20 0.24 0.16 0.29 0.13 0.17 0.27
4. Public limited company 15.64 15.12 9.81 11.48 0.90 0.93 1.59 1.32 0.33 0.27 0.21 0.21 0.13 0.11
5. Private limited company 7.40 8.00 3.54 4.28 0.50 0.56 2.09 1.87 0.34 0.29 0.16 0.15 0.23 0.23
6. Corporate Sector 12.43 12.50 7.37 8.83 0.75 0.80 1.69 1.42 0.33 0.28 0.2 0.20 0.15 0.13
7. Khadi & Village Industry 1.08 1.74 -0.03 0.85 0.86 0.76 -31.09 2.05 0.27 0.31 0.09 0.15 -30.55 1.25
8. Cooperative society 0.95 1.10 3.24 3.13 1.09 1.26 0.29 0.35 0.03 0.03 0.09 0.08 0.47 0.56
Total 10.85 11.06 6.64 7.91 0.69 0.74 1.63 1.40 0.32 0.27 0.20 0.19 0.15 0.17
27
7.2 Structural ratios and technical co- efficient : Table No.7.3 reveals ratios and technical co-efficient of factories classified by type of organization. During the year 2003-04 and 2004-05 the fixed capital worth Rs.12.43 lakh and Rs.12.50 lakh were utilized by each person engaged in the corporate sector, which forms just next to Public Limited Company where this organization utilized fixed capital worth Rs.15.64 lakh and Rs.15.12 lakh respectively per person engaged during the respective years which stands the highest ratio of all the organizations in discussion. Cooperative sector paid a good remuneration to its worker which is of the order of Rs. 1.09 and Rs.1.26 lakh during the year under reference. Average emoluments paid in relation to generation of NVA of each rupee has increased from Rs.0.15 lakh during 2003-04 to Rs.0.17 lakh during 2004-05.
28
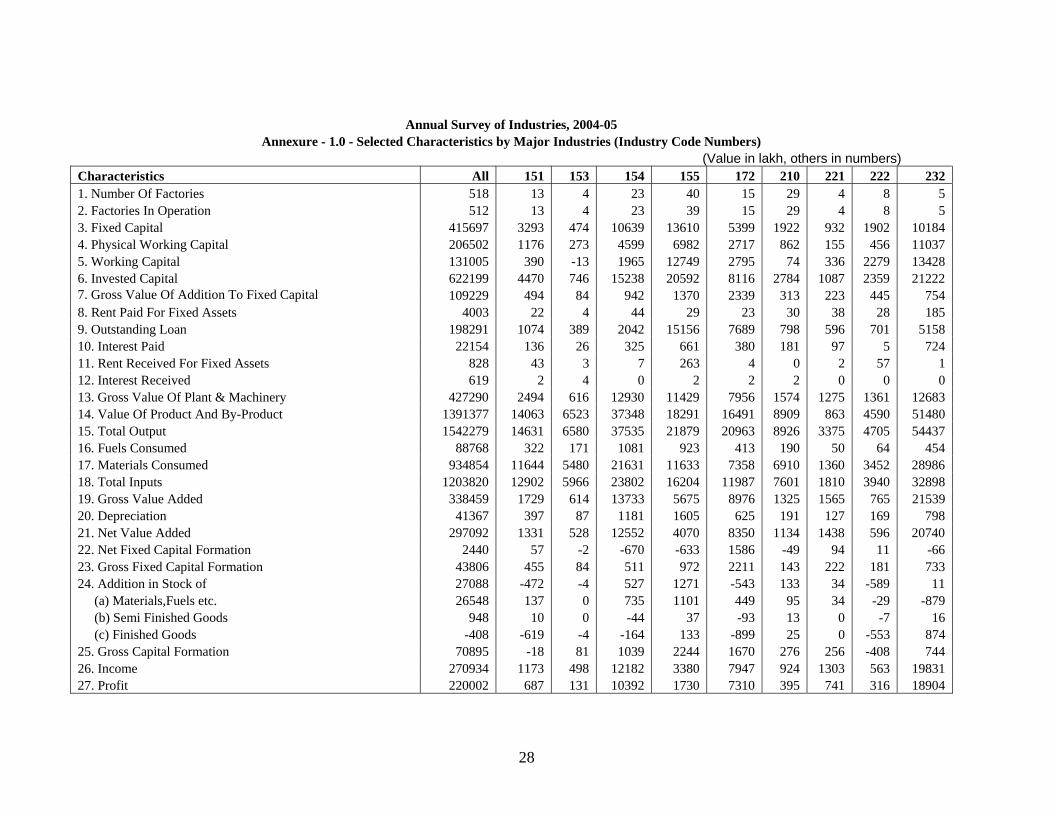
Annual Survey of Industries, 2004-05 Annexure - 1.0 - Selected Characteristics by Major Industries (Industry Code Numbers)
(Value in lakh, others in numbers) Characteristics All 151 153 154 155 172 210 221 222 232 1. Number Of Factories 518 13 4 23 40 15 29 4 8 5 2. Factories In Operation 512 13 4 23 39 15 29 4 8 5 3. Fixed Capital 415697 3293 474 10639 13610 5399 1922 932 1902 10184 4. Physical Working Capital 206502 1176 273 4599 6982 2717 862 155 456 11037 5. Working Capital 131005 390 -13 1965 12749 2795 74 336 2279 13428 6. Invested Capital 622199 4470 746 15238 20592 8116 2784 1087 2359 21222 7. Gross Value Of Addition To Fixed Capital 109229 494 84 942 1370 2339 313 223 445 754 8. Rent Paid For Fixed Assets 4003 22 4 44 29 23 30 38 28 185 9. Outstanding Loan 198291 1074 389 2042 15156 7689 798 596 701 5158 10. Interest Paid 22154 136 26 325 661 380 181 97 5 724 11. Rent Received For Fixed Assets 828 43 3 7 263 4 0 2 57 1 12. Interest Received 619 2 4 0 2 2 2 0 0 0 13. Gross Value Of Plant & Machinery 427290 2494 616 12930 11429 7956 1574 1275 1361 12683 14. Value Of Product And By-Product 1391377 14063 6523 37348 18291 16491 8909 863 4590 51480 15. Total Output 1542279 14631 6580 37535 21879 20963 8926 3375 4705 54437 16. Fuels Consumed 88768 322 171 1081 923 413 190 50 64 454 17. Materials Consumed 934854 11644 5480 21631 11633 7358 6910 1360 3452 28986 18. Total Inputs 1203820 12902 5966 23802 16204 11987 7601 1810 3940 32898 19. Gross Value Added 338459 1729 614 13733 5675 8976 1325 1565 765 21539 20. Depreciation 41367 397 87 1181 1605 625 191 127 169 798 21. Net Value Added 297092 1331 528 12552 4070 8350 1134 1438 596 20740 22. Net Fixed Capital Formation 2440 57 -2 -670 -633 1586 -49 94 11 -66 23. Gross Fixed Capital Formation 43806 455 84 511 972 2211 143 222 181 733 24. Addition in Stock of 27088 -472 -4 527 1271 -543 133 34 -589 11 (a) Materials,Fuels etc. 26548 137 0 735 1101 449 95 34 -29 -879 (b) Semi Finished Goods 948 10 0 -44 37 -93 13 0 -7 16 (c) Finished Goods -408 -619 -4 -164 133 -899 25 0 -553 874 25. Gross Capital Formation 70895 -18 81 1039 2244 1670 276 256 -408 744 26. Income 270934 1173 498 12182 3380 7947 924 1303 563 19831 27. Profit 220002 687 131 10392 1730 7310 395 741 316 18904

29
Annual Survey of Industries, 2004-05 Annexure - 1.0 - Selected Characteristics by Major Industries (Industry Code Numbers)
(Value in lakh, others in numbers) Characteristics 241 242 251 252 261 269 271 272 273 281 1. Number Of Factories 13 88 7 36 3 15 35 18 4 8 2. Factories In Operation 12 88 7 36 3 14 33 18 4 6 3. Fixed Capital 22455 142872 6112 20883 11784 1033 39639 33987 1254 41 4. Physical Working Capital 30446 52186 3255 7542 2468 292 24259 14303 392 39 5. Working Capital 13728 37921 -2640 3090 6229 55 8598 6367 1043 34 6. Invested Capital 52901 195059 9367 28425 14251 1325 63899 48290 1646 80 7. Gross Value Of Addition To Fixed Capital 5009 73939 4227 3020 1089 2 3946 581 308 0 8. Rent Paid For Fixed Assets 807 800 6 134 55 2 586 15 2 5 9. Outstanding Loan 48035 24467 14 2833 4956 595 18694 33323 914 5 10. Interest Paid 5277 3301 11 656 297 92 2759 3447 47 8 11. Rent Received For Fixed Assets 101 123 0 76 0 16 0 0 0 0 12. Interest Received 100 129 0 1 0 0 47 190 0 0 13. Gross Value Of Plant & Machinary 40340 96443 15935 27549 15609 1153 41812 34134 1502 6 14. Value Of Product And By-Product 167725 385184 63872 43046 14493 1958 191514 112548 3741 97 15. Total Output 222846 425896 64315 43964 15006 1982 195040 113398 4045 185 16. Fuels Consumed 13177 9687 3764 2040 1812 156 47802 2448 407 8 17. Materials Consumed 133866 204850 48426 27410 7091 1337 112938 105229 2585 90 18. Total Inputs 201984 270275 53594 32719 10284 1650 169516 109187 3317 129 19. Gross Value Added 20862 155621 10721 11245 4722 332 25524 4211 728 56 20. Depreciation 2793 12468 1266 4111 1183 140 2896 2089 232 5 21. Net Value Added 18069 143154 9455 7134 3539 191 22628 2122 496 50 22. Net Fixed Capital Formation 1606 3321 1466 -1385 -470 -139 996 -1669 56 -5 23. Gross Fixed Capital Formation 4399 15788 2732 2726 713 1 3892 421 289 0 24. Addition in Stock of -2048 7623 351 1665 564 -8 7616 7891 -125 17 (a) Materials,Fuels etc. 482 7872 238 954 91 22 5006 5399 -17 16 (b) Semi Finished Goods 111 545 299 -120 -59 1 209 394 -71 0 (c) Finished Goods -2641 -794 -186 831 532 -31 2401 2098 -37 1 25. Gross Capital Formation 2351 23411 3083 4391 1277 -7 11508 8312 163 17 26. Income 11985 139053 9438 6344 3187 98 19282 -1340 446 37 27. Profit 5969 123293 6541 4751 1771 -18 15889 -2586 166 9

30
Annual Survey of Industries, 2004-05 Annexure - 1.0 - Selected Characteristics by Major Industries (Industry Code Numbers)
(Value in lakh, others in numbers) Characteristics 289 291 292 293 300 311 312 313 314 321 1. Number Of Factories 16 11 7 8 7 4 3 7 3 9 2. Factories In Operation 16 11 7 8 7 4 3 7 3 9 3. Fixed Capital 2273 1922 8731 1627 7170 1293 551 17512 465 1169 4. Physical Working Capital 1717 472 1323 1381 8190 556 24 8051 316 547 5. Working Capital 3712 347 -297 936 11600 874 24 16017 305 395 6. Invested Capital 3990 2395 10055 3008 15360 1849 575 25563 781 1716 7. Gross Value Of Addition To Fixed Capital 341 155 376 249 1619 101 4 483 77 264 8. Rent Paid For Fixed Assets 8 17 29 6 148 4 1 117 0 31 9. Outstanding Loan 157 1135 233 13 136 55 5 4051 213 575 10. Interest Paid 9 105 12 97 350 48 3 161 7 98 11. Rent Received For Fixed Assets 0 27 0 0 51 0 0 0 0 0 12. Interest Received 40 7 0 0 3 8 0 4 2 1 13. Gross Value Of Plant & Machinary 2422 1127 13164 2063 3643 1541 116 19428 447 1457 14. Value Of Product And By-Product 6971 4468 12057 16985 55538 10280 141 50928 885 4142 15. Total Output 8603 4845 12558 17284 65162 10460 157 51882 928 4278 16. Fuels Consumed 219 92 76 236 300 73 4 969 36 130 17. Materials Consumed 3606 2302 8896 13550 45265 7647 114 43813 593 2717 18. Total Inputs 4604 3452 9889 15197 55487 8625 142 45989 757 3319 19. Gross Value Added 3999 1393 2669 2087 9675 1835 15 5893 171 959 20. Depreciation 285 157 809 271 774 159 34 1861 49 160 21. Net Value Added 3715 1235 1860 1816 8900 1677 -19 4032 122 799 22. Net Fixed Capital Formation 10 -6 -434 -214 793 -75 -472 -1546 27 58 23. Gross Fixed Capital Formation 294 152 375 57 1567 83 -438 315 77 218 24. Addition in Stock of 355 93 129 -52 642 -359 -18 -891 26 -6 (a) Materials,Fuels etc. 192 63 -54 -115 867 -151 -14 640 41 58 (b) Semi Finished Goods 46 -1 163 52 -133 -210 -4 -47 -20 -53 (c) Finished Goods 117 31 20 11 -92 2 0 -1484 5 -11 25. Gross Capital Formation 648 245 505 5 2209 -276 -456 -576 103 212 26. Income 3699 1114 1819 1713 8403 1626 -24 3754 115 670 27. Profit 3208 777 1282 1083 7312 1191 -50 2993 51 159

31
Annual Survey of Industries, 2004-05 Annexure - 1.0 - Selected Characteristics by Major Industries (Industry Code Numbers)
(Value in lakh, others in numbers) Characteristics 322 323 331 332 333 341 342 343 351 361 369 Other 1. Number Of Factories 3 3 10 6 5 4 4 3 7 3 10 18 2. Factories In Operation 3 3 10 6 5 4 4 3 7 3 10 18 3. Fixed Capital 1085 381 1633 6684 200 1489 76 87 13710 145 2858 16217 4. Physical Working Capital 419 106 3134 5560 815 2253 114 89 5077 52 1641 1228 5. Working Capital -1054 550 1165 -417 3089 1148 28 48 -3286 58 2640 -15307 6. Invested Capital 1504 487 4767 12244 1016 3742 190 176 18787 196 4499 17445 7. Gross Value Of Addition To Fixed Capital 172 1 205 3838 23 122 15 13 279 15 359 1436 8. Rent Paid For Fixed Assets 12 10 268 118 9 2 3 4 253 0 90 57 9. Outstanding Loan 6 3 392 3738 0 338 12 68 18928 106 345 341 10. Interest Paid 45 4 235 757 0 83 10 11 1607 6 47 29 11. Rent Received For Fixed Assets 5 16 2 0 0 0 0 0 4 1 26 0 12. Interest Received 43 1 0 4 0 1 0 0 11 2 3 9 13. Gross Value Of Plant Machinery 1220 165 1079 4708 8 3566 38 488 18182 74 3198 22353 14 Value Of Product And By Product 5100 1305 9434 9561 12677 14274 689 659 7674 264 6948 17658 15. Total Output 5322 1391 13846 10225 17912 14463 785 871 12998 285 8109 20205 16. Fuels Consumed 83 5 112 275 18 339 9 57 389 5 211 162 17. Materials Consumed 4174 1216 6004 5791 9936 10260 556 401 6851 165 4498 14223 18. Total Inputs 4636 1358 10654 7504 15235 11464 646 661 11465 214 6473 16284 19. Gross Value Added 686 33 3192 2721 2677 2999 139 210 1533 71 1636 3921 20. Depreciation 155 27 171 489 44 142 14 20 1023 10 364 1981 21. Net Value Added 531 7 3021 2232 2633 2858 125 191 510 62 1272 1938 22. Net Fixed Capital Formation 16 -27 28 3003 -21 -44 1 -7 -1034 5 -198 -1528 23. Gross Fixed Capital Formation 171 0 199 3492 23 97 15 13 -11 15 166 454 24. Addition in Stock of 59 -100 579 2023 -891 754 -3 19 411 -16 120 303 (a) Materials, Fuels etc. 51 -70 603 1891 -512 424 17 2 599 -11 34 289 (b) Semi Finished Goods 15 -3 -217 38 -20 303 -36 16 -188 -5 10 0 (c) Finished Goods -7 -27 193 94 -359 27 16 1 0 0 76 14 25. Gross Capital Formation 231 -101 778 5515 -869 851 12 33 400 -1 286 757 26. Income 474 -7 2517 1356 2624 2772 112 176 -1349 56 1134 1851 27. Profit 84 -68 1892 654 2510 1254 62 19 -2366 29 501 1035
32
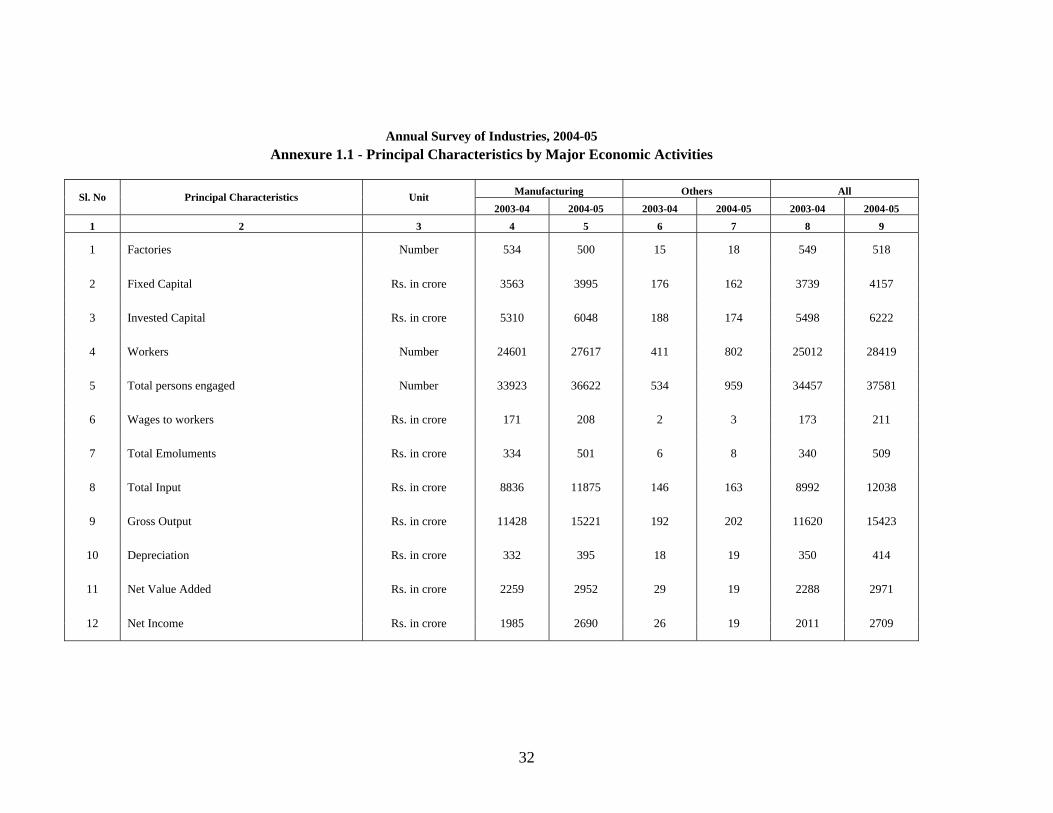
Annual Survey of Industries, 2004-05 Annexure 1.1 - Principal Characteristics by Major Economic Activities
Manufacturing Others All Sl. No Principal Characteristics Unit
2003-04 2004-05 2003-04 2004-05 2003-04 2004-05
1 2 3 4 5 6 7 8 9
1 Factories Number 534 500 15 18 549 518
2 Fixed Capital Rs. in crore 3563 3995 176 162 3739 4157
3 Invested Capital Rs. in crore 5310 6048 188 174 5498 6222
4 Workers Number 24601 27617 411 802 25012 28419
5 Total persons engaged Number 33923 36622 534 959 34457 37581
6 Wages to workers Rs. in crore 171 208 2 3 173 211
7 Total Emoluments Rs. in crore 334 501 6 8 340 509
8 Total Input Rs. in crore 8836 11875 146 163 8992 12038
9 Gross Output Rs. in crore 11428 15221 192 202 11620 15423
10 Depreciation Rs. in crore 332 395 18 19 350 414
11 Net Value Added Rs. in crore 2259 2952 29 19 2288 2971
12 Net Income Rs. in crore 1985 2690 26 19 2011 2709

33
Annual Survey of Industries, 2004-05 Annexure 1.2 - Principal Characteristics by Major Economic Activities
(Percentage distribution)
Manufacturing Others All Sl No Principal Characteristics Unit 2003-04 2004-05 2003-04 2004-05 2003-04 2004-05
1 2 3 4 5 6 7 8
1 Factories Number 97.27 96.53 2.73 3.47 100.00 100.00
2 Fixed Capital Rs. in crore 95.29 96.10 4.71 3.90 100.00 100.00
3 Invested Capital Rs. in crore 96.58 97.20 3.42 2.80 100.00 100.00
4 Workers Number 98.36 97.18 1.64 2.82 100.00 100.00
5 Total persons engaged Number 98.45 97.45 1.55 2.55 100.00 100.00
6 Wages to workers Rs. in crore 98.84 98.58 1.16 1.42 100.00 100.00
7 Total Emoluments Rs. in crore 98.24 98.43 1.76 1.57 100.00 100.00
8 Total Input Rs. in crore 98.27 98.65 1.62 1.35 100.00 100.00
9 Gross Output Rs. in crore 98.35 98.69 1.65 1.31 100.00 100.00
10 Depreciation Rs. in crore 94.86 95.41 5.14 4.59 100.00 100.00
11 Net Value Added Rs. in crore 98.73 99.36 1.27 0.64 100.00 100.00
12 Net Income Rs. in crore 98.71 99.30 1.29 0.70 100.00 100.00
34
Annual Survey of Industries, 2004-05 Annexure 2.1 - Principal Characteristics by Size of Employment
(Value Figures in Rs. Lakh & Others in number)
Sl. No
Employment Range Factories Fixed
Capital
Produc-tive
Capital
Invested Capital Workers Emplo-
yees
Wages to
Workers
Total Emolu-ments
Total Input
Total Output
Deprecia-tion
Net Value Added
Rent paid
Interest paid
1 2 3 4 5 6 7 8 9 10 11 12 13 14 15 16
1 0 --- 49 303 48488 59988 65082 4395 6020 2054 4123 125556 147876 5558 16761 642 1834
2 50 --- 99 88 44005 82252 85768 4380 6126 2598 5295 282188 324552 5881 36483 1088 4217
3 100 -- 199 76 79290 112372 128492 6899 9488 4628 10836 243459 358939 9269 106210 689 3110
4 200 -- 499 40 185395 209000 240279 8543 10877 6288 11778 271041 354456 15174 68241 954 7475
5 500 -- 999 7 57214 80851 99323 3117 3755 4859 7813 270237 342067 5350 66479 629 5470
6 1000 - 1999 3 1306 2239 3256 1085 1315 714 1161 11338 14389 134 2917 1 48
Total 518 415697 546702 622199 28419 37581 21141 41005 1203820 1542279 41367 297092 4003 22154

35
Annual Survey of Industries, 2004-05 Annexure 2.2 - Principal Characteristics by Size of Employment
(Percentage Distribution) (Value Figures in Rs. Lakh & Others in number)
Sl. No
Employment Range Factories Fixed
Capital
Produc-tive
Capital
Invested Capital Workers Emplo-
yees Wages to Workers
Total Emolu-ments
Total Input
Total Output
Deprecia-tion
Net Value Added
Rent paid
Interest paid
1 2 3 4 5 6 7 8 9 10 11 12 13 14 15 16
1 0 --- 49 58.49 11.66 10.97 10.46 15.47 16.02 9.72 10.05 10.43 9.59 13.44 5.64 16.04 8.28
2 50 --- 99 16.99 10.59 15.05 13.78 15.41 16.30 12.29 12.91 23.44 21.04 14.22 12.28 27.18 19.03
3 100 -- 199 14.67 19.07 20.55 20.65 24.28 25.25 21.89 26.43 20.22 23.27 22.41 35.75 17.21 14.04
4 200 -- 499 7.72 44.60 38.23 38.62 30.06 28.94 29.74 28.72 22.52 22.98 36.68 22.97 23.83 33.74
5 500 -- 999 1.35 13.76 14.79 15.96 10.97 9.99 22.98 19.05 22.45 22.18 12.93 22.38 15.71 24.69
6 1000 - 1999 0.58 0.31 0.41 0.52 3.82 3.50 3.38 2.83 0.94 0.93 0.32 0.98 0.02 0.22
Total 100.00 100.00 100.00 100.00 100.00 100.00 100.00 100.00 100.00 100.00 100.00 100.00 100.00 100.00
36
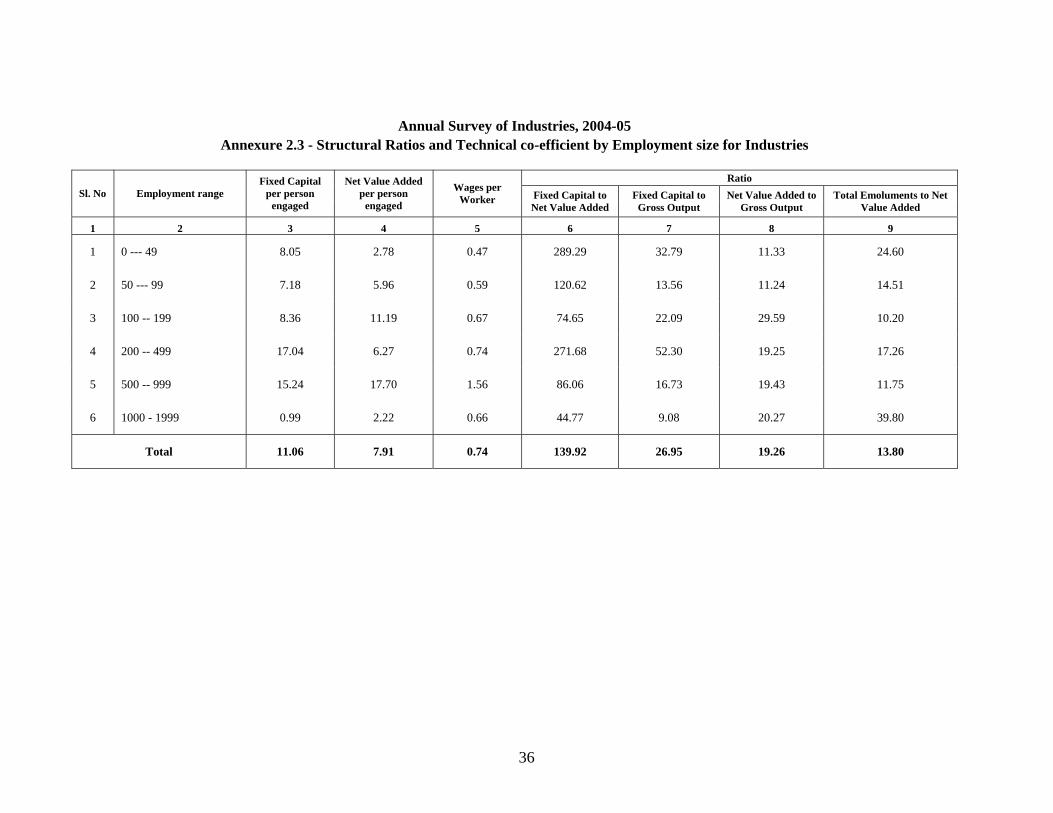
Annual Survey of Industries, 2004-05 Annexure 2.3 - Structural Ratios and Technical co-efficient by Employment size for Industries
Ratio
Sl. No Employment range Fixed Capital
per person engaged
Net Value Added per person
engaged
Wages per Worker Fixed Capital to
Net Value Added Fixed Capital to
Gross Output Net Value Added to
Gross Output Total Emoluments to Net
Value Added
1 2 3 4 5 6 7 8 9
1 0 --- 49 8.05 2.78 0.47 289.29 32.79 11.33 24.60
2 50 --- 99 7.18 5.96 0.59 120.62 13.56 11.24 14.51
3 100 -- 199 8.36 11.19 0.67 74.65 22.09 29.59 10.20
4 200 -- 499 17.04 6.27 0.74 271.68 52.30 19.25 17.26
5 500 -- 999 15.24 17.70 1.56 86.06 16.73 19.43 11.75
6 1000 - 1999 0.99 2.22 0.66 44.77 9.08 20.27 39.80
Total 11.06 7.91 0.74 139.92 26.95 19.26 13.80

37
Annual Survey of Industries 2004-05 Annexure 3.1 - Principal Characteristics by Size of Capital
(Value Figures in Rs. Lakh & Others in number)
Sl. No
Capital Range in terms of Gross
Value of P&M
Factories Fixed Capital
Produc-tive
Capital
Invested Capital Workers Emplo-
yees Wages to Workers
Total Emolu-ments
Total Input
Total Output
Depre-ciation
Net Value Added
Rent paid
Interest paid
1 2 3 4 5 6 7 8 9 10 11 12 13 14 15 16 1 Upto 1 134 3486 5196 6497 2919 3604 919 1422 30706 36065 668 4691 208 429 2 1 -- 2.5 8 103 1147 401 291 331 68 105 5943 6660 15 703 3 26 3 2.5 -- 5 9 146 298 448 150 174 56 75 816 1055 26 213 9 38 4 5 -- 10 6 69 882 196 94 126 32 56 4818 5658 13 826 10 2 5 10 -- 20 9 384 1871 1120 126 167 39 75 2652 3224 38 533 3 105 6 20 -- 50 59 3359 5317 4992 1058 1372 510 931 12054 14889 298 2538 59 132 7 50 -- 100 61 7430 20686 13828 1762 2737 905 2169 40813 49569 695 8060 131 765 8 100 -- 200 44 11992 17231 22705 1814 2443 865 1891 59485 82240 1510 21245 447 695 9 200 -- 500 77 30608 55734 50014 4481 5981 2541 5055 129483 155390 3555 22352 356 3537
10 500 -- 1000 36 31741 51177 51288 2783 3961 1849 4926 97204 126208 3681 25323 319 1885 11 1000 - 2000 25 28866 59147 49159 2575 3394 1698 3215 90527 112149 3221 18401 237 1263 12 2000 - 5000 26 56686 60430 89357 4379 5565 2569 5397 193056 251686 6124 52505 539 1359 13 5000 - 10000 13 103108 121866 138381 2816 3425 3556 6185 208487 262102 9767 43847 833 1565 14 10000 & above 11 137717 145720 193814 3171 4301 5533 9502 327777 435386 11754 95855 851 10353
Total 518 415697 546702 622199 28419 37581 21141 41005 1203820 1542279 41367 297092 4003 22154

38
Annual Survey of Industries 2004-05 Annexure 3.2 - Principal Characteristics by Size of Capital
(Percentage Distribution) (Value Figures in Rs. Lakh & Others in number)
Sl. No Capital Range Factories Fixed
Capital
Produc-tive
Capital
Invested Capital Workers Emplo-
yees Wages to Workers
Total Emolu-ments
Total Input
Total Output
Depre-ciation
Net Value Added
Rent paid
Interest paid
1 2 3 4 5 6 7 8 9 10 11 12 13 14 15 16 1 Upto 1 25.87 0.84 0.95 1.04 10.27 9.59 4.35 3.47 2.55 2.34 1.61 1.58 5.20 1.94 2 1 -- 2.5 1.54 0.02 0.21 0.06 1.02 0.88 0.32 0.26 0.49 0.43 0.04 0.24 0.07 0.12 3 2.5 -- 5 1.74 0.04 0.05 0.07 0.53 0.46 0.26 0.18 0.07 0.07 0.06 0.07 0.22 0.17 4 5 -- 10 1.16 0.02 0.16 0.03 0.33 0.34 0.15 0.14 0.40 0.37 0.03 0.28 0.25 0.01 5 10 -- 20 1.74 0.09 0.34 0.18 0.44 0.44 0.18 0.18 0.22 0.21 0.09 0.18 0.07 0.47 6 20 -- 50 11.39 0.81 0.97 0.80 3.72 3.65 2.41 2.27 1.00 0.97 0.72 0.85 1.47 0.60 7 50 -- 100 11.78 1.79 3.78 2.22 6.20 7.28 4.28 5.29 3.39 3.21 1.68 2.71 3.27 3.45 8 100 -- 200 8.49 2.88 3.15 3.65 6.38 6.50 4.09 4.61 4.94 5.33 3.65 7.15 11.17 3.14 9 200 -- 500 14.86 7.36 10.19 8.04 15.77 15.91 12.02 12.33 10.76 10.08 8.59 7.52 8.89 15.97
10 500 -- 1000 6.95 7.64 9.36 8.24 9.79 10.54 8.75 12.01 8.07 8.18 8.90 8.52 7.97 8.51 11 1000 - 2000 4.83 6.94 10.82 7.90 9.06 9.03 8.03 7.84 7.52 7.27 7.79 6.19 5.92 5.70 12 2000 - 5000 5.02 13.64 11.05 14.36 15.41 14.81 12.15 13.16 16.04 16.32 14.80 17.67 13.46 6.13 13 5000 - 10000 2.51 24.80 22.29 22.24 9.91 9.11 16.82 15.08 17.32 16.99 23.61 14.76 20.81 7.06 14 10000 & above 2.12 33.13 26.65 31.15 11.16 11.44 26.17 23.17 27.23 28.23 28.41 32.26 21.26 46.73
Total 100.00 100.00 100.00 100.00 100.00 100.00 100.00 100.00 100.00 100.00 100.00 100.00 100.00 100.00
39
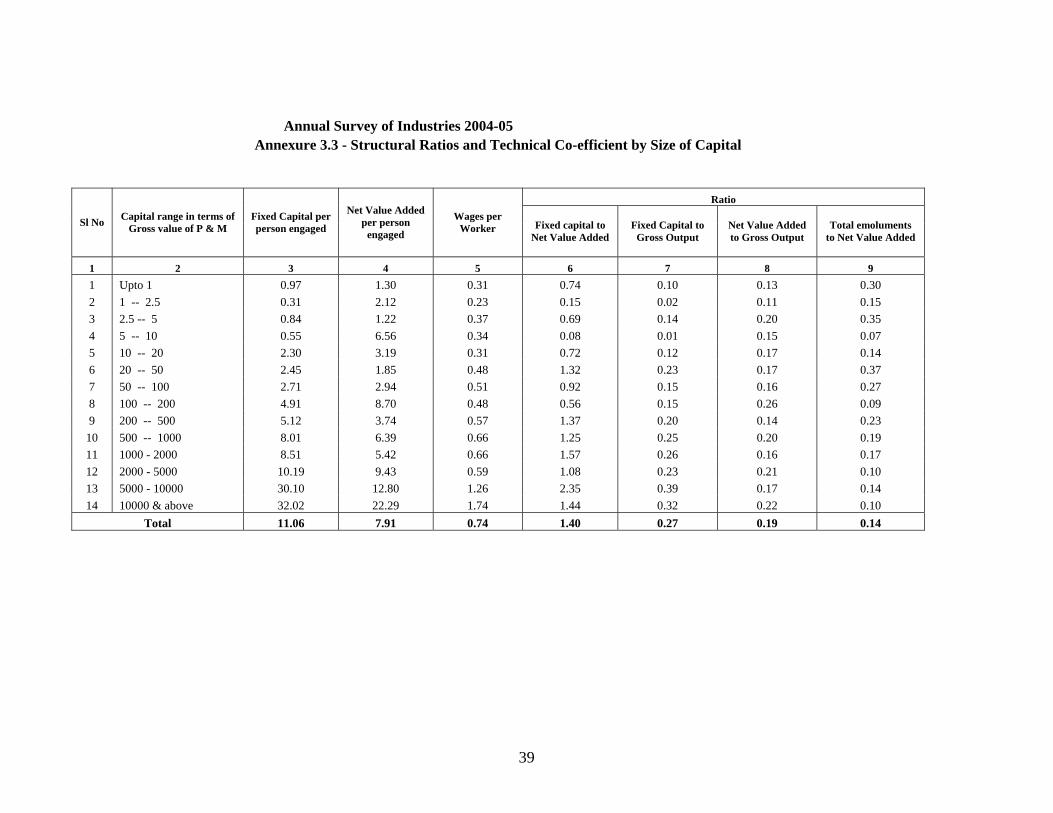
Annual Survey of Industries 2004-05 Annexure 3.3 - Structural Ratios and Technical Co-efficient by Size of Capital
Ratio
Sl No Capital range in terms of Gross value of P & M
Fixed Capital per person engaged
Net Value Added per person
engaged
Wages per Worker Fixed capital to
Net Value Added Fixed Capital to
Gross Output Net Value Added to Gross Output
Total emoluments to Net Value Added
1 2 3 4 5 6 7 8 9 1 Upto 1 0.97 1.30 0.31 0.74 0.10 0.13 0.30 2 1 -- 2.5 0.31 2.12 0.23 0.15 0.02 0.11 0.15 3 2.5 -- 5 0.84 1.22 0.37 0.69 0.14 0.20 0.35 4 5 -- 10 0.55 6.56 0.34 0.08 0.01 0.15 0.07 5 10 -- 20 2.30 3.19 0.31 0.72 0.12 0.17 0.14 6 20 -- 50 2.45 1.85 0.48 1.32 0.23 0.17 0.37 7 50 -- 100 2.71 2.94 0.51 0.92 0.15 0.16 0.27 8 100 -- 200 4.91 8.70 0.48 0.56 0.15 0.26 0.09 9 200 -- 500 5.12 3.74 0.57 1.37 0.20 0.14 0.23
10 500 -- 1000 8.01 6.39 0.66 1.25 0.25 0.20 0.19 11 1000 - 2000 8.51 5.42 0.66 1.57 0.26 0.16 0.17 12 2000 - 5000 10.19 9.43 0.59 1.08 0.23 0.21 0.10 13 5000 - 10000 30.10 12.80 1.26 2.35 0.39 0.17 0.14 14 10000 & above 32.02 22.29 1.74 1.44 0.32 0.22 0.10
Total 11.06 7.91 0.74 1.40 0.27 0.19 0.14
40
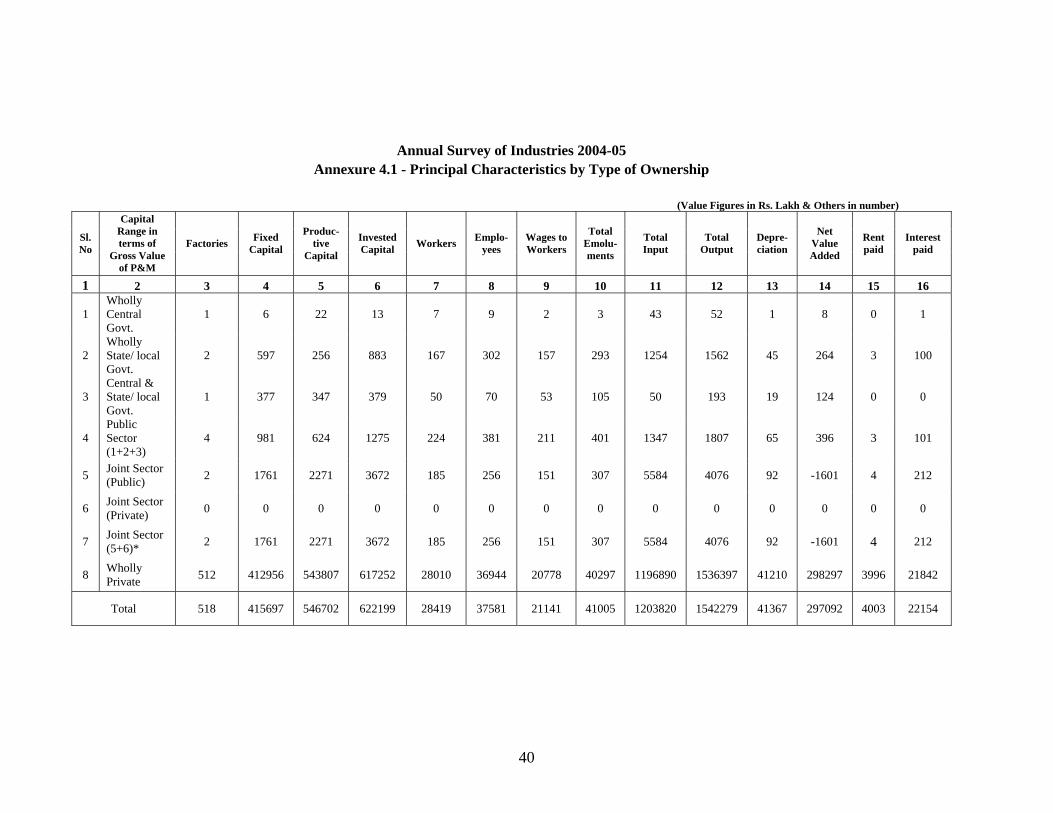
Annual Survey of Industries 2004-05 Annexure 4.1 - Principal Characteristics by Type of Ownership
(Value Figures in Rs. Lakh & Others in number)
Sl. No
Capital Range in terms of
Gross Value of P&M
Factories Fixed Capital
Produc-tive
Capital
Invested Capital Workers Emplo-
yees Wages to Workers
Total Emolu-ments
Total Input
Total Output
Depre-ciation
Net Value Added
Rent paid
Interest paid
1 2 3 4 5 6 7 8 9 10 11 12 13 14 15 16
1 Wholly Central Govt.
1 6 22 13 7 9 2 3 43 52 1 8 0 1
2 Wholly State/ local Govt.
2 597 256 883 167 302 157 293 1254 1562 45 264 3 100
3 Central & State/ local Govt.
1 377 347 379 50 70 53 105 50 193 19 124 0 0
4 Public Sector (1+2+3)
4 981 624 1275 224 381 211 401 1347 1807 65 396 3 101
5 Joint Sector (Public) 2 1761 2271 3672 185 256 151 307 5584 4076 92 -1601 4 212
6 Joint Sector (Private) 0 0 0 0 0 0 0 0 0 0 0 0 0 0
7 Joint Sector (5+6)* 2 1761 2271 3672 185 256 151 307 5584 4076 92 -1601 4 212
8 Wholly Private 512 412956 543807 617252 28010 36944 20778 40297 1196890 1536397 41210 298297 3996 21842
Total 518 415697 546702 622199 28419 37581 21141 41005 1203820 1542279 41367 297092 4003 22154
41
Annual Survey of Industries 2004-05 Annexure 4.2 - Principal Characteristics by Type of Ownership
(Percentage Distribution) (Value Figures in Rs. Lakh & Others in number)
Sl. No
Capital Range in terms of
Gross Value of P&M
Factories Fixed Capital
Produc-tive
Capital
Invested Capital Workers Emplo-
yees Wages to Workers
Total Emolu-ments
Total Input
Total Output
Depre-ciation
Net Value Added
Rent paid
Interest paid
1 2 3 4 5 6 7 8 9 10 11 12 13 14 15 16
1 Wholly Central Govt.
0.19 0.00 0.00 0.00 0.02 0.02 0.01 0.01 0.00 0.00 0.00 0.00 0.00 0.00
2 Wholly State/ local Govt.
0.39 0.14 0.05 0.14 0.59 0.80 0.74 0.71 0.10 0.10 0.11 0.09 0.07 0.45
3 Central & State/ local Govt.
0.19 0.09 0.06 0.06 0.18 0.19 0.25 0.26 0.00 0.01 0.05 0.04 0.00 0.00
4 Public Sector (1+2+3)
0.77 0.24 0.11 0.20 0.79 1.01 1.00 0.98 0.11 0.12 0.16 0.13 0.07 0.46
5 Joint Sector (Public) 0.39 0.42 0.42 0.59 0.65 0.68 0.71 0.75 0.46 0.26 0.22 -0.54 0.10 0.96
6 Joint Sector (Private) 0 0 0 0 0 0 0 0 0 0 0 0 0 0
7 Joint Sector (5+6)* 0.39 0.42 0.42 0.59 0.65 0.68 0.71 0.75 0.46 0.26 0.22 -0.54 0.10 0.96
8 Wholly Private 98.84 99.34 99.47 99.20 98.56 98.30 98.28 98.27 99.42 99.62 99.62 100.41 99.83 98.59
Total 100.00 100.00 100.00 100.00 100.00 100.00 100.00 100.00 100.00 100.00 100.00 100.00 100.00 100.00
42
Annual Survey of Industries 2004-05 Annexure 4.3 - Structural Ratios and Technical Co-efficient by By Type of Ownership
Ratio
Sl No Capital range in
terms of Gross value of P & M
Fixed Capital per person engaged
Net Value Added per person engaged Wages per Worker Fixed capital to
Net Value Added Fixed Capital to
Gross Output Net Value Added to Gross Output
Total emoluments to Net Value Added
1 2 3 4 5 6 7 8 9
1 Wholly Central Govt. 0.67 0.89 0.29 0.75 0.12 0.15 0.38
2 Wholly State/ local Govt. 1.98 0.87 0.94 2.26 0.38 0.17 1.11
3 Central & State/ local Govt. 5.39 1.77 1.06 3.04 1.95 0.64 0.85
4 Public Sector (1+2+3) 2.57 1.04 0.94 2.48 0.54 0.22 1.01
5 Joint Sector (Public) 6.88 -6.25 0.82 -1.10 0.43 -0.39 -0.19
6 Joint Sector (Private) 0.00 0.00 0.00 0.00 0.00 0.00 0.00
7 Joint Sector (5+6)* 6.88 -6.25 0.82 -1.10 0.43 -0.39 -0.19
8 Wholly Private 11.18 8.07 0.74 1.38 0.27 0.19 0.14
Total 11.06 7.91 0.74 1.40 0.27 0.19 0.14

43
Annual Survey of Industries 2004-05 Annexure 5.1 - Principal Characteristics by Type of Organisation
(Value figures in Rs. Lakh & others in number)
Sl. No
Type of Organisation Factories Fixed
Capital
Produc-tive
Capital
Invested Capital Workers Emplo-
yees Wages to Workers
Total Emolu-ments
Total Input
Total Output
Depre-ciation
Net Value Added
Rent paid
Interest paid
1 2 3 4 5 6 7 8 9 10 11 12 13 14 15 16
1 Individual Proprietors 64 1168 4085 2736 1106 1468 435 682 20224 23948 257 3466 144 113
2 Joint Family (HUF) 6 205 208 289 43 53 12 17 280 367 21 66 1 10
3 Partnership 94 5153 9549 8332 2496 2992 728 1153 26933 31878 643 4302 76 430
4 Public Limited Company 146 312524 377050 458280 15917 20671 14881 26778 879410 1145481 28856 237216 2367 16002
5 Private Limited Company 205 96061 154748 149982 8570 12007 4813 11859 270368 333245 11503 51375 1414 5382
6 Corporate Sector (4+5) 351 408585 531798 608262 24487 32679 19694 38637 1149778 1478727 40358 288591 3781 21384
7 Khadi & Village Industry 1 424 853 2254 178 243 135 258 1135 1385 43 207 1 212
8 Co-operative Society 2 162 209 326 108 147 136 259 5470 5974 44 460 2 6
Total 518 415697 546702 622199 28419 37581 21141 41005 1203820 1542279 41367 297092 4003 22154
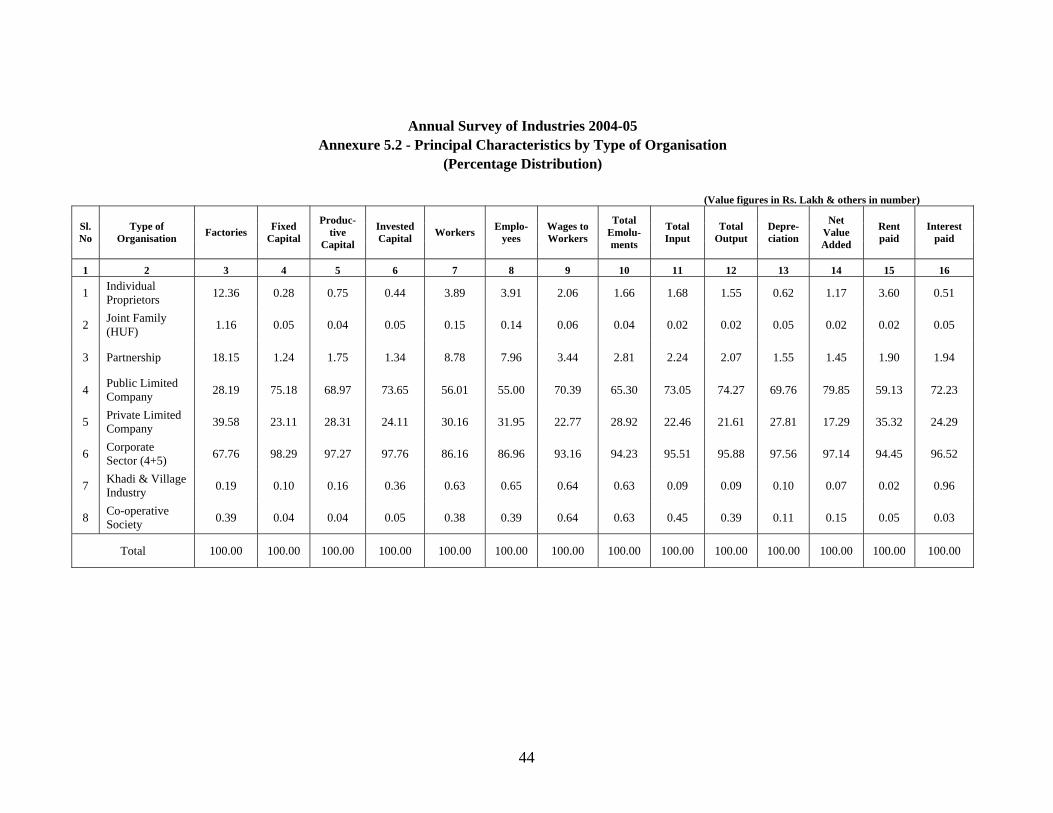
44
Annual Survey of Industries 2004-05 Annexure 5.2 - Principal Characteristics by Type of Organisation
(Percentage Distribution) (Value figures in Rs. Lakh & others in number)
Sl. No
Type of Organisation Factories Fixed
Capital
Produc-tive
Capital
Invested Capital Workers Emplo-
yees Wages to Workers
Total Emolu-ments
Total Input
Total Output
Depre-ciation
Net Value Added
Rent paid
Interest paid
1 2 3 4 5 6 7 8 9 10 11 12 13 14 15 16
1 Individual Proprietors 12.36 0.28 0.75 0.44 3.89 3.91 2.06 1.66 1.68 1.55 0.62 1.17 3.60 0.51
2 Joint Family (HUF) 1.16 0.05 0.04 0.05 0.15 0.14 0.06 0.04 0.02 0.02 0.05 0.02 0.02 0.05
3 Partnership 18.15 1.24 1.75 1.34 8.78 7.96 3.44 2.81 2.24 2.07 1.55 1.45 1.90 1.94
4 Public Limited Company 28.19 75.18 68.97 73.65 56.01 55.00 70.39 65.30 73.05 74.27 69.76 79.85 59.13 72.23
5 Private Limited Company 39.58 23.11 28.31 24.11 30.16 31.95 22.77 28.92 22.46 21.61 27.81 17.29 35.32 24.29
6 Corporate Sector (4+5) 67.76 98.29 97.27 97.76 86.16 86.96 93.16 94.23 95.51 95.88 97.56 97.14 94.45 96.52
7 Khadi & Village Industry 0.19 0.10 0.16 0.36 0.63 0.65 0.64 0.63 0.09 0.09 0.10 0.07 0.02 0.96
8 Co-operative Society 0.39 0.04 0.04 0.05 0.38 0.39 0.64 0.63 0.45 0.39 0.11 0.15 0.05 0.03
Total 100.00 100.00 100.00 100.00 100.00 100.00 100.00 100.00 100.00 100.00 100.00 100.00 100.00 100.00

45
Annual Survey of Industries 2004-05 Annexure 5.3 - Structural Ratios and Technical Co-efficient by By Type of Ownership
Ratio
Sl No Type of Organisation Fixed Capital per person engaged
Net Value Added per person
engaged
Wages per Worker Fixed capital to
Net Value Added Fixed Capital to
Gross Output Net Value Added to Gross Output
Total emoluments to Net Value Added
1 2 3 4 5 6 7 8 9
1 Individual Proprietors 0.80 2.36 0.39 0.34 0.05 0.14 0.20
2 Joint Family (HUF) 3.87 1.25 0.28 3.11 0.56 0.18 0.26
3 Partnership 1.72 1.44 0.29 1.20 0.16 0.13 0.27
4 Public Limited Company 15.12 11.48 0.93 1.32 0.27 0.21 0.11
5 Private Limited Company 8.00 4.28 0.56 1.87 0.29 0.15 0.23
6 Corporate Sector (4+5) 12.50 8.83 0.80 1.42 0.28 0.20 0.13
7 Khadi & Village Industry 1.74 0.85 0.76 2.05 0.31 0.15 1.25
8 Co-operative Society 1.10 3.13 1.26 0.35 0.03 0.08 0.56
Total 11.06 7.91 0.74 1.40 0.27 0.19 0.14
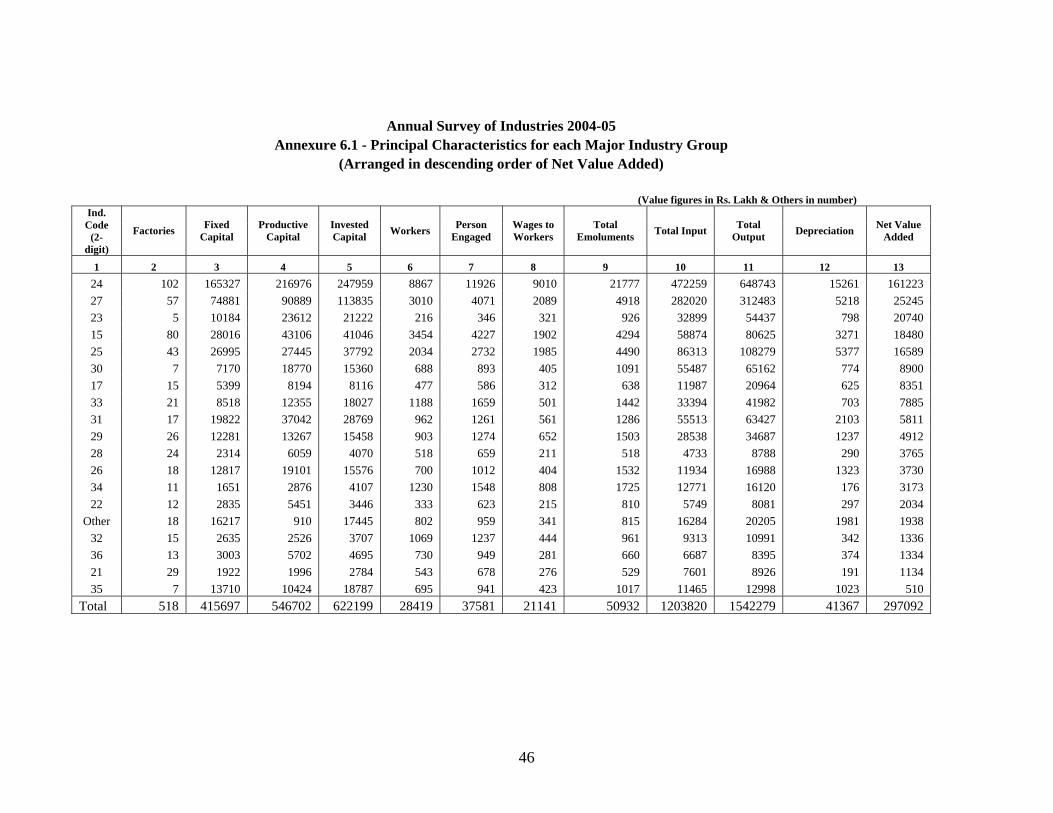
46
Annual Survey of Industries 2004-05 Annexure 6.1 - Principal Characteristics for each Major Industry Group
(Arranged in descending order of Net Value Added) (Value figures in Rs. Lakh & Others in number)
Ind. Code
(2-digit)
Factories Fixed Capital
Productive Capital
Invested Capital Workers Person
Engaged Wages to Workers
Total Emoluments Total Input Total
Output Depreciation Net Value Added
1 2 3 4 5 6 7 8 9 10 11 12 13 24 102 165327 216976 247959 8867 11926 9010 21777 472259 648743 15261 161223 27 57 74881 90889 113835 3010 4071 2089 4918 282020 312483 5218 25245 23 5 10184 23612 21222 216 346 321 926 32899 54437 798 20740 15 80 28016 43106 41046 3454 4227 1902 4294 58874 80625 3271 18480 25 43 26995 27445 37792 2034 2732 1985 4490 86313 108279 5377 16589 30 7 7170 18770 15360 688 893 405 1091 55487 65162 774 8900 17 15 5399 8194 8116 477 586 312 638 11987 20964 625 8351 33 21 8518 12355 18027 1188 1659 501 1442 33394 41982 703 7885 31 17 19822 37042 28769 962 1261 561 1286 55513 63427 2103 5811 29 26 12281 13267 15458 903 1274 652 1503 28538 34687 1237 4912 28 24 2314 6059 4070 518 659 211 518 4733 8788 290 3765 26 18 12817 19101 15576 700 1012 404 1532 11934 16988 1323 3730 34 11 1651 2876 4107 1230 1548 808 1725 12771 16120 176 3173 22 12 2835 5451 3446 333 623 215 810 5749 8081 297 2034
Other 18 16217 910 17445 802 959 341 815 16284 20205 1981 1938 32 15 2635 2526 3707 1069 1237 444 961 9313 10991 342 1336 36 13 3003 5702 4695 730 949 281 660 6687 8395 374 1334 21 29 1922 1996 2784 543 678 276 529 7601 8926 191 1134 35 7 13710 10424 18787 695 941 423 1017 11465 12998 1023 510
Total 518 415697 546702 622199 28419 37581 21141 50932 1203820 1542279 41367 297092
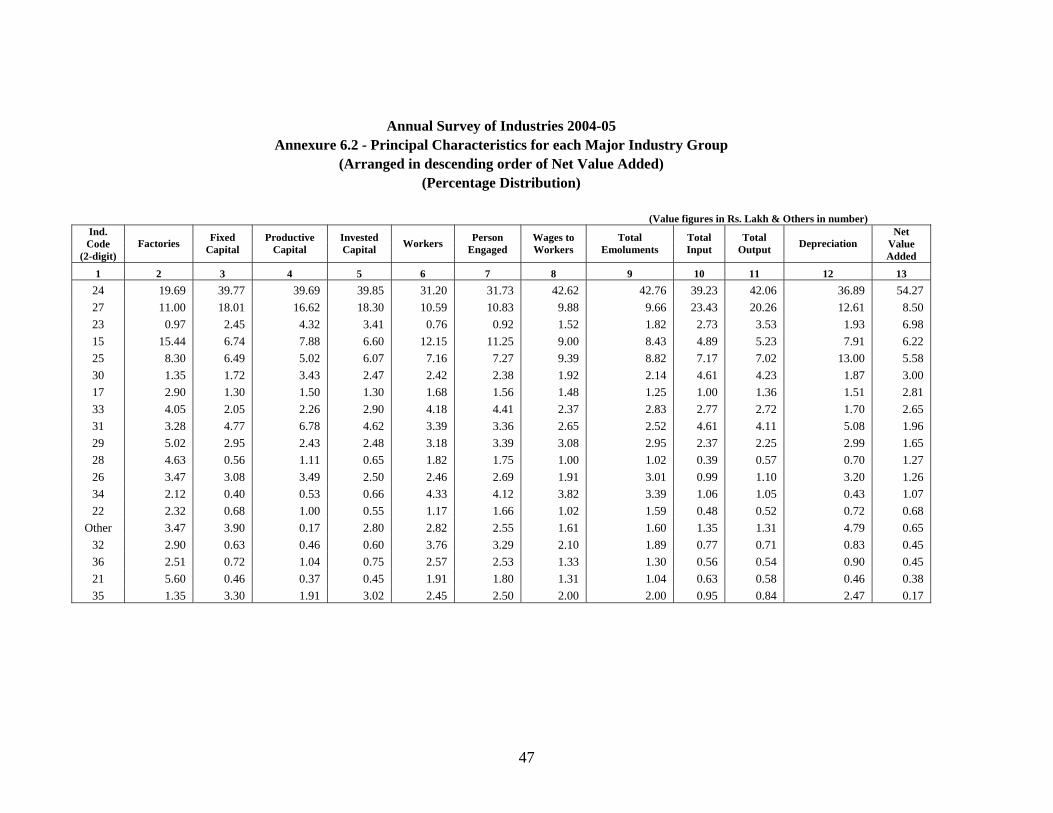
47
Annual Survey of Industries 2004-05 Annexure 6.2 - Principal Characteristics for each Major Industry Group
(Arranged in descending order of Net Value Added) (Percentage Distribution)
(Value figures in Rs. Lakh & Others in number)
Ind. Code
(2-digit) Factories Fixed
Capital Productive
Capital Invested Capital Workers Person
Engaged Wages to Workers
Total Emoluments
Total Input
Total Output Depreciation
Net Value Added
1 2 3 4 5 6 7 8 9 10 11 12 13 24 19.69 39.77 39.69 39.85 31.20 31.73 42.62 42.76 39.23 42.06 36.89 54.27 27 11.00 18.01 16.62 18.30 10.59 10.83 9.88 9.66 23.43 20.26 12.61 8.50 23 0.97 2.45 4.32 3.41 0.76 0.92 1.52 1.82 2.73 3.53 1.93 6.98 15 15.44 6.74 7.88 6.60 12.15 11.25 9.00 8.43 4.89 5.23 7.91 6.22 25 8.30 6.49 5.02 6.07 7.16 7.27 9.39 8.82 7.17 7.02 13.00 5.58 30 1.35 1.72 3.43 2.47 2.42 2.38 1.92 2.14 4.61 4.23 1.87 3.00 17 2.90 1.30 1.50 1.30 1.68 1.56 1.48 1.25 1.00 1.36 1.51 2.81 33 4.05 2.05 2.26 2.90 4.18 4.41 2.37 2.83 2.77 2.72 1.70 2.65 31 3.28 4.77 6.78 4.62 3.39 3.36 2.65 2.52 4.61 4.11 5.08 1.96 29 5.02 2.95 2.43 2.48 3.18 3.39 3.08 2.95 2.37 2.25 2.99 1.65 28 4.63 0.56 1.11 0.65 1.82 1.75 1.00 1.02 0.39 0.57 0.70 1.27 26 3.47 3.08 3.49 2.50 2.46 2.69 1.91 3.01 0.99 1.10 3.20 1.26 34 2.12 0.40 0.53 0.66 4.33 4.12 3.82 3.39 1.06 1.05 0.43 1.07 22 2.32 0.68 1.00 0.55 1.17 1.66 1.02 1.59 0.48 0.52 0.72 0.68
Other 3.47 3.90 0.17 2.80 2.82 2.55 1.61 1.60 1.35 1.31 4.79 0.65 32 2.90 0.63 0.46 0.60 3.76 3.29 2.10 1.89 0.77 0.71 0.83 0.45 36 2.51 0.72 1.04 0.75 2.57 2.53 1.33 1.30 0.56 0.54 0.90 0.45 21 5.60 0.46 0.37 0.45 1.91 1.80 1.31 1.04 0.63 0.58 0.46 0.38 35 1.35 3.30 1.91 3.02 2.45 2.50 2.00 2.00 0.95 0.84 2.47 0.17
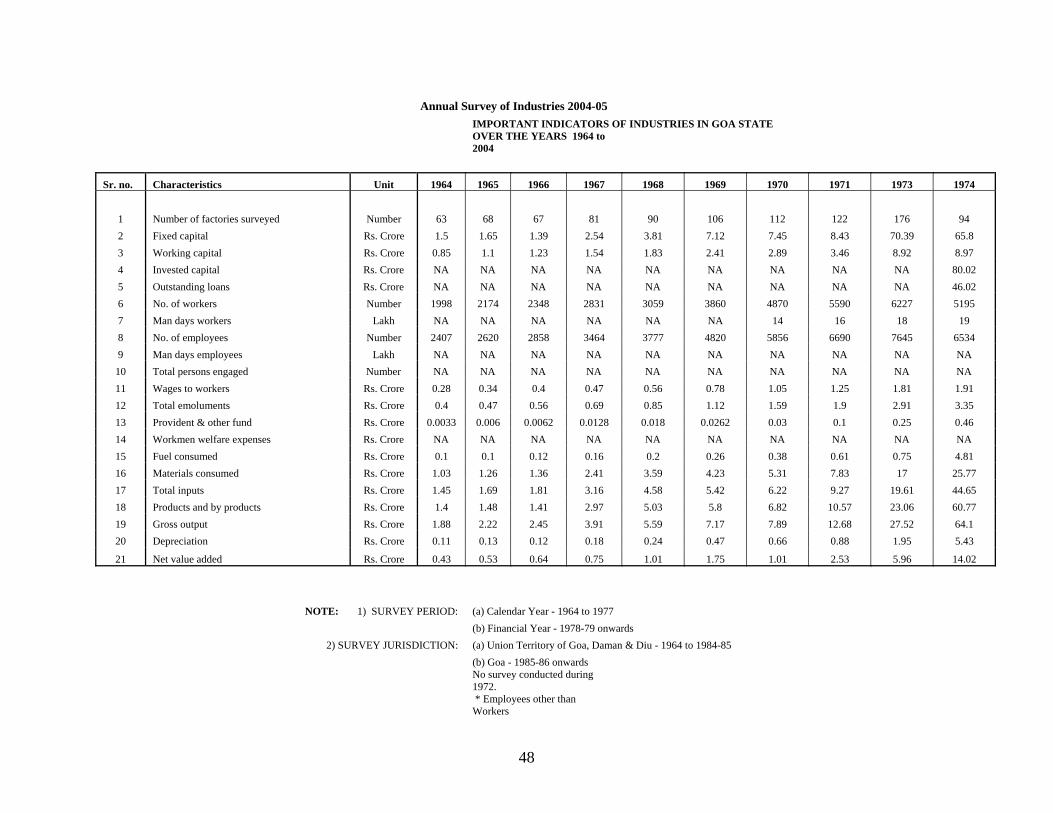
48
Annual Survey of Industries 2004-05 IMPORTANT INDICATORS OF INDUSTRIES IN GOA STATE
OVER THE YEARS 1964 to 2004
Sr. no. Characteristics Unit 1964 1965 1966 1967 1968 1969 1970 1971 1973 1974 1 Number of factories surveyed Number 63 68 67 81 90 106 112 122 176 94 2 Fixed capital Rs. Crore 1.5 1.65 1.39 2.54 3.81 7.12 7.45 8.43 70.39 65.8 3 Working capital Rs. Crore 0.85 1.1 1.23 1.54 1.83 2.41 2.89 3.46 8.92 8.97 4 Invested capital Rs. Crore NA NA NA NA NA NA NA NA NA 80.02 5 Outstanding loans Rs. Crore NA NA NA NA NA NA NA NA NA 46.02 6 No. of workers Number 1998 2174 2348 2831 3059 3860 4870 5590 6227 5195 7 Man days workers Lakh NA NA NA NA NA NA 14 16 18 19 8 No. of employees Number 2407 2620 2858 3464 3777 4820 5856 6690 7645 6534 9 Man days employees Lakh NA NA NA NA NA NA NA NA NA NA 10 Total persons engaged Number NA NA NA NA NA NA NA NA NA NA 11 Wages to workers Rs. Crore 0.28 0.34 0.4 0.47 0.56 0.78 1.05 1.25 1.81 1.91 12 Total emoluments Rs. Crore 0.4 0.47 0.56 0.69 0.85 1.12 1.59 1.9 2.91 3.35 13 Provident & other fund Rs. Crore 0.0033 0.006 0.0062 0.0128 0.018 0.0262 0.03 0.1 0.25 0.46 14 Workmen welfare expenses Rs. Crore NA NA NA NA NA NA NA NA NA NA 15 Fuel consumed Rs. Crore 0.1 0.1 0.12 0.16 0.2 0.26 0.38 0.61 0.75 4.81 16 Materials consumed Rs. Crore 1.03 1.26 1.36 2.41 3.59 4.23 5.31 7.83 17 25.77 17 Total inputs Rs. Crore 1.45 1.69 1.81 3.16 4.58 5.42 6.22 9.27 19.61 44.65 18 Products and by products Rs. Crore 1.4 1.48 1.41 2.97 5.03 5.8 6.82 10.57 23.06 60.77 19 Gross output Rs. Crore 1.88 2.22 2.45 3.91 5.59 7.17 7.89 12.68 27.52 64.1 20 Depreciation Rs. Crore 0.11 0.13 0.12 0.18 0.24 0.47 0.66 0.88 1.95 5.43
21 Net value added Rs. Crore 0.43 0.53 0.64 0.75 1.01 1.75 1.01 2.53 5.96 14.02
NOTE: 1) SURVEY PERIOD: (a) Calendar Year - 1964 to 1977 (b) Financial Year - 1978-79 onwards
2) SURVEY JURISDICTION: (a) Union Territory of Goa, Daman & Diu - 1964 to 1984-85 (b) Goa - 1985-86 onwards
No survey conducted during 1972.
* Employees other than Workers
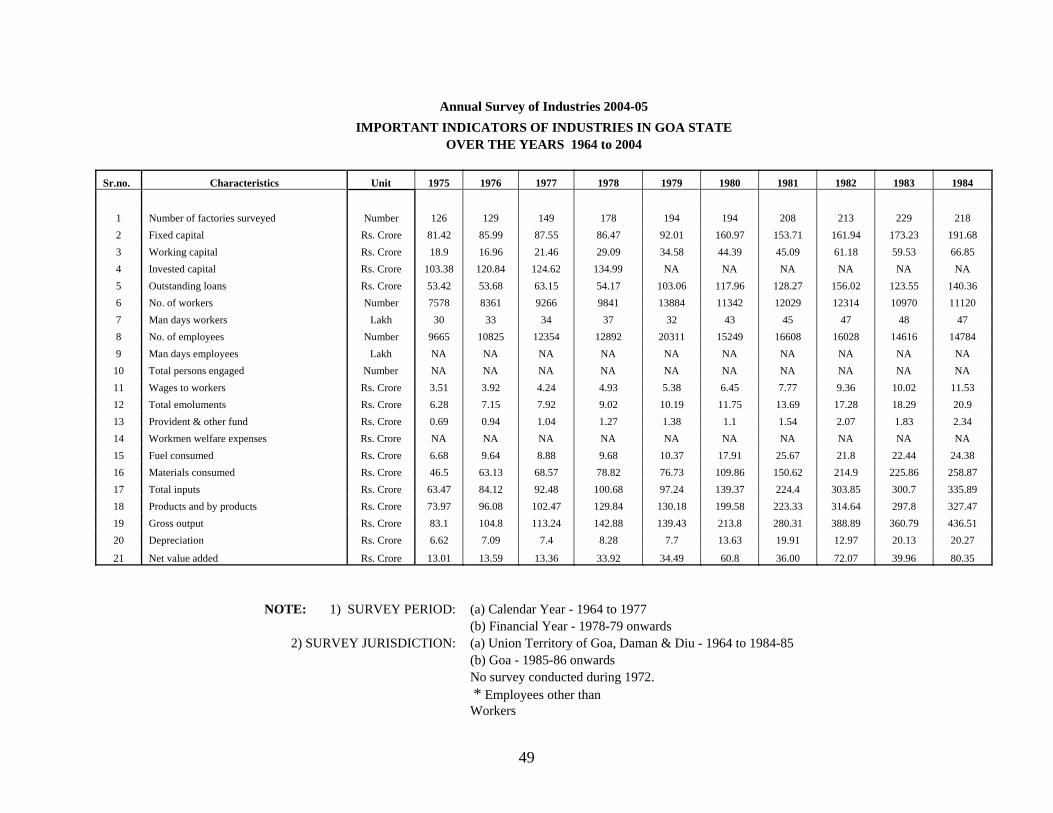
49
Annual Survey of Industries 2004-05 IMPORTANT INDICATORS OF INDUSTRIES IN GOA STATE
OVER THE YEARS 1964 to 2004
Sr.no. Characteristics Unit 1975 1976 1977 1978 1979 1980 1981 1982 1983 1984
1 Number of factories surveyed Number 126 129 149 178 194 194 208 213 229 218 2 Fixed capital Rs. Crore 81.42 85.99 87.55 86.47 92.01 160.97 153.71 161.94 173.23 191.68 3 Working capital Rs. Crore 18.9 16.96 21.46 29.09 34.58 44.39 45.09 61.18 59.53 66.85 4 Invested capital Rs. Crore 103.38 120.84 124.62 134.99 NA NA NA NA NA NA 5 Outstanding loans Rs. Crore 53.42 53.68 63.15 54.17 103.06 117.96 128.27 156.02 123.55 140.36 6 No. of workers Number 7578 8361 9266 9841 13884 11342 12029 12314 10970 11120 7 Man days workers Lakh 30 33 34 37 32 43 45 47 48 47 8 No. of employees Number 9665 10825 12354 12892 20311 15249 16608 16028 14616 14784 9 Man days employees Lakh NA NA NA NA NA NA NA NA NA NA 10 Total persons engaged Number NA NA NA NA NA NA NA NA NA NA 11 Wages to workers Rs. Crore 3.51 3.92 4.24 4.93 5.38 6.45 7.77 9.36 10.02 11.53 12 Total emoluments Rs. Crore 6.28 7.15 7.92 9.02 10.19 11.75 13.69 17.28 18.29 20.9 13 Provident & other fund Rs. Crore 0.69 0.94 1.04 1.27 1.38 1.1 1.54 2.07 1.83 2.34 14 Workmen welfare expenses Rs. Crore NA NA NA NA NA NA NA NA NA NA 15 Fuel consumed Rs. Crore 6.68 9.64 8.88 9.68 10.37 17.91 25.67 21.8 22.44 24.38 16 Materials consumed Rs. Crore 46.5 63.13 68.57 78.82 76.73 109.86 150.62 214.9 225.86 258.87 17 Total inputs Rs. Crore 63.47 84.12 92.48 100.68 97.24 139.37 224.4 303.85 300.7 335.89 18 Products and by products Rs. Crore 73.97 96.08 102.47 129.84 130.18 199.58 223.33 314.64 297.8 327.47 19 Gross output Rs. Crore 83.1 104.8 113.24 142.88 139.43 213.8 280.31 388.89 360.79 436.51 20 Depreciation Rs. Crore 6.62 7.09 7.4 8.28 7.7 13.63 19.91 12.97 20.13 20.27
21 Net value added Rs. Crore 13.01 13.59 13.36 33.92 34.49 60.8 36.00 72.07 39.96 80.35
NOTE: 1) SURVEY PERIOD: (a) Calendar Year - 1964 to 1977 (b) Financial Year - 1978-79 onwards
2) SURVEY JURISDICTION: (a) Union Territory of Goa, Daman & Diu - 1964 to 1984-85 (b) Goa - 1985-86 onwards No survey conducted during 1972.
* Employees other than Workers

50
Annual Survey of Industries 2004-05 IMPORTANT INDICATORS OF INDUSTRIES IN GOA STATE
OVER THE YEARS 1964 to 2004 Sr.no. Characteristics Unit 1985 1986 1987 1988 1989 1990 1991 1992 1993 1994
1 Number of factories surveyed Number 216 229 227 206 222 235 257 258 251 256 2 Fixed capital Rs. Crore 162.58 178.44 177.51 196.55 241.91 269.07 366.04 366.79 673.06 604.38 3 Working capital Rs. Crore 85.68 94.64 110.95 78.96 110.26 79.71 131.04 141.41 338.82 242.7 4 Invested capital Rs. Crore NA NA NA 356.33 438.99 470.01 620.91 727.98 1039.09 1011.33 5 Outstanding loans Rs. Crore 124.22 141.41 159.58 79.44 134.57 131.38 223.75 249.39 293.26 410.54 6 No. of workers Number 11530 11071 10833 11131 12766 12447 14214 13573 14244 14691 7 Man days workers Lakh 49 49 53 35 40 40 46 47 46 48 8 No. of employees Number 15256 15032 15003 15200 17416 17206 19637 18854 20033 20228 9 Man days employees Lakh NA NA NA NA NA NA NA NA 65 67
10 Total persons engaged Number NA NA NA NA NA NA NA NA 20123 20305 11 Wages to workers Rs. Crore 13.57 15.22 16.86 20.14 24.61 26.38 34.49 38.87 45.72 48.89 12 Total emoluments Rs. Crore 25.66 27.08 33.62 44.97 52.91 57.81 77.2 84.23 105.08 111.44 13 Provident & other fund Rs. Crore 3.74 4.65 6.04 11.74 12.07 13.18 18.94 19.55 7.76 8.05 14 Workmen welfare expenses Rs. Crore NA NA NA NA NA NA NA NA 10.75 10.98 15 Fuel consumed Rs. Crore 27.61 32.62 31.33 35.52 38.72 39.37 64.18 85.24 89.3 124.07 16 Materials consumed Rs. Crore 321.57 32.62 356.96 522.71 635.43 626.53 974.53 1069.82 388.34 1434.68 17 Total inputs Rs. Crore 415.57 482.02 420.58 596.93 722.02 723.69 1110.27 1245.55 595.71 1706.8 18 Products and by products Rs. Crore 433.19 536.83 511.08 739.42 876.16 884.12 1336.23 1460.72 1347.05 2509.71 19 Gross output Rs. Crore 516.01 624.88 543.17 775.23 924.7 907.74 1416.6 1557.7 1054.2 2166.4 20 Depreciation Rs. Crore 17.08 23.35 25.97 21.16 27.83 30.64 40.8 46.76 53.67 57
21 Net value added Rs. Crore 83.36 119.51 96.62 157.14 174.85 153.4 265.53 265.38 404.81 402.6
NOTE: 1) SURVEY PERIOD: (a) Calendar Year - 1964 to 1977 (b) Financial Year - 1978-79 onwards
2) SURVEY JURISDICTION: (a) Union Territory of Goa, Daman & Diu - 1964 to 1984-85 (b) Goa - 1985-86 onwards No survey conducted during 1972.
* Employees other than Workers
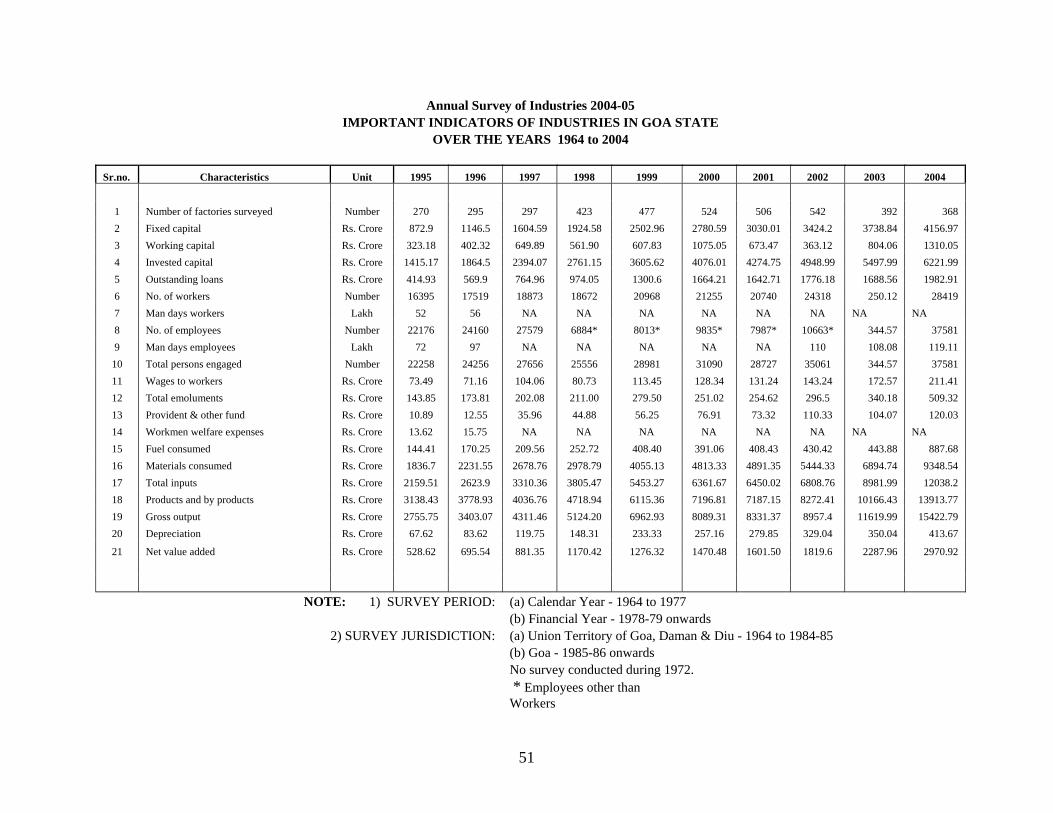
51
Annual Survey of Industries 2004-05 IMPORTANT INDICATORS OF INDUSTRIES IN GOA STATE
OVER THE YEARS 1964 to 2004 Sr.no. Characteristics Unit 1995 1996 1997 1998 1999 2000 2001 2002 2003 2004
1 Number of factories surveyed Number 270 295 297 423 477 524 506 542 392 368 2 Fixed capital Rs. Crore 872.9 1146.5 1604.59 1924.58 2502.96 2780.59 3030.01 3424.2 3738.84 4156.97 3 Working capital Rs. Crore 323.18 402.32 649.89 561.90 607.83 1075.05 673.47 363.12 804.06 1310.05 4 Invested capital Rs. Crore 1415.17 1864.5 2394.07 2761.15 3605.62 4076.01 4274.75 4948.99 5497.99 6221.99 5 Outstanding loans Rs. Crore 414.93 569.9 764.96 974.05 1300.6 1664.21 1642.71 1776.18 1688.56 1982.91 6 No. of workers Number 16395 17519 18873 18672 20968 21255 20740 24318 250.12 28419 7 Man days workers Lakh 52 56 NA NA NA NA NA NA NA NA 8 No. of employees Number 22176 24160 27579 6884* 8013* 9835* 7987* 10663* 344.57 37581 9 Man days employees Lakh 72 97 NA NA NA NA NA 110 108.08 119.11 10 Total persons engaged Number 22258 24256 27656 25556 28981 31090 28727 35061 344.57 37581 11 Wages to workers Rs. Crore 73.49 71.16 104.06 80.73 113.45 128.34 131.24 143.24 172.57 211.41 12 Total emoluments Rs. Crore 143.85 173.81 202.08 211.00 279.50 251.02 254.62 296.5 340.18 509.32 13 Provident & other fund Rs. Crore 10.89 12.55 35.96 44.88 56.25 76.91 73.32 110.33 104.07 120.03 14 Workmen welfare expenses Rs. Crore 13.62 15.75 NA NA NA NA NA NA NA NA 15 Fuel consumed Rs. Crore 144.41 170.25 209.56 252.72 408.40 391.06 408.43 430.42 443.88 887.68 16 Materials consumed Rs. Crore 1836.7 2231.55 2678.76 2978.79 4055.13 4813.33 4891.35 5444.33 6894.74 9348.54 17 Total inputs Rs. Crore 2159.51 2623.9 3310.36 3805.47 5453.27 6361.67 6450.02 6808.76 8981.99 12038.2 18 Products and by products Rs. Crore 3138.43 3778.93 4036.76 4718.94 6115.36 7196.81 7187.15 8272.41 10166.43 13913.77 19 Gross output Rs. Crore 2755.75 3403.07 4311.46 5124.20 6962.93 8089.31 8331.37 8957.4 11619.99 15422.79 20 Depreciation Rs. Crore 67.62 83.62 119.75 148.31 233.33 257.16 279.85 329.04 350.04 413.67
21 Net value added Rs. Crore 528.62 695.54 881.35 1170.42 1276.32 1470.48 1601.50 1819.6 2287.96 2970.92
NOTE: 1) SURVEY PERIOD: (a) Calendar Year - 1964 to 1977 (b) Financial Year - 1978-79 onwards 2) SURVEY JURISDICTION: (a) Union Territory of Goa, Daman & Diu - 1964 to 1984-85 (b) Goa - 1985-86 onwards No survey conducted during 1972.
* Employees other than Workers
52
NATIONAL INDUSTRIAL CLASSIFI CATION (NIC 2004)
15 151
Production, processing and preservation of meat, fish, fruit, vegetables, oils and fats.
153 Manufacture of grain mill products, starches and starch products, and prepared animal feeds.
154 Manufacture of other food products
155 Manufacture of other beverages
17 172 Manufacture of other textiles.
21 210 Manufacture of paper and paper products
22 221 Publishing (This group includes publishing whether or not connected with publishing. Publishing involves financial, technical, artistic, legal and marketing activities, among others but not predominantly)
222 Printing and service activities related to printing
23 232 Manufacture of refined petroleum products
24 241 Manufacture of basic chemicals
242 Manufacture of other chemical products
25 251 Manufacture of rubber products
252 Manufacture of plastic products
26 261 Manufacture of glass and glass products
269 Manufacture of non-metallic mineral products n.e.c.
27 271 Manufacture of basic Iron & Steel
272 Manufacture of basic precious and non-precious metals
273 Casting of metals (This group includes casting finished or Semi-finished products producing a variety of goods, all characteristic of other activity classes)
28 281 Manufacture of structural metal products, tanks, reservoirs and steam
289 Manufacture of other fabricated metal products; metal working service activities
53
29 291 Manufacture of general purpose machinery
293 Manufacture of domestic appliances, n.e.c.
30 300 Manufacture of office, accounting and computing machinery
31 311 Manufacture of electric motors, generators and transformers
313 Manufacture of insulated wire and cable [insulated (including enameled or anodized) wire, cable (including coaxial cable) and other insulated conductors; insulated strip as is used in large capacity machines or control equipment; and optical fiber cables]
319 Manufacture of other electrical equipment n.e.c.
32 321 Manufacture of electronic valves and tubes and other electronic component
322 Manufacture of television and radio transmitters and apparatus for line telephony and line telegraphy
323 Manufacture of television and radio receivers, sounds or video recording or reproducing apparatus, and associated goods
33 331 Manufacture of medical appliances and instruments and appliances for measuring, checking, testing, navigating and other purposes except optical instruments
332 Manufacture of optical instruments and photographic equipment
333 Manufacture of watches and clocks
34 341 Manufacture of motor vehicles
342 Manufacture of bodies (coach work) for motor vehicles; manufacture of trailers and semi-trailers
343 Manufacture of parts and accessories for motor vehicle and their engines [brakes, gear boxes, axles, road wheels, suspension shock absorbers, radiators, silencers, exhaust pipes, clutches, steering wheels, steering columns and steering boxes and other parts and accessories n.e.c.
35 351 Building and repair of ships & boats
36 361 Manufacture of furniture
369 Manufacture n.e.c.
40 400 Electricity, Gas, Steam and Hot water supply

54