a relational study on export market orientation and...
TRANSCRIPT

DOI: 10.21276/sjebm.2017.4.1.7
Available Online: http://saspjournals.com/sjebm 47
Scholars Journal of Economics, Business and Management e-ISSN 2348-5302
Sch J Econ Bus Manag, 2017; 4(1):47-61 p-ISSN 2348-8875
© SAS Publishers (Scholars Academic and Scientific Publishers)
(An International Publisher for Academic and Scientific Resources)
A Relational Study on Export Market Orientation and Business Performance Dr. Uma Shankar Singh
1
1Faculty of Administrative Sciences and Economics, ISHIK UNIVERSITY, Erbil, Kurdistan
*Corresponding Author
Dr. Uma Shankar Singh
Email: [email protected]
Abstract: The study is descriptive in naure based on the concept of export market orientation with small and medium
enterprises in Erbil. The extensive literature review lead to the research problem as Having a vast scope of export,
organizations are unable to perform aptly and to get their share by showing their efficiency. The real quantitative
measurement of the efficiency of export market variables and its effect on business performance is not available in this
Erbil northern Iraq. Three research objectives set as to measure the importance of export market orientation variables, to
generate the quantitative information about the scenario of export market orientation with small and medium business in
Erbil, to justify the concept of export market orientation in the context of Erbil. The conceptual model presented above
has two types of variables, one is independent variable and other is dependent variable. The independent variable set has
four variables named as Intelligence Generation, Intelligence Dissemination, Responsiveness and Coordination
mechanism respectively as 1st, 2
nd, 3
rd and 4
th. The other side the variable is dependent variable named as Business
Performance. These independent variables are linked with dependent variables using arrows as links and named as H1,
H2, H3 and H4. 228 samples used for the study. The instrument is pretested and well justified, used for this study, with a
minor modification in the items. All four dimensions of the independent variable is well established and tested by this
instrument, It has all together 71 items, where The first dimension having 11 items, the second dimension has 18 items,
the third dimension has 8 items and the fourth dimension has 33 items measuring the independent dimension. It is very
clear in the study as per the responses of respondents all four independent variables are important for business
performance. When we see the values of R is much better showing the positive relationship and the R square as well
supportive in the limit. Kurdistan region needs to take the initiative for the development of export by export market
orientation concept.
Keywords: Market, export, orientation, business, Erbil
INTRODUCTION
As of December 2014, the KRG is exporting
almost 400,000 barrels per day, and by end of the first
quarter of 2015 that figure is expected to rise to 500,000
bpd. Production for refining and domestic consumption
continues at around 120,000-150,000 bpd. As KRG
production continues to increase, so too will its export
to the international market through the Erbil crude
pipeline and the trucking arrangements through Turkey
Hultman, M., Robson, M. J., & Katsikeas, C. S. [1].
The revenues from all export activity will be treated as
part of Erbil's constitutionally mandated share of the
federal budget and will continue to benefit the people of
the Erbil Region and Iraq. In 2014, the Region’s share
of fuel products from the Federal Government halted
due to the instability in areas of Iraq that were
administered by the federal authorities. As a result, the
Erbil Region was forced to become self-reliant on its
own production and imports of fuel products in order to
satisfy its domestic needs. These imports mostly
occurred through the crude oil for products swaps
arrangement the KRG has established through Turkey.
The Erbil Region remains focused on its plans to
substantially increase oil production after reaching its
initial target of one million barrels per day.
Market orientation can be defined as a form of
organizational culture where employees throughout the
organization are committed to continuously create
superior customer value or as a sequence of marketing
activities that lead to better performance [1]. Years of
business research have concluded that market oriented
companies perform better than companies that are less
market oriented. They focus on adapting their products
and services to the needs and expectations of their
customers, as opposed to product oriented businesses
that focus on developing a product or service that is
then marketed and hopefully sold [2]. To achieve this
customer focus, a firm with a high degree of market
orientation cultivates a set of shared values and beliefs
about putting the customer first in business planning,
and reaps results in form of a defendable competitive
advantage, decreased costs and increased profits. So,
the market orientation concept is concerned with
coordinated business intelligence generation,
intelligence dissemination and responsiveness to market
data and information for efficient and effective

Uma Shankar Singh.; Sch J Econ Bus Manag, Jan 2017; 4(1):47-61
Available Online: http://saspjournals.com/sjebm 48
marketing management decisions [3]. The concept is
also concerned with other issues including
organizational culture, innovation, human resource
planning and organizational learning. Not surprisingly,
research interest in the market orientation concept has
grown substantially [4]. Most literature on market
orientation is American, but at first sight the pattern of
antecedents and consequences seems to be similar in
Scandinavia. It may be argued that the market
orientation construct is more suitable to describe crucial
information processing in big centralized American
companies than in Scandinavian companies that may
rely more on empowered front-line units [5]. Recently,
market orientation has been subject to research in the
Nordic countries as well. The scholars have published
articles about the relationship between the degree of
market orientation and performance of Nordic service
companies. Based on data from the hotel industry, their
results indicate that market orientation has only modest
effect on productivity, but also that it can be a useful
instrument in the process of designing products and
services. Zhou et al. [6] found that nationality matters
when they compared the level of market orientation of
banks in four Nordic countries. Icelandic academics
have researched market orientation of Icelandic
companies from different perspectives.
LITERATURE REVIEW
Marketing theorists such as Zhou et al. [6]
have argued that market orientation traces its origins
from the market concept (also labeled marketing
concept) and has noteworthy consequences to overall
business strategy. The market concept is concerned with
customer-orientation, innovation and profit as an
inducement for creating satisfied customers Theories on
market orientation have been widely accepted by
scholars and academics either as the implementation of
the marketing concept, as an organizational culture, or
as a mix of those two. To simplify, ―market concept‖
and ―marketing concept‖ are used interchangeably. As
per definition, a market is a physical or non-physical
place where goods are offered for sale and marketing
the act or process of buying and selling in a market by
means of commercial functions involved in transferring
goods from producer to consumer [7].
With the intensifying globalization of world
economies, a good number of firms especially from
developing countries have resorted to exporting as an
essential activity for their future growth, profitability
and survival by Slater [8]. This is mainly because
exporting offers the simplest and cheapest means to
expand and access foreign markets compared to other
forms of international involvement such as joint
ventures and overseas [9]. However, the foreign
markets are associated with a lot of uncertainty which
necessitates firms to acquire export market information/
intelligence concerning competitors, customers, prices,
technology and government regulations disseminate this
information and act upon it. This behavior has widely
been conceptualized by authors such as Narver et al.
[10] & Prescott [11] as export market orientation.
Accordingly Matsuno, K., & Mentzer, J. T. [12]
observe that with the adoption of market oriented
behaviors, firms are able to generate information that is
particularly important for their innovativeness as it
helps them to come up with new and modified products,
ideas, processes, and subsequently enter into new
markets. Businesses aim to maximize their profit to
shareholders by creating a sustainable competitive
advantage over rivals on the market. But where
competitive advantage was once based on structural
characteristics such as market power, economies of
scale, or a broad product line, the emphasis today has
shifted to capabilities that enable a business to
consistently deliver superior value to its customers.
After all, this is the meaning of competitive advantage
Thompson, J. D. [13]. Research shows that a market-
oriented culture provides a solid foundation for these
value-creating capabilities. Van et al. [14] stated that
organizations that are well educated about their
markets, in other words market oriented organizations,
stand out in their ability to rapidly sense and act on
events in volatile and fragmenting markets.
We can reason that market orientation builds
on the same foundations as the market concept, as that
concept is believed to have three facets that are
customer focus, coordinated marketing focus and profit
focus by Hult & Slater [3]. Customer focus implies that
companies need to have intensive knowledge and
understanding of customer needs, demands an
expectations. In order to be able to fulfill those demands
and expectations with goods and services those must be
carefully charted. This is done with marketing planning,
surveys, market intelligence dissemination and
generation. Focus on integrated marketing means that
all marketing efforts of the company are in sync and
support each other. Profit focus is an important
measurement in all strategy-making and management
[15]. Even not for profit firms measure their
performance, although they use other than financial
bench marks. According to Gebhardt et al. [16] the
―old‖ marketing concept is concerned with customer-
orientation, innovation and profit as an inducement for
creating satisfied customers. The ―new‖ marketing
concept is more a business culture than a philosophy.
Philosophic questions cannot be answered empirically
by observation or experiment, while it is possible to
measure the level of culture, and then describe its
characteristics. There is consensus in the literature that
there are few differences among these labels [16],
although ―market orientation‖ has been taken as the
most appropriate label to describe the construct by Gao

Uma Shankar Singh.; Sch J Econ Bus Manag, Jan 2017; 4(1):47-61
Available Online: http://saspjournals.com/sjebm 49
[17]. The following text gives a number of the most
frequently used classifications and definitions. The
marketing concept can be classified into two parts,
being the ―old‖ marketing concept and the ―new‖
marketing concept. Market orientation can be defined as
a form of organizational culture where employees
throughout the organization are systematically and
entirely committed to the continuous creation of
superior customer value. Cadogan et al. [15] argued that
the market orientation of an organization is one of
degree rather than one of presence or absence. Batson,
A [18] confirms the view that market orientation cannot
be turned on or off. Being marketing orientated is more
than just being customer-led. It requires the full support
of the organization to be fully implemented in the long
term and, in most cases, may need a complete change in
an organization’s culture.
Terms such as market-oriented, market-driven
and customer-focused have become synonymous with
proactive business strategy in organizations all over the
world. The notion that the customer needs to be at the
origin of business planning processes seems a very
contemporary one, as is the idea of organizing the
firm´s activities around a thorough understanding of
customer needs and demands. Many management
theorists cite Peter Ducker’s statement from 1954 that
marketing is not a specialized functional activity but
rather ―the whole business seen from the point of view
of its final result, that is, from the customer´s point of
view.‖ The market orientation concept builds on the
marketing concept which is a relatively new academic.
According to Krasnikov, A., & Jayachandran, S. [19]
the three major components of market orientation -
customer orientation, competitor focus, and cross-
functional coordination - are long-term in vision and
profit-driven. Based on extensive interviews with
managers and executives, they conclude that market
orientation provides a unifying focus for the efforts and
projects of individuals, thereby leading to superior
performance [17]. A developing stream of empirical
research has found a strong relationship between market
orientation and several measures of business
performance, including profitability, customer
retention, satisfaction, innovation, sales growth, and
new product success. In order to become market
oriented, all employees must participate in working
towards a common goal. Employees that feel that their
colleagues support and empower them are more likely
to create superior customer value Kotler, P. [20].
Therefore, cross functional coordination between
employees is very important for organizations that want
to create a high degree of market orientation.
Research Problem
Today´s marketing concept comprises
customer orientation, distinctive advantages, market
intelligence, value or quality delivery, continuous
improvement in goods and services, customer-oriented
business culture, and coordinated and integrated
business activities in the whole organization creating a
competitive advantage. In order to get this job done,
organizations must gather and analyze market
knowledge and empower their people with it [21].
Market orientation involves an outward looking
perspective from a firm, meaning that it should not only
focus on customers but also on competitors, the
development of their business sector and the work
environment as a whole [22]. Newbert, S. L. [23] poses
that the fit of market orientation within a firm is
threefold: as part the development of strategic
competence as a learning organization; as part of a
market knowledge management system and as a
foundation for corporate strategy [24]. Since market-
oriented firms can generate and disseminate market
intelligence about their customers and competitor’s
activities and respond promptly, market orientation
enables firms to develop marketing capabilities in the
export market [25]. Thus, to realistically evaluate the
market orientation–performance relationship, it is
imperative to include the development of marketing
capabilities by investigating the internal process
through which market orientation influences
performance by Akyol, A., & Akehurst, G. [26].
Managers choose or adopt organizational structures,
activities, processes, and strategies that reflect the
specific conditions of their organizations by Zeithaml et
al. [27]. Thus, it is not market orientation per se that
affects performance, but rather using market orientation
in developing marketing capabilities to improve
performance [28]. Therefore, we posit that various
marketing capabilities mediate the market orientation–
performance relationship. Though the export market
orientation is facing so many limitations and challenges,
then too the study is concentrated on the problem that
“Having a vast scope of export, organizations are
unable to perform aptly and to get their share by
showing their efficiency. The real quantitative
measurement of the efficiency of export market
variables and its effect on business performance is not
available in this Erbil northern Iraq"
Research Objective
The research conducted here can be of broader
dimension and can get expanded with deeper study.
Based on the scope of the research, this study has set
the following objectives to solve the research problem
by answering the research questions.
To measure the importance of export market
orientation variables.
To generate the quantitative information about
the scenario of export market orientation with
small and medium business in Erbil.

Uma Shankar Singh.; Sch J Econ Bus Manag, Jan 2017; 4(1):47-61
Available Online: http://saspjournals.com/sjebm 50
To justify the concept of export market orientation in the context of Erbil.
Independent Variables Dependent Variables
Picture 1: Conceptual Model
The conceptual model presented above has two
types of variables, one is independent variable and other
is dependent variable. The independent variable set has
four variables named as Intelligence Generation,
Intelligence Dissemination, Responsiveness and
Coordination mechanism respectively as 1st, 2
nd, 3
rd and
4th
. The other side the variable is dependent variable
named as Business Performance. These independent
variables are linked with dependent variables using
arrows as links and named as H1, H2, H3 and H4.
Research Hypothesis
H1: The intelligence generation variable does not affect
the business performance of small and medium
enterprises in ERBIL.
H2: The intelligence dissemination variable does not
affect the business performance of small and
medium enterprises in ERBIL.
H3: The responsiveness variable does not affect the
business performance of small and medium
enterprises in ERBIL.
H4: The coordination mechanism variable does not
affect the business performance of small and
medium enterprises in ERBIL.
RESEARCH METHODOLOGY
Quantitative research is used to quantify the
problem by way of generating numerical data or data
that can be transformed into useable statistics. It is used
to quantify attitudes, opinions, behaviors, and other
defined variables – and generalize results from a larger
sample population. Quantitative Research uses
measurable data to formulate facts and uncover patterns
in research. Quantitative data collection methods are
much more structured than Qualitative data collection
methods. Quantitative data collection methods include
various forms of surveys – online surveys, mobile
surveys, kiosk surveys, face-to-face interviews and
systematic observations.
Generally we can collect data from two
sources, primary sources and secondary sources. Data
collected from primary sources are known as primary
data and data collected from secondary sources are
called secondary data. Primary data are also known as
raw data. Data are collected from the original source in
a controlled or an uncontrolled environment. Example
of a controlled environment is experimental research
where certain variables are being controlled by the
researcher. On the other hand, data collected through
observation or questionnaire survey in a natural setting
are examples data obtained in an uncontrolled
environment. Secondary data are data obtained from
secondary sources such as reports, books, journals,
documents, magazines, the web and more. In order to
collect the data set needed to test the research questions,
a cross-sectional study design was used. This design
was most convenient as the questionnaire was only sent
out once to a single population element. Cross-sectional
study design fits studies that aim to analyze a

Uma Shankar Singh.; Sch J Econ Bus Manag, Jan 2017; 4(1):47-61
Available Online: http://saspjournals.com/sjebm 51
phenomenon, problem, situation, attitude or issue by
considering a cross-section of a certain population at
one point in time. This type of design is comfortable
both for the researcher and the participants. Matter of
fact, the majority of market orientation studies
described in literature use this study design. The table
shown below is the complete list of companies working
in Erbil northern Iraq for export in different industry.
This has given the clear number of employees working
in the export business. The sample selection done
randomly, using simple random sampling method of
probability sampling. Where firstly 350 respondents
selected for the survey, out of 300, only 256
respondents returned the filled up instrument. Again
after checking for the completion only 228 samples
found usable. So finally 228 samples used for the study.
Table-1: List of Companies
Sl.
No.
Company Name Establishment Sector No. of
Employers
1 Salahaddin Holding 1991 Construction Materials, Printing,
Pharmaceuticals, Food & Beverage, Oil.
12,000
2 Kar Company 1999 Dairy Products, Brick, Pharmaceutical,
Beverage Bottling And Distribution.
14,000
3 Nokan Group &
Companies
1993 Internal And External Trading, Large
And Small Industry, Oil.
17,000
4 Faruk Group &
Companies
2008 Telecommunication & IT, Cement,
Construction, Industry, Energy, Oil.
13,000
5 Zagros Group,
Companies
2005 Zagros General Contracting, Zagros
Energy Group, Oil.
14,000
6 Ster Group &
Companies
2006 Construction, Consultancy
Environmental Engineering,
13,000
7 UB Holding 2001 Iron & Steel Projects 20,000
8 Mass Group 2008 Produces Electrical Energy, Cement,
Steel,
7,000
9 Darin Group 1998 Erbil Steel Factory, Flour Factor, Food
Industry.
8,000
10 Alban Diary Product 2004 Production Of Cheese, Milk, Eggs,
Yogurt.
1,800
11 Bakoor General
Trading
2004 Quality Mineral Water, Cup Procedure. 400
12 Zer Group 2007 Sunflower Oil, Corn Oil And Olive Oil,
Vegetable Ghee,
7,000
13 SWDCG 2005 Crude Oil, Oil Products, Natural Gas. 1,900
14 SHAGOOL
GLASWARE
1990 Beverages, Confectionery, Sanitary
Articles, Cosmetics And Household
Chemicals.
4,000
15 ROJMAN
COMPANY
1998 Company For Electric Cables, Wire. 2,500
16 ALPHA ACOUSTIKI
LTD
1991 Ant Vibration Products, Vibration
Control.
2,000
17 Azad Rice Company 2002 All Kind Of Rice. 1,000
18 Cover Cartoon Box 2005 Cover Carton, Manufacturer And
Supplier.
350
19 ECKHARDT STEEL
& ALLOYS
2008 Exporters & Suppliers Of Stainless Steel. 1,400
20 AL-SHIMAL
GROUP
2011 Manufacturing Of Animal Feeds. 1,500
22 BCC Logestic Erbil 2003 Logistics Support And Services Ranging. 1,900
23 Awamedica Company 2004 Awamedica Develops. Pharmaceutical 1,000
24 Empire World 2007 Iraq Oil and Trading. 7,000
26 Abor Oil & Gas 2010 General Trading, Oil. 2,000
27 DNO International
Company.
2009 DNO Explores For Oil And Natural Gas. 2,000
Uma Shankar Singh.; Sch J Econ Bus Manag, Jan 2017; 4(1):47-61
Available Online: http://saspjournals.com/sjebm 52
28 Black Lake Company
- Proactive Not
Reactive
2011 Mineral Water, Constricting 2,000
29 Awra Company 2007 Shell Mineral Oils Serve To The People
Of Iraq.
1,000
30 Marathon Oil Service 2009 Living Our Values 4,000
31 KRG Asian Food
B.V.
2005 Foods, Such As Rice, Flour, Drink. 4,000
32 Active Food 2004 Elit Chocolate, Polen Food, Tea, Tago
Baked Cookies.
1,000
33 Ronesans Insaat 1993 Multifunctional Complexes, High-Rise
Buildings.
1,400
34 Zheela Food And
Dairy
1999 Construction Of Buildings And The
Restored. Road Construction.
2,000
35 Dlba Company For
Food Trading
2005 Egg , Ayran , Yogurt , Milk , Ice Cream ,
Cheese.
1,000
36 Meer Group 2006 Planting, Harvesting, Cleaning And
Distributing General Trades.
1,200
37 Al Safi Danoon Dairy 2001 Cheese, Egg, Yogurt..Etc 1,500
38 Ranj Company 1999 Construction, Investment And
Development
1,200
39 Orkila Group 2003 Pharmaceuticals, Food, Animal Nutrition 1,000
40 Gavleen Company 2004 Oil And Service Companies. 1,200
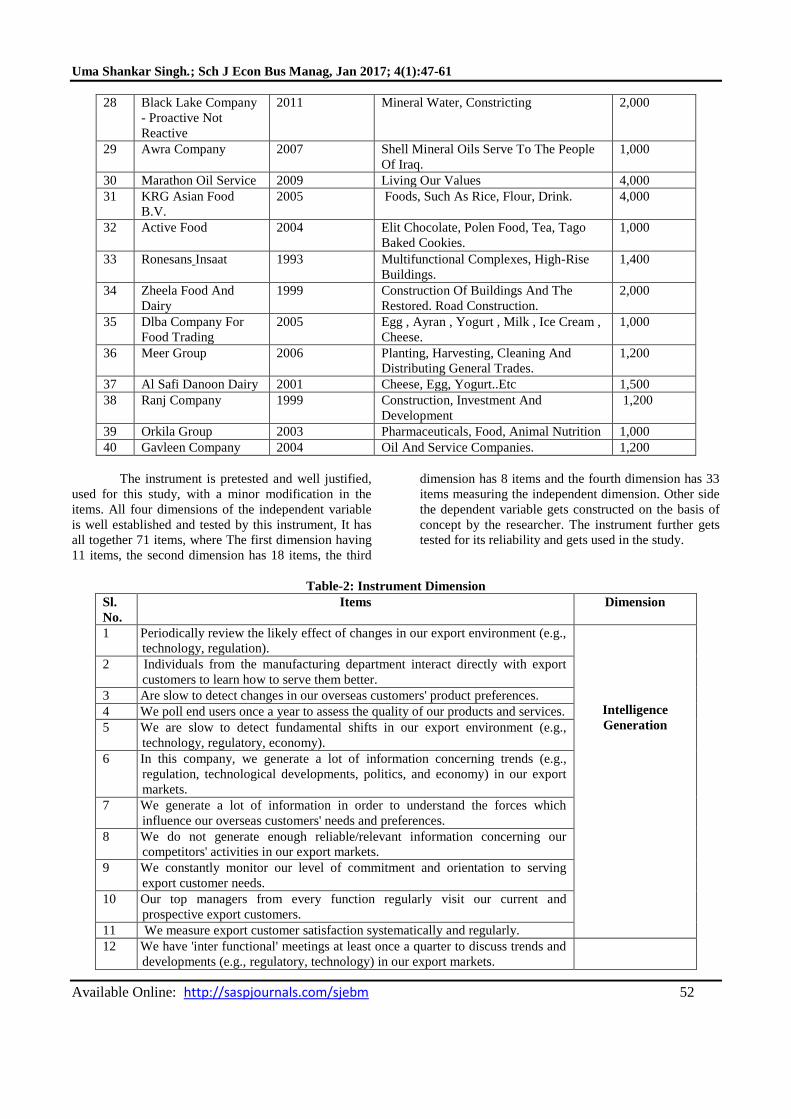
The instrument is pretested and well justified,
used for this study, with a minor modification in the
items. All four dimensions of the independent variable
is well established and tested by this instrument, It has
all together 71 items, where The first dimension having
11 items, the second dimension has 18 items, the third
dimension has 8 items and the fourth dimension has 33
items measuring the independent dimension. Other side
the dependent variable gets constructed on the basis of
concept by the researcher. The instrument further gets
tested for its reliability and gets used in the study.
Table-2: Instrument Dimension
Sl.
No.
Items Dimension
1 Periodically review the likely effect of changes in our export environment (e.g.,
technology, regulation).
Intelligence
Generation
2 Individuals from the manufacturing department interact directly with export
customers to learn how to serve them better.
3 Are slow to detect changes in our overseas customers' product preferences.
4 We poll end users once a year to assess the quality of our products and services.
5 We are slow to detect fundamental shifts in our export environment (e.g.,
technology, regulatory, economy).
6 In this company, we generate a lot of information concerning trends (e.g.,
regulation, technological developments, politics, and economy) in our export
markets.
7 We generate a lot of information in order to understand the forces which
influence our overseas customers' needs and preferences.
8 We do not generate enough reliable/relevant information concerning our
competitors' activities in our export markets.
9 We constantly monitor our level of commitment and orientation to serving
export customer needs.
10 Our top managers from every function regularly visit our current and
prospective export customers.
11 We measure export customer satisfaction systematically and regularly.
12 We have 'inter functional' meetings at least once a quarter to discuss trends and
developments (e.g., regulatory, technology) in our export markets.

Uma Shankar Singh.; Sch J Econ Bus Manag, Jan 2017; 4(1):47-61
Available Online: http://saspjournals.com/sjebm 53
13 Marketing personnel in our company spend time discussing export customers'
future needs with other functional areas.
Intelligence
Dissemination
14 Our company periodically circulates documents (e.g., reports, newsletters) that
provide information on export customers.
15 There is minimal communication between the export and manufacturing
departments concerning foreign market developments (e.g., regulations,
technology).
16 When one department finds out something important about foreign market
competitors, it is slow to alert other departments.
17 Important information about our export competitors is often 'lost in the system'
18 In this company, export personnel rarely pass on information on customer
preferences to other functions/units
19 Information about our export competitors activities often reaches relevant
personnel too late to be of any use
20 Important information concerning export market trends (regulatory,
technology) is often discarded as it makes its way along the communication
chain.
21 Important information concerning our major export customers is disseminated
right down to the shop floor.
22 Personnel directly involved in export operations frequently discuss export
competitors' activities with non-export personnel.
23 Export sales personnel rarely share their experiences of dealing with customers
with others.
24 Too much information concerning our export competitors is discarded before it
reaches decision makers.
25 All information concerning our export competition is shared within this
company.
26 Information which can influence the way we serve our export customers takes
forever to reach export personnel.
27 Export personnel regularly share information within our business concerning
export competitors' strategies.
28 We freely communicate information about our successful and unsuccessful
export customer experiences across all business functions.
29 Top management regularly discusses export competitors' strengths and
strategies.
30 It takes us forever to decide how to respond to our export market competitors'
price changes.
Responsiveness
31 For one reason or another we tend to ignore changes in our foreign customers'
product or service needs.
32 We periodically review our product development efforts to ensure that they are
in line with what foreign customers want.
33 Our strategy for standardizing or adapting our export product offerings is based
on detailed customer research.
34 Several 'departments' get together periodically to plan a response to changes
taking place in our foreign business environment (e.g., regulation, technology,
etc.).
35 The product lines we sell to foreign markets depend more on internal politics
than real market needs.
36 If a major competitor were to launch an intensive campaign targeted at our
foreign customers, we would implement a response immediately.
37 Foreign customer complaints fall on deaf ears in this company.
38 We are quick to respond to significant changes in our competitors' price
structures in foreign markets.
39 When we find out that export customers are unhappy with the quality of our
service, we take corrective action immediately.
40 We are quick to respond to important changes in our export business environ

Uma Shankar Singh.; Sch J Econ Bus Manag, Jan 2017; 4(1):47-61
Available Online: http://saspjournals.com/sjebm 54
changes in our export business environment (e.g., regulatory, technology,
economy).
41 All 'departments' in our firm are involved in implementing our export market
strategies.
42 Our export business strategies are driven by our beliefs about how we can
create greater value for export customers.
43 We give close attention to after sales service in our export markets.
44 Our export business objectives are driven primarily by customer satisfaction.
45 We rapidly respond to competitive actions that threaten us in our export
markets.
46 Our export strategy for competitive advantage is based on our understanding of
export customer needs.
47 Departments in our company work together as a team in relation to our export
business.
48 The activities of our business functions (e.g., marketing/sales, manufacturing,
R&D, finance/accounting, etc.) are integrated in pursuing a common goal.
49 In our firm there is 'interdepartmental' conflict.
50 In our company, departments/individuals compete with each other to achieve
their own goals rather than working together to achieve common objectives.
51 Key players from other functional areas (e.g., production, finance) hinder the
export related activities of this firm.
Coordinating
Mechanism
52 In our company, the objectives pursued by export personnel do not match those
pursued by members of the manufacturing or R&D department.
53 Key players from other functional areas (e.g., production, finance) are
supportive of those involved in the firm's export operations.
54 Export personnel build strong working relationships with other people in our
company.
55 Salespeople coordinate very closely with other company employees to handle
post-sales problems and services in our export markets.
56 In this firm, when conflicts between functional areas occur (e.g., between
export personnel and manufacturing), we reach mutually satisfying agreements.
57 Employees within the export unit and those in other functional areas (e.g.,
engineering) help each other out.
58 Those employees involved in our firm's export operations look out for each
other as well as for themselves.
59 Other than export personnel, it could be stated that few people in this
organization contribute to the success of the firm's export activities.
60 Certain key players in our firm attach little importance to our export activities.
61 The export activities of this company are disrupted by the behavior of managers
from other departments.
62 In this company, there is a sense of teamwork going right down to the shop
floor.
63 There is a strong collaborative working relationship between export personnel
and production.
64 Functional areas in this firm pull together in the same direction.
65 We resolve issues and conflicts through communication and group problem-
solving.
66 In our company, it is considered that the less interaction export personnel have
with other functional areas the better.
67 People from different functional areas in our firm discuss their problems openly
and constructively.
68 There are tensions among functional areas (e.g., export personnel and
manufacturing) that interfere with the company's export activities.
69 In this firm, our business functions (e.g., export, manufacturing) are integrated
in serving the needs of our export markets.
70 Our managers understand how everyone in our business can contribute to
Uma Shankar Singh.; Sch J Econ Bus Manag, Jan 2017; 4(1):47-61
Available Online: http://saspjournals.com/sjebm 55
creating value for export customers.
71 In this company, export staff share programs and resources with other business
functions.
72 We have big domestic market share (percent).
Business
performance
73 We are growing with profit share (percent per year).
74 Our premium on business is increasing (percent premiums).
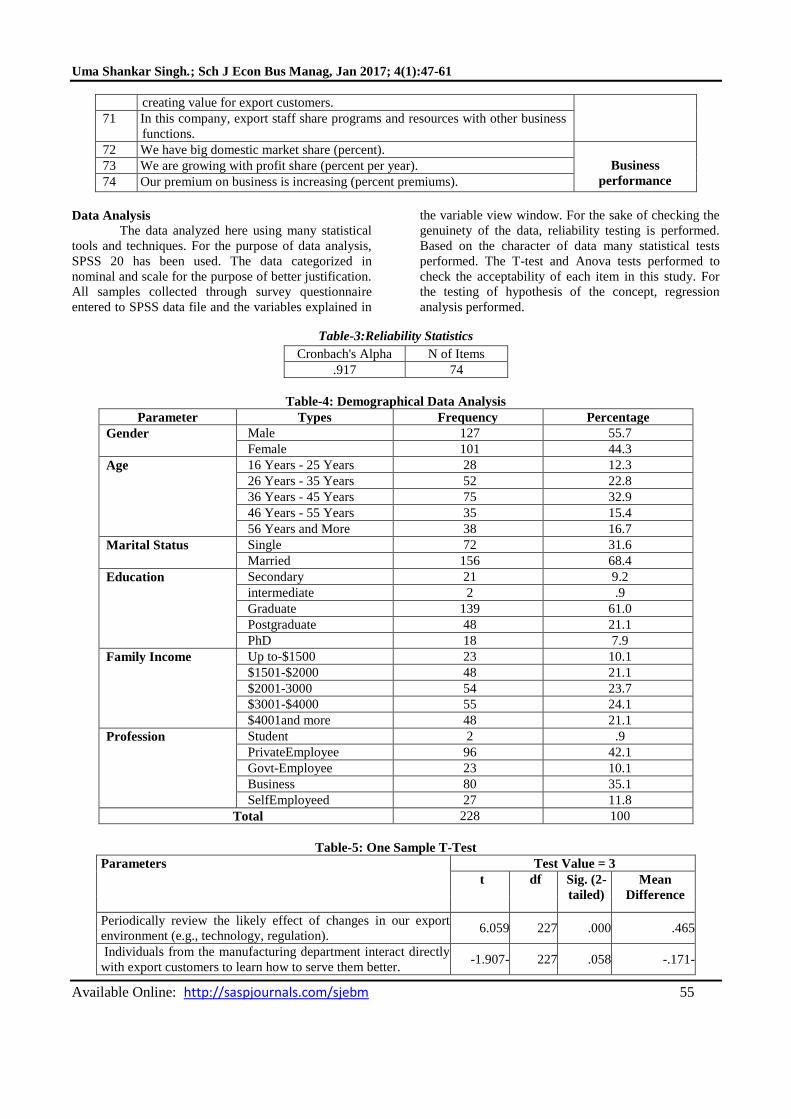
Data Analysis
The data analyzed here using many statistical
tools and techniques. For the purpose of data analysis,
SPSS 20 has been used. The data categorized in
nominal and scale for the purpose of better justification.
All samples collected through survey questionnaire
entered to SPSS data file and the variables explained in
the variable view window. For the sake of checking the
genuinety of the data, reliability testing is performed.
Based on the character of data many statistical tests
performed. The T-test and Anova tests performed to
check the acceptability of each item in this study. For
the testing of hypothesis of the concept, regression
analysis performed.
Table-3:Reliability Statistics
Cronbach's Alpha N of Items
.917 74
Table-4: Demographical Data Analysis
Parameter Types Frequency Percentage
Gender Male 127 55.7
Female 101 44.3
Age 16 Years - 25 Years 28 12.3
26 Years - 35 Years 52 22.8
36 Years - 45 Years 75 32.9
46 Years - 55 Years 35 15.4
56 Years and More 38 16.7
Marital Status Single 72 31.6
Married 156 68.4
Education Secondary 21 9.2
intermediate 2 .9
Graduate 139 61.0
Postgraduate 48 21.1
PhD 18 7.9
Family Income Up to-$1500 23 10.1
$1501-$2000 48 21.1
$2001-3000 54 23.7
$3001-$4000 55 24.1
$4001and more 48 21.1
Profession Student 2 .9
PrivateEmployee 96 42.1
Govt-Employee 23 10.1
Business 80 35.1
SelfEmployeed 27 11.8
Total 228 100
Table-5: One Sample T-Test
Parameters Test Value = 3
t df Sig. (2-
tailed)
Mean
Difference
Periodically review the likely effect of changes in our export
environment (e.g., technology, regulation). 6.059 227 .000 .465
Individuals from the manufacturing department interact directly
with export customers to learn how to serve them better. -1.907- 227 .058 -.171-

Uma Shankar Singh.; Sch J Econ Bus Manag, Jan 2017; 4(1):47-61
Available Online: http://saspjournals.com/sjebm 56
Are slow to detect changes in our overseas customers' product
preferences. -.181- 227 .857 -.013-
We poll end users once a year to assess the quality of our
products and services. 2.213 227 .028 .193
We are slow to detect fundamental shifts in our export
environment (e.g., technology, regulatory, economy). 2.806 227 .005 .197
In this company, we generate a lot of information concerning
trends (e.g., regulation, technological developments, politics, and
economy) in our export markets.
2.551 227 .011 .189
We generate a lot of information in order to understand the
forces which influence our overseas customers' needs and
preferences.
-.790- 227 .430 -.044-
We do not generate enough reliable/relevant information
concerning our competitors' activities in our export markets. -.795- 227 .427 -.057-
We constantly monitor our level of commitment and orientation
to serving export customer needs. 3.757 227 .000 .272
Our top managers from every function regularly visit our current
and prospective export customers. .730 227 .466 .053
We measure export customer satisfaction systematically and
regularly. .752 227 .453 .053
We have 'inter functional' meetings at least once a quarter to
discuss trends and developments (e.g., regulatory, technology) in
our export markets.
.295 227 .769 .022
Marketing personnel in our company spend time discussing
export customers' future needs with other functional areas. 2.239 227 .026 .184
Our company periodically circulates documents (e.g., reports,
newsletters) that provide information on export customers. 2.583 227 .010 .197
There is minimal communication between the export and
manufacturing departments concerning foreign market
developments (e.g., regulations, technology).
-3.664- 227 .000 -.272-
When one department finds out something important about
foreign market competitors, it is slow to alert other departments. -.591- 227 .555 -.039-
Important information about our export competitors is often 'lost
in the system' .864 227 .388 .061
In this company, export personnel rarely pass on information on
customer preferences to other functions/units 1.240 227 .216 .101
Information about our export competitors activities often reaches
relevant personnel too late to be of any use 3.225 227 .001 .237
Important information concerning export market trends
(regulatory, technology) is often discarded as it makes its way
along the communication chain.
4.362 227 .000 .316
Important information concerning our major export customers is
disseminated right down to the shop floor. 5.984 227 .000 .390
Personnel directly involved in export operations frequently
discuss export competitors' activities with non-export personnel. 2.421 227 .016 .180
Export sales personnel rarely share their experiences of dealing
with customers with others. .878 227 .381 .070
Too much information concerning our export competitors is
discarded before it reaches decision makers. 1.974 227 .050 .140
All information concerning our export competition is shared
within this company. -1.370- 227 .172 -.101-
Information which can influence the way we serve our export
customers takes forever to reach export personnel. 2.853 227 .005 .211
Export personnel regularly share information within our business
concerning export competitors' strategies. -.836- 227 .404 -.048-

Uma Shankar Singh.; Sch J Econ Bus Manag, Jan 2017; 4(1):47-61
Available Online: http://saspjournals.com/sjebm 57
We freely communicate information about our successful and
unsuccessful export customer experiences across all business
functions.
-.052- 227 .959 -.004-
Top management regularly discusses export competitors'
strengths and strategies. .000 227 1.000 .000
It takes us forever to decide how to respond to our export market
competitors' price changes. -1.974- 227 .050 -.145-
For one reason or another we tend to ignore changes in our
foreign customers' product or service needs. .534 227 .594 .035
We periodically review our product development efforts to
ensure that they are in line with what foreign customers want. .661 227 .509 .044
Our strategy for standardizing or adapting our export product
offerings is based on detailed customer research. -1.471- 227 .143 -.114-
Several departments' get together periodically to plan a response
to changes taking place in our foreign business environment
(e.g., regulation, technology, etc.).
3.016 227 .003 .237
The product lines we sell to foreign markets depend more on
internal politics than real market needs. .326 227 .745 .026
If a major competitor were to launch an intensive campaign
targeted at our foreign customers, we would implement a
response immediately.
.216 227 .829 .018
Foreign customer complaints fall on deaf ears in this company. 2.757 227 .006 .211
We are quick to respond to significant changes in our
competitors' price structures in foreign markets. 5.805 227 .000 .333
When we find out that export customers are unhappy with the
quality of our service, we take corrective action immediately. -1.689- 227 .093 -.140-
We are quick to respond to important changes in our export
business environ changes in our export business environment
(e.g., regulatory, technology, economy).
1.339 227 .182 .092
All 'departments' in our firm are involved in implementing our
export market strategies. 3.245 227 .001 .211
Our export business strategies are driven by our beliefs about
how we can create greater value for export customers. 1.856 227 .065 .123
We give close attention to after sales service in our export
markets. -.156- 227 .876 -.009-
Our export business objectives are driven primarily by customer
satisfaction. .436 227 .663 .031
We rapidly respond to competitive actions that threaten us in our
export markets. 2.145 227 .033 .158
Our export strategy for competitive advantage is based on our
understanding of export customer needs. 5.852 227 .000 .390
Departments in our company work together as a team in relation
to our export business. -1.912- 227 .057 -.154-
The activities of our business functions (e.g., marketing/sales,
manufacturing, R&D, finance/accounting, etc.)are integrated in
pursuing a common goal.
-2.403- 227 .017 -.189-
In our firm there is 'interdepartmental' conflict. -.878- 227 .381 -.070-
In our company, departments/individuals compete with each
other to achieve their own goals rather than working together to
achieve common objectives
-2.793- 227 .006 -.219-
Key players from other functional areas (e.g., production,
finance) hinder the export related activities of this firm. 4.162 227 .000 .298
In our company, the objectives pursued by export personnel do
not match those pursued by members of the manufacturing or
R&D department.
1.859 227 .064 .136

Uma Shankar Singh.; Sch J Econ Bus Manag, Jan 2017; 4(1):47-61
Available Online: http://saspjournals.com/sjebm 58
Key players from other functional areas (e.g., production,
finance) are supportive of those involved in the firm's export
operations.
-.071- 227 .944 -.004-
Export personnel build strong working relationships with other
people in our company. 1.406 227 .161 .096
Salespeople coordinate very closely with other company
employees to handle post-sales problems and services in our
export markets.
2.459 227 .015 .154
In this firm, when conflicts between functional areas occur (e.g.,
between export personnel and manufacturing), we reach
mutually satisfying agreements.
3.269 227 .001 .250
Employees within the export unit and those in other functional
areas (e.g., engineering) help each other out. .201 227 .841 .018
Those employees involved in our firm's export operations look
out for each other as well as for themselves. 3.216 227 .001 .250
Other than export personnel, it could be stated that few people in
this organization contribute to the success of the firm's export
activities.
-.973- 227 .331 -.079-
Certain key players in our firm attach little importance to our
export activities. 1.690 227 .092 .127
The export activities of this company are disrupted by the
behavior of managers from other departments. 2.446 227 .015 .180
In this company, there is a sense of teamwork going right down
to the shop floor. 4.457 227 .000 .298
There is a strong collaborative working relationship between
export personnel and production. 4.419 227 .000 .298
Functional areas in this firm pull together in the same direction. -2.005- 227 .046 -.162-
We resolve issues and conflicts through communication and
group problem-solving. -.330- 227 .742 -.022-
In our company, it is considered that the less interaction export
personnel have with other functional areas the better. -3.888- 227 .000 -.272-
People from different functional areas in our firm discuss their
problems openly and constructively. 2.596 227 .010 .202
There are tensions among functional areas (e.g., export personnel
and manufacturing) that interfere with the company's export
activities.
4.461 227 .000 .325
In this firm, our business functions (e.g., export, manufacturing)
are integrated in serving the needs of our export markets. 2.486 227 .014 .197
Our managers understand how everyone in our business can
contribute to creating value for export customers. -2.107- 227 .036 -.145-
In this company, export staff share programs and resources with
other business functions. -1.864- 227 .064 -.123-
We have big domestic market share (percent). 12.000 227 .000 .675
We are growing with profit share (percent per year). 1.106 227 .270 .092
Our premium on business is increasing (percent premiums). 4.156 227 .000 .355
Hypothesis Testing
Hypothesis1: Independent Variable Intelligence Generation & Dependent Variable
Performance
Model R R Square Adjusted R Square Std. Error of the
Estimate
1 .370a .137 .133 .88465
a. Predictors: (Constant), Intelligence_Generation
Model Unstandardized Coefficients Standardized
Coefficients
t Sig.

Uma Shankar Singh.; Sch J Econ Bus Manag, Jan 2017; 4(1):47-61
Available Online: http://saspjournals.com/sjebm 59
B Std. Error Beta
1 (Constant) 1.576 .306 5.152 .000
Intelligence_Generation .579 .097 .370 5.990 .000
a. Dependent Variable: Performance
The first hypothesis got tested using regression
analysis where the value of R is 0.370 and the value of
R squared is 0.133 having the significant result. It
shows that the hypothesis is getting rejected and the
concept is getting accepted as drawn in the model.
Hypothesis2: Independent Variable Intelligence Dissemination & Dependent Variable
Performance
Model R R Square Adjusted R Square Std. Error of the
Estimate
1 .513a .263 .259 .81767
a. Predictors: (Constant), Intelligence_Dissemination
Model Unstandardized Coefficients Standardized
Coefficients
t Sig.
B Std. Error Beta
1 (Constant) .568 .317 1.792 .075
Intelligence_Dissemination .908 .101 .513 8.975 .000
a. Dependent Variable: Performance
The second hypothesis got tested using
regression analysis where the value of R is 0.513 and
the value of R squared is 0.259 having the significant
result. It shows that the hypothesis is getting rejected
and the concept is getting accepted as drawn in the
model.
Hypothesis3: Independent Variable Responsiveness & Dependent Variable
Performance
Model R R Square Adjusted R Square Std. Error of the
Estimate
1 .468a .219 .215 .84182
a. Predictors: (Constant), Responsiveness
Model Unstandardized Coefficients Standardized
Coefficients
t Sig.
B Std. Error Beta
1 (Constant) 1.202 .279 4.313 .000
Responsiveness .715 .090 .468 7.951 .000
a. Dependent Variable: Performance
The third hypothesis got tested using regression
analysis where the value of R is 0.465 and the value of
R squared is 0.215 having the significant result. It
shows that the hypothesis is getting rejected and the
concept is getting accepted as drawn in the model.
Hypothesis4: Independent Variable Coordinating mechanism & Dependent Variable
Performance
Model R R Square Adjusted R Square Std. Error of the
Estimate
1 .589a .347 .344 .76940
a. Predictors: (Constant), Coordinating_Mechanism

Uma Shankar Singh.; Sch J Econ Bus Manag, Jan 2017; 4(1):47-61
Available Online: http://saspjournals.com/sjebm 60
Model Unstandardized Coefficients Standardized
Coefficients
t Sig.
B Std. Error Beta
1 (Constant) -.637- .369 -1.725- .086
Coordinating_Mechanism 1.266 .115 .589 10.964 .000
a. Dependent Variable: Performance
The fourth hypothesis got tested using
regression analysis where the value of R is 0.589 and
the value of R squared is 0.344 having the significant
result. It shows that the hypothesis is getting rejected
and the concept is getting accepted as drawn in the
model.
Findings
The research is targeting to find the solution
for the research problem, where the study needs to
answer as findings of the study: The first question is
what is export market orientation? The answer well
explained using the concept and the conceptual model,
where all dimensions are represented clearly. Second
question is about Kurdistan region readiness for export
market orientation? Answer of this question is
explained using T-test in the analysis part of the thesis.
Third question, what are different variables of export
market orientation? The four variables of export market
orientation get justified using regression analysis based
on the data collected through the structured
questionnaire in Kurdistan. Fourth question is what is
the importance of export market orientation variables?
It is analyzed and interpreted in data analysis that the
export market orientation variables are very important
as per this study for business development. Fifth
question is how export market orientation variables
affect the business performance? This is well explained
and presented in the regression analysis. The sixth is
the, what is the performance of export market
orientation variables in Kurdistan? The answer is
explained and interpreted as the Anova analysis, where
it is justified that the performance of export market
orientation variables are having good performance then
too needs to get improved. Seventh question how export
market orientation variables can affect the business
performance? The narration of this question is done
using the regression analysis where the cause effect
relationship is performed to measure the importance
and presented as R and R square. The last question is
eighth as what is relationship in between export market
orientation variables and business performance in
Kurdistan? The answer of this question is available in
the analysis chapter with the regression analysis where
the cause effect relationship is the representative of
relationship.
Managerial Implication and Conclusion
Export market orientation is the concept of
widely getting used all around the world. Dimensions
discussed in this study are major dimensions and needs
to get cared in all aspect. The study conducted here is
justifying all objectives with finding the solution of
research problem all research question. The research is
re justifying the concept with supported data. Kurdistan
region is natural rich region and can get the huge export
potential. The outcome of this study is the contribution
to the academic learning. The practical usage can get
implemented by companies involved in export. Many
multinational companies can also get enrich with
information about the existing resources and support in
Kurdistan. They can prepare for needful for export
market orientation. Economically, for the purpose of
social and economic development as well this research
can be guide map.
The study is getting concluded here with its outcome
and results based on data analysis and interpretation.
The vast study on the export market orientation in
Kurdistan region conducted taking four independent
dimension and one dependent dimension namely
Intelligence Generation, Intelligence Dissemination,
Responsiveness, Coordination Mechanism and Business
Performance respectively. It is very clear in the study as
per the responses of respondents all four independent
variables are important for business performance. When
we see the values of R is much better showing the
positive relationship and the R square as well
supportive in the limit. Kurdistan region needs to take
the initiative for the development of export by export
market orientation concept.
REFERENCES
1. Hultman M, Robson MJ, Katsikeas CS. Export
product strategy fit and performance: An
empirical investigation. Journal of
International Marketing. 2009 Dec 1;17(4):1-
23.
2. Grewal R, Tansuhaj P. Building organizational
capabilities for managing economic crisis: The
role of market orientation and strategic
flexibility. Journal of marketing. 2001 Apr
1;65(2):67-80.
3. Hult GT, Ketchen DJ, Slater SF. Market
orientation and performance: an integration of
disparate approaches. Strategic Management
Journal. 2005 Dec 1;26(12):1173-81.
4. Ethiraj SK, Kale P, Krishnan MS, Singh JV.
Where do capabilities come from and how do
they matter? A study in the software services

Uma Shankar Singh.; Sch J Econ Bus Manag, Jan 2017; 4(1):47-61
Available Online: http://saspjournals.com/sjebm 61
industry. Strategic management journal. 2005
Jan 1;26(1):25-45.
5. Zou S, Fang E, Zhao S. The effect of export
marketing capabilities on export performance:
an investigation of Chinese exporters. Journal
of International marketing. 2003 Dec
1;11(4):32-55.
6. Zhou KZ, Yim CK, Tse DK. The effects of
strategic orientations on technology-and
market-based breakthrough innovations.
Journal of marketing. 2005 Apr 1;69(2):42-60.
7. Zhou KZ, Li JJ, Zhou N, Su C. Market
orientation, job satisfaction, product quality,
and firm performance: evidence from China.
Strategic Management Journal. 2008 Sep
1;29(9):985-1000.
8. Slater SF, Narver JC. Does competitive
environment moderate the market orientation-
performance relationship?. The Journal of
Marketing. 1994 Jan 1:46-55.
9. Ketchen DJ, Hult GT, Slater SF. Toward
greater understanding of market orientation
and the resource‐ based view. Strategic
Management Journal. 2007 Sep 1;28(9):961-4.
10. Narver JC, Slater SF, MacLachlan DL.
Responsive and proactive market orientation
and new‐ product success. Journal of product
innovation management. 2004 Sep
1;21(5):334-47.
11. Prescott JE. Environments as moderators of
the relationship between strategy and
performance. Academy of Management
journal. 1986 Jun 1;29(2):329-46.
12. Matsuno K, Mentzer JT. The effects of
strategy type on the market orientation-
performance relationship. Journal of
marketing. 2000 Oct 1;64(4):1-6.
13. Thompson JD. Organizations in action: Social
science bases of administrative theory.
Transaction publishers; 1967.
14. Van Bruggen GH, Lilien GL, Kacker M.
Informants in organizational marketing
research: Why use multiple informants and
how to aggregate responses. Journal of
Marketing Research. 2002 Nov 1;39(4):469-
78.
15. Cadogan JW, Kuivalainen O, Sundqvist S.
Export market-oriented behavior and export
performance: quadratic and moderating effects
under differing degrees of market dynamism
and internationalization. Journal of
International Marketing. 2009 Dec 1;17(4):71-
89.
16. Gebhardt GF, Carpenter GS, Sherry Jr JF.
Creating a market orientation: A longitudinal,
multifirm, grounded analysis of cultural
transformation. Journal of marketing. 2006 Oct
1;70(4):37-55.
17. Gao GY, Murray JY, Kotabe M, Lu J. A
―strategy tripod‖ perspective on export
behaviors: Evidence from domestic and
foreign firms based in an emerging economy.
Journal of International Business Studies. 2010
Apr 1;41(3):377-96.
18. Batson A. China’s export focus breeds
backlash. The Wall Street Journal. 2010:6-7.
19. Krasnikov A, Jayachandran S. The relative
impact of marketing, research-and-
development, and operations capabilities on
firm performance. Journal of marketing. 2008
Jul 1;72(4):1-1.
20. Kotler P, Keller KL. Market management.
Translated by Abdolreza Rezaeenejhad,(1st
ed.) Tehran: Nashr-e-Fara Publications. 2000.
21. Atuahene-Gima K, Murray JY. Antecedents
and outcomes of marketing strategy
comprehensiveness. Journal of Marketing.
2004 Oct 1;68(4):33-46.
22. Jaworski BJ, Kohli AK. Market orientation:
antecedents and consequences. The Journal of
marketing. 1993 Jul 1:53-70.
23. Newbert SL. Empirical research on the
resource‐ based view of the firm: an
assessment and suggestions for future research.
Strategic management journal. 2007 Feb
1;28(2):121-46.
24. DeSarbo WS, Di Benedetto CA, Song M. A
heterogeneous resource based view for
exploring relationships between firm
performance and capabilities. Journal of
modelling in management. 2007 Jul
10;2(2):103-30.
25. Porter ME, Advantage C. Creating and
sustaining superior performance. Competitive
advantage. 1985:167.
26. Akyol A, Akehurst G. An investigation of
export performance variations related to
corporate export market orientation. European
Business Review. 2003 Feb 1;15(1):5-19.
27. Zeithaml VA, ―Rajan‖ Varadarajan P,
Zeithaml CP. The contingency approach: its
foundations and relevance to theory building
and research in marketing. European Journal of
Marketing. 1988 Jul 1;22(7):37-64.
28. Atuahene-Gima K. Resolving the capability—
rigidity paradox in new product innovation.
Journal of marketing. 2005 Oct 1;69(4):61-83.