a regression testing prioritization component for testlink
TRANSCRIPT

FEDERAL UNIVERSITY OF RIO GRANDE DO SUL
INFORMATICS INSTITUTEBACHELOR OF COMPUTER SCIENCE
LUCAS MENEZES FREIRE
A Regression Testing Prioritization Component for TestLink
Graduation Thesis.
Prof. Dr. Erika CotaAdvisor
M. Sc. Thomas BauerCoadvisor
Porto Alegre2015

UNIVERSIDADE FEDERAL DO RIO GRANDE DO SULReitor: Prof. Carlos Alexandre NettoVice-Reitor: Prof. Rui Vicente OppermannPró-Reitor de Graduação: Prof. Sérgio Roberto Kieling FrancoDiretor do Instituto de Informática: Prof. Luís da Cunha LambCoordenador do Curso de Ciência da Computação: Prof. Raul Fernando WeberBibliotecária-Chefe do Instituto de Informática: Beatriz Regina Bastos Haro

ACKNOWLEDGMENTS
The last couple of years of my graduation was marked by two work experiences that were essential to the development of this work, and for that I have to thank both my advisors Érika Cota and Thomas Bauer. The project with Elo Sistemas Eletrônicos lead by Érika was my first contact with software testing. It was followed by the enriching experience of working in Fraunhofer where I was lucky enough to meet Thomas, who not only guided me in my work but also contributed to the great experience of my year living in Germany.
A mandatory thanks to my friends Anderson Santos, Alexandre Kreismann, Guilherme Dias, Luan Garcia, Lucas Tomasi and occasionally Guilherme Schievelbein and Vinícius Graciolli. The conversations we had between classes are definitely an integral part of my education. Thanks also to all the traveling companions that I met in Kaiserslautern.
An equally (or perhaps more than equally) mandatory thanks to my family. Namely Christiane, Ronald, Caroline, Tiago, Breno and remaining family tree. Good families usually support its members and you are not an exception.

ABSTRACT
Analytical software quality assurance is an expensive set of activities – both in time and cost – on a software project development. The literature attributes more than 50% of the costs of a project just for the testing process. Testing results are often managed by test management tools. This type of software is used to define, plan and track the testing activities, providing reports on the current status of the system under test quality.
Software testing automation is a widespread attempt to reduce the testing costs. In this work, we will develop a module that automates the execution and planning of regression testing, a recurring form of testing that checks if new modifications to a software do not introduce new defects with them. This module shall be implemented as a component of an existing test management framework.
We will analyze test management tools, consider their current features and licenses, select the most appropriate one, and modify it in order to support the automated definition and execution of regression tests in a time constrained environment. The execution results data of the test plans will be used to prioritize the test cases in subsequent regression testing executions. The data generated by the solution should then be available to focus subsequent quality assurance activities based on defect and coverage data.
Keywords: Software Quality Assurance, Test Management, Regression Testing Automation.
Desenvolvimento de um componente para a determinação dinâmica e otimização de
estratégias de teste e sua integração em uma ferramenta de gerenciamento de testes
existente
RESUMO
Garantia de qualidade de software analítica é um caro conjunto de atividades – tanto em tempo quanto em custo – do desenvolvimento de um projeto de software. A literatura atribui mais de 50% dos custos de um projeto apenas para o processo de testes. Os resultados dos testes são frequentemente gerenciados por ferramentas de gerência de testes. Este tipo de software é usado para definir, planejar e rastrear as atividades de teste, fornecendo relatórios do estado atual da qualidade do sistema em teste.
A automação de testes de software é uma difundida tentativa de reduzir os custos de teste. Nesta tese, nós iremos desenvolver um módulo que automatiza a execução e planejamento de testes de regressão, uma recorrente forma de testes que verifica se novas modificações em um software não introduzem novos defeitos com elas. Este módulo deve ser implementado como um componente em um framework existente de gerência de testes.
Nós analisaremos ferramentas de gerência de testes, consideraremos as funcionalidades e licenças presentes, selecionaremos a mais apropriada, e a modificaremos para que ela suporte a definição e execução automatizada de testes de regressão em um ambiente com tempo limitado. Os dados dos resultados dos planos de teste serão usados para priorizar os casos de teste em execuções subsequentes dos testes de regressão. Os dados gerados pela solução devem, então, estar disponíveis para focar as subsequentes atividades de garantia de qualidade baseadas em dados de defeito e cobertura.
Palavras-chave: Garantia de Qualidade de Software, Gerenciamento de Testes, Automação
de testes de Regressão.
LIST OF FIGURES
Figure 3.1 – Requirements in TestLink....................................................................................16Figure 3.2 – Test cases in TestLink..........................................................................................17Figure 3.3 – Test cases in a TestLink's test plan before an execution......................................17Figure 3.4 – Test cases in a TestLink's test plan after an execution.........................................18Figure 3.5 – Multiplication bug reporting in Mantis................................................................18Figure 3.6 – Partial view of a TestLink's test case execution result with an associated bug....19Figure 3.7 – Test results based on requirements report............................................................19Figure 4.1 – Build and test cases parameters diagram example...............................................21Figure 4.2 – Implemented parameter management view..........................................................21Figure 4.3 – Implemented parameter assignment view............................................................21Figure 4.4 – Test case source code file selection......................................................................22Figure 4.5 – add.c source file....................................................................................................22Figure 4.6 – Executions history part of the dashboard.............................................................23Figure 4.7 – Execution group report table................................................................................24Figure 4.8 – Scheduled executions table...................................................................................24Figure 4.9 – Manual tests reporting..........................................................................................25Figure 4.10 – Automated tests reporting...................................................................................25Figure 4.11 – Running executions table...................................................................................25Figure 4.12 – Requirements coverage chart.............................................................................26Figure 4.13 – External module´s sequence diagram.................................................................27Figure 4.14 –TCP algorithm pseudocode.................................................................................29Figure 4.15 – Requirements traceability report........................................................................30Figure 4.16 – Linked bugs report..............................................................................................30Figure 4.17 – Requirements by test executions chart...............................................................31Figure 4.18 – Requirements by test executions table...............................................................31Figure 4.19 – Test cases executions report...............................................................................32Figure 5.1 – Partial TCP algorithm pseudocode ......................................................................33Figure 5.2 – Probabilities of test cases categories....................................................................34Figure 5.3 – Generated test case code.......................................................................................35

LIST OF TABLES
Table 2.1 – Test management tools comparison.......................................................................15Table 5.1 – Executions results..................................................................................................36
LIST OF ACRONYMS
SQA Software Quality Assurance
TCP Test Case Prioritization
RTS Regression Testing Selection
V&V Verification and Validation
TABLE OF CONTENTS
1 INTRODUCTION..................................................................................................................91.1 Motivation............................................................................................................................91.2 Analytical Software Quality Assurance............................................................................91.3 Software Testing................................................................................................................101.3.1 Test Project Management................................................................................................101.3.1.1 Test Project Management Tools...................................................................................111.3.2 Regression Testing...........................................................................................................111.3.2.1 Regression Testing Selection........................................................................................111.3.2.2 Regression Testing Prioritization..................................................................................121.4 Work Structure.................................................................................................................122 BACKGROUND..................................................................................................................132.1 Existing Regression Testing Prioritization Approaches................................................132.2 Test Management Tools Comparison Criteria...............................................................142.3 Analyzing the Candidate Tools........................................................................................143 TEST MANAGEMENT TOOL PRESENTATION.........................................................163.1 TestLink Technologies......................................................................................................163.2 TestLink Functionalities...................................................................................................164 TESTLINK MODIFICATIONS.........................................................................................204.1 Used Technologies.............................................................................................................204.2 Parameterized Tests..........................................................................................................204.3 Test Case Source Code.....................................................................................................224.4 Dashboard..........................................................................................................................234.4.1 Executions History...........................................................................................................234.4.2 Scheduling and Running Executions...............................................................................244.4.3 Requirements Coverage...................................................................................................254.5 External Module................................................................................................................264.5.1 Implemented Prioritization Algorithm.............................................................................284.6 Additional Reports............................................................................................................294 REGRESSION TESTING PRIORITIZATION IMPLEMENTATION........................335.1 Evaluating the Algorithm.................................................................................................335.2 Generating a Project for the Evaluation Of the Algorithm..........................................335.3 Running the Tests.............................................................................................................355.4 Results................................................................................................................................356 CONCLUSION....................................................................................................................38REFERENCES........................................................................................................................39

9
1 INTRODUCTION
This introductory chapter presents the concepts necessary to understand the rest of this work. It explains the motivation behind the work and how we decided to design our solution.
1.1 Motivation
Software testing is an expensive process. It consists of a set of activities with the goal of detecting problems in a program. One of these activities is concerned with the execution of tests. In this activity we can find regression testing, a type of test that is particularly expensive due to its repetitive nature. Some strategies – like regressions testing prioritization - attempt to reduce the regression testing costs.
The test activities have to be managed. Test management tools exist to facilitate this task. Even though these tools often have support for test execution automation, they do not include automated test strategies to reduce the regression testing costs.
In this work, we aimed to reduce the testing costs by proposing a regression testing prioritization component for a test management framework. We selected an existing test management tool and modified it to include our component. A regression testing prioritization algorithm was implemented and an experiment was done to verify that the component is operating as expected.
1.2 Analytical Software Quality Assurance
Software quality assurance (SQA) is defined as:
A set of activities that define and assess the adequacy of software processes to provide evidence that establishes confidence that the software processes are appropriate for and produce software products of suitable quality for their intended purposes. […] ([28], p. 8).
As such, different activities of SQA can be present from the beginning until the very end of the software development cycle. In fact, according to Wagner [33], the methods and techniques of SQA can be divided into two categories: constructive and analytical quality assurance. The constructive approach tries to improve the development of the software to prevent defects. The analytical approach goal is to detect the problems. The techniques described further in this work are related to the analytical software quality assurance approach.
In the study made by Tassey [31], the costs of an inadequate environment for analytical quality assurance yielded a figure as high as 80% of the total cost of the project just for the detection and removal of defects. In Myers [32], the author uses the rule of thumb that 50% of the total development time is spent on testing a project and the costs of this process
surpass 50%. In a scenario like this, the investments and research for a better analytical SQA strategy can be beneficial to significantly reduce the costs of a project.
Wagner [33] affirms that analytical quality assurance is also called Verification and Validation (V&V). In Software Engineering [42], Sommerville asserts that the purpose of V&V is to demonstrate that a system conforms to its specification and it meets the system customer´s expectations. The author follows that statement with the affirmation that program testing is the principal validation technique.
1.3 Software Testing
The definition of software testing is “An activity in which a system or component is executed under specified conditions, the results are observed or recorded, and an evaluation is made of some aspect of the system or component” ([28], p. 8). According to Kaner et al. [29], the purpose of software testing is to find problems in a program. Hence, software testing can be classified as an analytical SQA process. As stated in section 1.1, analytical SQA can be very costly. This justifies our interest in optimizing the testing process.
According to Graham et al. [43], the activities within the fundamental test process can be divided in:
1. Planning and control;
2. Analysis and design;
3. Implementation and execution;
4. Evaluating exit criteria and reporting;
5. Test closure activities.
These activities are sequential, meaning that planning precedes the others. Graham et al. [43] complement planning with control, affirming that the management of an activity is not complete without controlling and measuring the progress against the plan. Section 1.2.1 describes test project management in further detail.
During the implementation and execution activity, where the designed tests are built into executable test cases, a major task is repeating the tests. One of the cases where tests need to be repeated is regression testing. Section 1.2.2 explains regression testing and how it can be optimized.
A common strategy to reduce the costs of software testing is test automation. In Managing the Testing Process [30], the author describes automation as a way of reducing the time to run tests, saying that the extra time bought with automation can then be allocated to analyze the failures detected by the tests.
1.3.1 Test Project Management
Rex [30] says that test projects require test project management because testing should always respond to real project needs. The IEEE Standard for Software and System Test Documentation [35] includes the following activities in the process of test management:

11
1. Monitoring of the plan execution;
2. Analysis of anomalies discovered during execution of the plan;
3. Reporting on progress of the test processes;
4. Assessing the test results for conformance to expectations;
5. Determining whether a testing task is complete;
6. Checking of the test results for completeness.
1.3.1.1 Test Project Management Tools
To help the management of the test projects, test management tools like XStudio [19] or RTH [14] were developed. Graham et al. [43] list as features of test management tools:
1. Management of tests;
2. Scheduling of tests to be executed;
3. Management of testing activities;
4. Interfaces to other tools;
5. Traceability of tests, test results and defects to requirements or other sources;
6. Logging test results; preparing progress reports based on metrics.
Test Management tools can include other functionalities to support different processes besides the ones listed. XStudio, for example, has requirements management support. In Manage Software Testing [41], besides test case management, the author also includes requirements management and bug management among other features in a desirable features list of the test environment.
1.3.2 Regression Testing
Software in development is constantly changing. New features are included, old features are modified and old issues are fixed. One of the software aspects that Brooks enlist in No Silver Bullet is its Changeability: It is easy to change software, but the consequences of a change is often overlooked [1].
Regression testing deals with those consequences by checking that changes to the program have not introduced new bugs [43]. This is accomplished by re-running test cases of an existing test suite [2].
1.3.2.1 Regression Testing Selection
Without the constraint of time, we could run all the test cases of the initial test suite for the regression testing. This would yield the higher confidence that new changes do not break old software. This approach is called retest all. But often time is a constraint. In this case retesting all can be prohibitively expensive [2]. Therefore, instead of running all the test

cases of the test suite, only a subset of those test cases are selected. This process is called Regression Testing Selection (RTS).
There are different techniques for Regression Testing Selection with varying degrees of cost and effectiveness. For a study listing and comparing those techniques, see Graves and others [2].
1.3.2.2 Regression Testing Prioritization
Regression testing prioritization is another technique for optimizing the regression testing execution. In this case, it uses a Test Case Prioritization (TCP) algorithm to order the test cases by a priority defined by one or more criteria. Rothermel et al. [34] formally defines regression testing prioritization as follow:
Given: T, a test suite, PT, the set of permutations of T, and f, a function from PT to the real numbers.
Problem: Find T' ∈ PT such that (∀T'') (T'' ∈ PT) (T'' ≠ T') [f(T') ≥ f(T'')] ([34], p. 930).
In the definition above, PT contains all the possible ways of ordering the test cases in the T test suite, and the function f evaluates each ordering, yielding an award value. This function can consider a variety of information to evaluate the orderings depending on the specific technique used for TCP. Chapter 2 contains an explanation of different approaches, chapter 4 explains the one used by this work.
According to Jung-Min and Porter [7], regression testing prioritization can be combined with a RTS algorithm by selecting a subset of test cases of the initial test suite and then applying the prioritization on the remaining test cases.
1.4 Work Structure
A comparison of test management tools is presented in chapter 2. We will enlist the comparison criteria and select the tool that best fit them. Chapter 2 also contains a description of related work regarding the automated decision and execution of regression testing. Chapter 3 contains a presentation of the chosen software features, explaining how it manages a test project.
To implement the automated testing module, the chosen tool must be modified to include new concepts such as parameterized tests and source file selection. The detailed explanations of those modifications is included in chapter 4, along with new reporting information that can be obtained with the introduced concepts. This chapter also explains the constructed algorithm implemented in our module.
Chapter 5 presents the generation of a test project that will enable us to execute and evaluate our solution with an experiment. The last section describes the results achieved by the execution of our automated regression testing strategy applied to the created project in the test management tool.
13
2 BACKGROUND
This chapter exposes related work regarding regression testing prioritization approaches. It also compares different test management tools and select the most appropriate one to be used in the development of our solution.
2.1 Existing Regression Testing Prioritization Approaches
A wide variety of TCP approaches have been proposed. According to Korel and Koutsogiannakis [3], most of the test prioritization methods are code-based. Those techniques use information of the source code to evaluate the test cases with code coverage metrics (e.g. the number of covered statements, the number of functions called by the test case). This evaluation is then used to prioritize the tests.
Model-based test prioritization can also be found in the literature [4-6]. This type of technique uses system models to prioritize the test cases. One of the model-based solutions described in Korel et al. 2007 [5] for example, uses two versions of models of the same system. The idea is that after a modification of the model, the new modified model is executed for a test suite to collect information to be used for the prioritization. This information can be, for example, the execution of modified transitions in a model by a test case. Test cases can then be prioritized based on the assumption that the probability of a test revealing a fault is proportional to the number of modified transitions executed by it.
History-based prioritization is a third type of solution. As stated by Jung and Porter [7], the idea is to use information of the test cases past executions to define the prioritization order. Prioritizing, for example, tests that have failed in past executions over the tests that have not. This approach is particularly interesting for this work due to the availability of the test cases past executions data in a test management tool. For this reason, the implemented algorithm described in section 4.5.1 is history-based. As a consequence, the chosen technique does not need models or source code to extract information, just the data provided by TestLink. Some approaches that use the results of past executions can be found in Jung and Porter [7], Marijan et al. [8] and Chu-Ti et al. [9]. These three references use the faults of the test cases (i.e. the failed or passed status) for the prioritization. Marijan et al. [8] also includes the execution time of the test cases and a domain-specific heuristic to define the prioritization order. Chu-Ti et al. [9] study whether the test cases that failed in previous versions of the software have a higher probability of failing in a new version They used a hybrid of history-based with a code-based technique.
Some solutions implement heuristic search techniques to determine the order. Ahmed et al. [10] uses a genetic algorithm with code-based metrics. Particle swarm optimization is used alongside with fault coverage and execution time by the prioritization phase of Tyagi and Malhotra [11]. The implementation in this work uses a simple history-based approach and is described in section 4.5.1. Proposing a better algorithm and comparing it to other solutions is out of the scope of this work.

2.2 Test management Tools Comparison Criteria
To select an appropriate tool for this work, some features were considered in the comparison. Besides the actual management of test cases, some test management tools incorporate requirements and defects management. With a broader scope of QA information available in the tool, more data can be used to generate reports and plan subsequent activities. Supporting test automation is also a critical characteristic of the tool because we want to make sure that we will be able to implement an automated regression test module.
Finally, in order to support modifications, open source software is a better solution than closed source. Knowing that a software is open source, we can customize it without the limitations provided by the developer.
2.3 Analyzing the Candidate Tools
The search for candidate tools was made using Google with “test management tools” as the parameter. This search provided as result a web page [44] with a list of 29 open source candidates. To filter this list, the discontinued tools were eliminated alongside the ones that deviate from the test management tools functionalities described in section 1.2.1.1. Table 2.1 contains the resulting candidates for a hands-on comparison.
By analyzing table 2.1, the tools with more support for the criteria stated in section 2.2 are: TestLink, Squash TM and XStudio. The developer of XStudio has assembled a web page [20] containing a comparison of test tools that include many of the software presented in table 2.1. In this comparison, it is presented a similar table to table 2.1, but containing additional criteria that are not as relevant to this work, like support for specifications management or load testing. Despite the apparent advantages of XStudio in this reference, this tool is not open source and requires a commercial license to support any kind of customization [21]. Squash TM uses an external software for the test automation called Squash TA [17], this can add another layer of complexity for our component.
TestLink is an open source tool which covers all the criteria and provides an API for test automation. In addition to that, there is an active forum [22] that can be consulted to support the development of our implementation.
Given the information analyzed by this section, TestLink is the tool of choice for the solution presented in the subsequent chapters.

15
Table 2.1 – Test management tools comparison
Tool Requirements management
Support
Issue Tracking Support
Automated Tests Support
License
TestLink [12] X can be integrated with other tools
X GPLv2 [36]
TesTopia [13] Bugzilla MPL 1.1 [37]
RTH [14] X X GPLv2 [36]
Tarantula [15] X can be integrated with other tools
GPLv3 [38]
Squash TM [16]
X interfaces natively with Mantis
Squash TA [17] LGPL [39]
Requirements and Tests Management Repository [18]
X X
or
external bug tracker
GPLv3 [37]
XStudio [19] X X X Proprietary [40]

3 TEST MANAGEMENT TOOL PRESENTATION
This chapter explains the basic functionalities of TestLink and presets an overview of its use technologies.
3.1 TestLink Technologies
TestLink was written in PHP and uses an object-relational database. Its front-end is developed using HTML, CSS, Javascript and Smarty [45]. Smarty is a template engine for PHP used to separate the presentation and the application logic. To communicate with other software, TestLink provides an XML-RPC API. With this API, we can send commands to create and get projects, builds, test plans and test cases; report test cases results, among others.
Even though the tool does not have independent bug tracking functionalities, it offers a way to configure an integration with existing issue tracking tools. In this work, Mantis [46] was chosen to account for this functionality. Mantis is an open source issue tracking system that allow us to manage bugs. These bugs can be linked to test cases using the TestLink´s issue tracking integration. Additionally, external software can communicate with mantis using the Mantis SOAP API.
3.2 TestLink Functionalities
As presented in section 2.3, TestLink has support for requirements management, bug tracker integration and test automation. This section describes how a project can be handled by this tool during these different activities. The version of the software used for this demonstration is TestLink 1.9.11.
For the sake of simplicity, a calculator project with basic operations is used to present the tool. Figure 3.1 presents a list of the requirements of the project as described in TestLink.
Figure 3.1 – Requirements in TestLink
As can be seen in figure 3.1, the requirements are grouped by folders called requirements specifications (the root folder is an exception, representing the test project instead). Requirements specifications is a way of organizing the requirements of the project. A requirement specification has the following fields: Document id, title, scope (i.e. a textual description) and a type.
The Calculator folder is our project folder. The Operations folder is the requirement specification of the following requirements: Addition, Subtraction, Division and Multiplication. A requirement on TestLink has a title, a document id, a scope, a status (which can assume values like draft, implemented or obsolete), a type (e.g. use case, user interface, non functional) and the number of test cases needed to cover the requirement. Those

17
requirements can be linked to test cases and, upon the executions of those test cases, metrics of requirements coverage can be extracted from TestLink.
Figure 3.2 – Test cases in TestLink
Figure 3.2 is a similar representation for the test cases. Here, the folders under the project folder are test suites. In this example there is one test suite called Operations Tests. A test suite has a name, details (its textual description), and keywords. Keywords are created by the user and associated with test suites or test cases. They can be used to group elements with a common characteristic.
Under a test suite, test cases can be created. The fields of the test cases are: Title, summary, preconditions, status (same as requirements specification), importance (high, medium or low), execution type (automated or manual), an estimation of the execution time in minutes, and keywords. Once the test case is created, it is possible to add steps to it. Each step has a step actions field, an expected results field (both are textual fields) and an execution type (automated or manual).
For this example project, the requirements shown in figure 3.1 are linked with the test cases of figure 3.2 according to the meaning of the test case. For example, the requirement Addition is associated with the test cases “add positive”, “add negative”, and “add negative and positive”. In order to execute those defined test cases, TestLink uses test plans and builds.
Test plans are used to group the test cases into a set of executable test cases. To execute a test plan, we need to have one or more builds defined in the given test plan. Figure 3.3 presents a similar view to figure 3.2, but containing information of a test plan execution.
Figure 3.3 – Test cases in a TestLink's test plan before an execution
In figure 3.3, all of the test cases are highlighted in gray, indicating that they have not been executed. A manual test result can be sent to TestLink through its user interface. In this example, we are going to execute the tests automatically using the Testlink's XML-RPC API.
Four simple methods were coded in python to perform the four basic math operations: Addition, subtraction, multiplication and division. Each of these methods has an x and y input parameter and returns the value of the operation applied to the parameters. Then, the tests of
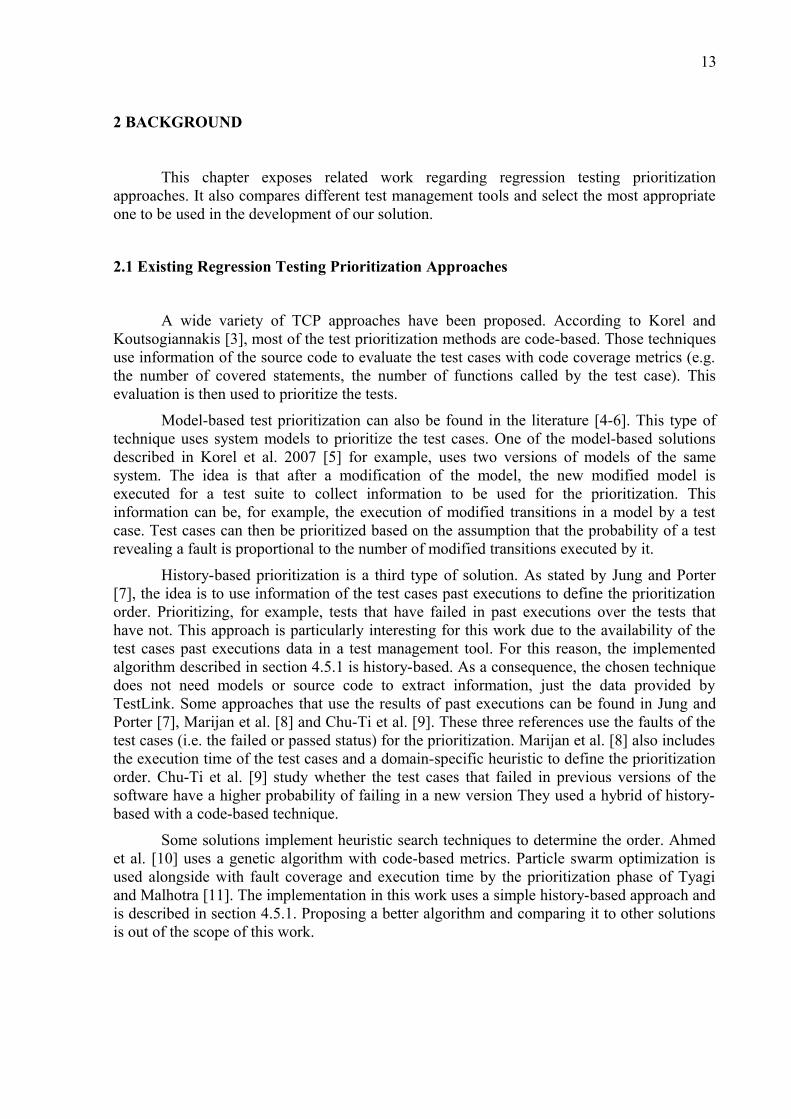
figures 3.2 and 3.3 were coded using python's unit test library. To execute and send the results to TestLink, and to reduce the coding work, Python-TestLinkRunner [23] was used. This library uses the id of the tests in TestLink to report the status result of the python test cases using the XML-RPC API. After the execution and the reporting of the results, the GUI element shown in figure 3.3 now looks like figure 3.4.
Figure 3.4 – Test cases in a TestLink's test plan after an execution
The test cases highlighted in green correspond to a passed test case, while a test case highlighted in red is a failed one. The failure of the “Multiply positive” test case was intentionally included in this demonstration. Upon seeing the failed test case, the tester might want to report a bug to the tool. TestLink does not have an integrated bug tracking module, but it can be integrated with external bug tracking systems like Bugzilla, Mantis, JIRA and others. For this section and subsequent work, we are going to use Mantis as the integrated bug tracking tool. After setting up Mantis and configuring TestLink to work with the bug tracker, the tester will need to manually create a bug in Mantis.
Figure 3.5 – Multiplication bug reporting in Mantis
This bug is then linked to the test case execution in TestLink using the bug id of the reported bug created in Mantis, which is informed using the test management tool interface. Notice how the bug description on figure 3.6 matches with the summary of the bug on figure 3.5.

19
Figure 3.6 – Partial view of a TestLink's test case execution result with an associated bug.
With the requirements, test cases, executions and bugs information, one can extract reports from TestLink to support QA analysis. Figure 3.7 is an example of an available report type. In this example we can see how each test case, and its last execution status result, relates to their associated requirements.
Figure 3.7 – Test results based on requirements report
Another useful feature of TestLink, is the support for custom fields. A custom field provides the ability to customize the tool to better fit one´s needs without having to modify the software's source code. A custom field has a name, a label, a type (there are 13 types, including string, checkbox, date and text area), and an “Enable on” field which sets the custom field to the test execution, test specification design or test plan design.
This concludes the demonstration of this section. Other functionalities, like user management or platform management were left out because they are not part of the subsequent modifications applied to the tool. For more information of how TestLink works, see the user manual [24].

20
4 TESTLINK MODIFICATIONS
This chapter contains the modifications applied to TestLink, and the software artifacts constructed around the TestLink environment to support the integration of our regression testing solution with the functionalities of the tool described in chapter 3.
4.1 Used Technologies
In our installation of TestLink we used MySQL as the object-relational database. This means that the enhancements provided by this work modify the TestLink's PHP code and the MySQL database. HTML, JavaScript and the Smarty web template system were also used for the modifications on the front-end side of the application. Additionally, DataTables [25] was used to better present tables in the tool. DataTables is a jQuery plug-in with the goal of enhancing the accessibility of data in HTML tables.
Some of the functionalities provided here are not an integrated part of TestLink. In this case, they use the XML-RPC API to communicate with the tool. The API had to be, in many cases, extended to support additional data for the different software pieces to communicate. The external software was built in Java. The main reason of this decision is that Java is already well established in the Fraunhofer environment.
4.2 Parameterized Tests
For the parametrization of test cases, we propose an integrated solution on TestLink. The idea is that the parameters can be defined on TestLink in such a way that, when the automated test are executed, the tool chain is able to extract the correct parameters from TestLink for each test case, and execute them with the provided values. Informing the parameters to the tester is also important when the test results are manually informed.
In this implementation, the parameters will be defined for the test project and then associated with builds and test cases. The calculator project presented on section 3.2 for example, can have two input parameters x and y. Those parameters are then associated with each test case that perform an operation with two input values (all of the test cases in this example). For each association, the value that each parameter will assume is given by the user. In this way, every parameterized test case will have the execution values for the parameters.
To support different parameter values for different executions, our solution uses a strategy of associating parameters with builds. Using the calculator project again as an example, we can create the build A and associate the parameters x and y with the values 30 and 20 in this build. If we want another set of values for another execution we can create the build B using other values for the same parameters. If a build does not have a particular parameter associated with it, and the same parameter is used by a test case associated with the test plan of that build, the value that the parameter will assume is the one associated with the test case.
21
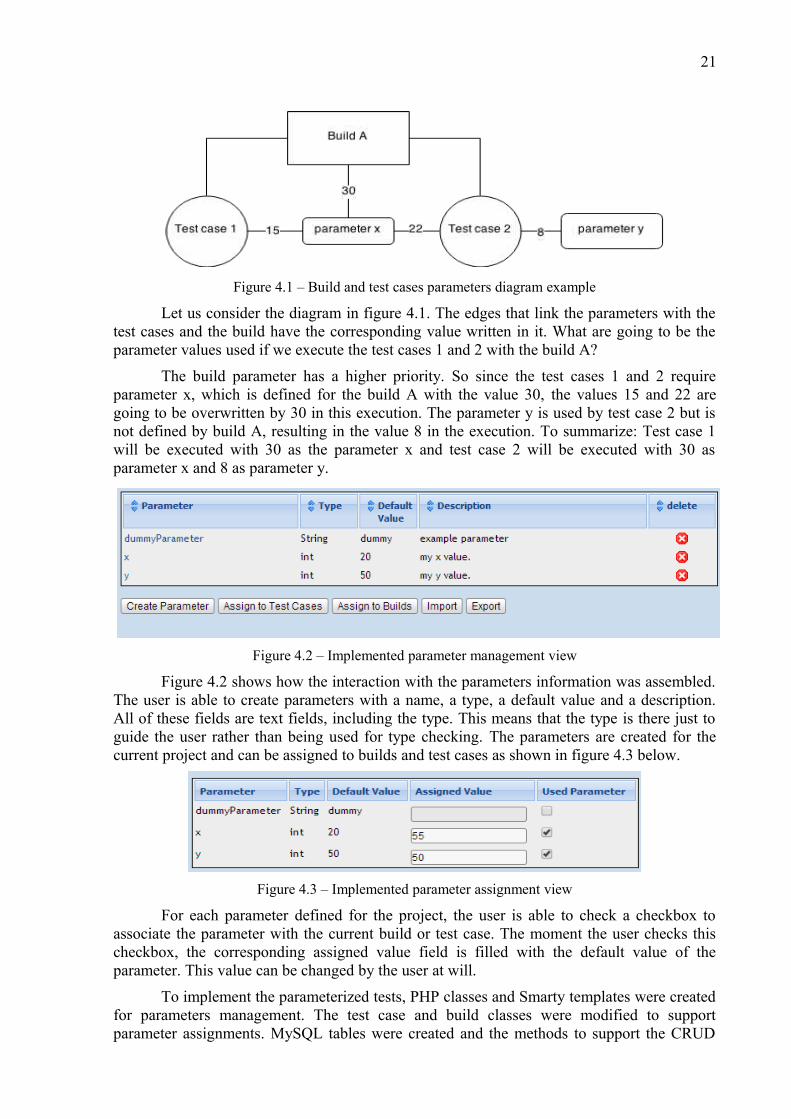
Figure 4.1 – Build and test cases parameters diagram example
Let us consider the diagram in figure 4.1. The edges that link the parameters with the test cases and the build have the corresponding value written in it. What are going to be the parameter values used if we execute the test cases 1 and 2 with the build A?
The build parameter has a higher priority. So since the test cases 1 and 2 require parameter x, which is defined for the build A with the value 30, the values 15 and 22 are going to be overwritten by 30 in this execution. The parameter y is used by test case 2 but is not defined by build A, resulting in the value 8 in the execution. To summarize: Test case 1 will be executed with 30 as the parameter x and test case 2 will be executed with 30 as parameter x and 8 as parameter y.
Figure 4.2 – Implemented parameter management view
Figure 4.2 shows how the interaction with the parameters information was assembled. The user is able to create parameters with a name, a type, a default value and a description. All of these fields are text fields, including the type. This means that the type is there just to guide the user rather than being used for type checking. The parameters are created for the current project and can be assigned to builds and test cases as shown in figure 4.3 below.
Figure 4.3 – Implemented parameter assignment view
For each parameter defined for the project, the user is able to check a checkbox to associate the parameter with the current build or test case. The moment the user checks this checkbox, the corresponding assigned value field is filled with the default value of the parameter. This value can be changed by the user at will.
To implement the parameterized tests, PHP classes and Smarty templates were created for parameters management. The test case and build classes were modified to support parameter assignments. MySQL tables were created and the methods to support the CRUD

22
operations were included in the TestLink code. We also want the ability to use the XML-RPC API as a mean of accessing the parameters information, resulting in new functionality added in the API.
More specifically, the included functionality is the ability to create a parameter for a test project, assign a parameter with a test case, assign a parameter with a build, get a specific parameter value of a test case and get a specific parameter value of a build. Those methods enable not only the ability of parameter creation and assignment programmatically, but also the ability of getting the parameters information needed for the test automation.
4.3 Test Case Source Code
In order to automate the tests in such a way that the command to execute the test plan is given through TestLink, knowing where to find the test cases code is necessary. The proposed solution for this problem is illustrated by figure 4.4.
Figure 4.4 – Test case source code file selection
Figure 4.4 displays how the user associates a test case with its source code file. This interface was included in the view of the test case creation and edition. With this addition, when the user wants to run a test plan, the external module will be able to link the appropriate files for the execution of the test cases. As an example, if the test case “add positive” is defined in the project, we can select the file “add.c” represented by figure 4.5 as its source code file, which contains the actual test code, using its abbreviated name “addPos”.
Figure 4.5 – add.c source file

23
To implement this feature, a folder named SUT was created in the TestLink server directory. Inside this folder, each project created on TestLink will have a specific directory with all its source code. As can be seen in figure 4.4, the interface displays the source code of the Calculator project (presented in section 3.2).
4.4 Dashboard
One of the features that TestLink is lacking is a summary of the status of the project. We decided to create a dashboard for the tool that makes it possible to view the results of past executions, schedule and run new executions, view running executions and provide a requirements coverage chart. Each of those features will be explained in the following subsections.
4.4.1 Executions History
A major concept that was included in TestLink by this work is the execution group. The execution group is a field that unifies the test cases executions that were executed together, represented by the date and time which the user executed the test cases. This enable us to access a group of test cases by its execution group date and time. Figure 4.6 shows how this field is used by the executions history in the dashboard.
Figure 4.6 – Executions history part of the dashboard
The executions history is a table that contains every execution group. The user can use this table to check the information of any past execution. The “Execution Time” column represents the execution group itself and each field of the column is a link to a report of a specific execution group. This report can be seen on figure 4.7.
The report shown in figure 4.7 is basically a table containing the information of every test case execution of an execution group. The fields of the column “Name” are links to the corresponding test cases page on TestLink. The column “Source” contains a link to the test case's source code if it was automatically executed and contains the word Manual otherwise. The column “Linked Bugs” is a list of links to each bug associated with a particular test case execution. Those links lead the user to the corresponding Mantis bug page (this feature was included only for the Mantis bug tracker and should be modified if another tool for bug

24
tracking is used). The “Parameter Values” column contains a list of every parameter and its corresponding value of each executed test case.
Figure 4.7 – Execution group report table
The tables that appear on the figures of this section use the DataTables plug-in for jQuery. The main reason for using this plug-in is its ability of displaying a large table on the page, allowing us to have test plans with a large number of test cases without compromising usability. In such a case, the table will be divided by pages. The plug-in also provides a search field to access a specific test case in a large set of test cases.
4.4.2 Scheduling and Running Executions
To allow the user to run automated test cases using the TestLink GUI, the scheduled executions portion of the dashboard was created. With this, a test plan and a build can be specified. An optional time limit can be used to halt the execution of the test cases and the user can also choose if he wants the test cases to be prioritized. Once the execution is scheduled, it will appear on the scheduled executions table. Figure 4.8 shows how those elements are represented by the tool.
Figure 4.8 – Scheduled executions table
As can be seen on figure 4.8, the table displays the name of the test plan, the name of the build, the number of test cases to be executed, whether the test cases will be prioritized or not, and the time limit (if any). Clicking on the “Execute” icon of a scheduled execution entry on the table will lead the user to a page that lists the manual and automated tests of the test

25
plan. The manual tests have a form to enter the results of the execution. Figure 4.9 is an example of such form.
Figure 4.9 – Manual tests reporting
Here we can select the status, and fill the execution duration, bug id and include notes. If the status of the execution is Failed, the bug id field is mandatory. A link to the Mantis bug creation page is included alongside the bug id input box for convenience. The tool also informs the parameters values to be used by the test case.
Figure 4.10 – Automated tests reporting
After the manual tests forms, the page displays a list of the automated test of the test plan and gives information about the time limit and prioritization. Figure 4.10 presents this part of the page. Clicking on the submit button will make the external module prioritize (if applied) and execute the automated test cases.
For each running execution of a test plan, the dashboard will show on a table the information of the execution. This includes the time in which the execution started and how much time it has currently taken to execute the test plan. Figure 4.11 contains the running executions table of the dashboard.
Figure 4.11 – Running executions table
4.4.3 Requirements Coverage
The dashboard has on the top of the page the current status of the QA project in the form of a requirements coverage metric. Figure 4.12 displays how this metric is presented. In this representation, we can see how many requirements have all the test cases with the status

26
marked as passed, how many have all the test cases marked as failed, how many have test cases with both of those status and how many have not a single test case result reported.
Figure 4.12 – Requirements coverage chart
4.5 External Module
Built in Java, the external module is responsible for prioritizing and executing the test cases of a test plan. The module is executed when the user runs the automated test cases using the dashboard. TestLink communicates the ids of the test project, test plan and build of the execution. If there is a time limit for the execution it will be informed and a prioritization flag will be on or off to indicate whether the test cases should be prioritized. Finally, a timestamp is informed and is going to be used to group the test cases under the same execution group.
With these parameters, the external module communicates all the remaining information using the XML-RPC API of TestLink. It will get the project and test plan information and use it with the combination of the parameter values information to assemble a main source code to execute the test cases. If the user decided that the test cases should be priritized, the prioritization algorithm will re-order the test cases. Section 4.5.1 explains the implemented prioritization approach. The source code is then compiled and executed and the results are reported back to TestLink.
Figure 4.13 is a sequence diagram that illustrates how the external module operates with TestLink, Mantis, a compiler and the compiled program that executes the test cases. The interaction starts when the user clicks on the button to automatically execute a test plan and ends after all the executed test cases have been reported back to TestLink.

27
Figure 4.13 – External module´s sequence diagram
In this particular implementation, we support projects written in the C programming language. This means that our external module should be able to compile and run a C program

28
and that it can parse the results of a C unit testing framework. To do that, the Java code is executing the MinGW [26] compiler and running the compiled binary.
The unit testing framework used is a modified version of MinUnit [27]. MinUnit is being used because it consist of simple macros to run a test case, meaning that they can be easily modified to suit our needs. We included on the MinUnit framework a standard message of a failed test case. This message consist of the test case name, the line number and file name of the failing assertion, and an additional string with a custom failing message. In our version, the elapsed time is also calculated and displayed after each test case. This elapsed time is particularly useful for the regression testing prioritization (see section 4.5.1). This result format is parsed by the Java code and the information is reported to TestLink.
We gave the external module the functionality of automatically reporting bugs. Using the data outputted by our version of MinUnit, we can use the Mantis SOAP API to create bugs. These bugs are then linked to the execution of failed test cases in TestLink by reporting the corresponding bug id of the execution.
The TestLink API had to be extended to support the additional information provided by our external module. These modifications include 16 additional methods and changes on existing methods to adapt them to the implemented functionalities. Namely, the additional methods include creating requirement specifications; creating and assigning requirements; creating and assigning parameters to builds and test cases; getting test cases and builds parameters; getting test plans, builds, test case files and bugs.
4.5.1 Implemented Prioritization Algorithm
For the implementation of this work, three different items are considered in the prioritization of the test cases:
1. Last Status: Test cases with the last execution status marked as failed will be prioritized over the passed ones. This is done because failures of the past might supposedly indicate a higher chance of finding a failure on the future.
2. Bugs Association: Test cases that have more reported bugs are prioritized over the ones with less bugs. This item aims at identifying fragile code with the assumption that raised bugs of the past can indicate a higher probability of finding new bugs.
The data available for each bug is also considered to weight each bug against the other. We use the properties Severity and Priority. They are both found in Mantis, the bug tracker used in this implementation.
3. Duration: By prioritizing test cases with shorter reported execution time, the number of test cases that we can execute is expected to increase.
Figure 4.14 depicts the proposed algorithm in pseudocode that combines those items to weight the test cases. The variable evaluation is used to sort the test cases in a descending order.

29
Figure 4.14 – TCP algorithm pseudocode
We start the evaluation in the algorithm by assigning the number one instead of zero. This is done because on line 6 the evaluation can be multiplied by two. If the evaluation variable were 0 on line 6, the last status would have no effect in the evaluation.
Our algorithm tries to include the number of bugs and their significance in the resulting evaluations. This is accomplished by multiplying the severity and priority of each associated bug and accumulating the results. On Mantis we can find 8 levels of severity ranging from 1 (named in Mantis as feature) to 8 (named as block) and 6 levels of priority from 1 (none) to 6 (immediate).
The last status of the test case is taken into consideration on line 6 by doubling the evaluation if the last status equals to failed. The multiplication factor could be different if we want to emphasize or de-emphasize the influence of the last status on the algorithm. In this case we are assuming that multiplying the value by 2 is enough to take the last status into account. Chapter 5 explains an experiment that tests this assumption.
To prioritize test cases with shorter execution time, the evaluation is divided by the test case´s last duration. The duration is increased by 1 on the seventh line of the algorithm to avoid the division by zero that can arise when the reported last duration of the test case is zero.
4.6 Additional Reports
Even though TestLink already has a significant number of report types, we have included 4 new types of report with the goal of better visualization of the resulting coverage data. Figure 4.15 shows the traceability matrix report. This table has all the test cases of the test project in the rows and all the requirements on the columns. If a test case is associated with a requirement, the cell with the test case as the row and requirement as the column is checked. Figure 4.16 shows the linked bugs report. This report is a table listing all the bugs of a project and their corresponding test cases. This report uses information retrieved from Mantis to display the data of the bugs.

30
Figure 4.15 – Requirements traceability report
Figure 4.16 – Linked bugs report
The remaining reports give details about the execution groups results over time. Figures 4.17 and 4.18 are two parts of the same report. They show the results of the test cases by requirements per execution. Figure 4.17 is a stacked chart that, given a start and end execution groups, displays the executions in the range provided as well as the evolution of the requirements coverage over time. Its x-axis represents the execution groups and the y-axis is the number of requirements. Figure 4.18 is a table that given an execution group, we can see which tests are responsible for failing or passing a requirement. It consists of a similar view of the traceability matrix (figure 4.15), but with the test results of a specific execution. The results of the table are accumulated, meaning that if a test was not executed in the given
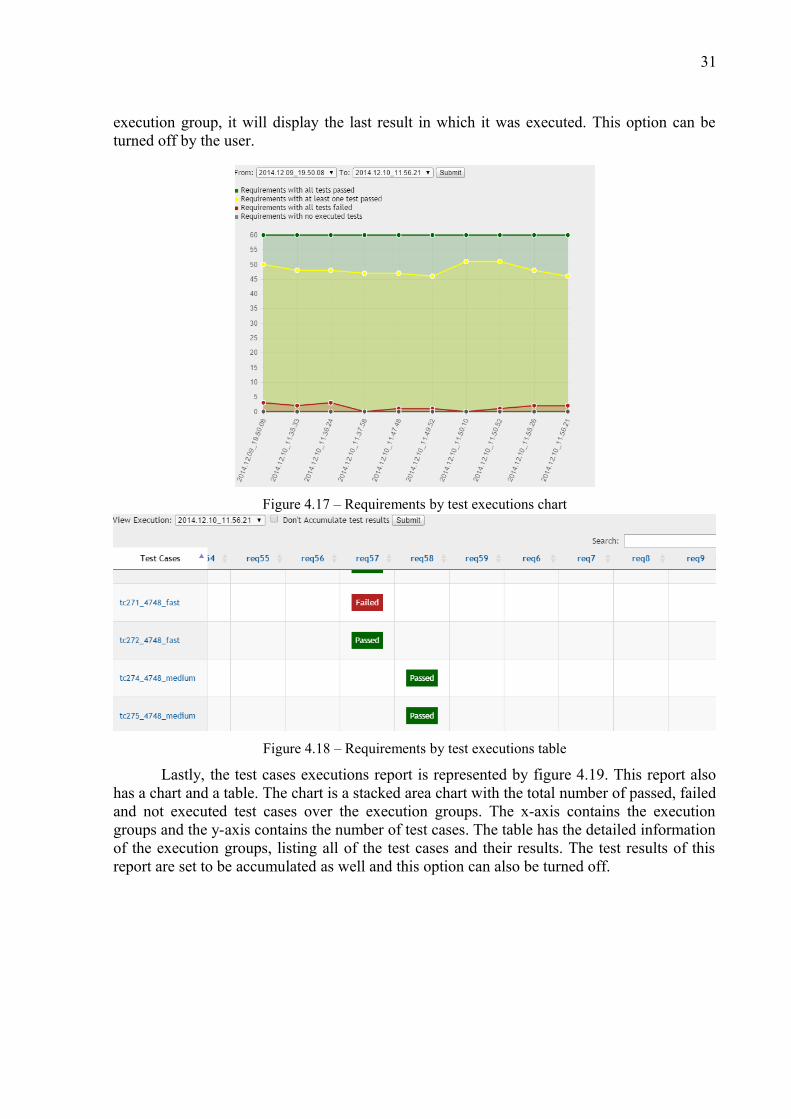
31
execution group, it will display the last result in which it was executed. This option can be turned off by the user.
Figure 4.17 – Requirements by test executions chart
Figure 4.18 – Requirements by test executions table
Lastly, the test cases executions report is represented by figure 4.19. This report also has a chart and a table. The chart is a stacked area chart with the total number of passed, failed and not executed test cases over the execution groups. The x-axis contains the execution groups and the y-axis contains the number of test cases. The table has the detailed information of the execution groups, listing all of the test cases and their results. The test results of this report are set to be accumulated as well and this option can also be turned off.
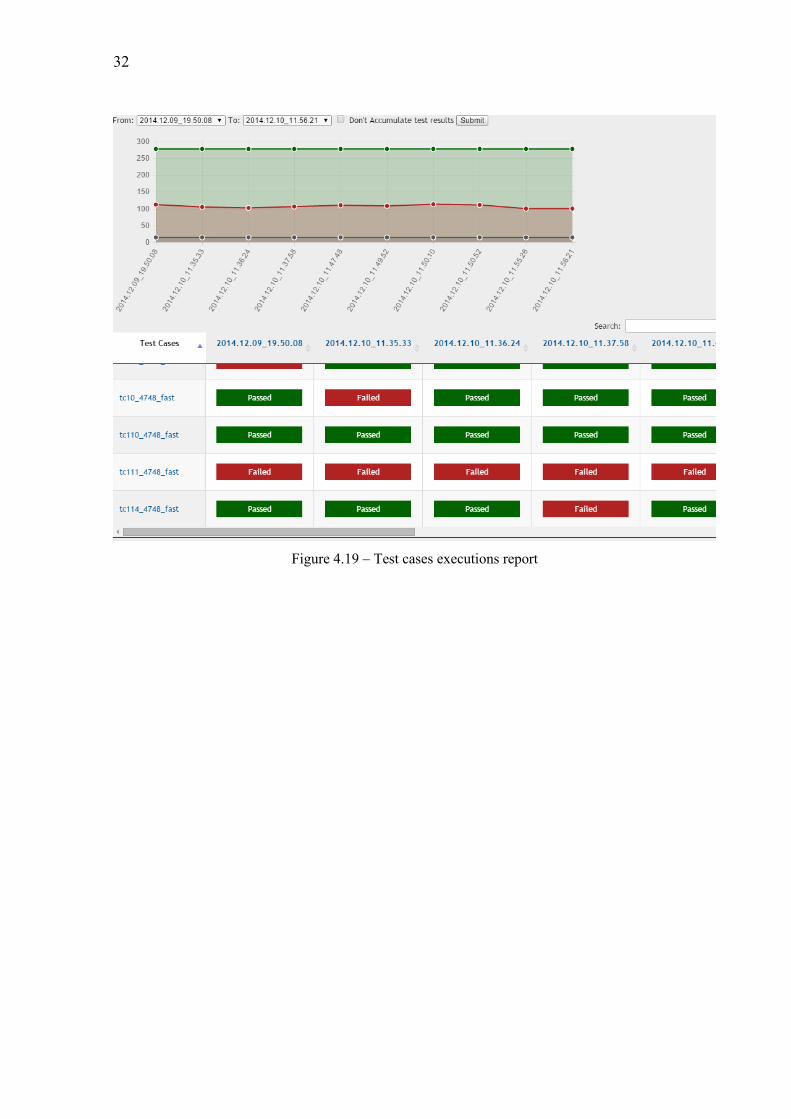
32
Figure 4.19 – Test cases executions report

33
5 REGRESSION TESTING PRIORITIZATION IMPLEMENTATION
This chapter explains an experiment to test if the implemented regression testing prioritization strategies can improve the failure detection rate. It also explains how a testing project was generated to evaluate the algorithm.
5.1 Evaluating the Algorithm
For the purpose of verifying that the algorithm can prioritize the test cases with the goal of increasing the rate of detected failures over time, an experiment was done. The experiment is also used in this work to test the influence of each one of the three items described in section 4.5.1 (i.e. last status, bugs association and duration).
In this experiment, test cases of a test project are executed to feed our modified version of TestLink with test results data. The resulting database is then used as a starting point to execute the algorithm described in section 4.5.1 under different time limits and variations. The time limits used are 20, 40 and 60 minutes. This means that, after the test cases have been prioritized by the algorithm, they will be executed sequentially in the order defined by the algorithm until the time limit value is reached. These three different values are used to verify if the results of the technique is consistent under different time limits.
We also want to verify if each of the historical information data of the test cases has a positive effect on the algorithm results, and if the chosen method reasonably accounts for these distinct items. To do that, some modifications on the algorithm presented in figure 4.14 were made. In order to isolate the influence of each item described before (last status, bug association and duration), 7 versions of the code were generated in such a way that each version is a unique selection of the three items. In one of the versions, for example, the bug association is left out of the algorithm, resulting in the code shown by figure 5.1.
Figure 5.1 – Partial TCP algorithm pseudocode
5.2 Generating a Project for the Evaluation Of the Algorithm
To execute the algorithm and validate the results, a test project is needed. We want a project that has a variety of test cases regarding execution time, status and bugs reported, yet it should be easy to setup and compile for sake of simplicity. The fact that a custom unit testing framework is being used in this implementation implies that, if we would use a real project, the test cases would have to be rewritten. For these reasons, test cases that simulate this behavior were generated.
A particular strategy was used to generate the test cases. The test cases can be divided by status and execution time. The possible yielding status categories are:

34
1. A test case that will always be reported as passed.
2. A test case that will always be reported as failed. Test cases in this category display always the same error message and thus, they will each raise one bug the first time they are executed and will not raise new bugs in subsequent executions.
3. A test case with a probability of failure. This category is then subdivided in 3 categories regarding the probability of failure:
3.1 A test case with 20% chance of failure.
3.2 A test case with 40% chance of failure.
3.3 A test case with 80% chance of failure.
Test cases in this category will report a new bug almost every time it is executed and failed. The exception will be explained by the end of this section.
4. A test case that will not be executed.
The possible execution time categories are:
1. Fast. Test cases in this category will take from 0 to 0.5 minutes to execute.
2. Medium. Test cases in this category will take from 0.5 to 2.3 minutes to execute.
3. Slow. Test cases in this category will take from 2.3 to 4.8 minutes to execute.
The script to generate the test cases uses random numbers to select the categories with different probabilities of a test case falling in each category. The resulting test cases then will have the following profile: 5% of the test cases will not be executed. 20% of the test cases will always fail. 20% will always pass. 55% of the test cases can fail or pass. From these 55%: 80% have a 20% probability of failure. 15% have a 40% of failure and 5% have an 80% probability of failure.
Figure 5.2 – Probabilities of test cases categories
The execution times categories are distributed using 60% of chance of being a fast test case, 30% of being a medium test case and 10% of being a slow one. Figure 5.3 shows an example of a resulting test case code.

35
Figure 5.3 – Generated test case code
The method getResult() is used to get a random number using the rand function of the C standard library. Line 2 is used to select the sleep time. Line 3 calls the method to sleep for the given time. Line 4 will get the actual “result” of the test case and Lines 5 and 6 will compare this result with the chance of failure and yield the corresponding status result. Note that failurePercentage is a parameter of the test case. The value of this parameter is defined on TestLink and can assume the values 20, 40 or 80, as stated previously in this section.
As a final observation, bugs are reported to Mantis using the failure message outputted be the 5th Line. If the message is exactly the same as a previously reported bug, instead of generating a new bug, the test case will be associated with the existing bug with the same message. This means that there is a chance of a test case with a probability of failure to not raise a new bug in a failed execution. Consider the presented test case with a failure percentage of 20 as an example. If during the execution E1 the result variable (Line 4) assumes the value 12, a bug will be reported. If there is another execution EN where the result variable also equals 12, a new bug will not be reported because there is a bug with the same message and raised by the same test case in Mantis already.
5.3 Running the Tests
In order to acquire some data to feed the algorithm, the test plan was executed 10 times. Since the algorithm uses only the status and duration of a test case of the last execution, we could have executed the test plan only once to get data for those properties. But the reported bugs can give us information that goes beyond the last execution: A test case can fail for different reasons each time it's executed, thus reporting different bugs.
After those 10 executions, the test cases code must be modified to eliminate the random factor of the results. In order to compare different executions we will need the same input data. This was accomplished with a script that scan all the test cases source codes and change every call to the method that returns a random number with an actual return value of the same method.
This will “freeze” the results of the next execution, allowing us to run the test cases, get the information of passed and failed test cases, modify the algorithm as we want, return the database to a previous state and do the same process again as much times as necessary to compare different execution results with the same input data.
5.4 Results
Since the goal of a TCP technique is to increase the rate of fault detection with a time constraint, a time limit was provided for the following executions. The full execution of all

36
the test cases without any time limit, considering the previous 10 executions, is 97 failed test cases and 167 passed test cases. This result can be compared to different variations of the proposed algorithm and considering different time limits. Table 4.1 shows the results for time limits of 20, 40 and 60 minutes, and considering the influence of status, bugs, duration and all its permutations.
Table 5.1 – Executions results
PrioritizationTime Limit
20 min 40 min 60 min
no. status bugs duration Failed Passed Failed Passed Failed Passed
1 11 21 30 50 40 71
2 x x x 18 29 54 51 71 61
3 x x 15 22 28 44 62 44
4 x x 49 13 66 45 78 93
5 x 37 0 56 6 56 39
6 x x 17 30 28 57 51 82
7 x 14 16 24 48 45 66
8 x 24 46 58 93 68 112
The fifth row has the higher failure to executed tests rate. Hence, for this particular set of data, the last execution status was a better predictor than the associated bugs of a failure in the future. Knowing if this claim can be made generally is out of the scope of this work. The test case generation strategy used bias the results, and no statistical rigor was applied. How the bug association weight is calculated also affects this influence. As a consequence of the test case generation and bug reporting implementation, all bugs were reported with the same severity and priority, thus eliminating the effect of prioritizing some bugs over others. More important than this, however, is that the test cases programmed to always fail will raise only 1 bug per test case to simulate an unresolved issue, while the test cases with only a chance of failure can raise a new bug each time it fails. Since it would be better to prioritize the test cases that always fail over the ones that may fail, the bug association performs worse in this situation. While those conclusions apply for this set of results, they might not apply in a real environment given the unpredictability of the test cases or even a different bug reporting strategy.
Looking at table 5.1 one can conclude that the more weight the duration has, the more test cases we end up executing. The eight row has the highest number of executed test cases in all the time limit categories. A combination of the last status and the duration was the one with the most number of failed test cases detected. Combining the better predictor of status with the characteristic of executing more test cases, and without the influence of detected bugs, 60 minutes of time limit resulted in 78 detected failures. This means that it has detected 80% of the 97 failures of the execution without time limit, which is taking around 150 minutes to complete.

37
The impact of the prioritization algorithm execution time was not measured. The cost of calculating the evaluation with only a subset of the history-data is trivially lower than the cost of using the three items described at the beginning of section 4.5.1. Calculating the time it takes to generate the priorities relative to the time it takes to run the test cases can reveal a better understanding of the cost-benefit of each history information.

38
6 CONCLUSION
In this work, we chose a test management tool and we applied modifications to it in order to include a module to automate the execution and determination of the test cases in a test plan. Since testing is an integral part of the analytical software quality assurance processes, which takes a relevant portion of the development costs, our solution aimed to improve the cost-benefit of applying the SQA testing process.
TestLink appeared to be the best open source tool to our needs thanks to its XML-RPC API, requirements management and external bug tracking support. Parameterized tests, source code selection and a dashboard were included in TestLink to accommodate an external module that prioritizes and executes test cases, reporting the results back to the tool and automatically creating bugs for the failed test cases. These modifications raised the opportunity of visualizing SQA data not originally supported by TestLink, thus new types of reports were created.
Regression testing is a particularly expensive form of testing because of its repetitive nature. The solution provided by this work uses a history-based test prioritization strategy with the goal of maximizing the number of detected failures in an environment where there is limited time for regression testing. To test the algorithm, a project was created in TestLink with a particular strategy to generate tests cases. The results indicate that prioritizing tests using the data of past executions can improve the ratio of detected failures to test execution time for the generated project.
For future work, using the solution in a real project can reveal further details to be modified or included in the tool. Our implementation made TestLink dependent on Mantis, further modifications could be made to regain the support for other bug tracking systems. In fact, creating an integrated bug tracking in TestLink is another possible improvement to the tool. This would allow for more flexibility in the development of new reports, making the bugs more integrated with the other concepts of the test management. Studying how TestLink can communicate with other tools in a software development tool chain can also reveal additional features. A connection with a project management software, for example, could yield different report types using information available in both tools.
Implementing different test prioritization strategies and combining them with test selection algorithms is also a possibility to explore what results can be achieved on the failure detection optimization. As can be seen on the related work regarding the prioritization approaches, a further solution could consist of a heuristic search with a combination of history-based, code-based or even model-based techniques on a subset of test cases previously selected by an RTS algorithm.

39
REFERENCES
1 BROOKS, F. P. No Silver Bullet: Essence and Accidents of Software Engineering. IEEE Computer, v. 20, n. 4, p. 10-19, Apr. 1987.
2 GRAVES, T. L.; HARROLD, M. J.; KIM, J.; PORTER, A.; ROTHERMEL, G. An empirical study of regression test selection techniques. In Proceedings of the International Conference on Software Engineering, Kyoto, p. 267-273, Apr. 1998.
3 KOREL, B.; KOUTSOGIANNAKIS, G. Experimental Comparison of Code-Based and Model-Based Test Prioritization. Software Testing, Verification and Validation Workshops, 2009. ICSTW'09. International Conference on, Denver, p. 77-84, Apr. 2009.
4 KOREL, B.; TAHAT, L.H.; HARMAN, M. Test Prioritization Using System Models. Software Maintenance, 2005. ICSM'05. Proceedings if the 21st IEEE International Conference on, p. 559-568, Sept. 2005.
5 KOREL, B.; KOUTSOGIANNAKIS, G.; TAHAT, L.H. Model-Based Test Prioritization heuristic methods and their evaluation. In Proceedings of the 3rd International Workshop on Advances in Model-based Testing (A-MOST 2007), New York, p. 34-43, 2007.
6 XIABO HAN; HONGWEI ZENG; HONGHAO GAO. A Heuristic Model-Based Test Prioritization Method For Regression Testing. Computer, Consumer and Control (IS3C), 2012 International Symposium on, Taichung, p. 886-889, June 2012.
7 JUNG-MIN KIM; PORTER, A. A history-based test prioritization technique for regression testing in resource constrained environments. Software Engineering, 2002. ICSE 2002. Proceedings of the 24rd International Conference on, Orlando, p. 119-129, May 2002.
8 MARIJAN, D.; GOTLIEB, A; SEN, S. Test Case Prioritization for Continuous Regression Testing: An Industrial Case Study. Software Maintenance (ICSM), 2013 29th IEEE International Conference on, Eindhoven, p. 540-543, Sept. 2013.
9 CHU-TI LIN; CHENG-DING CHEN; CHANG-SHI TSAI; KAPFHAMMER, G.M. History-Based Test Case Prioritization with Software Version Awareness. Engineering of Complex Computer Systems (ICECCS), 2013 18th International Conference on, Singapore, p. 171-172, July. 2013.
10 AHMED, A.A.; SHAHEEN, M.; KOSBA, E. Software testing suite prioritization using multi-criteria fitness function. Computer Theory and Applications (ICCTA), 2012 22nd International Conference on, Alexandria, p. 160-166, Oct. 2012.
11 TYAGI, M.; MALHOTRA, S. Test case prioritization using multi objective particle swarm optimizer. Signal Propagation and Computer Technology (ICSPCT), 2014 International Conference on, Ajmer, p. 390-395, July 2014.
40
12 TestLink. Available at: <http://testlink.org/>. Access: Jan. 2015.
13 TesTopia. Available at: <https://developer.mozilla.org/en-US/docs/Mozilla/Bugzilla/Testopia>. Access: Jan. 2015.
14 RTH. Available at: <http://sourceforge.net/projects/rth/>. Access: Jan. 2015.
15 Tarantula. Available at: <http://www.testiatarantula.com/>. Access: Jan. 2015.
16 Squash TM. Available at: <http://www.squashtest.org/index.php/en/squash-tm-25664/squash-tm-overview/>. Access: Jan. 2015.
17 Squash TA. Available at: <http://www.squashtest.org/index.php/en/squash-ta/squash-ta-overview/>. Access: Jan. 2015.
18 Requirements and Test Management Repository. Available at: <http://rtmr.net/en/index.html>. Access: Jan. 2015.
19 XStudio. Available at: <http://www.xqual.com/products/xstudio.html>. Access: Jan. 2015.
20 Xqual test tools comparison. Available at: <http://www.xqual.com/qa/tools.html>. Access: Jan. 2015.
21 XStudio licenses. Available at: <http://www.xqual.com/products/xstudio_license.html>. Access: Jan. 2015.
22 TestLink forum. Available at: <http://forum.testlink.org/index.php>. Access: Jan. 2015.
23 Python-TestLink-Runner. Available at: <https://github.com/parthibann/Python-TestLink-Runner>. Access: Jan. 2015.
24 TestLink user manual. Available at: <https://wiki.openoffice.org/w/images/1/1b/Testlink_user_manual.pdf>. Access: Jan. 2015.
25 DataTables. Available at: <https://datatables.net/>. Access: Jan. 2015.
26 MinGW. Available at: <http://www.mingw.org/>. Access: Jan. 2015.
27 MinUnit. Available at: <http://www.jera.com/techinfo/jtns/jtn002.html>. Access: Jan. 2015.
28 IEEE Standard for Software Quality Assurance Processes. IEEE Std 730-2014 (Revision of IEEE Std 730-2002), p. 1-138, June 2014.
29 KANER, C.; FALK, j.; NGUYEN, H.Q. Testing Computer Software. 2Nd Edition. New York: John Wiley & Sons, 1999.
41
30 REX, B. Managing the Testing Process: Practical Tools and Techniques for Managing Hardware and Software Testing. 3Rd Edition. Indianapolis: John Wiley & Sons, 2009.
31 TASSEY, G. The Economic Impacts of Inadequate Infrastructure for Software Testing. RTI Project 7007, National Institute of Standards and Technology, Gaithersburg, May 2002.
32 MYERS, G. J.; SANDLER C.; BADGETT, T. The Art of Software Testing. 3Rd
Edition. Hoboken: John Wiley & Sons, November 2011.
33 WAGNER, S. Cost-Optimization of Analytical Software Quality Assurance: Models, Data, Case Studies. Saarbrücken : VDM Publishing, 2008.
34 ROTHERMEL, G.; UNTCH, R. H.; CHENGYUN CHUN; HARROLD M.J. Prioritizing Test Cases For Regression Testing. Software Engineering, IEEE Transactions on, p. 929-948, Oct 2001.
35 IEEE Standard for Software and System Test Documentation. IEEE Std 829-2008, p. 1-150, July 2008.
36 GNU General Public License, version 2. Available at: <http://www.gnu.org/licenses/gpl-2.0.html>. Access: Jan. 2015.
37 Mozilla Public License Version 1.1. Available at: <https://www.mozilla.org/MPL/1.1/>. Access: Jan. 2015.
38 GNU General Public License, version 3. Available at: <http://www.gnu.org/licenses/gpl.html>. Access: Jan. 2015.
39 GNU Lesser General Public License. Available at: <http://www.gnu.org/licenses/lgpl.html>. Access: Jan. 2015.
40 Xstudio License. Available at: <http://www.xqual.com/products/xstudio_license.html>. Access: Jan. 2015.
41 FARREL-VINAY, P. Manage Software Testing. Boston: Auerbach publications, March 2008.
42 SOMMERVILLE, I. Software Engineering. 9th Edition. Boston: Pearson, March 2010.
43 GRAHAM, D.; VEENENDAAL, E. V.; EVANS, I.; BLACK, R. Foundations of Software Testing: ISTQB Certification. London: Cengage Learning EMEA, January 2008.
44 Open source test management tools. Available at: <http://www.opensourcetesting.org/testmgt.php>. Access: May. 2015.
45 Smarty. Available at: <http://www.smarty.net/>. Access: June. 2015.
46 Mantis. Available at: <https://www.mantisbt.org/>. Access: June. 2015.