a regional biological approach to the spread of farming in ... · spread of farming in europe...
TRANSCRIPT

S59
C u r r e n t A n t h ro p o l o g y Volume 45, Supplement, August–October 2004� 2004 by The Wenner-Gren Foundation for Anthropological Research. All rights reserved 0011-3204/2004/4504S4-0003$10.00
A Regional BiologicalApproach to theSpread of Farming inEurope
Anatolia, the Levant, South-Eastern Europe, and theMediterranean1
by Ron Pinhasi andMark Pluciennik
This article examines the potential contribution of archaeologi-cal human skeletal material, in particular craniometric data, tointerpretations of the nature of the transition to farming in Eu-rope. The material is discussed particularly in relation to recentdebates about demographic variables and processes and moderngenetic frequency patterns. It is suggested that biological mor-phometrics enables the comparison of ancient populations on aregional basis. Analysis of the material suggests that there wasconsiderable morphological heterogeneity among the earliestfarmers of the Levant belonging to the Pre-Pottery Neolithic butthat similar variability is generally not seen among the earliestmainland agriculturalists of south-eastern Europe. We proposethat this may be explained by the existence of a genetic “bottle-neck” among Anatolian populations and that it supports modelsof the largely exogenous origin of many early Neolithic popula-tions in this region. Regional comparisons further demonstrate abiologically more complex relationship between Mesolithic andNeolithic populations in the central and western Mediterranean.The regional and chronological variability of transitions to farm-ing is stressed, and it is pointed out that different techniqueshighlight different aspects of the processes involved at a range ofscales and resolutions.
ro n p i n h a s i is Lecturer in the School of Life and Sport Sci-ences, University of Surrey Roehampton, West Hill, LondonSW15 2SN, U.K. [[email protected]]). Born in 1968, hewas educated at Simon Fraser University (B.A., 1996), KatholiekeUniversiteit Leuven (M.A., 1997), and Cambridge University. Hehas published “A New Model for the Spread of the First Farmersin Europe” (Documenta Praehistorica 30), “A Biometric Study ofthe Affinities of Nazlet Khater: A Quantitative Analysis of the
1. We thank the Natural Sciences and Engineering Research Coun-cil of Canada (NSERC) for a PGS-B doctoral scholarship to RP; F.W. Rosing, Universitatsklinikum, Institut fur Humangenetik undAnthropologie, Ulm, Germany; Robert Foley and Marta Lahr, De-partment of Biological Anthropology, University of Cambridge,U.K.; Stephen Shennan, Institute of Archaeology, University Col-lege, London, U.K.; and Guido Barbujani, Department of Biology,University of Ferrara, Italy.
Mandible Dimensions,” in Palaeolithic Living Sites in Upperand Middle Egypt, edited by P. M. Vermeersch (Leuven: LeuvenUniversity Press, 2003), and, with R. Foley and M. M. Lahr,“Spatial and Temporal Patterns in the Mesolithic-Neolithic Ar-chaeological Record of Europe,” in Archaeogenetics, edited by C.Renfrew and K. Boyle (Cambridge: McDonald Institute, 2000).
m a r k p l u c i e n n i k is Director of Distance Learning and Lec-turer in Archaeology at the University of Leicester (UniversityRoad, Leicester LE1 7RH, U.K. [[email protected]]). Born in1953, he was educated at the University of Sheffield (B.A., 1989;Ph.D., 1994). His publications include “Radiocarbon Determina-tions and the Mesolithic-Neolithic Transition in Southern Italy”(Journal of Mediterranean Archaeology 10:115–50), “Deconstruct-ing the Neolithic in the Mesolithic-Neolithic Transition,” in Un-derstanding the Neolithic of North-Western Europe, edited byMark Edmonds and Colin Richards (Glasgow: Cruithne Press,1998) and “The Invention of Hunter-Gatherers in Seventeenth-Century Europe” (Archaeological Dialogues 9[2]: 98–151).
The present paper was submitted 20 v 03 and accepted 22 i 04.
Recent interpretations of the Mesolithic-Neolithic tran-sition have tended to be polarized between two dominantmodels. One is that of the dispersion of farmers intoEurope, in which expanding Near Eastern populationsreplaced local hunter-gatherer bands with only a mini-mal-to-moderate amount of admixture. Although thismodel was long accepted for the “Danubian” Neolithiccultures of central Europe (e.g., Childe 1925; Clark1965a, b; Piggott 1965), Childe especially was happy toaccept a variety of possible modes of transition for Eu-rope more generally (see Pluciennik 1999:662). However,this broadly culture-historical model was generalized byAmmerman and Cavalli-Sforza (1971, 1973) in proposingwhat is known as the “wave-of-advance” model, whichsuggested a gradual process of population expansion offarming communities northwards and westwards. Thebasic contention of this model was that the demographicprofile of farming populations differed from that ofhunter-gatherers. Population growth resulted in the ex-pansion of local populations in all directions and at arelatively steady rate. Support for this model was basedon archaeological, chronological, and geographic-dis-tance data, and diffusion rates were calculated on thebasis of geographic distances and radiocarbon dates. Sub-sequently, mainly genetic data were used to support ar-guments for this putative population expansion (e.g.,Ammerman and Cavalli-Sforza 1984; Sokal, Oden, andWilson 1991; Barbujani, Bertorelle, and Chikhi 1998;Cavalli-Sforza, Menozzi, and Piazza 1993, 1994). Thestrongest adherents of this view have been Renfrew(1992, 1996) and Cavalli-Sforza (1996), who have alsosuggested strong correlations between linguistic patterns(e.g., Indo-European language families), modes of subsis-tence, and modern distributions of genetic traits.
The second approach views the transition rather as asociocultural process in which the process of Neolithi-zation involved not so much large-scale populationchanges (through whatever mechanism) as the diffusionof knowledge, resources, technology, and other practicesthrough a variety of processes. The spread of farming isseen as often gradual and not necessarily resulting in aradical break in the mobile hunting-foraging lifestyle

S60 F current anthropology Volume 45, Supplement, August–October 2004
(Dennell 1983:170–89; 1985; Whittle 1996, 1997). Thisavailability-substitution-consolidation model, proposedby Zvelebil and Rowley-Conwy (1984, 1986; Zvelebil1986), views the transition to farming as occurring atdifferent rates and in different ways in the variousregions of Europe and envisions biological and culturalcontinuity from the Mesolithic to the Neolithic in manyareas of Europe. Archaeologists who support this modelprovide evidence which suggests continuity in materialculture and other practices and emphasize the economic,technological, and cultural complexity of many Meso-lithic societies (Zvelebil 1989, 2000; Price 2000a).
Zilhao (1993, 2000, 2001) has proposed a hybrid modelaccording to which the spread of Neolithic lifewaysacross Europe was a punctuated process with two mainpulses. The first, beginning around 6,800–6,400 uncal bp,is characterized by the spread of farming along a Dan-ubian and a Mediterranean route. According to Zilhaothe spread of farming along the first was rapid and in-volved the absorption of local Mesolithic groups. In sharpcontrast, the spread of farming along the Mediterraneancoasts was slower because of the predominance ofhunter-gatherer groups in these regions. As a result,hunter-gatherer bands and a more mobile settlement sys-tem persisted along the western Mediterranean shores.This pulse of “enclave colonization” by farmers was fol-lowed by the establishment of well-defined boundariesbetween Mesolithic and Neolithic groups. Subsequently,a second pulse occurred after 6,000–5,500 uncal bp inwhich agro-pastoral economies reached northern Iberia,western France, the Low Countries, the British Isles, andScandinavia. The spread of farming in these regions isargued to be the result of the adoption of these practicesby local hunter-gatherer groups rather than an incomingwave of farmers.
There are other variants, such as van Andel and Run-nels’s (1995; see also Runnels and van Andel 1988) sug-gestion of Neolithic farmers’ seeking suitable areas for“cash crops” and participating in planned colonizationsof parts of Greece and Italy. However, it is fair to saythat in the past five years the developing consensusamong archaeologists is that the processes of transitionare best described at the regional level and varied widelyin context, nature, tempo, and timing across Europe (cf.Gkiasta et al. 2003). Reflecting this shift, the word “mo-saic” has increasingly been invoked to describe this per-ceived variation (Tringham 2000:53). So far, however, lit-tle has been done in terms of comparative physicalanthropology in relation to these debates (but see LaluezaFox 1996, Jackes, Lubell, and Meiklejohn 1997a, and [forIberia] Lalueza Fox and Gonzalez Martın 1998). In gen-eral, genetic data are of insufficient resolution to addressthese issues at the regional level (but see, e.g., Bertran-petit and Cavalli-Sforza 1991). In this article a novel syn-thesis of biological morphometric data is analysed at theregional and interregional levels in order to address anddiscuss its implications for the models described above.Ultimately, the assessment of biological similarities andadmixture between “hunters” and “farmers” requires
the development of better understanding of morpholog-ical or other variability among all past populations.
A Regional Approach
Settlement pattern analysis was used to estimate pastdemographic processes of Neolithic expansion by region(Pinhasi, Foley, and Lahr 2000). Inter alia, analysis of thearchaeological data indicates a rapid appearance of thefirst Neolithic occupation sites north-westwards fromAnatolia into south-eastern and central Europe duringthe Early Holocene, from ca. 8,000 uncal BP. Subsequentdispersions of Early Neolithic occupation continuedwestwards and northwards largely along the main rivervalleys of central Europe. On the basis of these findings,a regional approach has been developed and applied tothe craniometric analysis of Mesolithic and Neolithicpopulations. This approach emphasizes the need to ex-amine the Mesolithic-Neolithic transition as a series ofregion-specific cases and a set of historical processesrather than a single generic episode (Lahr, Foley, and Pin-hasi 2000).
The placement of a given specimen in a particular re-gion was based solely on the geographic location of itsassociated site. The regions were defined according to acombination of geographic and archaeological criteria (ar-chaeological cultures such as Linienbandkeramik [LBK],Impressed Ware, and the like). This regional scheme is anelaboration of similar divisions adopted in the archaeo-logical literature (e.g., Whittle 1996). Regions 1, 5, and 6are examined here (fig. 1). Region 1 (Turkey and the Le-vant) includes the place of the origins of Eurasian farming.Region 5 (south-eastern Europe) is where the earliest Eu-ropean Neolithic farming sites occur. Region 6 (Mediter-ranean Europe) is the Mediterranean zone from Greece tothe Iberian Peninsula. The study of these regions thusprovides an in-depth inspection of the earliest phases ofthe Neolithic transition in Europe. Full discussion of cen-tral and northern Europe (regions 2–4) would require morespace than is available here, and for regions 7 and 8 thecollection of more data will be necessary.
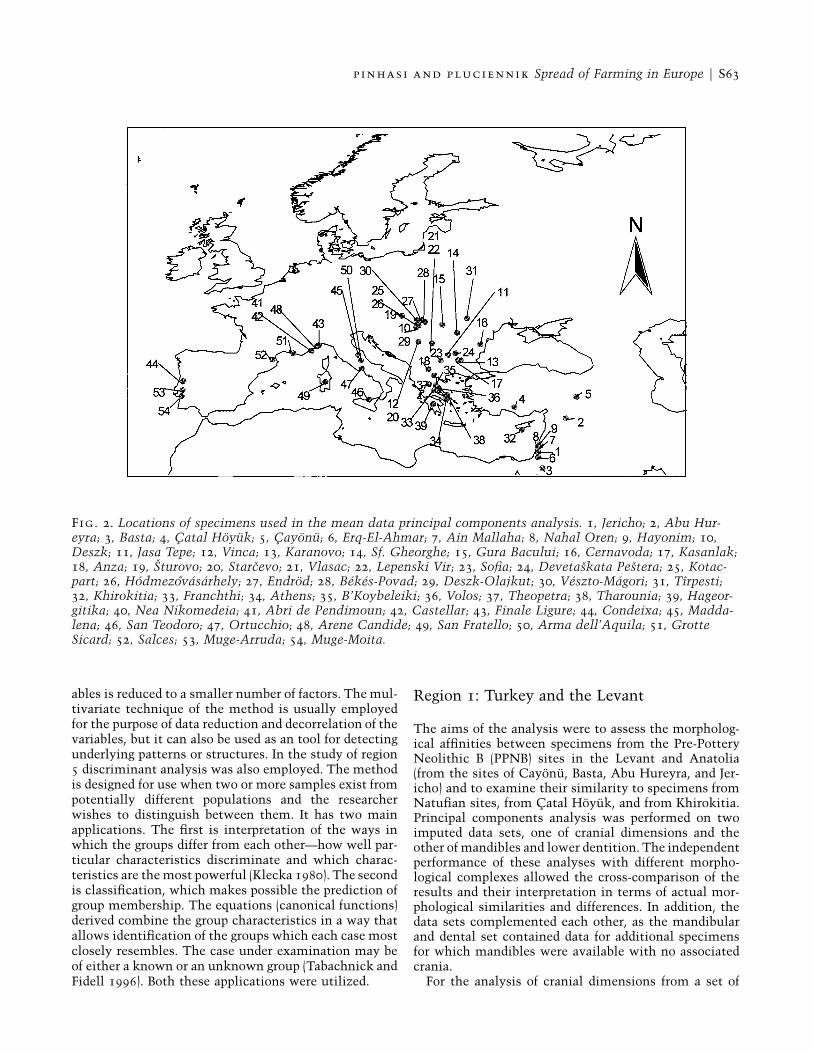
The skeletal data derive from fieldwork by RP, fromthe literature, and from the ADAMS database at the De-partment of Anthropology, University of Geneva, Swit-zerland (table 1). The sites that produced the specimensstudied are depicted in figure 2. A certain degree of mea-surement bias in the ADAMS database due to interob-server error is to be expected given that it was compiledfrom various published sources and collected by differentanthropologists over a period of 100 years. Nevertheless,previous analyses (Pinhasi 1996, 1998; Pinhasi, Foley,and Lahr 2000) indicate that it is possible to performunivariate and multivariate operations on data from avariety of sources and obtain meaningful results (see alsoKeita 1990, 1992). The number of specimens discussedfrom the three regions totals 231.

p inhasi and pluciennik Spread of Farming in Europe F S61
Fig. 1. Geographical-archaeological regions.
The Construction of Groups
Experience indicates that the pooling of specimens toform meaningful groups has a significant effect on thestatistical results obtained. For this reason and others(see below) the chosen method of analysis was principalcomponents analysis (Tabachnick and Fidell 1996). Thismethod does not require any a priori criteria regardingthe allocation of specimens to groups, and consequentlythe grouping criteria have no effect on the performanceof the statistical analysis. In contrast, discriminant anal-ysis requires the a priori allocation of specimens to de-fined groups. Groups therefore contain either specimensfrom a single location and archaeological period or spec-imens from several sites within the same archaeologicalperiod. The pooling of these specimens is based on pre-vious analyses of Mahalanobis generalized distances aswell as on the analysis of means and post-hoc analysisof variance. A selection of cranial and mandibular mea-surements was used (table 2). In addition, an analysiswas performed on dental dimensions of specimens fromregion 1—the mesio-distal and bucco-lingual dimensionsof the lower left canine, the first and second premolars,and the first, second, and third molars.
Missing Data and Interpolation
Neolithic crania are rarely complete. In many areas soilconditions do not favour the preservation of bony ma-terial. Thus, good series from the Neolithic period arerare in regions including Israel, Bulgaria, and Greece,and, when present, only a few single specimens havemore or less complete crania. Differential preservationoccurs because of physical variation among bones: pa-rietal bones and frontal bones are usually preserved whileoccipital and cranial bases are often missing. Conse-quently, there is a systematic pattern of missing data. Inmost cases a specimen that is missing the cranial baseis also missing some of the occipital, and the palate isdisconnected. Thus high correlations exist between cer-tain missing sets of variables (table 3). Between 30% and40% of the specimens are missing facial dimensions andcranial height because of poor preservation.
There are several ways to treat the problem of missingdata. One is to choose a small subset for which the per-centage of missing data is small. Another method, com-monly used for multivariate procedures, is to discard allcases for which data for one or more cells are missing.This option, however, will usually result in too small a
S62 F current anthropology Volume 45, Supplement, August–October 2004
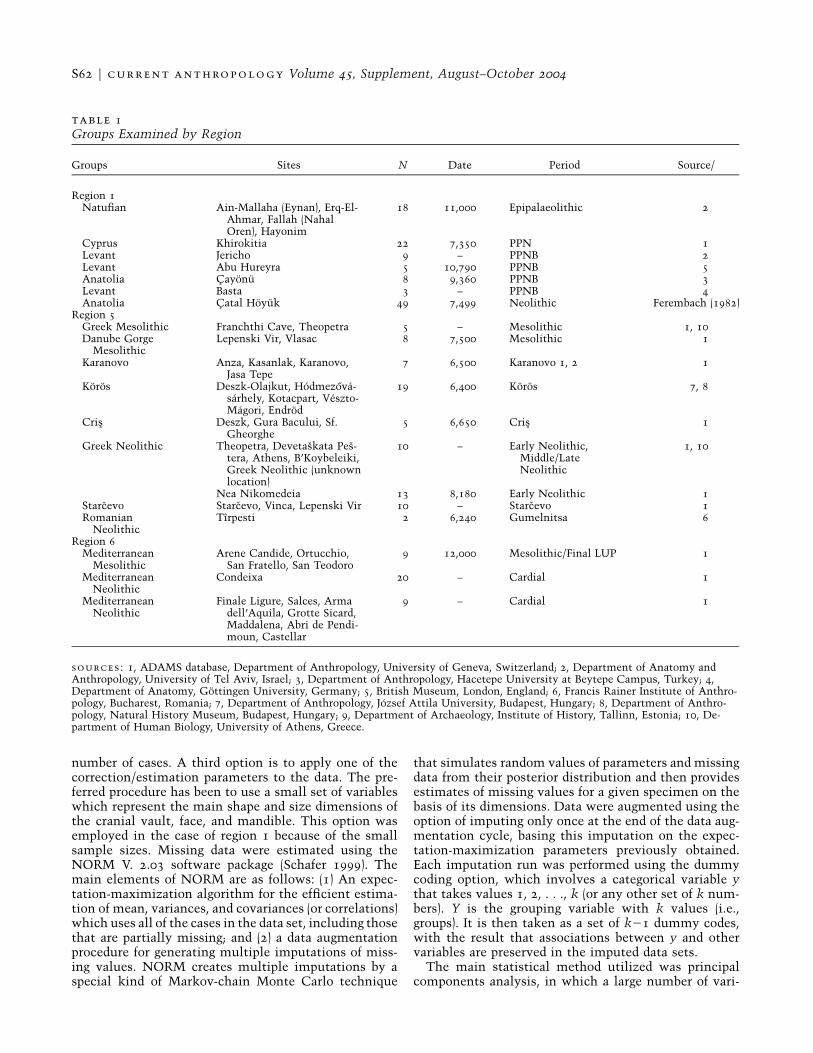
table 1Groups Examined by Region
Groups Sites N Date Period Source/
Region 1Natufian Ain-Mallaha (Eynan), Erq-El-
Ahmar, Fallah (NahalOren), Hayonim
18 11,000 Epipalaeolithic 2
Cyprus Khirokitia 22 7,350 PPN 1Levant Jericho 9 – PPNB 2Levant Abu Hureyra 5 10,790 PPNB 5Anatolia Cayonu 8 9,360 PPNB 3Levant Basta 3 – PPNB 4Anatolia Catal Hoyuk 49 7,499 Neolithic Ferembach (1982)
Region 5Greek Mesolithic Franchthi Cave, Theopetra 5 – Mesolithic 1, 10Danube Gorge
MesolithicLepenski Vir, Vlasac 8 7,500 Mesolithic 1
Karanovo Anza, Kasanlak, Karanovo,Jasa Tepe
7 6,500 Karanovo 1, 2 1
Koros Deszk-Olajkut, Hodmezova-sarhely, Kotacpart, Veszto-Magori, Endrod
19 6,400 Koros 7, 8
Cris Deszk, Gura Bacului, Sf.Gheorghe
5 6,650 Cris 1
Greek Neolithic Theopetra, Devetaskata Pes-tera, Athens, B’Koybeleiki,Greek Neolithic (unknownlocation)
10 – Early Neolithic,Middle/LateNeolithic
1, 10
Nea Nikomedeia 13 8,180 Early Neolithic 1Starcevo Starcevo, Vinca, Lepenski Vir 10 – Starcevo 1Romanian
NeolithicTırpesti 2 6,240 Gumelnitsa 6
Region 6Mediterranean
MesolithicArene Candide, Ortucchio,
San Fratello, San Teodoro9 12,000 Mesolithic/Final LUP 1
MediterraneanNeolithic
Condeixa 20 – Cardial 1
MediterraneanNeolithic
Finale Ligure, Salces, Armadell’Aquila, Grotte Sicard,Maddalena, Abri de Pendi-moun, Castellar
9 – Cardial 1
sources: 1, ADAMS database, Department of Anthropology, University of Geneva, Switzerland; 2, Department of Anatomy andAnthropology, University of Tel Aviv, Israel; 3, Department of Anthropology, Hacetepe University at Beytepe Campus, Turkey; 4,Department of Anatomy, Gottingen University, Germany; 5, British Museum, London, England; 6, Francis Rainer Institute of Anthro-pology, Bucharest, Romania; 7, Department of Anthropology, Jozsef Attila University, Budapest, Hungary; 8, Department of Anthro-pology, Natural History Museum, Budapest, Hungary; 9, Department of Archaeology, Institute of History, Tallinn, Estonia; 10, De-partment of Human Biology, University of Athens, Greece.
number of cases. A third option is to apply one of thecorrection/estimation parameters to the data. The pre-ferred procedure has been to use a small set of variableswhich represent the main shape and size dimensions ofthe cranial vault, face, and mandible. This option wasemployed in the case of region 1 because of the smallsample sizes. Missing data were estimated using theNORM V. 2.03 software package (Schafer 1999). Themain elements of NORM are as follows: (1) An expec-tation-maximization algorithm for the efficient estima-tion of mean, variances, and covariances (or correlations)which uses all of the cases in the data set, including thosethat are partially missing; and (2) a data augmentationprocedure for generating multiple imputations of miss-ing values. NORM creates multiple imputations by aspecial kind of Markov-chain Monte Carlo technique
that simulates random values of parameters and missingdata from their posterior distribution and then providesestimates of missing values for a given specimen on thebasis of its dimensions. Data were augmented using theoption of imputing only once at the end of the data aug-mentation cycle, basing this imputation on the expec-tation-maximization parameters previously obtained.Each imputation run was performed using the dummycoding option, which involves a categorical variable ythat takes values 1, 2, . . ., k (or any other set of k num-bers). Y is the grouping variable with k values (i.e.,groups). It is then taken as a set of k�1 dummy codes,with the result that associations between y and othervariables are preserved in the imputed data sets.
The main statistical method utilized was principalcomponents analysis, in which a large number of vari-
p inhasi and pluciennik Spread of Farming in Europe F S63
Fig. 2. Locations of specimens used in the mean data principal components analysis. 1, Jericho; 2, Abu Hur-eyra; 3, Basta; 4, Catal Hoyuk; 5, Cayonu; 6, Erq-El-Ahmar; 7, Ain Mallaha; 8, Nahal Oren; 9, Hayonim; 10,Deszk; 11, Jasa Tepe; 12, Vinca; 13, Karanovo; 14, Sf. Gheorghe; 15, Gura Bacului; 16, Cernavoda; 17, Kasanlak;18, Anza; 19, Sturovo; 20, Starcevo; 21, Vlasac; 22, Lepenski Vir; 23, Sofia; 24, Devetaskata Pestera; 25, Kotac-part; 26, Hodmezovasarhely; 27, Endrod; 28, Bekes-Povad; 29, Deszk-Olajkut; 30, Veszto-Magori; 31, Tırpesti;32, Khirokitia; 33, Franchthi; 34, Athens; 35, B’Koybeleiki; 36, Volos; 37, Theopetra; 38, Tharounia; 39, Hageor-gitika; 40, Nea Nikomedeia; 41, Abri de Pendimoun; 42, Castellar; 43, Finale Ligure; 44, Condeixa; 45, Madda-lena; 46, San Teodoro; 47, Ortucchio; 48, Arene Candide; 49, San Fratello; 50, Arma dell’Aquila; 51, GrotteSicard; 52, Salces; 53, Muge-Arruda; 54, Muge-Moita.
ables is reduced to a smaller number of factors. The mul-tivariate technique of the method is usually employedfor the purpose of data reduction and decorrelation of thevariables, but it can also be used as an tool for detectingunderlying patterns or structures. In the study of region5 discriminant analysis was also employed. The methodis designed for use when two or more samples exist frompotentially different populations and the researcherwishes to distinguish between them. It has two mainapplications. The first is interpretation of the ways inwhich the groups differ from each other—how well par-ticular characteristics discriminate and which charac-teristics are the most powerful (Klecka 1980). The secondis classification, which makes possible the prediction ofgroup membership. The equations (canonical functions)derived combine the group characteristics in a way thatallows identification of the groups which each case mostclosely resembles. The case under examination may beof either a known or an unknown group (Tabachnick andFidell 1996). Both these applications were utilized.
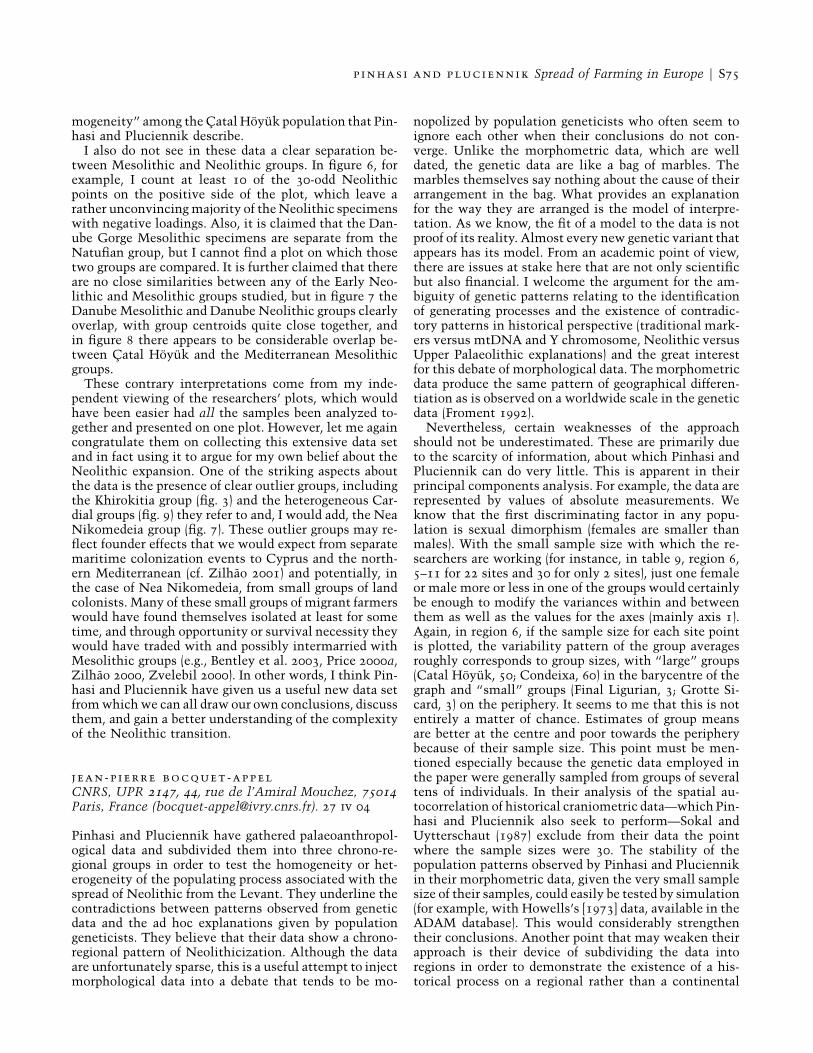
Region 1: Turkey and the Levant
The aims of the analysis were to assess the morpholog-ical affinities between specimens from the Pre-PotteryNeolithic B (PPNB) sites in the Levant and Anatolia(from the sites of Cayonu, Basta, Abu Hureyra, and Jer-icho) and to examine their similarity to specimens fromNatufian sites, from Catal Hoyuk, and from Khirokitia.Principal components analysis was performed on twoimputed data sets, one of cranial dimensions and theother of mandibles and lower dentition. The independentperformance of these analyses with different morpho-logical complexes allowed the cross-comparison of theresults and their interpretation in terms of actual mor-phological similarities and differences. In addition, thedata sets complemented each other, as the mandibularand dental set contained data for additional specimensfor which mandibles were available with no associatedcrania.
For the analysis of cranial dimensions from a set of
S64 F current anthropology Volume 45, Supplement, August–October 2004
table 2Variables Utilized in the Analyses
Measurement Howells (1973) Martin (1957)
CranialMaximum vault length GOL 1Vault height (basion-
bregma)BBH 17
Maximum frontalbreadth
XFB 10
Maximum vaultbreadth (at parietals)
XPB ˜8
Bizygomatic breadth ZYB 45Minimum frontal
breadthMFB 9
Upper facial height(nasion-prosthion)
NPH 48
Nasal length NLH 55Nasal breadth NLB 54Orbital height OBH 52
MandibularRamus height RAMH 70aRamus breadth RAMB 71aMaxillary length MAXL 68Bigonial breadth GONB 66Bicondylar breadth CONDB 65Anterior height ANTH 69
Dental (each tooth)Mesio-distal
dimension– –
Bucco-lingualdimension
– –
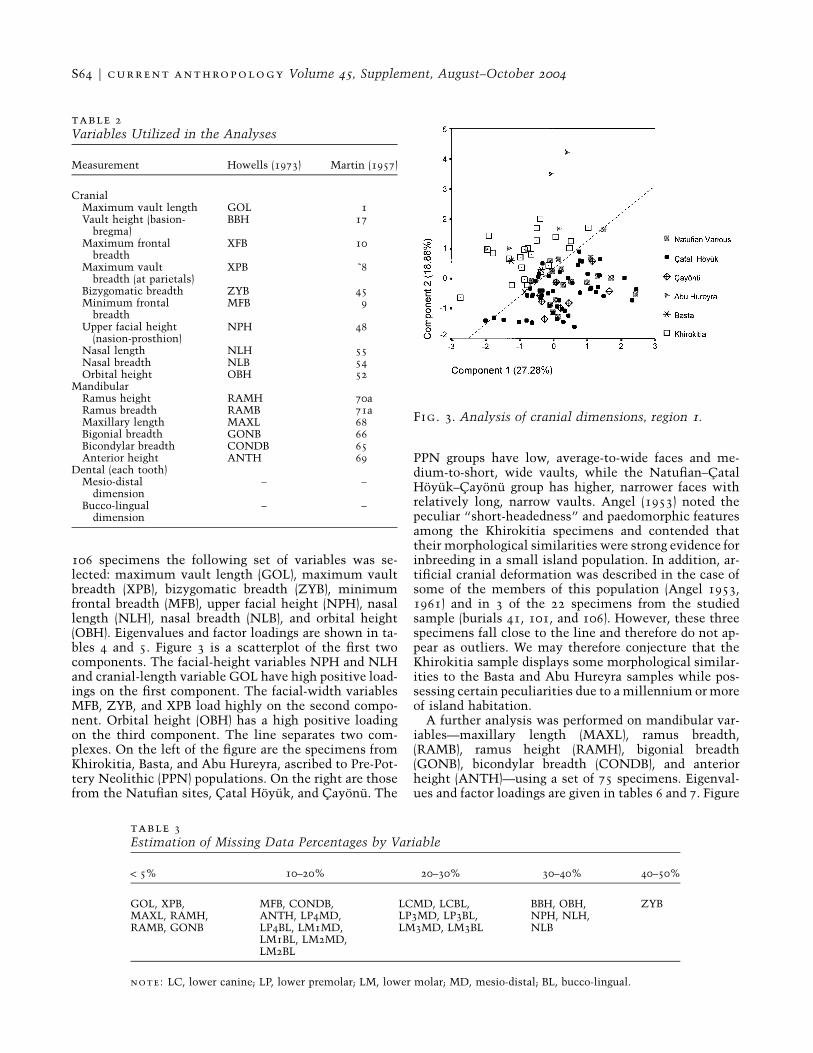
Fig. 3. Analysis of cranial dimensions, region 1.
table 3Estimation of Missing Data Percentages by Variable
! 5% 10–20% 20–30% 30–40% 40–50%
GOL, XPB,MAXL, RAMH,RAMB, GONB
MFB, CONDB,ANTH, LP4MD,LP4BL, LM1MD,LM1BL, LM2MD,LM2BL
LCMD, LCBL,LP3MD, LP3BL,LM3MD, LM3BL
BBH, OBH,NPH, NLH,NLB
ZYB
note: LC, lower canine; LP, lower premolar; LM, lower molar; MD, mesio-distal; BL, bucco-lingual.
106 specimens the following set of variables was se-lected: maximum vault length (GOL), maximum vaultbreadth (XPB), bizygomatic breadth (ZYB), minimumfrontal breadth (MFB), upper facial height (NPH), nasallength (NLH), nasal breadth (NLB), and orbital height(OBH). Eigenvalues and factor loadings are shown in ta-bles 4 and 5. Figure 3 is a scatterplot of the first twocomponents. The facial-height variables NPH and NLHand cranial-length variable GOL have high positive load-ings on the first component. The facial-width variablesMFB, ZYB, and XPB load highly on the second compo-nent. Orbital height (OBH) has a high positive loadingon the third component. The line separates two com-plexes. On the left of the figure are the specimens fromKhirokitia, Basta, and Abu Hureyra, ascribed to Pre-Pot-tery Neolithic (PPN) populations. On the right are thosefrom the Natufian sites, Catal Hoyuk, and Cayonu. The
PPN groups have low, average-to-wide faces and me-dium-to-short, wide vaults, while the Natufian–CatalHoyuk–Cayonu group has higher, narrower faces withrelatively long, narrow vaults. Angel (1953) noted thepeculiar “short-headedness” and paedomorphic featuresamong the Khirokitia specimens and contended thattheir morphological similarities were strong evidence forinbreeding in a small island population. In addition, ar-tificial cranial deformation was described in the case ofsome of the members of this population (Angel 1953,1961) and in 3 of the 22 specimens from the studiedsample (burials 41, 101, and 106). However, these threespecimens fall close to the line and therefore do not ap-pear as outliers. We may therefore conjecture that theKhirokitia sample displays some morphological similar-ities to the Basta and Abu Hureyra samples while pos-sessing certain peculiarities due to a millennium or moreof island habitation.
A further analysis was performed on mandibular var-iables—maxillary length (MAXL), ramus breadth,(RAMB), ramus height (RAMH), bigonial breadth(GONB), bicondylar breadth (CONDB), and anteriorheight (ANTH)—using a set of 75 specimens. Eigenval-ues and factor loadings are given in tables 6 and 7. Figure

p inhasi and pluciennik Spread of Farming in Europe F S65
table 4Eigenvalues for Cranial Dimensions, Region 1
Component Eigenvalue% TotalVariance
CumulativeEigenvalue Cumulative %
1 2.18 27.28 2.18 27.282 1.51 18.89 3.69 46.163 1.45 18.15 5.14 64.31
Fig. 4. Mandibular variables, region 1.
table 5Factor Loadings for Cranial Dimensions,Region 1
Factor 1 Factor 2 Factor 3
GOL 0.58 �0.22 �0.15XPB �0.07 0.60 �0.58ZYB 0.43 0.57 �0.49MFB �0.07 0.74 0.41NPH 0.85 �0.21 0.06NLH 0.84 0.07 0.29NLB 0.45 0.11 �0.23OBH 0.13 0.41 0.74
4 is a scatterplot of the first and second components. Theupper part of the scatterplot includes specimens fromAbu Hureyra, some of the Natufian sites, some of thespecimens from Cayonu, and some of the PPNB speci-mens from Neve Yam, Hatoula, and Abu Gosh in Israel.The remainder of the scatterplot includes the specimensfrom Basta, other PPNB specimens from Israel, some ofthe Natufians, and some of the specimens from Cayonu.Thus, the scatterplot shows poor discrimination betweenmost groups with the exception of a separation betweenBasta and Abu Hureyra. These results are in accord withthe results obtained from the cranial dimensions anal-ysis. All variables load high on the first component,which may therefore be interpreted as describing overallmandible size. Ramus breadth and height have high pos-itive loadings on the second component, while bigonialbreadth and condylar breadth load negative. Therefore,the second component describes two contrasting man-dible shapes—narrow with tall, broad rami and broadwith short, narrow rami.
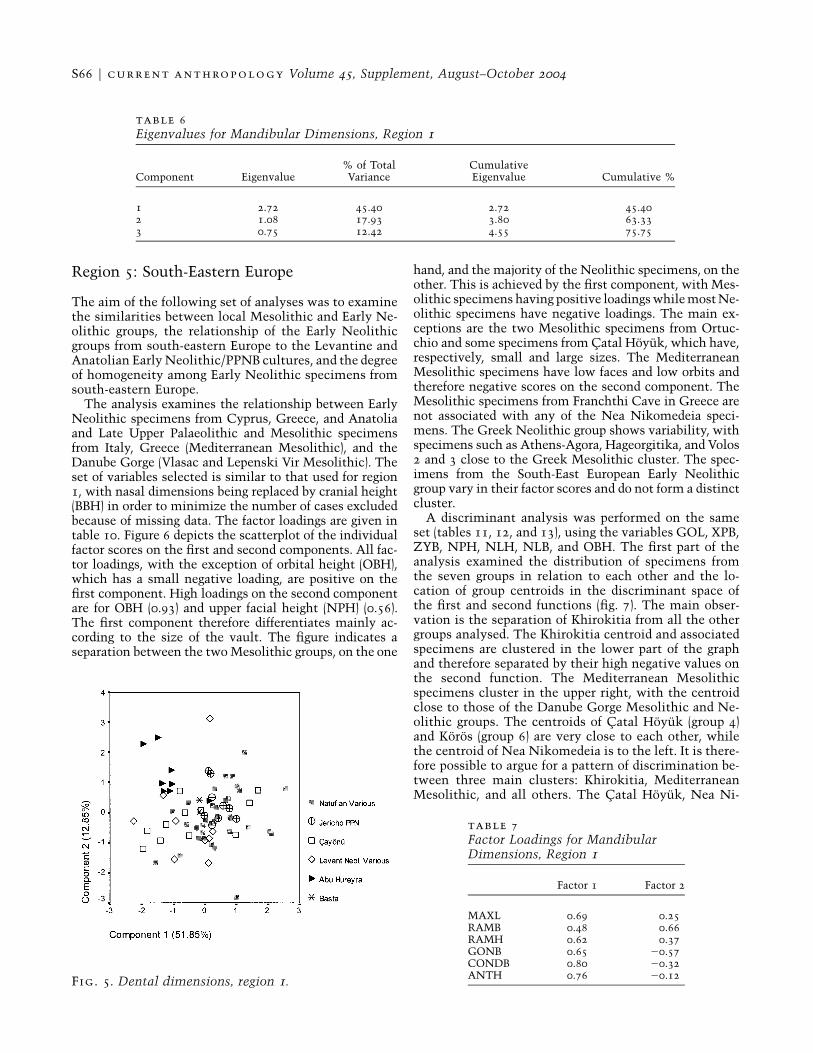
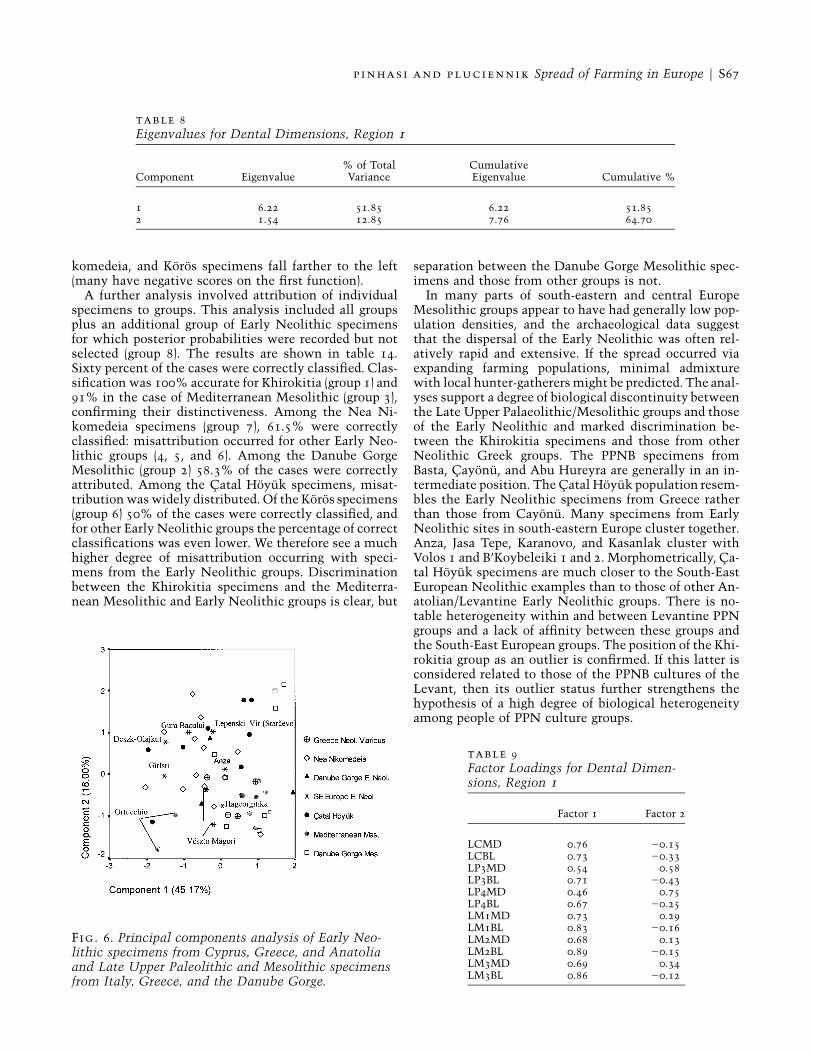
The third morphological complex examined consistedof the dental measurements of the lower arcade (exclud-ing incisors)—the mesio-distal and bucco-lingual dimen-sions of the lower canine (LC), lower premolars 3 and 4(LP3, LP4), and lower molars 1–3 (LM1–3). Principal com-ponents analysis was performed on the same set of 75specimens. Eigenvalues and factor loadings are shown in
tables 8 and 9. Figure 5 is a scatterplot of the first andsecond components. All variables load positive on thefirst component. In the case of the second component,however, it is the mesio-distal dimensions of the pre-molar and three molars which load positive while thebucco-lingual dimensions of the premolar and molarsand the dimensions of the canine load negative. Thespecimens from Abu Hureyra are scattered in the upperleft part of the scatterplot because of their negative factorloadings on the first component and high positive load-ings on the second. The specimens from Jericho form acluster in the centre right near the specimens from Bastaand within the larger clusters of the Natufian and Cay-onu groups. Most of the Natufian specimens show com-paratively large tooth sizes. These results imply that theAbu Hureyra specimens have large mesio-distal dimen-sions within a small dentition (negative scores on thefirst component).
In summary, analysis of cranial dimensions indicatesa morphological differentiation between the PPNB spec-imens from Basta, Abu Hureyra, and Khirokitia and thosefrom the Natufian sites, Catal Hoyuk, and Cayonu. Thesecond and third analyses further strengthen the differ-entiation of Abu Hureyra from the other PPNB groups,but in these analyses the specimens from Basta are clus-tered with all the other groups. In all three analyses therange of morphological variability of the Natufian spec-imens overlaps with those of the specimens from Cay-onu, Catal Hoyuk, and Jericho PPN. We may thereforeconclude that a considerable amount of intra- and in-tergroup morphological variability exists among thePPNB groups. In terms of morphology, the Natufiangroup is not associated with that of Basta, Abu Hureyra,and Khirokitia.
S66 F current anthropology Volume 45, Supplement, August–October 2004
table 6Eigenvalues for Mandibular Dimensions, Region 1
Component Eigenvalue% of TotalVariance
CumulativeEigenvalue Cumulative %
1 2.72 45.40 2.72 45.402 1.08 17.93 3.80 63.333 0.75 12.42 4.55 75.75
Fig. 5. Dental dimensions, region 1.
table 7Factor Loadings for MandibularDimensions, Region 1
Factor 1 Factor 2
MAXL 0.69 0.25RAMB 0.48 0.66RAMH 0.62 0.37GONB 0.65 �0.57CONDB 0.80 �0.32ANTH 0.76 �0.12
Region 5: South-Eastern Europe
The aim of the following set of analyses was to examinethe similarities between local Mesolithic and Early Ne-olithic groups, the relationship of the Early Neolithicgroups from south-eastern Europe to the Levantine andAnatolian Early Neolithic/PPNB cultures, and the degreeof homogeneity among Early Neolithic specimens fromsouth-eastern Europe.
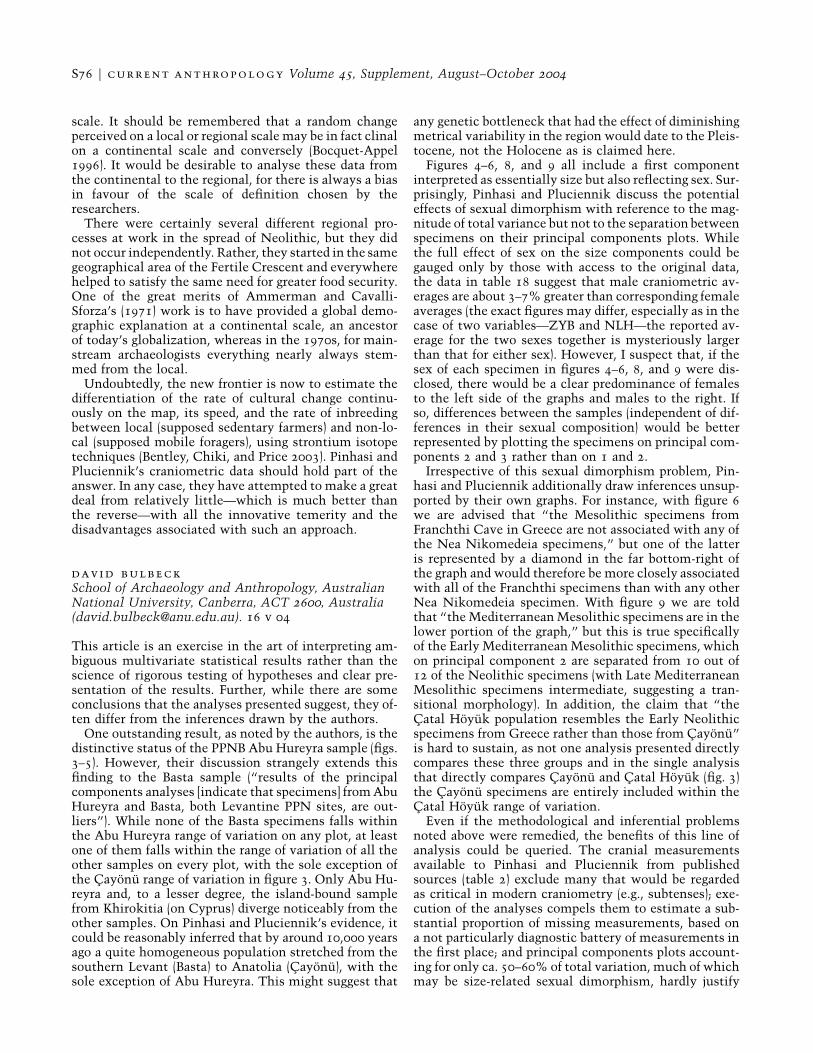
The analysis examines the relationship between EarlyNeolithic specimens from Cyprus, Greece, and Anatoliaand Late Upper Palaeolithic and Mesolithic specimensfrom Italy, Greece (Mediterranean Mesolithic), and theDanube Gorge (Vlasac and Lepenski Vir Mesolithic). Theset of variables selected is similar to that used for region1, with nasal dimensions being replaced by cranial height(BBH) in order to minimize the number of cases excludedbecause of missing data. The factor loadings are given intable 10. Figure 6 depicts the scatterplot of the individualfactor scores on the first and second components. All fac-tor loadings, with the exception of orbital height (OBH),which has a small negative loading, are positive on thefirst component. High loadings on the second componentare for OBH (0.93) and upper facial height (NPH) (0.56).The first component therefore differentiates mainly ac-cording to the size of the vault. The figure indicates aseparation between the two Mesolithic groups, on the one
hand, and the majority of the Neolithic specimens, on theother. This is achieved by the first component, with Mes-olithic specimens having positive loadings while most Ne-olithic specimens have negative loadings. The main ex-ceptions are the two Mesolithic specimens from Ortuc-chio and some specimens from Catal Hoyuk, which have,respectively, small and large sizes. The MediterraneanMesolithic specimens have low faces and low orbits andtherefore negative scores on the second component. TheMesolithic specimens from Franchthi Cave in Greece arenot associated with any of the Nea Nikomedeia speci-mens. The Greek Neolithic group shows variability, withspecimens such as Athens-Agora, Hageorgitika, and Volos2 and 3 close to the Greek Mesolithic cluster. The spec-imens from the South-East European Early Neolithicgroup vary in their factor scores and do not form a distinctcluster.
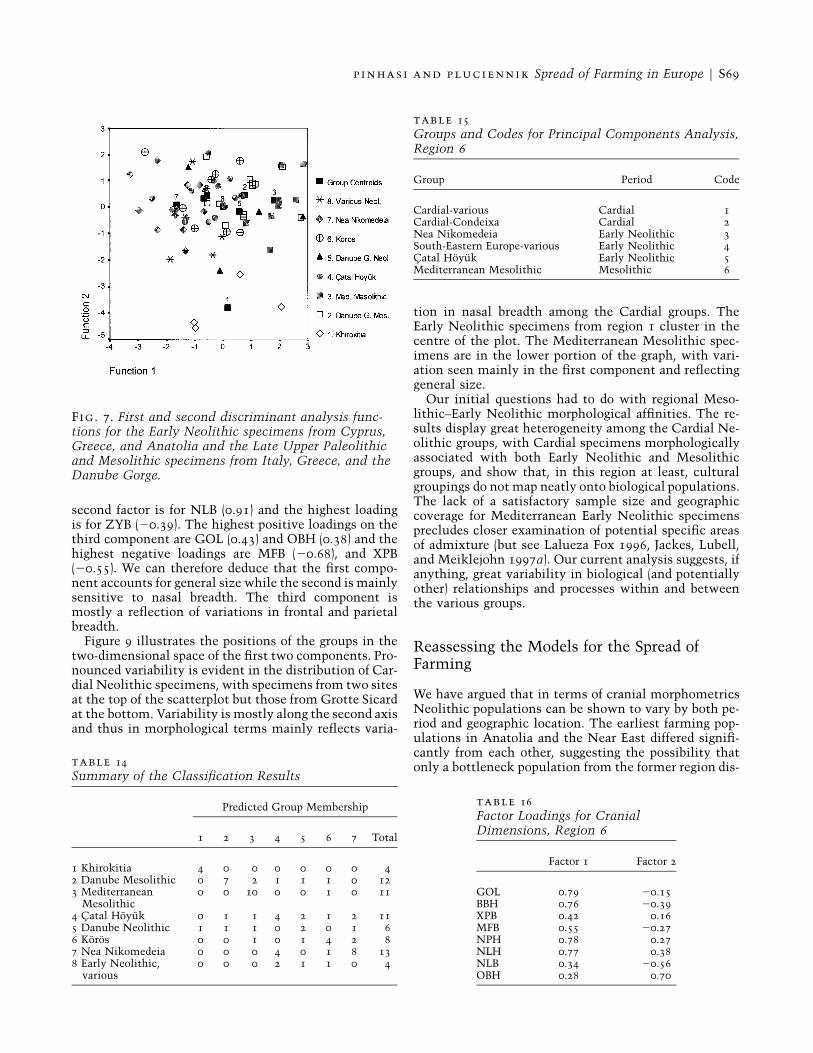
A discriminant analysis was performed on the sameset (tables 11, 12, and 13), using the variables GOL, XPB,ZYB, NPH, NLH, NLB, and OBH. The first part of theanalysis examined the distribution of specimens fromthe seven groups in relation to each other and the lo-cation of group centroids in the discriminant space ofthe first and second functions (fig. 7). The main obser-vation is the separation of Khirokitia from all the othergroups analysed. The Khirokitia centroid and associatedspecimens are clustered in the lower part of the graphand therefore separated by their high negative values onthe second function. The Mediterranean Mesolithicspecimens cluster in the upper right, with the centroidclose to those of the Danube Gorge Mesolithic and Ne-olithic groups. The centroids of Catal Hoyuk (group 4)and Koros (group 6) are very close to each other, whilethe centroid of Nea Nikomedeia is to the left. It is there-fore possible to argue for a pattern of discrimination be-tween three main clusters: Khirokitia, MediterraneanMesolithic, and all others. The Catal Hoyuk, Nea Ni-
p inhasi and pluciennik Spread of Farming in Europe F S67
table 8Eigenvalues for Dental Dimensions, Region 1
Component Eigenvalue% of TotalVariance
CumulativeEigenvalue Cumulative %
1 6.22 51.85 6.22 51.852 1.54 12.85 7.76 64.70
Fig. 6. Principal components analysis of Early Neo-lithic specimens from Cyprus, Greece, and Anatoliaand Late Upper Paleolithic and Mesolithic specimensfrom Italy, Greece, and the Danube Gorge.
table 9Factor Loadings for Dental Dimen-sions, Region 1
Factor 1 Factor 2
LCMD 0.76 �0.15LCBL 0.73 �0.33LP3MD 0.54 0.58LP3BL 0.71 �0.43LP4MD 0.46 0.75LP4BL 0.67 �0.25LM1MD 0.73 0.29LM1BL 0.83 �0.16LM2MD 0.68 0.13LM2BL 0.89 �0.15LM3MD 0.69 0.34LM3BL 0.86 �0.12
komedeia, and Koros specimens fall farther to the left(many have negative scores on the first function).
A further analysis involved attribution of individualspecimens to groups. This analysis included all groupsplus an additional group of Early Neolithic specimensfor which posterior probabilities were recorded but notselected (group 8). The results are shown in table 14.Sixty percent of the cases were correctly classified. Clas-sification was 100% accurate for Khirokitia (group 1) and91% in the case of Mediterranean Mesolithic (group 3),confirming their distinctiveness. Among the Nea Ni-komedeia specimens (group 7), 61.5% were correctlyclassified: misattribution occurred for other Early Neo-lithic groups (4, 5, and 6). Among the Danube GorgeMesolithic (group 2) 58.3% of the cases were correctlyattributed. Among the Catal Hoyuk specimens, misat-tribution was widely distributed. Of the Koros specimens(group 6) 50% of the cases were correctly classified, andfor other Early Neolithic groups the percentage of correctclassifications was even lower. We therefore see a muchhigher degree of misattribution occurring with speci-mens from the Early Neolithic groups. Discriminationbetween the Khirokitia specimens and the Mediterra-nean Mesolithic and Early Neolithic groups is clear, but
separation between the Danube Gorge Mesolithic spec-imens and those from other groups is not.
In many parts of south-eastern and central EuropeMesolithic groups appear to have had generally low pop-ulation densities, and the archaeological data suggestthat the dispersal of the Early Neolithic was often rel-atively rapid and extensive. If the spread occurred viaexpanding farming populations, minimal admixturewith local hunter-gatherers might be predicted. The anal-yses support a degree of biological discontinuity betweenthe Late Upper Palaeolithic/Mesolithic groups and thoseof the Early Neolithic and marked discrimination be-tween the Khirokitia specimens and those from otherNeolithic Greek groups. The PPNB specimens fromBasta, Cayonu, and Abu Hureyra are generally in an in-termediate position. The Catal Hoyuk population resem-bles the Early Neolithic specimens from Greece ratherthan those from Cayonu. Many specimens from EarlyNeolithic sites in south-eastern Europe cluster together.Anza, Jasa Tepe, Karanovo, and Kasanlak cluster withVolos 1 and B’Koybeleiki 1 and 2. Morphometrically, Ca-tal Hoyuk specimens are much closer to the South-EastEuropean Neolithic examples than to those of other An-atolian/Levantine Early Neolithic groups. There is no-table heterogeneity within and between Levantine PPNgroups and a lack of affinity between these groups andthe South-East European groups. The position of the Khi-rokitia group as an outlier is confirmed. If this latter isconsidered related to those of the PPNB cultures of theLevant, then its outlier status further strengthens thehypothesis of a high degree of biological heterogeneityamong people of PPN culture groups.

S68 F current anthropology Volume 45, Supplement, August–October 2004
table 10Factor Loadings for CranialDimensions, Region 5
Factor 1 Factor 2
GOL 0.78 0.02BBH 0.78 �0.05XPB 0.63 0.11NPH 0.66 0.56OBH �0.18 0.93ZYB 0.83 �0.25MFB 0.63 �0.07
table 12Wilks’s Lambda
Test of Function(s) Wilks’s Lambda Chi-square df p
1 through 6 0.12 119.80 42 .0002 through 6 0.31 66.87 30 .000
table 11Site Names, Codes, and Sample Sizes forDiscriminant Analysis
Site Code N
Khirokitia 1 4Vlasac Mesolithic 2 12Franchthi Cave 3 2Ortucchio 3 2San Fratello 3 3San Teodoro 3 2Kilada 3 1Theopetra 3 1Catal Hoyuk 4 11Lepenski Vir Neolithic 5 3Vlasac Neolithic 5 3Veszto-Magori 6 6Deszk-Olajkut 6 2Nea Nikomedeia 7 13Tırpestia 8 1Cascioarelea 8 1Gırlstia 8 2Kasanlaka 8 1Gura Baculuia 8 1
aIncluded only in the classification analysis.
table 13Structure Matrix
Function Function 2
ZYB 0.68a �0.01GOL 0.43 0.59a
NPH 0.06 0.29NLH 0.37 0.05XPB 0.14 �0.39NLB �0.17 0.18OBH �0.18 0.07
aLargest absolute correlation between eachvariable and any discriminant function.
Region 6: Mediterranean France, Italy, andGreece
Archaeological evidence suggests that the Mesolithic/Neolithic transition in the western Mediterranean re-gion was a complex and diverse process. Part of this com-plexity is due to this region’s large size and physical andecological diversity. There is therefore no reason to as-sume that a single model will cover processes involvingnorthern Italy, the Iberian Peninsula, and islands suchas Sardinia and Corsica. Many have argued for a delayedand selective spread of Neolithic traits in most of thewestern Mediterranean (e.g., Lewthwaite 1986a, b; butsee also Zilhao 1993). The majority of secure dates arefrom the early part of the seventh millennium BP (Plu-ciennik 1997; Zilhao 2000, 2001), implying a gap of atleast 1,000 years between the Early Neolithic in the Bal-kans and northern Greece and that in the westernMediterranean.
Seventy-two specimens from six groups were analysed(tables 15 and 16). The Cardial Neolithic is represented
by two groups, one containing specimens from varioussites (group 1) and the second coming from Condeixa inPortugal (group 2). Nea Nikomedeia, of secure Early Ne-olithic occupation, constitutes group 3. The South-EastEuropean group (group 4) contains various specimensfrom Early Neolithic sites of the Cris, Anza, and Kara-novo cultures of the Balkans and southern Hungary. Ca-tal Hoyuk specimens make up group 5. The Mediterra-nean Mesolithic (group 6) includes specimens fromFranchthi Cave, Arene Candide, Ortucchio, San Fratello,San Teodoro, and several other final Late Upper Palaeo-lithic and Mesolithic sites.
The first analysis was performed on 72 specimens fromthe above set using the following variables: GOL, XPB,MFB, BBH, NPH, NLB, NLH, and OBH. No separationwas achieved between the Mesolithic and Neolithicgroups (fig. 8), suggesting marked heterogeneity.
Subsequently 22 groups were selected so that each rep-resented a single site (table 17) and a further analysis wasperformed on mean data. The variable set included GOL,XPB, MFB, ZYB, NPH, NLH, NLB, and OBH. The effectsof sample size and sexual dimorphism on mean valueswere evaluated by performing additional analyses on in-dividual females and individual males from the samedata set (tables 18 and 19). As expected, there are somedifferences in averages between means, individual fe-males, and individual males. However, the standard de-viations of the mean values are either similar to orsmaller than the standard deviations of the values formales and females, indicating that the effects of aver-aging and pooling the samples in the formation of meansdid not inflate the variance. In fact, eigenvalues and cu-mulative variance by factor are almost identical in mag-nitude to those obtained in the above factor analysis.With the exception of NLB, all the variables load highlyon the first factor. The highest positive loading on the
p inhasi and pluciennik Spread of Farming in Europe F S69
Fig. 7. First and second discriminant analysis func-tions for the Early Neolithic specimens from Cyprus,Greece, and Anatolia and the Late Upper Paleolithicand Mesolithic specimens from Italy, Greece, and theDanube Gorge.
table 15Groups and Codes for Principal Components Analysis,Region 6
Group Period Code
Cardial-various Cardial 1Cardial-Condeixa Cardial 2Nea Nikomedeia Early Neolithic 3South-Eastern Europe-various Early Neolithic 4Catal Hoyuk Early Neolithic 5Mediterranean Mesolithic Mesolithic 6
table 14Summary of the Classification Results
Predicted Group Membership
1 2 3 4 5 6 7 Total
1 Khirokitia 4 0 0 0 0 0 0 42 Danube Mesolithic 0 7 2 1 1 1 0 123 Mediterranean
Mesolithic0 0 10 0 0 1 0 11
4 Catal Hoyuk 0 1 1 4 2 1 2 115 Danube Neolithic 1 1 1 0 2 0 1 66 Koros 0 0 1 0 1 4 2 87 Nea Nikomedeia 0 0 0 4 0 1 8 138 Early Neolithic,
various0 0 0 2 1 1 0 4
table 16Factor Loadings for CranialDimensions, Region 6
Factor 1 Factor 2
GOL 0.79 �0.15BBH 0.76 �0.39XPB 0.42 0.16MFB 0.55 �0.27NPH 0.78 0.27NLH 0.77 0.38NLB 0.34 �0.56OBH 0.28 0.70
second factor is for NLB (0.91) and the highest loadingis for ZYB (�0.39). The highest positive loadings on thethird component are GOL (0.43) and OBH (0.38) and thehighest negative loadings are MFB (�0.68), and XPB(�0.55). We can therefore deduce that the first compo-nent accounts for general size while the second is mainlysensitive to nasal breadth. The third component ismostly a reflection of variations in frontal and parietalbreadth.
Figure 9 illustrates the positions of the groups in thetwo-dimensional space of the first two components. Pro-nounced variability is evident in the distribution of Car-dial Neolithic specimens, with specimens from two sitesat the top of the scatterplot but those from Grotte Sicardat the bottom. Variability is mostly along the second axisand thus in morphological terms mainly reflects varia-
tion in nasal breadth among the Cardial groups. TheEarly Neolithic specimens from region 1 cluster in thecentre of the plot. The Mediterranean Mesolithic spec-imens are in the lower portion of the graph, with vari-ation seen mainly in the first component and reflectinggeneral size.
Our initial questions had to do with regional Meso-lithic–Early Neolithic morphological affinities. The re-sults display great heterogeneity among the Cardial Ne-olithic groups, with Cardial specimens morphologicallyassociated with both Early Neolithic and Mesolithicgroups, and show that, in this region at least, culturalgroupings do not map neatly onto biological populations.The lack of a satisfactory sample size and geographiccoverage for Mediterranean Early Neolithic specimensprecludes closer examination of potential specific areasof admixture (but see Lalueza Fox 1996, Jackes, Lubell,and Meiklejohn 1997a). Our current analysis suggests, ifanything, great variability in biological (and potentiallyother) relationships and processes within and betweenthe various groups.
Reassessing the Models for the Spread ofFarming
We have argued that in terms of cranial morphometricsNeolithic populations can be shown to vary by both pe-riod and geographic location. The earliest farming pop-ulations in Anatolia and the Near East differed signifi-cantly from each other, suggesting the possibility thatonly a bottleneck population from the former region dis-

S70 F current anthropology Volume 45, Supplement, August–October 2004
Fig. 8. First two components of the first principalcomponents analysis of cranial morphometrics fromregion 6.
Fig. 9. First two components of principal componentsanalysis on mean data of cranial morphometrics fromregion 6. Each point represents a single site.
table 17Groups Analysed in Mean Data Analysis, Regions 1–6
Location Na Date (bp) Latitude (N)b Longitude (E)b Period Code
Arma dell’Aquila II 3 – 42.37 13.37 Cardial 1Condeixa 60 – 40.06 �8.30 Cardial 1Finale Ligure 3 – 44.12 8.18 Cardial 1Grotte Sicard 3 – 43.24 5.12 Cardial 1Arene Candide 3 – 38.33 16.12 Early Mesolithic 2Franchthi Cave 3 – 39.00 22.30 Early Mesolithic 2Ortucchio 3 12,500 41.54 13.42 Early Mesolithic 2San Fratello 4 12,003 38.00 14.36 Early Mesolithic 2San Teodoro 4 – 42.00 13.30 Early Mesolithic 2Nea Nikomedeia 11 8,180 40.65 22.30 Early Neolithic 3Veszto-Magori 7 6,200 46.94 20.23 Koros 3Tırpesti 4 6,240 47.17 26.33 Pre-Cucuteni 3Lepenski Vir Mesolithic 15 7,313 44.33 22.03 Late Mesolithic 4Muge–Arruda 10 – 39.06 8.42 Late Mesolithic 4Muge–Moita 14 – 38.37 8.58 Late Mesolithic 4Catal Hoyuk 50 7,499 37.10 32.13 Early Neolithic 5Cayonu 9 9,360 38.23 39.65 PPN 5Khirokitia 21 7,368 34.54 33.00 PPN 5Anza 3 – 41.39 21.58 Starcevo 6Lepenski Vir Early Neolithic 23 – 44.33 22.03 Starcevo 6Sturovo 5 – 47.47 18.42 Starcevo 6Vinca Neolithic 9 – 44.48 20.36 Starcevo 6
aSample sizes are given prior to the casewise exclusion due to missing values.bAll entries are in decimal notation. All latitude values are positive (Northern Hemisphere). Positive longitude is in the north-eastquadrant and negative longitude is in the north-west quadrant.
persed into Europe. There is a lack of secure archaeo-logical evidence for direct local cultural continuity be-tween the Mesolithic and Neolithic at many of the sitesconsidered. The results of the principal componentsanalysis may partly support this discontinuity hypoth-esis in biological terms. Specimens from Levantine Jer-icho (PPNB), Basta (PPNB), Abu Hureyra (PPNB), Cypriot
Khirokitia (“pre-pottery”), and Cayonu (PPNA) demon-strate a fair degree of morphological heterogeneitywithin and between the region 1 groups. This patternamong the Early Levantine and Anatolian populationscontrasts with the apparent homogeneity of Early Neo-lithic groups from south-eastern Europe and Catal Ho-yuk (Pinhasi 2003). This is supported by the univariate
p inhasi and pluciennik Spread of Farming in Europe F S71
table 19Factor Loadings of Mean Data Analysis
Component
1 2 3
GOL 0.60 0.24 0.43XPB 0.71 0.15 �0.55ZYB 0.75 �0.39 �0.14MFB 0.50 0.40 �0.68NPH 0.73 �0.21 0.22NLH 0.84 �0.20 0.27NLB �0.01 0.91 0.19OBH 0.53 0.32 0.38
table 18Means and Standard Deviations for Mean Data and Individual Data by Sex
Mean Standard Deviation
Mean (N p 20) Females (N p 39) Males (N p 49) Mean Females Males
GOL 185.51 176.81 186.93 6.62 5.61 6.87XPB 138.69 135.53 139.36 3.91 4.78 6.13ZYB 130.17 121.31 129.73 8.11 6.35 8.50MFB 95.20 93.14 97.03 3.12 4.36 3.99NPH 66.18 64.47 67.37 3.08 3.96 3.90NLH 49.45 46.77 49.39 2.19 3.00 3.48NLB 24.58 23.61 24.82 1.22 1.91 1.95OBH 31.53 31.03 31.78 1.34 2.07 1.87
and Mahalanobis-distance analyses (not included here),is unlikely to have been affected by small sample sizes,and would appear to support a version of the wave-of-advance model. However, these statistics contrast withthe strictly archaeological evidence, which indicates dif-ferent modes of Early Neolithic settlement and Neolithicexpansion occurring in Crete, Cyprus, the Aegean, anddifferent regions of Greece, European Turkey, and else-where in south-eastern Europe, for example (Broodbankand Strasser 1991; Chapman 1994; Halstead 1996; Price2000b:7–9; Tringham 2000). This suggests that differentprocesses (demographic, biological, and cultural) shouldnot be assumed to be in a constant relationship. A closerexamination of the analyses also cautions against ac-cepting the wave-of-advance model wholesale. Thismodel explains observed south-east-to-north-west ge-netic and chronological clines in terms of increasingmixing between initially differentiated local Mesolithicand incoming farming populations. One would expect todetect a similar clinal pattern from the craniometricdata, but the analyses show a lack of morphological dif-ferentiation related to geographic distance. Biological ad-mixture is easier to argue for in the case of the westernMediterranean and less so in the case of Anatolia andsouth-eastern Europe, but with significant exceptions.
A model largely driven by demographic expansion pre-dicts farmers’ becoming increasingly morphologicallydifferentiated from the original stock population throughtime. This assumption is based on straightforward mod-els of stochastic change due to drift and a series of foun-der effects (see Wright 1951, 1969; Konigsberg 1990a, b;Relethford 1991, 1996; Barbujani, Sokal, and Oden 1995).Sokal, Oden, and Wilson (1991) have pointed out thatpersistent demic diffusion originating from a singlesource population and repeated migrations by culturallydifferent groups along established corridors will leavesimilar indistinguishable marks on gene-frequency sur-faces. Thus Cavalli-Sforza, Menozzi, and Piazza’s (1994)claim that the synthetic map of the first component in-dicates a south-east-to-north-west genetic cline acrossEurope as the outcome of demic diffusion is tenuous.
Results from this study do, however, support the hy-pothesis of a genetic bottleneck from a local centre oforigin somewhere in the central Anatolian Plateau, sug-
gested by the similarities between Catal Hoyuk andEarly Neolithic mainland Greek and South-East Euro-pean groups. Thus, even under the model of a predom-inantly demic diffusion, these results stress the need todifferentiate between the various sites and their asso-ciated populations in the presumed centre of origin. Theappearance of Neolithic levels in sites such as Khirokitiain Cyprus and Knossos level X in Crete may representthe spread of people from a Levantine pre-pottery culturewhich began about 10,000 uncal BP and reached Cyprus,Crete, and perhaps mainland Greece between 8,500 and7,500 uncal BP. This is the argument made by Perles(2001), who differentiates between “Initial Neolithic”and “Early Neolithic” phases in Greece. The former con-sist of the “pre-pottery” layers of sites such as Argissa,Sesklo, Soufli Magoula, and Franchthi Cave in mainlandGreece and Knossos on Crete. Perles argues that the lackof overlap between the C14 distributions for these periodsimplies the existence of two distinct occupation phases,dating to around 7,900 uncal BP for the Initial Neolithicand about 7,650 uncal BP for the Early Neolithic. Sheargues that the initial phase relates to sites which sharemany similarities with the “pre-pottery” sites of Ana-tolia and the Levant. However, Kotsakis (2002) has crit-icized approaches like this one that ultimately dependupon transhistorical concepts of singular cultural iden-tities for both indigenous foragers and colonizingfarmers.

S72 F current anthropology Volume 45, Supplement, August–October 2004
Ammerman and Cavalli-Sforza have also been criti-cized for disregarding the effects of geography (van Andeland Runnels 1995, Barbujani 2000). The physical factorsmay include the Aegean, Adriatic, and Tyrrhenian Seasand the Alps. If one adds a presumed preference for fertilesoils, river valleys, and water sources, then the paths bywhich early farmers dispersed will look much less likeradial logistic dispersion from an original centre. More-over, such ecological preferences and geographic bound-aries cannot simply be taken into account by modifyingexisting formulas for dispersion rates but require quali-tative anthropological approaches. Van Andel and Run-nels (1995) have therefore suggested a two-phase colo-nization model. They contend that, though sea travelwas clearly possible, the Aegean Sea may initially beregarded as a barrier, creating a bottleneck that limitedthe number of migrants. At the initial stage, colonistsperhaps from the Levant arrived early and almost si-multaneously on Crete, at Franchthi, and in Thessalybut probably only in small numbers. In the second step,migrating farmers, possibly from central Anatolia,reached the northern part of Greece as well as Macedoniaand Thrace. Van Andel and Runnels assert that thelengths of the steps and the intervals between them weredictated by geography and by population growth in eachof a slowly increasing number of parent areas (but seeZvelebil 2000:74). While there are problems with someof the earliest Neolithic occupation C14 dates in Greece,the current findings could be argued partly to supportthis view. The first dispersion event by sea route waspart of the expansion of a late “pre-pottery” culturewhich prevailed in Anatolia and the Levant and reachedCrete, Cyprus, and the southern Peloponnese fromaround 8,500 uncal BP. The second dispersion event orig-inated from central Anatolia approximately a millen-nium later, and Anatolian migrants appeared in Thessalyand rapidly spread across south-eastern and centralEurope.
Assessing the Results in the Context ofGenetic Studies
There is no consensus among geneticists regarding theorigin of the first Europeans and what one may infer fromthe geographic distribution of various genetic markers(Brown and Pluciennik 2001). There is an apparent dis-crepancy between the results of mtDNA (Richards et al.1996, 2000; Wilkinson-Herbots et al. 1996) and Y-chro-mosome (Semino et al. 2000) studies, which suggest aPalaeolithic ancestry for modern European populations,and the findings from studies of nuclear DNA (Chikhiet al. 1998a, b, 2002) and classical markers (Menozzi,Piazza, and Cavalli-Sforza 1978, Cavalli-Sforza, Menozzi,and Piazza 1993), which suggest population replacementby incoming Near Eastern farmers during the Neolithic.The main point of contention is that a clinal distributionis apparent only in the study of the classical markers,which are mainly immunological (from HLA loci) and
therefore more likely to be affected by selective factors(Fix 1999). This incompatibility can be explained if oneaccepts that the gene pool of all modern European pop-ulations is a regionally varied mixture of different per-centages of “Palaeolithic” and “Neolithic” ancestralcontributions. This supposition is supported by evidencefrom mtDNA (Richards et al. 1996, 1998, 2000) and Y-chromosome studies (Semino et al. 1996, 2000). Inter-estingly, many geneticists would now agree that the “ex-ternal” component—of whatever ultimate derivation—now accounts for a minority of the patterning, perhaps10–20%, and that this may well represent the proportionof genetic and perhaps numerical demographic contri-bution which can be ascribed to incoming farminggroups (Sykes 1999; Price 2000a:305; but see Chikhi etal. 1998b, 2002; Richards et al. 2000).
Many geneticists have been little concerned with thecomplexity of historical processes and the implicationsfor the interpretation of observed genetic patterns, show-ing a marked tendency to equate and conflate culturaland biological populations (see Pluciennik 1996; Mc-Eachern 2000; Zvelebil 2000:72–73). Perhaps this ispartly a function of a mismatch between the chronolog-ical and geographical resolution needed to interpret re-gionally variable sociocultural processes and that avail-able through modern genetic data. A major problem isthat regional variations in selective pressures, foundereffects, and biological interactions between “hunter” and“farmer” groups could nevertheless result in a similaroverall clinal pattern. Other processes such as “isolation-by-distance” migratory events without admixture andgradual dispersion with admixture can result in similargeographic distributions of gene frequencies (Barbujani,Sokal, and Oden 1995; Barbujani and Bertorelle 2001; Fix1999; Sokal 1991; Zvelebil 2000:69–73). The associationof modern gene-frequency distributions with historicalevents of expansion and migration is ambiguous andproblematic. As Barbujani and Bertorelle (2001:22) pointout, “A cline or gradient, for example, may reflect ad-aptation to variable environments, or a population ex-pansion at one moment in time, or continuous gene flowbetween groups that initially differed in allele frequen-cies.” Simulation studies carried out by Fix (1996, 1997;see also 1999) indicate that weak temporal selection canreplicate the clinal pattern of gene frequencies observedby Cavalli-Sforza and his team. Thus, at present none ofthe genetic analyses can detect more constrained andparticularistic mobility and admixture patterns. Thesepatterns can be revealed only by the incorporation ofnon-genetic information.
Barbujani and Bertorelle (2001:23) assert that the di-chotomy between Palaeolithic and Neolithic ancestryfor European populations may be in fact artificial, sincethe direction of both Palaeolithic and Neolithic clinesexcludes any Mesolithic process of indigenous accultur-ation:
To understand for good whether the European genepool derives from Palaeolithic or Neolithic ances-tors, one should type individuals who lived, respec-
p inhasi and pluciennik Spread of Farming in Europe F S73
tively, in Europe and in the Near East, say 15,000years ago. Should these groups prove genetically dif-ferent, one could infer a Palaeolithic origin of themodern gene pool from a closer similarity betweenmodern and ancient European, and a Neolithic ori-gin from a closer similarity between modern Europe-ans and the ancient inhabitants of the Near East.
Analysis of morphological variability in the Near Eastand Europe (here and in Pinhasi 2003) suggests that theEpipalaeolithic populations from the Natufian Levantwere noticeably different to the Mesolithic populationsdescribed from the Danube Gorge, the western Medi-terranean, and central Europe. No close similaritieswere observed between Early Neolithic and MesolithicEuropean groups in any of the regions studied, with thepossible exception of Mediterranean Europe. However,neither were clear affinities observed between Epipa-laeolithic Near Eastern groups and any other Neolithicor Mesolithic groups. These results support a third sce-nario—that the Epipalaeolithic population from whichthe first Anatolian farmers descended has yet to be dis-covered, as there are at present no skeletons and meagreevidence for Epipalaeolithic occupation in Anatolia.Some argue that there is little archaeological or biolog-ical evidence to support local continuity between Epi-palaeolithic and the “pre-pottery” Neolithic in the Le-vant (I. Hershkovitz, personal communication), but thepicture is complex. Some archaeologists use the PPNAas a purely chronological division, incorporating geo-graphically differentiated forager groups (Khiamian,Mureybetian, and perhaps Harifian) as well as thosewith some cultivation (Sultanian) (Bar-Yosef and Belfer-Cohen 1992). Byrd (1992) argues for both colonizationby expanding farming groups and adoption of agricul-tural resources occurring within the Levant and fartherafield during the PPNA and PPNB phases. Use of do-mesticated caprines, beginning in the late PPNB, un-derwent similar diffusion (Harris 1996:554–57). Thisscenario presents many opportunities for biological bot-tlenecks and complex patterns of distribution of bio-logical (including genetic) characteristics for humans,plants, and animals. The observed variability betweenLevantine and European Epipalaeolithic/Mesolithicgroups should be studied in relation to their predecessorUpper Palaeolithic populations. Genetic studies argu-ing for an Upper Palaeolithic ancestry of modern Eu-ropean populations need to consider population bottle-necks and segregation during the Late Glacial period,which can perhaps account for the morphological var-iability seen in the Mesolithic.
Ozdogan (1995, 1996, 1997) has proposed that the EarlyNeolithic cultures of Anatolia be considered as two dis-tinct entities: the Neolithic of south-eastern Anatolia,typified by Cayonu and related to the Mesopotamian-Levantine tradition, and an “indigenous” Neolithic ofthe Anatolian plateau, typified by Catal Hoyuk. If thesearchaeological cultures represented geographically per-sistent biological populations, one would expect to seemore similarities between specimens from Cayonu and
the Natufian sites than between the latter and Catal Ho-yuk. However, results of the principal components anal-yses for region 1 indicate an overlap in morphologicalvariability between Natufian, Catal Hoyuk, and Cayonuspecimens, while those from Abu Hureyra and Basta,both Levantine PPN sites, are outliers. There is thereforeno unequivocal evidence from biological morphometricsfor local continuity between Natufian specimens andany of those from the Anatolian or Levantine PPN cul-tures. Statistical analysis of the Levantine populationsindicates no obvious biological continuity between Na-tufian groups and their successors—either the first Ne-olithic cultures of the PPNA or subsequently betweenthe PPNA and the PPNB. The various Natufian groupsthemselves are characterized by a high degree of mor-phological variability. It is possible that one of thesegroups became agriculture-dependent at some stage andthat, under such a scenario, we are looking at some formof genetic bottleneck. One of the most intriguing resultsis the high degree of variability among the PPN “InitialNeolithic” groups from the Levant and Anatolia. It ispossible that these early farmers had separate biologicallineages and that the spread of agriculture was mainlydue to the diffusion of knowledge and technological as-pects across the Near East and Anatolia (cf. Byrd 1992).The existence of diverse Early Neolithic groups in thisregion is perhaps not surprising given that agricultureexisted in this region for 2,000 years or more before thefirst spread of farming into Europe.
Immediately beyond the zone of Anatolia and the NearEast, a striking amount of morphological similarity isfound between populations. The first farmers from NeaNikomedeia and other Greek Neolithic sites are mor-phologically similar to the first farmers from Catal Ho-yuk and to the specimens from the Koros and Starcevocultures and from the first LBK groups of central Europe(Pinhasi 2003) and show no similarity to the Mesolithicspecimens from Franchthi Cave. In the western Medi-terranean the picture is more obscure, with heteroge-neity among the Cardial Neolithic groups and the ab-sence of a strong pattern of differentiation betweenMesolithic and Neolithic groups. It is therefore plausiblethat dispersion within the northern Mediterranean areawas both more gradual and more varied in nature, withthe possibility of more biological admixture (Simoni etal. 1999). A recent analysis of more than 2,600 EuropeanmtDNA sequences which indicates significant east-to-west clinal variation around the Mediterranean but notfarther north may support this suggestion: according toSimoni et al. (2000:275) “a simple demographic expan-sion from the Levant is easy to reconcile with the gra-dients observed at many nuclear loci but it is not easyto link with the fact that mitochondrial variation isclinal only in southern Europe.” They suggest thatgreater gene flow occurred within the Mediterranean re-gion than across the northern part of the continent.

S74 F current anthropology Volume 45, Supplement, August–October 2004
Conclusions
This article has examined just one aspect of the complexset of events which gave rise to the appearance of agri-culture across Europe. Analysis of the available cranio-metric data in conjunction with data from nuclear-DNAand Y-chromosome genetic markers across Europe usingspatial autocorrelation statistics would allow a more re-gionally and chronologically nuanced biological ap-proach to the spread of farming in Europe that is toooften missing from studies of genetic markers. Ancient-DNA studies which focus on affinities and similaritiesbetween and among the Mesolithic and Neolithic pop-ulations in Europe, Anatolia, and the Near East mayeventually refine our understanding of dispersion andmigration events and subsequent processes. More secureC14 dates from Anatolia and south-eastern Europe andfurther surveys and excavations in western Anatolia, Eu-ropean Turkey, Macedonia, and Thrace are required (M.Ozdogan, personal communication). However, neitherskeletal nor genetic nor archaeological data alone willprovide “solutions” to questions about the nature of theMesolithic-Neolithic transition. Different data sets ad-dress a variety of processes at different scales and chron-ological and geographical resolutions (see Bentley, Chi-khi, and Price 2003). The fullest interpretations need totake into account social, biological, demographic, andcultural processes which the available evidence suggestswere historically and regionally variable. The results ofthe craniometric analysis of skeletal populations de-scribed here provide strong support for treating the Mes-olithic-Neolithic transition as several historical eventsrather than as a single demographically driven episodeof gradual logistic growth. Our findings tend to supportthose who argue for marked regional diversity in thenature of the spread of Neolithic characteristics. Thedata examined here suggest three main conclusions.First, they point to the prevalence of a biologically het-erogeneous PPN culture which existed for two millenniain the Levant, Anatolia, and Cyprus and possibly ex-tended farther west to other parts of the Mediterranean.Secondly, they support the idea that the first colonizingfarmers of mainland Europe originated from central An-atolia, as biologically exemplified by Catal Hoyuk, andentered south-eastern Europe through western Anatolia.The remarkable homogeneity among some Early Neo-lithic specimens from south-eastern Europe and thosefrom Catal Hoyuk implies little biological interactionamong many of these initial farming groups and localhunter-gatherers. Finally, the results suggest that littleadmixture between local hunters and incoming farmersoccurred in south-eastern Europe. This dispersal patterncontrasts with that for the western Mediterranean re-gion, where the spread of farming was generally moregradual and seems to be less a simple case of Neolithicdemic dispersion than a more gradual and complex dem-ographic process.
Comments
alex bentleyInstitute of Archaeology, University College London,31-34 Gordon Square, London WC1H 0PY, U.K.([email protected]). 26 iv 04
For a century now, much of the progress in the inves-tigation of the demographic origins of the Neolithic tran-sition in Europe has been made by those who have un-covered the archaeological evidence, provided radio-carbon dates, and (more recently) discovered geographicpatterns among the genes of modern populations. At thispoint in our knowledge, the way forward needs to involvedirect evidence from the skeletons of the participantswho lived millennia ago. For this reason, I applaud thispaper for presenting new, thought-provoking skeletaldata and assimilation of other data sets. By presentingthe multivariate data in the relatively direct format ofprincipal-component plots, Pinhasi and Pluciennik givereaders the exciting opportunity to investigate the pat-terns independently and draw conclusions. This is a veryvaluable contribution indeed.
Interpreting multivariate data always involves somesubjectivity, and a pleasure of reading this paper is con-sidering its meaning. In fact, I acknowledge a degree ofsubjectivity in my own interpretation of the strontiumisotope evidence that Douglas Price and I have collected,which I believe to be evidence for forager females’ mar-rying into early farmer settlements (Bentley et al. 2002,2003) whereas my own colleague favors the identifiedNeolithic migrants’ coming from other Neolithic agri-cultural settlements (Price et al. 2001, Bentley et al.2002). In anticipation of enjoyable debate, then, I submitthat, while a bottleneck among Anatolian populationsand a largely exogenous origin of Neolithic populationsin southeastern Europe are certainly possible, the dataas Pinhasi and Pluciennik have presented them do notunequivocally support these conclusions.
Regarding a bottleneck among Anatolian groups, it isclaimed in different parts of paper that (1) the Natufianspecimens overlap with those from Cayonu, Catal Ho-yuk, and Jericho PPN, (2) Catal Hoyuk resembles spec-imens from Early Neolithic Greece rather than thosefrom Cayonu, and (3) the Catal Hoyuk group is closer tothe southeastern European Neolithic specimens than tothe Anatolian/Levantine Early Neolithic groups. Notonly do these statements seem contradictory, but thefigures give us little opportunity to evaluate them. Onlyin figure 3 are Cayonu and Catal Hoyuk actually com-pared, and there the two groups overlap each other aswell as overlapping the Jericho and Natufian specimens,so I do not understand why Catal Hoyuk is said not toresemble Cayonu or the Levantine Neolithic. Also, infigure 3 the spread in principal-component 1 scoresamong Catal Hoyuk specimens appears larger than forany other group shown (including the various Natufianones), which seems not to reflect the “remarkable ho-
p inhasi and pluciennik Spread of Farming in Europe F S75
mogeneity” among the Catal Hoyuk population that Pin-hasi and Pluciennik describe.
I also do not see in these data a clear separation be-tween Mesolithic and Neolithic groups. In figure 6, forexample, I count at least 10 of the 30-odd Neolithicpoints on the positive side of the plot, which leave arather unconvincing majority of the Neolithic specimenswith negative loadings. Also, it is claimed that the Dan-ube Gorge Mesolithic specimens are separate from theNatufian group, but I cannot find a plot on which thosetwo groups are compared. It is further claimed that thereare no close similarities between any of the Early Neo-lithic and Mesolithic groups studied, but in figure 7 theDanube Mesolithic and Danube Neolithic groups clearlyoverlap, with group centroids quite close together, andin figure 8 there appears to be considerable overlap be-tween Catal Hoyuk and the Mediterranean Mesolithicgroups.
These contrary interpretations come from my inde-pendent viewing of the researchers’ plots, which wouldhave been easier had all the samples been analyzed to-gether and presented on one plot. However, let me againcongratulate them on collecting this extensive data setand in fact using it to argue for my own belief about theNeolithic expansion. One of the striking aspects aboutthe data is the presence of clear outlier groups, includingthe Khirokitia group (fig. 3) and the heterogeneous Car-dial groups (fig. 9) they refer to and, I would add, the NeaNikomedeia group (fig. 7). These outlier groups may re-flect founder effects that we would expect from separatemaritime colonization events to Cyprus and the north-ern Mediterranean (cf. Zilhao 2001) and potentially, inthe case of Nea Nikomedeia, from small groups of landcolonists. Many of these small groups of migrant farmerswould have found themselves isolated at least for sometime, and through opportunity or survival necessity theywould have traded with and possibly intermarried withMesolithic groups (e.g., Bentley et al. 2003, Price 2000a,Zilhao 2000, Zvelebil 2000). In other words, I think Pin-hasi and Pluciennik have given us a useful new data setfrom which we can all draw our own conclusions, discussthem, and gain a better understanding of the complexityof the Neolithic transition.
j ean-p ierre bocquet-appelCNRS, UPR 2147, 44, rue de l’Amiral Mouchez, 75014Paris, France ([email protected]). 27 iv 04
Pinhasi and Pluciennik have gathered palaeoanthropol-ogical data and subdivided them into three chrono-re-gional groups in order to test the homogeneity or het-erogeneity of the populating process associated with thespread of Neolithic from the Levant. They underline thecontradictions between patterns observed from geneticdata and the ad hoc explanations given by populationgeneticists. They believe that their data show a chrono-regional pattern of Neolithicization. Although the dataare unfortunately sparse, this is a useful attempt to injectmorphological data into a debate that tends to be mo-
nopolized by population geneticists who often seem toignore each other when their conclusions do not con-verge. Unlike the morphometric data, which are welldated, the genetic data are like a bag of marbles. Themarbles themselves say nothing about the cause of theirarrangement in the bag. What provides an explanationfor the way they are arranged is the model of interpre-tation. As we know, the fit of a model to the data is notproof of its reality. Almost every new genetic variant thatappears has its model. From an academic point of view,there are issues at stake here that are not only scientificbut also financial. I welcome the argument for the am-biguity of genetic patterns relating to the identificationof generating processes and the existence of contradic-tory patterns in historical perspective (traditional mark-ers versus mtDNA and Y chromosome, Neolithic versusUpper Palaeolithic explanations) and the great interestfor this debate of morphological data. The morphometricdata produce the same pattern of geographical differen-tiation as is observed on a worldwide scale in the geneticdata (Froment 1992).
Nevertheless, certain weaknesses of the approachshould not be underestimated. These are primarily dueto the scarcity of information, about which Pinhasi andPluciennik can do very little. This is apparent in theirprincipal components analysis. For example, the data arerepresented by values of absolute measurements. Weknow that the first discriminating factor in any popu-lation is sexual dimorphism (females are smaller thanmales). With the small sample size with which the re-searchers are working (for instance, in table 9, region 6,5–11 for 22 sites and 30 for only 2 sites), just one femaleor male more or less in one of the groups would certainlybe enough to modify the variances within and betweenthem as well as the values for the axes (mainly axis 1).Again, in region 6, if the sample size for each site pointis plotted, the variability pattern of the group averagesroughly corresponds to group sizes, with “large” groups(Catal Hoyuk, 50; Condeixa, 60) in the barycentre of thegraph and “small” groups (Final Ligurian, 3; Grotte Si-card, 3) on the periphery. It seems to me that this is notentirely a matter of chance. Estimates of group meansare better at the centre and poor towards the peripherybecause of their sample size. This point must be men-tioned especially because the genetic data employed inthe paper were generally sampled from groups of severaltens of individuals. In their analysis of the spatial au-tocorrelation of historical craniometric data—which Pin-hasi and Pluciennik also seek to perform—Sokal andUytterschaut (1987) exclude from their data the pointwhere the sample sizes were 30. The stability of thepopulation patterns observed by Pinhasi and Pluciennikin their morphometric data, given the very small samplesize of their samples, could easily be tested by simulation(for example, with Howells’s [1973] data, available in theADAM database). This would considerably strengthentheir conclusions. Another point that may weaken theirapproach is their device of subdividing the data intoregions in order to demonstrate the existence of a his-torical process on a regional rather than a continental
S76 F current anthropology Volume 45, Supplement, August–October 2004
scale. It should be remembered that a random changeperceived on a local or regional scale may be in fact clinalon a continental scale and conversely (Bocquet-Appel1996). It would be desirable to analyse these data fromthe continental to the regional, for there is always a biasin favour of the scale of definition chosen by theresearchers.
There were certainly several different regional pro-cesses at work in the spread of Neolithic, but they didnot occur independently. Rather, they started in the samegeographical area of the Fertile Crescent and everywherehelped to satisfy the same need for greater food security.One of the great merits of Ammerman and Cavalli-Sforza’s (1971) work is to have provided a global demo-graphic explanation at a continental scale, an ancestorof today’s globalization, whereas in the 1970s, for main-stream archaeologists everything nearly always stem-med from the local.
Undoubtedly, the new frontier is now to estimate thedifferentiation of the rate of cultural change continu-ously on the map, its speed, and the rate of inbreedingbetween local (supposed sedentary farmers) and non-lo-cal (supposed mobile foragers), using strontium isotopetechniques (Bentley, Chiki, and Price 2003). Pinhasi andPluciennik’s craniometric data should hold part of theanswer. In any case, they have attempted to make a greatdeal from relatively little—which is much better thanthe reverse—with all the innovative temerity and thedisadvantages associated with such an approach.
david bulbeckSchool of Archaeology and Anthropology, AustralianNational University, Canberra, ACT 2600, Australia([email protected]). 16 v 04
This article is an exercise in the art of interpreting am-biguous multivariate statistical results rather than thescience of rigorous testing of hypotheses and clear pre-sentation of the results. Further, while there are someconclusions that the analyses presented suggest, they of-ten differ from the inferences drawn by the authors.
One outstanding result, as noted by the authors, is thedistinctive status of the PPNB Abu Hureyra sample (figs.3–5). However, their discussion strangely extends thisfinding to the Basta sample (“results of the principalcomponents analyses [indicate that specimens] from AbuHureyra and Basta, both Levantine PPN sites, are out-liers”). While none of the Basta specimens falls withinthe Abu Hureyra range of variation on any plot, at leastone of them falls within the range of variation of all theother samples on every plot, with the sole exception ofthe Cayonu range of variation in figure 3. Only Abu Hu-reyra and, to a lesser degree, the island-bound samplefrom Khirokitia (on Cyprus) diverge noticeably from theother samples. On Pinhasi and Pluciennik’s evidence, itcould be reasonably inferred that by around 10,000 yearsago a quite homogeneous population stretched from thesouthern Levant (Basta) to Anatolia (Cayonu), with thesole exception of Abu Hureyra. This might suggest that
any genetic bottleneck that had the effect of diminishingmetrical variability in the region would date to the Pleis-tocene, not the Holocene as is claimed here.
Figures 4–6, 8, and 9 all include a first componentinterpreted as essentially size but also reflecting sex. Sur-prisingly, Pinhasi and Pluciennik discuss the potentialeffects of sexual dimorphism with reference to the mag-nitude of total variance but not to the separation betweenspecimens on their principal components plots. Whilethe full effect of sex on the size components could begauged only by those with access to the original data,the data in table 18 suggest that male craniometric av-erages are about 3–7% greater than corresponding femaleaverages (the exact figures may differ, especially as in thecase of two variables—ZYB and NLH—the reported av-erage for the two sexes together is mysteriously largerthan that for either sex). However, I suspect that, if thesex of each specimen in figures 4–6, 8, and 9 were dis-closed, there would be a clear predominance of femalesto the left side of the graphs and males to the right. Ifso, differences between the samples (independent of dif-ferences in their sexual composition) would be betterrepresented by plotting the specimens on principal com-ponents 2 and 3 rather than on 1 and 2.
Irrespective of this sexual dimorphism problem, Pin-hasi and Pluciennik additionally draw inferences unsup-ported by their own graphs. For instance, with figure 6we are advised that “the Mesolithic specimens fromFranchthi Cave in Greece are not associated with any ofthe Nea Nikomedeia specimens,” but one of the latteris represented by a diamond in the far bottom-right ofthe graph and would therefore be more closely associatedwith all of the Franchthi specimens than with any otherNea Nikomedeia specimen. With figure 9 we are toldthat “the Mediterranean Mesolithic specimens are in thelower portion of the graph,” but this is true specificallyof the Early Mediterranean Mesolithic specimens, whichon principal component 2 are separated from 10 out of12 of the Neolithic specimens (with Late MediterraneanMesolithic specimens intermediate, suggesting a tran-sitional morphology). In addition, the claim that “theCatal Hoyuk population resembles the Early Neolithicspecimens from Greece rather than those from Cayonu”is hard to sustain, as not one analysis presented directlycompares these three groups and in the single analysisthat directly compares Cayonu and Catal Hoyuk (fig. 3)the Cayonu specimens are entirely included within theCatal Hoyuk range of variation.
Even if the methodological and inferential problemsnoted above were remedied, the benefits of this line ofanalysis could be queried. The cranial measurementsavailable to Pinhasi and Pluciennik from publishedsources (table 2) exclude many that would be regardedas critical in modern craniometry (e.g., subtenses); exe-cution of the analyses compels them to estimate a sub-stantial proportion of missing measurements, based ona not particularly diagnostic battery of measurements inthe first place; and principal components plots account-ing for only ca. 50–60% of total variation, much of whichmay be size-related sexual dimorphism, hardly justify
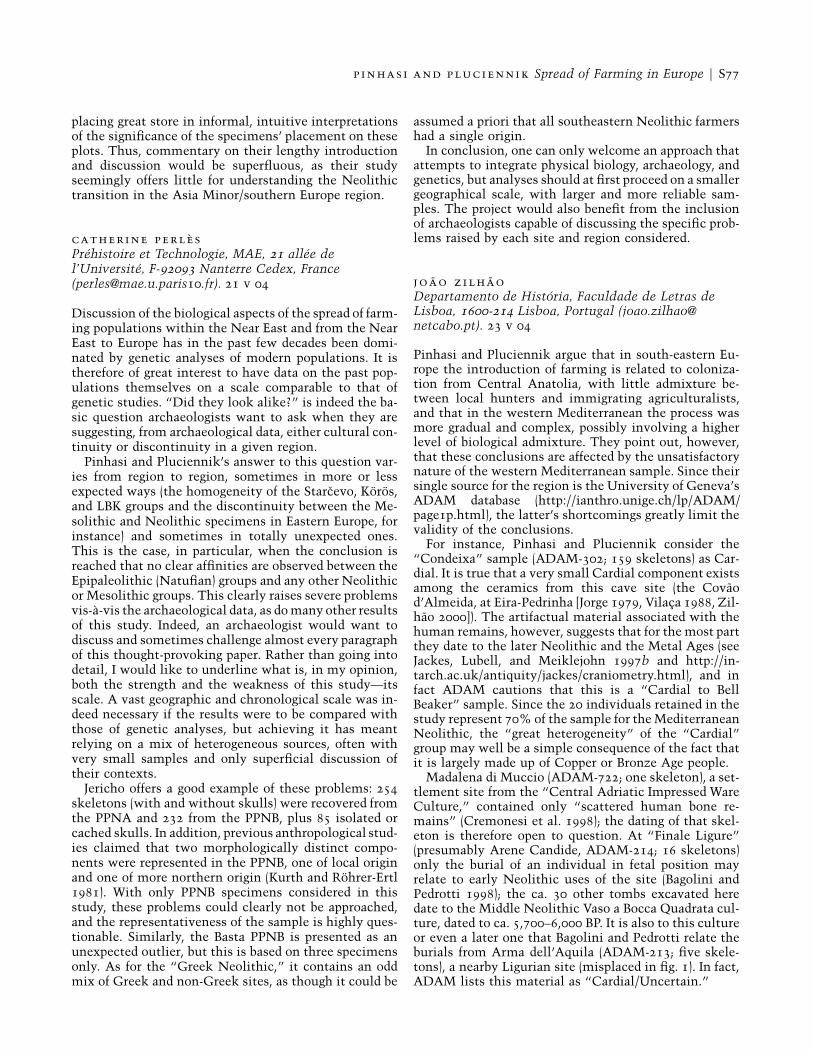
p inhasi and pluciennik Spread of Farming in Europe F S77
placing great store in informal, intuitive interpretationsof the significance of the specimens’ placement on theseplots. Thus, commentary on their lengthy introductionand discussion would be superfluous, as their studyseemingly offers little for understanding the Neolithictransition in the Asia Minor/southern Europe region.
catherine perl e sPrehistoire et Technologie, MAE, 21 allee del’Universite, F-92093 Nanterre Cedex, France([email protected]). 21 v 04
Discussion of the biological aspects of the spread of farm-ing populations within the Near East and from the NearEast to Europe has in the past few decades been domi-nated by genetic analyses of modern populations. It istherefore of great interest to have data on the past pop-ulations themselves on a scale comparable to that ofgenetic studies. “Did they look alike?” is indeed the ba-sic question archaeologists want to ask when they aresuggesting, from archaeological data, either cultural con-tinuity or discontinuity in a given region.
Pinhasi and Pluciennik’s answer to this question var-ies from region to region, sometimes in more or lessexpected ways (the homogeneity of the Starcevo, Koros,and LBK groups and the discontinuity between the Me-solithic and Neolithic specimens in Eastern Europe, forinstance) and sometimes in totally unexpected ones.This is the case, in particular, when the conclusion isreached that no clear affinities are observed between theEpipaleolithic (Natufian) groups and any other Neolithicor Mesolithic groups. This clearly raises severe problemsvis-a-vis the archaeological data, as do many other resultsof this study. Indeed, an archaeologist would want todiscuss and sometimes challenge almost every paragraphof this thought-provoking paper. Rather than going intodetail, I would like to underline what is, in my opinion,both the strength and the weakness of this study—itsscale. A vast geographic and chronological scale was in-deed necessary if the results were to be compared withthose of genetic analyses, but achieving it has meantrelying on a mix of heterogeneous sources, often withvery small samples and only superficial discussion oftheir contexts.
Jericho offers a good example of these problems: 254skeletons (with and without skulls) were recovered fromthe PPNA and 232 from the PPNB, plus 85 isolated orcached skulls. In addition, previous anthropological stud-ies claimed that two morphologically distinct compo-nents were represented in the PPNB, one of local originand one of more northern origin (Kurth and Rohrer-Ertl1981). With only PPNB specimens considered in thisstudy, these problems could clearly not be approached,and the representativeness of the sample is highly ques-tionable. Similarly, the Basta PPNB is presented as anunexpected outlier, but this is based on three specimensonly. As for the “Greek Neolithic,” it contains an oddmix of Greek and non-Greek sites, as though it could be
assumed a priori that all southeastern Neolithic farmershad a single origin.
In conclusion, one can only welcome an approach thatattempts to integrate physical biology, archaeology, andgenetics, but analyses should at first proceed on a smallergeographical scale, with larger and more reliable sam-ples. The project would also benefit from the inclusionof archaeologists capable of discussing the specific prob-lems raised by each site and region considered.
jo ao zilhaoDepartamento de Historia, Faculdade de Letras deLisboa, 1600-214 Lisboa, Portugal ([email protected]). 23 v 04
Pinhasi and Pluciennik argue that in south-eastern Eu-rope the introduction of farming is related to coloniza-tion from Central Anatolia, with little admixture be-tween local hunters and immigrating agriculturalists,and that in the western Mediterranean the process wasmore gradual and complex, possibly involving a higherlevel of biological admixture. They point out, however,that these conclusions are affected by the unsatisfactorynature of the western Mediterranean sample. Since theirsingle source for the region is the University of Geneva’sADAM database (http://ianthro.unige.ch/lp/ADAM/page1p.html), the latter’s shortcomings greatly limit thevalidity of the conclusions.
For instance, Pinhasi and Pluciennik consider the“Condeixa” sample (ADAM-302; 159 skeletons) as Car-dial. It is true that a very small Cardial component existsamong the ceramics from this cave site (the Covaod’Almeida, at Eira-Pedrinha [Jorge 1979, Vilaca 1988, Zil-hao 2000]). The artifactual material associated with thehuman remains, however, suggests that for the most partthey date to the later Neolithic and the Metal Ages (seeJackes, Lubell, and Meiklejohn 1997b and http://in-tarch.ac.uk/antiquity/jackes/craniometry.html), and infact ADAM cautions that this is a “Cardial to BellBeaker” sample. Since the 20 individuals retained in thestudy represent 70% of the sample for the MediterraneanNeolithic, the “great heterogeneity” of the “Cardial”group may well be a simple consequence of the fact thatit is largely made up of Copper or Bronze Age people.
Madalena di Muccio (ADAM-722; one skeleton), a set-tlement site from the “Central Adriatic Impressed WareCulture,” contained only “scattered human bone re-mains” (Cremonesi et al. 1998); the dating of that skel-eton is therefore open to question. At “Finale Ligure”(presumably Arene Candide, ADAM-214; 16 skeletons)only the burial of an individual in fetal position mayrelate to early Neolithic uses of the site (Bagolini andPedrotti 1998); the ca. 30 other tombs excavated heredate to the Middle Neolithic Vaso a Bocca Quadrata cul-ture, dated to ca. 5,700–6,000 BP. It is also to this cultureor even a later one that Bagolini and Pedrotti relate theburials from Arma dell’Aquila (ADAM-213; five skele-tons), a nearby Ligurian site (misplaced in fig. 1). In fact,ADAM lists this material as “Cardial/Uncertain.”
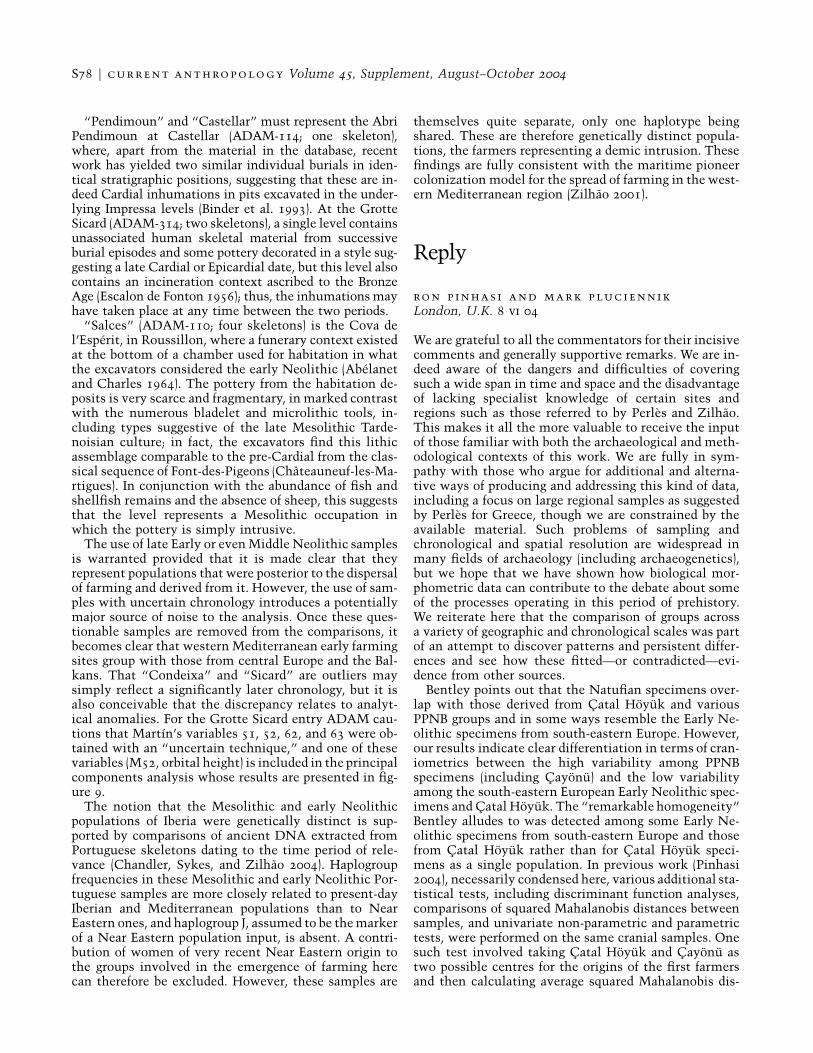
S78 F current anthropology Volume 45, Supplement, August–October 2004
“Pendimoun” and “Castellar” must represent the AbriPendimoun at Castellar (ADAM-114; one skeleton),where, apart from the material in the database, recentwork has yielded two similar individual burials in iden-tical stratigraphic positions, suggesting that these are in-deed Cardial inhumations in pits excavated in the under-lying Impressa levels (Binder et al. 1993). At the GrotteSicard (ADAM-314; two skeletons), a single level containsunassociated human skeletal material from successiveburial episodes and some pottery decorated in a style sug-gesting a late Cardial or Epicardial date, but this level alsocontains an incineration context ascribed to the BronzeAge (Escalon de Fonton 1956); thus, the inhumations mayhave taken place at any time between the two periods.
“Salces” (ADAM-110; four skeletons) is the Cova del’Esperit, in Roussillon, where a funerary context existedat the bottom of a chamber used for habitation in whatthe excavators considered the early Neolithic (Abelanetand Charles 1964). The pottery from the habitation de-posits is very scarce and fragmentary, in marked contrastwith the numerous bladelet and microlithic tools, in-cluding types suggestive of the late Mesolithic Tarde-noisian culture; in fact, the excavators find this lithicassemblage comparable to the pre-Cardial from the clas-sical sequence of Font-des-Pigeons (Chateauneuf-les-Ma-rtigues). In conjunction with the abundance of fish andshellfish remains and the absence of sheep, this suggeststhat the level represents a Mesolithic occupation inwhich the pottery is simply intrusive.
The use of late Early or even Middle Neolithic samplesis warranted provided that it is made clear that theyrepresent populations that were posterior to the dispersalof farming and derived from it. However, the use of sam-ples with uncertain chronology introduces a potentiallymajor source of noise to the analysis. Once these ques-tionable samples are removed from the comparisons, itbecomes clear that western Mediterranean early farmingsites group with those from central Europe and the Bal-kans. That “Condeixa” and “Sicard” are outliers maysimply reflect a significantly later chronology, but it isalso conceivable that the discrepancy relates to analyt-ical anomalies. For the Grotte Sicard entry ADAM cau-tions that Martın’s variables 51, 52, 62, and 63 were ob-tained with an “uncertain technique,” and one of thesevariables (M52, orbital height) is included in the principalcomponents analysis whose results are presented in fig-ure 9.
The notion that the Mesolithic and early Neolithicpopulations of Iberia were genetically distinct is sup-ported by comparisons of ancient DNA extracted fromPortuguese skeletons dating to the time period of rele-vance (Chandler, Sykes, and Zilhao 2004). Haplogroupfrequencies in these Mesolithic and early Neolithic Por-tuguese samples are more closely related to present-dayIberian and Mediterranean populations than to NearEastern ones, and haplogroup J, assumed to be the markerof a Near Eastern population input, is absent. A contri-bution of women of very recent Near Eastern origin tothe groups involved in the emergence of farming herecan therefore be excluded. However, these samples are
themselves quite separate, only one haplotype beingshared. These are therefore genetically distinct popula-tions, the farmers representing a demic intrusion. Thesefindings are fully consistent with the maritime pioneercolonization model for the spread of farming in the west-ern Mediterranean region (Zilhao 2001).
Reply
ron pinhasi and mark pluciennikLondon, U.K. 8 vi 04
We are grateful to all the commentators for their incisivecomments and generally supportive remarks. We are in-deed aware of the dangers and difficulties of coveringsuch a wide span in time and space and the disadvantageof lacking specialist knowledge of certain sites andregions such as those referred to by Perles and Zilhao.This makes it all the more valuable to receive the inputof those familiar with both the archaeological and meth-odological contexts of this work. We are fully in sym-pathy with those who argue for additional and alterna-tive ways of producing and addressing this kind of data,including a focus on large regional samples as suggestedby Perles for Greece, though we are constrained by theavailable material. Such problems of sampling andchronological and spatial resolution are widespread inmany fields of archaeology (including archaeogenetics),but we hope that we have shown how biological mor-phometric data can contribute to the debate about someof the processes operating in this period of prehistory.We reiterate here that the comparison of groups acrossa variety of geographic and chronological scales was partof an attempt to discover patterns and persistent differ-ences and see how these fitted—or contradicted—evi-dence from other sources.
Bentley points out that the Natufian specimens over-lap with those derived from Catal Hoyuk and variousPPNB groups and in some ways resemble the Early Ne-olithic specimens from south-eastern Europe. However,our results indicate clear differentiation in terms of cran-iometrics between the high variability among PPNBspecimens (including Cayonu) and the low variabilityamong the south-eastern European Early Neolithic spec-imens and Catal Hoyuk. The “remarkable homogeneity”Bentley alludes to was detected among some Early Ne-olithic specimens from south-eastern Europe and thosefrom Catal Hoyuk rather than for Catal Hoyuk speci-mens as a single population. In previous work (Pinhasi2004), necessarily condensed here, various additional sta-tistical tests, including discriminant function analyses,comparisons of squared Mahalanobis distances betweensamples, and univariate non-parametric and parametrictests, were performed on the same cranial samples. Onesuch test involved taking Catal Hoyuk and Cayonu astwo possible centres for the origins of the first farmersand then calculating average squared Mahalanobis dis-
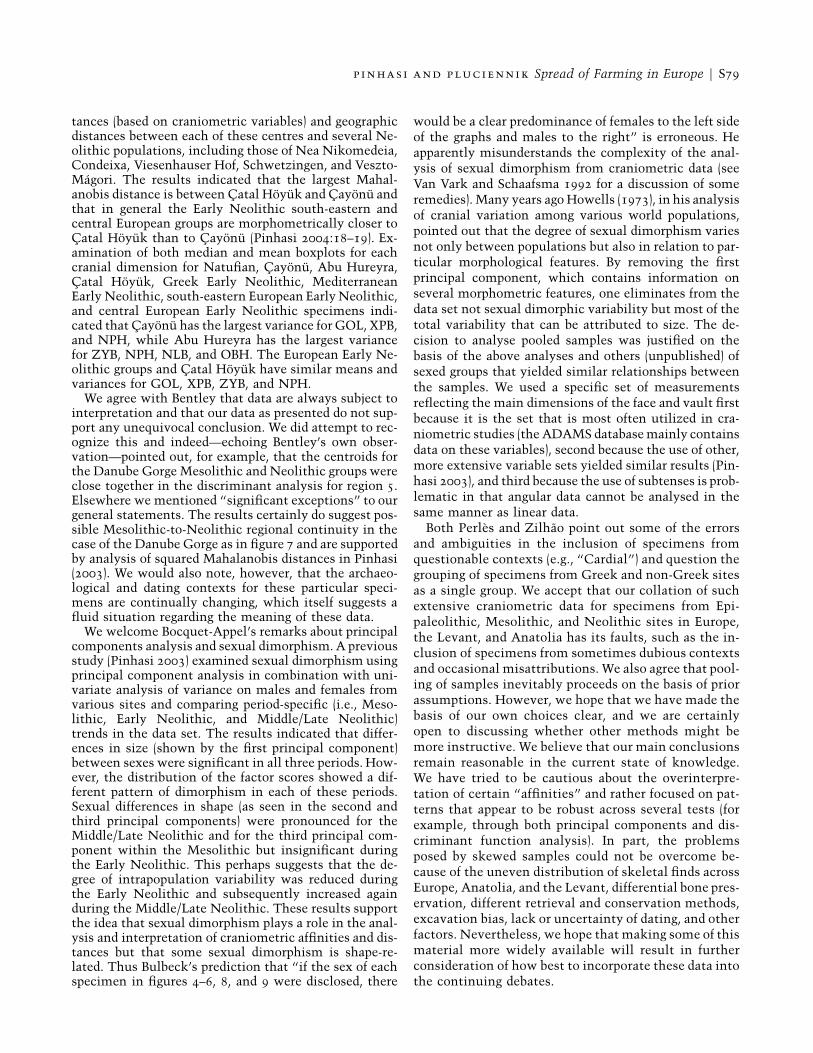
p inhasi and pluciennik Spread of Farming in Europe F S79
tances (based on craniometric variables) and geographicdistances between each of these centres and several Ne-olithic populations, including those of Nea Nikomedeia,Condeixa, Viesenhauser Hof, Schwetzingen, and Veszto-Magori. The results indicated that the largest Mahal-anobis distance is between Catal Hoyuk and Cayonu andthat in general the Early Neolithic south-eastern andcentral European groups are morphometrically closer toCatal Hoyuk than to Cayonu (Pinhasi 2004:18–19). Ex-amination of both median and mean boxplots for eachcranial dimension for Natufian, Cayonu, Abu Hureyra,Catal Hoyuk, Greek Early Neolithic, MediterraneanEarly Neolithic, south-eastern European Early Neolithic,and central European Early Neolithic specimens indi-cated that Cayonu has the largest variance for GOL, XPB,and NPH, while Abu Hureyra has the largest variancefor ZYB, NPH, NLB, and OBH. The European Early Ne-olithic groups and Catal Hoyuk have similar means andvariances for GOL, XPB, ZYB, and NPH.
We agree with Bentley that data are always subject tointerpretation and that our data as presented do not sup-port any unequivocal conclusion. We did attempt to rec-ognize this and indeed—echoing Bentley’s own obser-vation—pointed out, for example, that the centroids forthe Danube Gorge Mesolithic and Neolithic groups wereclose together in the discriminant analysis for region 5.Elsewhere we mentioned “significant exceptions” to ourgeneral statements. The results certainly do suggest pos-sible Mesolithic-to-Neolithic regional continuity in thecase of the Danube Gorge as in figure 7 and are supportedby analysis of squared Mahalanobis distances in Pinhasi(2003). We would also note, however, that the archaeo-logical and dating contexts for these particular speci-mens are continually changing, which itself suggests afluid situation regarding the meaning of these data.
We welcome Bocquet-Appel’s remarks about principalcomponents analysis and sexual dimorphism. A previousstudy (Pinhasi 2003) examined sexual dimorphism usingprincipal component analysis in combination with uni-variate analysis of variance on males and females fromvarious sites and comparing period-specific (i.e., Meso-lithic, Early Neolithic, and Middle/Late Neolithic)trends in the data set. The results indicated that differ-ences in size (shown by the first principal component)between sexes were significant in all three periods. How-ever, the distribution of the factor scores showed a dif-ferent pattern of dimorphism in each of these periods.Sexual differences in shape (as seen in the second andthird principal components) were pronounced for theMiddle/Late Neolithic and for the third principal com-ponent within the Mesolithic but insignificant duringthe Early Neolithic. This perhaps suggests that the de-gree of intrapopulation variability was reduced duringthe Early Neolithic and subsequently increased againduring the Middle/Late Neolithic. These results supportthe idea that sexual dimorphism plays a role in the anal-ysis and interpretation of craniometric affinities and dis-tances but that some sexual dimorphism is shape-re-lated. Thus Bulbeck’s prediction that “if the sex of eachspecimen in figures 4–6, 8, and 9 were disclosed, there
would be a clear predominance of females to the left sideof the graphs and males to the right” is erroneous. Heapparently misunderstands the complexity of the anal-ysis of sexual dimorphism from craniometric data (seeVan Vark and Schaafsma 1992 for a discussion of someremedies). Many years ago Howells (1973), in his analysisof cranial variation among various world populations,pointed out that the degree of sexual dimorphism variesnot only between populations but also in relation to par-ticular morphological features. By removing the firstprincipal component, which contains information onseveral morphometric features, one eliminates from thedata set not sexual dimorphic variability but most of thetotal variability that can be attributed to size. The de-cision to analyse pooled samples was justified on thebasis of the above analyses and others (unpublished) ofsexed groups that yielded similar relationships betweenthe samples. We used a specific set of measurementsreflecting the main dimensions of the face and vault firstbecause it is the set that is most often utilized in cra-niometric studies (the ADAMS database mainly containsdata on these variables), second because the use of other,more extensive variable sets yielded similar results (Pin-hasi 2003), and third because the use of subtenses is prob-lematic in that angular data cannot be analysed in thesame manner as linear data.
Both Perles and Zilhao point out some of the errorsand ambiguities in the inclusion of specimens fromquestionable contexts (e.g., “Cardial”) and question thegrouping of specimens from Greek and non-Greek sitesas a single group. We accept that our collation of suchextensive craniometric data for specimens from Epi-paleolithic, Mesolithic, and Neolithic sites in Europe,the Levant, and Anatolia has its faults, such as the in-clusion of specimens from sometimes dubious contextsand occasional misattributions. We also agree that pool-ing of samples inevitably proceeds on the basis of priorassumptions. However, we hope that we have made thebasis of our own choices clear, and we are certainlyopen to discussing whether other methods might bemore instructive. We believe that our main conclusionsremain reasonable in the current state of knowledge.We have tried to be cautious about the overinterpre-tation of certain “affinities” and rather focused on pat-terns that appear to be robust across several tests (forexample, through both principal components and dis-criminant function analysis). In part, the problemsposed by skewed samples could not be overcome be-cause of the uneven distribution of skeletal finds acrossEurope, Anatolia, and the Levant, differential bone pres-ervation, different retrieval and conservation methods,excavation bias, lack or uncertainty of dating, and otherfactors. Nevertheless, we hope that making some of thismaterial more widely available will result in furtherconsideration of how best to incorporate these data intothe continuing debates.

S80 F current anthropology Volume 45, Supplement, August–October 2004
References Cited
a b e l a n e t , j . , a n d r - p . c h a r l e s . 1964. Un site du Neo-lithique ancien en Roussillon: La Cova de l’Esperit. CahiersLigures de Pre-Histoire et d’Archeologie 13 (2):177–206. [jz]
a m m e r m a n , a . , a n d l . l . c a v a l l i - s f o r z a . 1971.Measuring the rate of spread of early farming in Europe. Man,n.s., 6:674–88.
———. 1973. “A population model for the diffusion of earlyfarming in Europe,” in The explanation of culture change. Ed-ited by C. Renfrew, pp. 343–57. London: Duckworth.
———. 1984. The Neolithic transition and the genetics of popu-lations in Europe. Princeton: Princeton University Press.
a n g e l , l . j . 1953. “The human remains from Khirokitia,” inKhirokitia: Final report on the excavation of a Neolithic set-tlement in Cyprus on behalf of the Department of Antiquities,1936–1946. Edited by P. Dikaios, pp. 416–30. Oxford: OxfordUniversity Press.
———. 1961. “Neolithic crania from Sotira,” in Sotira. Edited byP. Dikaios, pp. 223–29. Philadelphia: University Museum, Uni-versity of Pennsylvania.
b a g o l i n i , b . , a n d a . p e d ro t t i . 1998. “L’Italie Septen-trionale,” in Atlas du Neolithique europeen, vol. 2A, pp.233–341. Liege: Universite de Liege. [jz]
b a r b u j a n i , g . 2000. Geographic patterns: How to identifythem and why. Human Biology 72:133–53.
b a r b u j a n i , g . , a n d g . b e r t o r e l l e . 2001. Genetics andthe population history of Europe. Proceedings of the NationalAcademy of Sciences, U.S.A. 98:22–25.
b a r b u j a n i , g . , g . b e r t o r e l l e , a n d l . c h i k h i . 1998.Evidence for Paleolithic and Neolithic gene flow in Europe.American Journal of Human Genetics 62:488–91.
b a r b u j a n i , g . , r . s o k a l , a n d n . o d e n . 1995. Indo-Eu-ropean origins: A computer-simulation test of five hypotheses.American Journal of Physical Anthropology 96:109–32.
b a r - y o s e f , o . , a n d a . b e l f e r - c o h e n . 1992. “From for-aging to farming in the Mediterranean Levant,” in Transitionsto agriculture in prehistory. Edited by A. B. Gebauer and T. D.Price, pp. 21–48. Madison: Prehistory Press.
b e n t l e y, a . , l . c h i k h i , a n d t . p r i c e . 2003. The Neo-lithic transition in Europe: Comparing broad-scale genetic andlocal-scale isotopic evidence. Antiquity 77:63–66.
b e n t l e y, r . a . , t . d . p r i c e , j . l u n i n g , d . g ro n e n -b o r n , j . w a h l , a n d p . d . f u l l a g a r . 2002. Humanmigration in early Neolithic Europe. current anthropology43:799–804. [ab]
b e r t r a n p e t i t , j . , a n d l . l . c a v a l l i - s f o r z a . 1991.A genetic reconstruction of the history of the population of theIberian Peninsula. Annals of Human Genetics 55:51–67.
b i n d e r , d . , j - e . b ro c h i e r , h . d u d a y, d . h e l m e r ,p . m a r i n v a l , s . t h i e b a u l t , a n d j . w a t t e z . 1993.L’Abri Pendimoun a Castellar (Alpes-Maritimes): Nouvellesdonnees sur le complexe culturel de la ceramique imprimeemediterraneenne dans son contexte stratigraphique. Gallia Pre-histoire 35:177–251. [jz]
b o c q u e t - a p p e l , j . p . 1996. “Spatial traces, flows, and barri-ers,” in Spatial analysis of biodemographic data. Edited by J.P. Bocquet-Appel, D. Courgeau, and D. Pumain, pp. 109–16.London and Paris: Eurotext, John Libbey. [jpb]
b ro o d b a n k , c . , a n d t . s t r a s s e r . 1991. Migrant farm-ers and the Neolithic colonization of Crete. Antiquity 65:233–45.
b ro w n , k . , a n d m . p l u c i e n n i k . 2001. Archaeology andhuman genetics: Lessons for both. Antiquity 75:101–6.
b y r d , b . 1992. “The dispersal of food production across the Le-vant,” in Transitions to agriculture in prehistory. Edited by A.-B. Gebauer and T. Price, pp. 49–61. Madison: Prehistory Press.
c a v a l l i - s f o r z a , l . l . 1996. “The spread of agriculture andnomadic pastoralism: Insights from genetics, linguistics, andarchaeology,” in The origins and spread of agriculture and pas-
toralism in Eurasia. Edited by D. Harris, pp. 51–69. London:UCL Press.
c a v a l l i - s f o r z a , l . l . , p . m e n o z z i , a n d a . p i a z z a .1993. Demic expansions and human evolution. Science 259:639–46.
———. 1994. The history and geography of human genes. Prince-ton: Princeton University Press.
c h a n d l e r , h . , b . s y k e s , a n d j . z i l h a o . 2004. “Usingancient DNA to examine genetic continuity at the Mesolithic-Neolithic transition in Portugal.” III Congreso del Neolıtico enla Penınsula Iberica, Actas. Santander: Universidad de Canta-bria. In press. [jz]
c h a p m a n , j . 1994. The origins of farming in southeast Eu-rope. Prehistoire Europeenne 6:133–56.
c h i k h i , l . , g . d e s t ro - b i s o l , v. p a s c a l l , v. b a r a -v e l l i , v. d o b o s z , a n d g . b a r b u j a n i . 1998a. Clinalvariation in the nuclear DNA of Europeans. Human Biology70:643–57.
c h i k h i , l . , g . d e s t ro - b i s o l , g . b e r t o r e l l e , v.p a s c a l i , a n d g . b a r b u j a n i . 1998b. Clines of nuclearDNA markers suggest a largely Neolithic ancestry of the Euro-pean gene pool. Proceedings of the National Academy of Sci-ences, U.S.A. 95:9053–58.
c h i k h i , l . , r . n i c h o l s , g . b a r b u j a n i , a n d m .b e a u m o n t . 2002. Y genetic data support the Neolithic dif-fusion model. Proceedings of the National Academy of Sci-ences, U.S.A. 99:11008–13.
c h i l d e , v. g . 1925. The dawn of European civilisation. Lon-don: Kegan Paul.
c l a r k , g . 1965a. Radiocarbon dating and the spread of farmingeconomy. Antiquity 39:45–48.
———. 1965b. Radiocarbon dating and the expansion of farmingculture from the Near East over Europe. Proceedings of thePrehistoric Society, n.s., 31:58–73.
c r e m o n e s i , g . , r . g r i f o n i - c r e m o n e s i , g . r a d i , c .t o z z i , a n d f . n i c o l i s . 1998. “L’Italie Centrale,” in At-las du Neolithique Europeen, vol. 2A, pp. 165–231. Liege:Universite de Liege. [jz]
d e n n e l l , r . 1983. European economic prehistory: A new ap-proach. London: Academic Press.
———. 1985. “The hunter-gatherer/agricultural frontier in prehis-toric temperate Europe,” in The archaeology of frontiers andboundaries. Edited by S. Green and S. Perlman, pp. 113–40.New York: Academic Press.
e s c a l o n d e f o n t o n , m . 1956. Prehistoire de la Basse-Provence: Etat d’avancement des recherches en 1951. Prehis-toire 12. [jz]
f e r e m b a c h , d . 1982. Mesures et indices des squelettes hu-mains neolithiques de Catal Hoyuk (Turquie). Paris: CNRS.
f i x , a . 1996. Gene frequency clines in Europe: Demic diffusionor natural selection? Journal of the Royal Anthropological In-stitute, n.s., 2:625–43.
———. 1997. Gene frequency clines produced by kin-structuredfounder effects. Human Biology 69:663–73.
———. 1999. Migration and colonization in human microevolu-tion. Cambridge: Cambridge University Press.
f ro m e n t , a . 1992. La differenciation morphologique del’Homme moderne: Congruence entre forme du crane et repar-tition geographique du peuplement. Comptes-Rendus del’Academie des Sciences 315:323–29. [jpb]
g k i a s t a , m . , t . ru s s e l l , s . s h e n n a n , a n d j .s t e e l e . 2003. Neolithic transition in Europe: The radiocar-bon record revisited. Antiquity 77:45–62.
h a l s t e a d , p . 1996. “The development of agriculture and pas-toralism in Greece: When, how, who, and what?” in The ori-gins and spread of agriculture and pastoralism in Eurasia. Ed-ited by D. Harris, pp. 296–309. London: UCL Press.
h a r r i s , d . 1996. “The origins and spread of agriculture andpastoralism in Eurasia: An overview,” in The origins andspread of agriculture and pastoralism in Eurasia. Edited by D.Harris, pp. 552–73. London: UCL Press.
h o w e l l s , w. w. 1973. Cranial variation in man: A study bymultivariate analysis of patterns of difference among recent
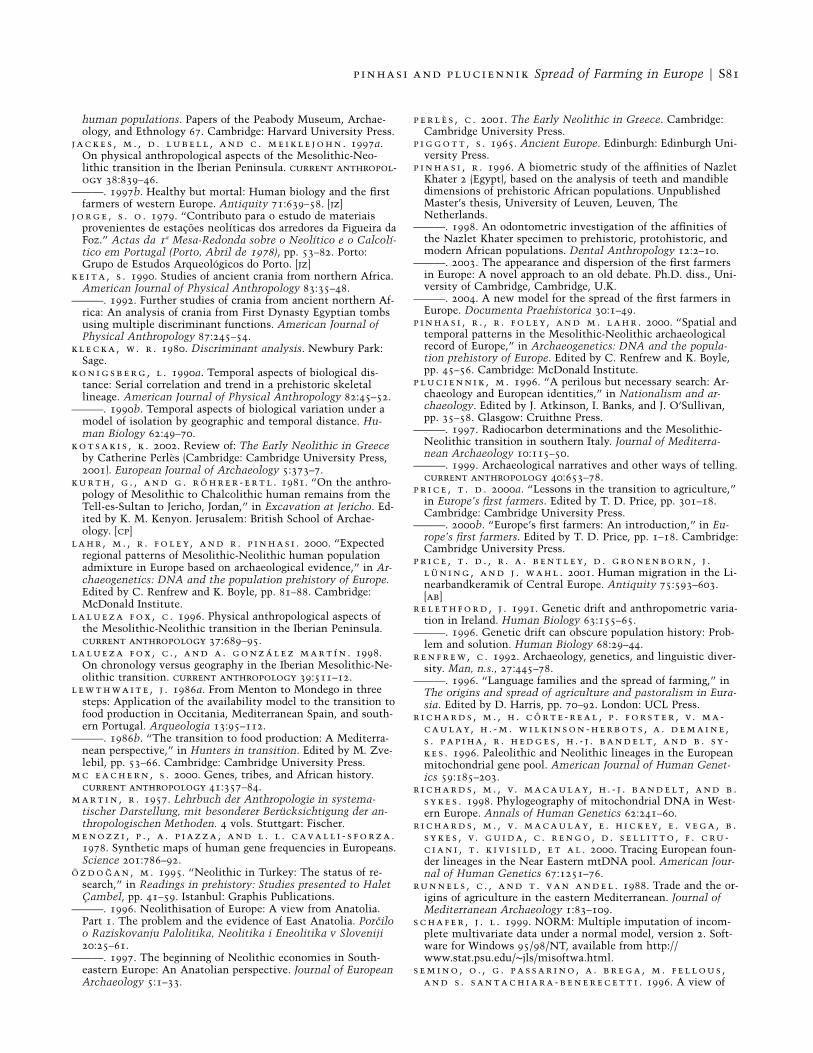
p inhasi and pluciennik Spread of Farming in Europe F S81
human populations. Papers of the Peabody Museum, Archae-ology, and Ethnology 67. Cambridge: Harvard University Press.
j a c k e s , m . , d . l u b e l l , a n d c . m e i k l e j o h n . 1997a.On physical anthropological aspects of the Mesolithic-Neo-lithic transition in the Iberian Peninsula. current anthropol-ogy 38:839–46.
———. 1997b. Healthy but mortal: Human biology and the firstfarmers of western Europe. Antiquity 71:639–58. [jz]
j o r g e , s . o . 1979. “Contributo para o estudo de materiaisprovenientes de estacoes neolıticas dos arredores da Figueira daFoz.” Actas da 1a Mesa-Redonda sobre o Neolıtico e o Calcolı-tico em Portugal (Porto, Abril de 1978), pp. 53–82. Porto:Grupo de Estudos Arqueologicos do Porto. [jz]
k e i t a , s . 1990. Studies of ancient crania from northern Africa.American Journal of Physical Anthropology 83:35–48.
———. 1992. Further studies of crania from ancient northern Af-rica: An analysis of crania from First Dynasty Egyptian tombsusing multiple discriminant functions. American Journal ofPhysical Anthropology 87:245–54.
k l e c k a , w. r . 1980. Discriminant analysis. Newbury Park:Sage.
k o n i g s b e r g , l . 1990a. Temporal aspects of biological dis-tance: Serial correlation and trend in a prehistoric skeletallineage. American Journal of Physical Anthropology 82:45–52.
———. 1990b. Temporal aspects of biological variation under amodel of isolation by geographic and temporal distance. Hu-man Biology 62:49–70.
k o t s a k i s , k . 2002. Review of: The Early Neolithic in Greeceby Catherine Perles (Cambridge: Cambridge University Press,2001). European Journal of Archaeology 5:373–7.
k u r t h , g . , a n d g . r o h r e r - e r t l . 1981. “On the anthro-pology of Mesolithic to Chalcolithic human remains from theTell-es-Sultan to Jericho, Jordan,” in Excavation at Jericho. Ed-ited by K. M. Kenyon. Jerusalem: British School of Archae-ology. [cp]
l a h r , m . , r . f o l e y, a n d r . p i n h a s i . 2000. “Expectedregional patterns of Mesolithic-Neolithic human populationadmixture in Europe based on archaeological evidence,” in Ar-chaeogenetics: DNA and the population prehistory of Europe.Edited by C. Renfrew and K. Boyle, pp. 81–88. Cambridge:McDonald Institute.
l a l u e z a f o x , c . 1996. Physical anthropological aspects ofthe Mesolithic-Neolithic transition in the Iberian Peninsula.current anthropology 37:689–95.
l a l u e z a f o x , c . , a n d a . g o n z a l e z m a r t ı n . 1998.On chronology versus geography in the Iberian Mesolithic-Ne-olithic transition. current anthropology 39:511–12.
l e w t h w a i t e , j . 1986a. From Menton to Mondego in threesteps: Application of the availability model to the transition tofood production in Occitania, Mediterranean Spain, and south-ern Portugal. Arqueologia 13:95–112.
———. 1986b. “The transition to food production: A Mediterra-nean perspective,” in Hunters in transition. Edited by M. Zve-lebil, pp. 53–66. Cambridge: Cambridge University Press.
m c e a c h e r n , s . 2000. Genes, tribes, and African history.current anthropology 41:357–84.
m a r t i n , r . 1957. Lehrbuch der Anthropologie in systema-tischer Darstellung, mit besonderer Berucksichtigung der an-thropologischen Methoden. 4 vols. Stuttgart: Fischer.
m e n o z z i , p . , a . p i a z z a , a n d l . l . c a v a l l i - s f o r z a .1978. Synthetic maps of human gene frequencies in Europeans.Science 201:786–92.
o z d o g a n , m . 1995. “Neolithic in Turkey: The status of re-search,” in Readings in prehistory: Studies presented to HaletCambel, pp. 41–59. Istanbul: Graphis Publications.
———. 1996. Neolithisation of Europe: A view from Anatolia.Part 1. The problem and the evidence of East Anatolia. Porciloo Raziskovanju Palolitika, Neolitika i Eneolitika v Sloveniji20:25–61.
———. 1997. The beginning of Neolithic economies in South-eastern Europe: An Anatolian perspective. Journal of EuropeanArchaeology 5:1–33.
p e r l e s , c . 2001. The Early Neolithic in Greece. Cambridge:Cambridge University Press.
p i g g o t t , s . 1965. Ancient Europe. Edinburgh: Edinburgh Uni-versity Press.
p i n h a s i , r . 1996. A biometric study of the affinities of NazletKhater 2 (Egypt), based on the analysis of teeth and mandibledimensions of prehistoric African populations. UnpublishedMaster’s thesis, University of Leuven, Leuven, TheNetherlands.
———. 1998. An odontometric investigation of the affinities ofthe Nazlet Khater specimen to prehistoric, protohistoric, andmodern African populations. Dental Anthropology 12:2–10.
———. 2003. The appearance and dispersion of the first farmersin Europe: A novel approach to an old debate. Ph.D. diss., Uni-versity of Cambridge, Cambridge, U.K.
———. 2004. A new model for the spread of the first farmers inEurope. Documenta Praehistorica 30:1–49.
p i n h a s i , r . , r . f o l e y, a n d m . l a h r . 2000. “Spatial andtemporal patterns in the Mesolithic-Neolithic archaeologicalrecord of Europe,” in Archaeogenetics: DNA and the popula-tion prehistory of Europe. Edited by C. Renfrew and K. Boyle,pp. 45–56. Cambridge: McDonald Institute.
p l u c i e n n i k , m . 1996. “A perilous but necessary search: Ar-chaeology and European identities,” in Nationalism and ar-chaeology. Edited by J. Atkinson, I. Banks, and J. O’Sullivan,pp. 35–58. Glasgow: Cruithne Press.
———. 1997. Radiocarbon determinations and the Mesolithic-Neolithic transition in southern Italy. Journal of Mediterra-nean Archaeology 10:115–50.
———. 1999. Archaeological narratives and other ways of telling.current anthropology 40:653–78.
p r i c e , t . d . 2000a. “Lessons in the transition to agriculture,”in Europe’s first farmers. Edited by T. D. Price, pp. 301–18.Cambridge: Cambridge University Press.
———. 2000b. “Europe’s first farmers: An introduction,” in Eu-rope’s first farmers. Edited by T. D. Price, pp. 1–18. Cambridge:Cambridge University Press.
p r i c e , t . d . , r . a . b e n t l e y, d . g ro n e n b o r n , j .l u n i n g , a n d j . w a h l . 2001. Human migration in the Li-nearbandkeramik of Central Europe. Antiquity 75:593–603.[ab]
r e l e t h f o r d , j . 1991. Genetic drift and anthropometric varia-tion in Ireland. Human Biology 63:155–65.
———. 1996. Genetic drift can obscure population history: Prob-lem and solution. Human Biology 68:29–44.
r e n f r e w, c . 1992. Archaeology, genetics, and linguistic diver-sity. Man, n.s., 27:445–78.
———. 1996. “Language families and the spread of farming,” inThe origins and spread of agriculture and pastoralism in Eura-sia. Edited by D. Harris, pp. 70–92. London: UCL Press.
r i c h a r d s , m . , h . c o r t e - r e a l , p . f o r s t e r , v. m a -c a u l a y, h . - m . w i l k i n s o n - h e r b o t s , a . d e m a i n e ,s . p a p i h a , r . h e d g e s , h . - j . b a n d e l t , a n d b . s y -k e s . 1996. Paleolithic and Neolithic lineages in the Europeanmitochondrial gene pool. American Journal of Human Genet-ics 59:185–203.
r i c h a r d s , m . , v. m a c a u l a y, h . - j . b a n d e l t , a n d b .s y k e s . 1998. Phylogeography of mitochondrial DNA in West-ern Europe. Annals of Human Genetics 62:241–60.
r i c h a r d s , m . , v. m a c a u l a y, e . h i c k e y, e . v e g a , b .s y k e s , v. g u i d a , c . r e n g o , d . s e l l i t t o , f . c ru -c i a n i , t . k i v i s i l d , e t a l . 2000. Tracing European foun-der lineages in the Near Eastern mtDNA pool. American Jour-nal of Human Genetics 67:1251–76.
ru n n e l s , c . , a n d t . v a n a n d e l . 1988. Trade and the or-igins of agriculture in the eastern Mediterranean. Journal ofMediterranean Archaeology 1:83–109.
s c h a f e r , j . l . 1999. NORM: Multiple imputation of incom-plete multivariate data under a normal model, version 2. Soft-ware for Windows 95/98/NT, available from http://www.stat.psu.edu/∼jls/misoftwa.html.
s e m i n o , o . , g . p a s s a r i n o , a . b r e g a , m . f e l l o u s ,a n d s . s a n t a c h i a r a - b e n e r e c e t t i . 1996. A view of
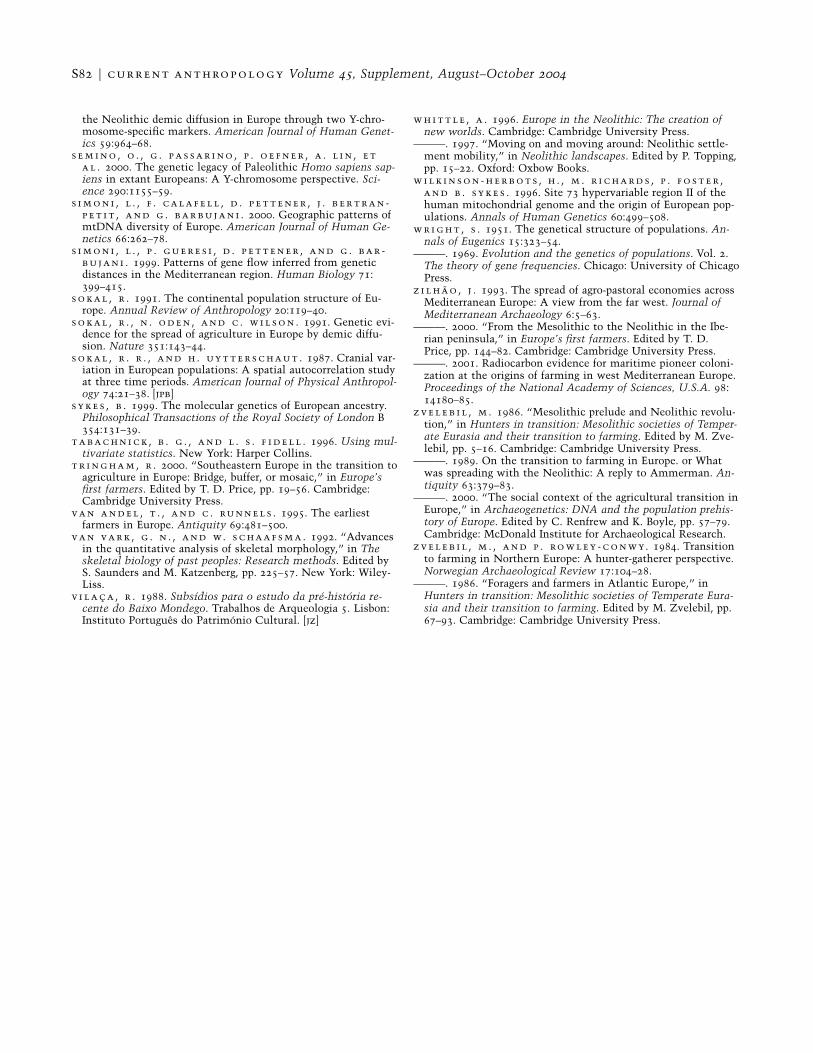
S82 F current anthropology Volume 45, Supplement, August–October 2004
the Neolithic demic diffusion in Europe through two Y-chro-mosome-specific markers. American Journal of Human Genet-ics 59:964–68.
s e m i n o , o . , g . p a s s a r i n o , p . o e f n e r , a . l i n , e ta l . 2000. The genetic legacy of Paleolithic Homo sapiens sap-iens in extant Europeans: A Y-chromosome perspective. Sci-ence 290:1155–59.
s i m o n i , l . , f . c a l a f e l l , d . p e t t e n e r , j . b e r t r a n -p e t i t , a n d g . b a r b u j a n i . 2000. Geographic patterns ofmtDNA diversity of Europe. American Journal of Human Ge-netics 66:262–78.
s i m o n i , l . , p . g u e r e s i , d . p e t t e n e r , a n d g . b a r -b u j a n i . 1999. Patterns of gene flow inferred from geneticdistances in the Mediterranean region. Human Biology 71:399–415.
s o k a l , r . 1991. The continental population structure of Eu-rope. Annual Review of Anthropology 20:119–40.
s o k a l , r . , n . o d e n , a n d c . w i l s o n . 1991. Genetic evi-dence for the spread of agriculture in Europe by demic diffu-sion. Nature 351:143–44.
s o k a l , r . r . , a n d h . u y t t e r s c h a u t . 1987. Cranial var-iation in European populations: A spatial autocorrelation studyat three time periods. American Journal of Physical Anthropol-ogy 74:21–38. [jpb]
s y k e s , b . 1999. The molecular genetics of European ancestry.Philosophical Transactions of the Royal Society of London B354:131–39.
t a b a c h n i c k , b . g . , a n d l . s . f i d e l l . 1996. Using mul-tivariate statistics. New York: Harper Collins.
t r i n g h a m , r . 2000. “Southeastern Europe in the transition toagriculture in Europe: Bridge, buffer, or mosaic,” in Europe’sfirst farmers. Edited by T. D. Price, pp. 19–56. Cambridge:Cambridge University Press.
v a n a n d e l , t . , a n d c . ru n n e l s . 1995. The earliestfarmers in Europe. Antiquity 69:481–500.
v a n v a r k , g . n . , a n d w. s c h a a f s m a . 1992. “Advancesin the quantitative analysis of skeletal morphology,” in Theskeletal biology of past peoples: Research methods. Edited byS. Saunders and M. Katzenberg, pp. 225–57. New York: Wiley-Liss.
v i l a c a , r . 1988. Subsıdios para o estudo da pre-historia re-cente do Baixo Mondego. Trabalhos de Arqueologia 5. Lisbon:Instituto Portugues do Patrimonio Cultural. [jz]
w h i t t l e , a . 1996. Europe in the Neolithic: The creation ofnew worlds. Cambridge: Cambridge University Press.
———. 1997. “Moving on and moving around: Neolithic settle-ment mobility,” in Neolithic landscapes. Edited by P. Topping,pp. 15–22. Oxford: Oxbow Books.
w i l k i n s o n - h e r b o t s , h . , m . r i c h a r d s , p . f o s t e r ,a n d b . s y k e s . 1996. Site 73 hypervariable region II of thehuman mitochondrial genome and the origin of European pop-ulations. Annals of Human Genetics 60:499–508.
w r i g h t , s . 1951. The genetical structure of populations. An-nals of Eugenics 15:323–54.
———. 1969. Evolution and the genetics of populations. Vol. 2.The theory of gene frequencies. Chicago: University of ChicagoPress.
z i l h a o , j . 1993. The spread of agro-pastoral economies acrossMediterranean Europe: A view from the far west. Journal ofMediterranean Archaeology 6:5–63.
———. 2000. “From the Mesolithic to the Neolithic in the Ibe-rian peninsula,” in Europe’s first farmers. Edited by T. D.Price, pp. 144–82. Cambridge: Cambridge University Press.
———. 2001. Radiocarbon evidence for maritime pioneer coloni-zation at the origins of farming in west Mediterranean Europe.Proceedings of the National Academy of Sciences, U.S.A. 98:14180–85.
z v e l e b i l , m . 1986. “Mesolithic prelude and Neolithic revolu-tion,” in Hunters in transition: Mesolithic societies of Temper-ate Eurasia and their transition to farming. Edited by M. Zve-lebil, pp. 5–16. Cambridge: Cambridge University Press.
———. 1989. On the transition to farming in Europe. or Whatwas spreading with the Neolithic: A reply to Ammerman. An-tiquity 63:379–83.
———. 2000. “The social context of the agricultural transition inEurope,” in Archaeogenetics: DNA and the population prehis-tory of Europe. Edited by C. Renfrew and K. Boyle, pp. 57–79.Cambridge: McDonald Institute for Archaeological Research.
z v e l e b i l , m . , a n d p . ro w l e y - c o n w y. 1984. Transitionto farming in Northern Europe: A hunter-gatherer perspective.Norwegian Archaeological Review 17:104–28.
———. 1986. “Foragers and farmers in Atlantic Europe,” inHunters in transition: Mesolithic societies of Temperate Eura-sia and their transition to farming. Edited by M. Zvelebil, pp.67–93. Cambridge: Cambridge University Press.