a reassessment of kenya's rural and urban informal sector
TRANSCRIPT

World Development, Vol. 19, No. 6, pp. 651-670, 1991. 0305-750X/91 $3.00 + 0.00 Printed in Great Britain. © 1991 Pergamon Press plc
A Reassessment of Kenya's Rural and Urban Informal Sector
IAN LIVINGSTONE* University of East Anglia, Norwich
Summary. - - T h e nature and role of the so-called "informal sector" are re-examined, on the basis of a detailed country study, using different data sources relating to Kenya which have recently been published or become available. Specific Kenyan phenomena are identified and commented upon, particularly the importance of "'divided households" obtaining their living in both agriculture and the urban informal sector, and the tendency of informal sector manufacturing enterprises to form "agglomerations." The informal sector is seen as a heterogeneous set of activities, urban or rural, which have the common features of catering (not uniquely) to the mass of low-income consumers, existing competitively due to the low supply price of labor, and being capable of retaining an important role in economies with widely varying levels of development so long as this supply price remains low.
1. I N T R O D U C T I O N
Ever since the 1972 International Labor Office mission to Kenya ( ILO, 1972) addressed it, a great deal of interest and discussion has focused on the concept of the informal sector. This discussion has centered upon two main ques- tions. First, is the informal sector a useful analytical concept, given certain awkward prob- lems of definition? Second, if such a sector can be defined, and thus actually "exists," what is its economic significance, and what potential does it have to contribute to the growth process? It is appropriate to discuss these two questions here in some detail with reference to Kenya, not only because Kenya was the country studied by the original ILO mission, but also because of the considerable amount of published data on this country. It is also easier to clarify general theoretical issues using detailed country case studies, even if broader conclusions are to be drawn.
This paper starts by reviewing the definitional issues to separate out the various components and dimensions of what is in fact a collective term, embracing a number of distinct elements. Af te r examining recent data on the quantitative importance and structure of the urban and rural informal sectors, at tention is drawn to a major phenomenon in Kenya, the "divided household," which has significant implications for how we view the informal sector itself and perhaps the Kenyan economy as a whole. The recently
diagnosed problem of the "missing middle" of non-micro small-scale enterprises (SSEs) is then considered, along with the question of whether the microenterprise sector is capable of growing independently of the formal sector. Data are then analyzed to demonstra te the present weak- ness of backward linkages from agriculture as a stimulus to informal sector manufacturing in the Kenyan and probably other African cases, in comparison with parts of Asia. A strong ten- dency for manufacturing microenterprises to form agglomerations and clusters is then identi- fied, and shown to have considerable potential to facilitate upgrading of informal sector manufac- turing. Finally, the basic nature of the informal sector is reassessed, to provide an interpretat ion which fits not only Kenya and other African countries, but also other countries at different levels of income and development .
2. C O N C E P T U A L A N D D E F I N I T I O N A L C O N S I D E R A T I O N S
The important contribution made by the coin- ing of the term "informal sector" was in drawing
*An earlier assessment "'The rural and urban dimen- sions of the informal sector: A discussion of Kenya" (Livingstone, 1984) was circulated as a Discussion Paper of the School of Development Studies, Univer- sity of East Anglia. Work on the present paper has been made possible by a grant from the Nuffield Foundation.
651
652 WORLD DEVELOPMENT
attention to a set of activities which had been neglected in terms of statistical data collection, analytical attention, and positive promotional policies. In fact, this heterogeneous set of activi- ties can hardly be described as a sector as it covers everything from small-scale manufactur- ing and repair to trade, transport and construc- tion, and services.
In relation to definitional questions, some (e.g., Mazumdar, 1976) have emphasized whether the enterprises and activities in the "informal sector" operate subject to government regulations such as minimum wage laws, and whether they pay taxes. Certainly the avoidance of taxes and minimum wage obligations gives many small enterprises a significant advantage, but they pay other taxes (e.g., customs duties on inputs) and in other respects operate at a disadvantage vis-gl-vis large firms. Hence it is more useful to distinguish enterprises on the basis of size, and examine separately different factors affecting their competitiveness.
Similarly, it is not helpful to characterize the informal sector as one incorporating a substantial proportion of illegal or "illegitimate" activities such as crime and prostitution. This tendency may be inherited from Hart's (1973) original article on the informal sector. Despite the existence of real social problems in these regards, the numerical importance of criminal activities among the millions engaged in informal sector manufacturing, trade and services in Nairobi or in some of the large Asian cities such as Jakarta, for instance, must be small.
In Kenya, the term "'informal sector" was dropped from the official statistics in 1987, and replaced by small-scale enterprises (SSEs). Re- ference is also made to the jua kali sector, literally "hot sun," referring to the fact that many small-scale manufacturing and repair activities are conducted in the open air. Size of establish- ment, measured by numbers employed, is a much more satisfactory criterion. This allows a vertical classification by size among microenterprise (zero to nine employees, with a concentration in all developing countries in the range of zero to four), small enterprise (10-49 employees), medium enterprise (50-99 employees) I and large enterprise (100 employees and over). This also permits consideration of complementarities or linkages among these categories, and the extent of movement between categories, which is much more important from a development policy point of view.-' The informal sector could be taken to refer to the microenterprise category. Such a classification allows simultaneously a horizontal categorization of each size group by sector, manufacturing, trade, etc. We may distinguish
small-scale industrial enterprises (SSIEs) from the broader category of SSEs. SSEs are generally taken to encompass industrial microenterprises as a subcategory. A final advantage is the ease of subdivision according to location between urban and rural SSEs and microenterprises, yielding the separate categories of RSIE (rural small-scale industrial enterprises) and RSE (rural small-scale enterprise), the first a component of the second. Thus establishments can be classified by size, by sector, and by location, with the informal sector covered by the smallest size category.
Defining the rural informal sector is even more problematic than in the urban case. It is often taken as synonymous with the nonfarm activities (NFAs) of rural households, although the latter are not inevitably associated with small-scale establishments. At least NFAs are clearly sepa- rated from the farm (including livestock) activi- ties. Statisticians in Kenya and elsewhere now produce rural household income data separated into farm and nonfarm income, the latter derived from NFAs. Nonfarm employment may consist either of part-time or full-time household or cottage industry, conducted in or near the house- hold, or of employment in independent small establishments located in rural market centers or t o w n s .
Within the rural economy, again, we may distinguish between commercial nonfarm activi- ties and activities yielding nonmonetary house- hold output, other than farm output: activities such as hut building, wood or water collection, and hand processing of staple foodstuffs.
Since many governments currently are con- cerned with promoting rural industry rather than the rural informal sector, some observations may be made here regarding the difference. The term rural industry refers only to location: it is dif- ferent from agroindustry or agro-allied industry, which may be located in rural or urban areas. Rural industry is also a wider category than rural agroindustry since it embraces nonagriculture- linked industry. Rural industry may be either small (including micro) medium or large scale: in contrast, the rural informal sector would include only microenterprises but would cover enter- prises engaged in trade, transport or other services, together with construction. It would exclude, for example, sawmills located in rural areas but employing more than nine persons. There is a question also of what is to be considered as "rural": the majority of enterprises are not totally dispersed but are located in small or large towns or in market centers within rural areas. The size of center at which the location is deemed "urban" rather than "ruraF' is to a great extent arbitrary.
KENYA'S INFORMAL SECTOR 653
3. THE QUANTITATIVE IMPORTANCE OF INFORMAL SECTOR EMPLOYMENT AND
INCOME IN KENYA
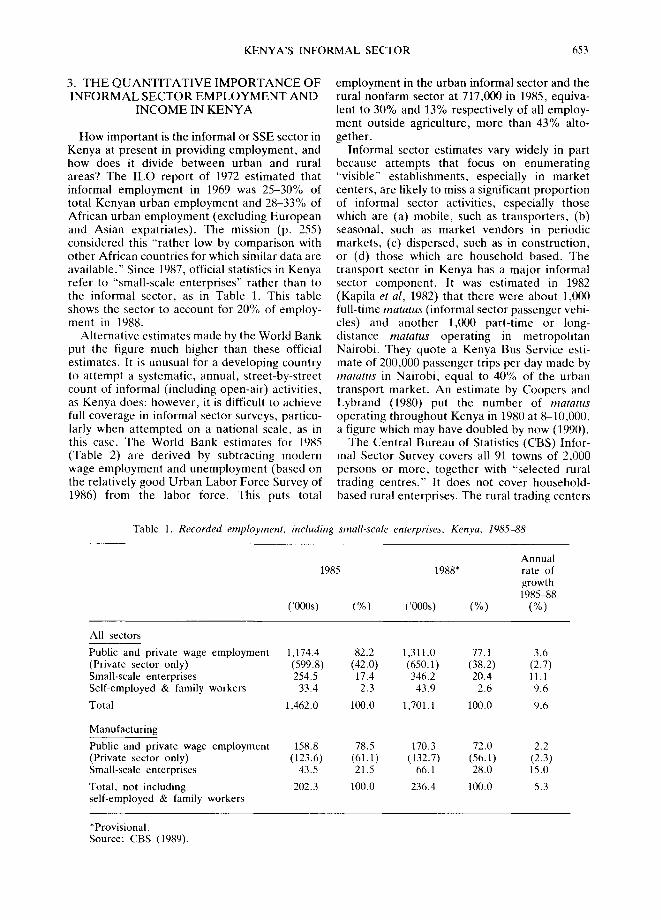
How important is the informal or SSE sector in Kenya at present in providing employment, and how does it divide between urban and rural areas? The ILO report of 1972 estimated that informal employment in 1969 was 25-30% of total Kenyan urban employment and 28-33% of African urban employment (excluding European and Asian expatriates). The mission (p. 255) considered this "rather low by comparison with other African countries for which similar data are available." Since 1987, official statistics in Kenya refer to "small-scale enterprises" rather than to the informal sector, as in Table 1. This table shows the sector to account for 20% of employ- ment in 1988.
Alternative estimates made by the World Bank put the figure much higher than these official estimates. It is unusual for a developing country to attempt a systematic, annual, street-by-street count of informal (including open-air) activities, as Kenya does: however, it is difficult to achieve full coverage in informal sector surveys, particu- larly when attempted on a national scale, as in this case. The World Bank estimates for 1985 (Table 2) are derived by subtracting modern wage employment and unemployment (based on the relatively good Urban Labor Force Survey of 1986) from the labor force. This puts total
employment in the urban informal sector and the rural nonfarm sector at 717,000 in 1985, equiva- lent to 30% and 13% respectively of all employ- ment outside agriculture, more than 43% alto- gether.
Informal sector estimates vary widely in part because attempts that focus on enumerating "visible" establishments, especially in market centers, are likely to miss a significant proportion of informal sector activities, especially those which are (a) mobile, such as transporters, (b) seasonal, such as market vendors in periodic markets, (c) dispersed, such as in construction, or (d) those which are household based. The transport sector in Kenya has a major informal sector component. It was estimated in 1982 (Kapila et al, 1982) that there were about 1,000 full-time matatus (informal sector passenger vehi- cles) and another 1,000 part-time or long- distance matatus operating in metropolitan Nairobi. They quote a Kenya Bus Service esti- mate of 200,000 passenger trips per day made by matatus in Nairobi, equal to 40% of the urban transport market. An estimate by Coopers and Lybrand (1980) put the number of matatus operating throughout Kenya in 1980 at 8-10,000, a figure which may have doubled by now (1990).
The Central Bureau of Statistics (CBS) Infor- mal Sector Survey covers all 91 towns of 2,000 persons or more, together with "selected rural trading centres." It does not cover household- based rural enterprises. The rural trading centers
Table 1. Recorded employment, including small-scale enterprises, Kenya, 198,5-,88
1985 1988"
('OOOs) (%) ('OOOs) (%)
Annual rate of growth 1985-88
(%)
All sectors
Public and private wage employment 1,174.4 82.2 1,311.0 77.1 3.6 (Private sector only) (599.8) (42.0) (650.1) (38.2) (2.7) Small-scale enterprises 254.5 17.4 346.2 20.4 11.1 Self-employed & family workers 33.4 2.3 43.9 2.6 9.6
Total 1,462.0 100.0 1,701.1 100.0 9.6
Manufacturing
Public and private wage employment 158.8 (Private sector only) (123.6) Small-scale enterprises 43.5
Total, not including 202.3 self-employed & family workers
78.5 170.3 72.0 2.2 (61.1) (132.7) (56.1) (2.3) 21.5 66.1 28.0 15.0
100.0 236.4 100.0 5.3
*Provisional. Source: CBS (1989).

654 WORLD DEVELOPMENT
Table 2. The labor force and structure of employment in Kenya, 1985
Total
Rural Urban ('l/{~ls) ('000s) ('000s) (%) (%)
Labor force Unemployment Employment Modern wage employment:
Large agricultural farms Nonagriculture
Total small-scale/informal sector employment Urban informal sector Rural nonfarm employment
Smallholders, intermediate farms, pastoralists Total employment outside agriculture
6,183 1,487 7,670 - - - - 236 236 - -
6,183 1,251 7,434 100.0
241 - - 241 3.2 346 588 934 12.6 213 504 717 9.6
- - 504 504 6.8 213 213 2.9
5,383 159 5.542 94.5 559 1,1)92 1,651 25.5
m
m
56.6 43.4
(3o.5) (12.9)
100.0
Source: World Bank (1988a).
covered by the CBS are only a sample and do not provide a proper est imate of the total size of this component , although they are useful for assess- ing its composit ion.
How much of the informal sector is rural? A World Bank study (1987) suggested that activities based in towns of fewer than 20,000 persons and in market centers (below 2,000 persons) should be considered rural. This category (74 towns, excluding rural trading centers) accounted for a populat ion of 419,000 (18%) out of a total urban populat ion of 2,309,000 in 1979, just 2.7'7, of the total Kenyan populat ion, and would be approxi- mately equivalent to the category of "'other towns" in Table 3 which, looking at total employ- ment, accounts for just over 19% of SSE employment in towns, excluding trading centers. SSE employment does, therefore, appear to be heavily concentrated in urban areas, though not so concentrated in Nairobi and Mombasa as are medium and large enterprises.
If household-based nonfarm activity were in- cluded, the figure would be very much larger. Sessional Paper No. 1 of 1986 gives an estimate for 1984 of 1.3 million full-time and part-t ime workers engaged in nonfarm activities. A CBS survey of rural households in 1977 found that as many as 50% of households were engaged in at least one such activity (including, however , some resource extraction activities which could be counted as primary production), and nearly 25'7, engaged in two or more.
The importance of nonfarm activities as a whole in contributing to rural household income can be assessed by examining household budget data for 1981-82 which has only recently become available. Based on a sample of 6,0(10 house- holds, these data show nonfarm enterprises
income as 16.9% of total income on average, compared with 48.1% for farm income (Table 4). Thus nonfarm activity represents a 35% addition over farm income (with o ther additions from paid employment and remittances, etc).
It is important to realize that this is not income from manufacturing, but from all types of em- ployment. If manufacturing were to account for the same share of the 16.9% as it does of employment enumera ted in the Urban Small- Scale Enterprise Survey, i.e., 17% (discussed below), this would imply that the contribution ot small-scale manufacturing to total rural housc- hold income is just below 3%. This figure would be increased if it were assumed that part of the "paid employment" total comes from the infor- mal sector. If this part is taken as 311% (suggested by World Bank, 1987), however , the share ot manufacturing does not increase significantly, only to about 4%.
The 1981-82 Rural Household Survey also provides data (not reproduced here) showing the contribution of nonfarm to total household in- come by income group. The proport ion is impor- tant across all income groups, but is significantly higher for the income group KShsl ,500 per month and above, and drops to 8% for the lowest income group (below KShs300). The latter includes the landless and the poorest groups, male and female, forced to work as agricultural laborers, without opportunit ies for income sup- plementat ion through NFAs.
4. A N A T O M Y O F T H E U R B A N I N F O R M A L S E C T O R
As ment ioned above, a criterion commonly

Tab
le 3
. P
erso
ns e
ngag
ed i
n ur
ban
smal
l-sc
ale
ente
rpri
se,
by s
ecto
r,
1988
Res
taur
ants
, T
rans
port
&
Com
mun
ity,
so
cial
M
anuf
actu
ring
T
rade
H
otel
s,
etc.
C
omm
unic
atio
n &
pe
rson
al s
ervi
ces
Tot
al
%
Nai
robi
15
,054
M
omba
sa
1,77
2 N
airo
bi/M
omba
sa
16,8
26
Kis
umu/
Nak
uru/
Thi
ka/N
yeri
/Eld
oret
7,
070
11 n
ext
larg
est
tow
ns*
5,60
3 O
ther
tow
ns
8,48
1 T
radi
ng c
ente
rs
1,01
9
Tot
al
38,9
99
Per
cent
age
Nai
robi
/Mom
basa
16
.2
Kis
umu/
Nak
uru/
Thi
ka/N
yeri
/Eld
oret
17
.4
11 n
ext
larg
est
tow
ns
18.8
O
ther
tow
ns
20.3
T
radi
ng c
ente
rs
13.6
Tot
al
17.5
45,1
36
8,37
0 1,
114
13,5
75
83,2
79
37.3
11
,542
3,
570
783
2,41
5 20
,082
9.
0 56
,678
11
,940
1,
927
15,9
90
103,
361
46.3
23
,837
2,
979
470
6,32
6 40
,682
18
.2
16,4
44
1,78
4 47
4 5,
428
29,7
33
13.3
23
,729
2,
284
768
6,49
1 41
,753
18
.7
4,62
6 83
9 10
7 89
6 7,
487
3.4
(sam
ple)
125,
314
19,8
26
3,74
6 35
,131
22
3,01
6 10
0
54.8
11
.6
1.9
15.4
10
0 58
.6
7.3
1.2
15.5
10
0 55
.3
6.0
1.6
18.3
10
0 56
.8
5.5
1.8
15.5
10
0 61
.8
11.2
1.
4 12
.0
100
56.2
8.
9 1.
7 15
.8
100
m
m
Z O
70
),
t-
©
70
*Lar
gest
in
term
s of
rep
orte
d S
SE
em
ploy
men
t.
Sour
ce:
CB
S (u
npub
lish
ed b
).

656 WORLD DEVELOPMENT
Table 4. Sources of rural household income
KShs %
Farm income 399 49.1 Nonfarm enterprise 140 16.9 Salary and wages (paid employment) 177 21.3 Other sources (remittances & other gifts) 114 13.7
Total 829 100
Source: CBS (unpublished a).
applied to de te rmine whe the r an activity or enterpr ise falls within the informal sector is its compliance or noncompl iance with minimum wage legislation and the like. U n d e r this defini- t ion, we would certainly have to include in the informal sector all those engaged in wholesale
and retail trade: this is indeed the choice made by official statisticians in Kenya. It is not generally realized, however , what a major difference this makes in terms of numbers . As shown in Table 5, about 56% of SSEs were engaged in wholesale or retail t rade, compared with only 17% in manu- facturing. Annual data f rom the CBS Informal Sectoral Survey show the share of trading estab- l ishments as a constant 54-56% from 1978 to the present .
In r ecommending policy, it is impor tant not to limit a t tent ion to small-scale manufactur ing en- terprises, especially if the object ive is employ- ment creation. This is even more the case if women are viewed as a particular target group, as their employment is especially concent ra ted in t rade and services, i .e . , in nonmanufactur ing SSEs. As shown in Table 5, less than 10% of female SSE employment was in manufactur ing in 1988, compared with 75% in trade, and nearly 85% in trade and catering combined. Obviously,
Table 5. Persons engaged in the urban small-scale enterprises sector, 1988
Male Female Total % of No. No. % No. % Manufacturing
Total, small scale enterprise 143,841 79,175 100 223,016" 1011
Manufacturing 31,543 7,751 9.8 39,294 17.6
Grain mill products 673 148 - - 821 (1.4 Weaving & finishing textiles 11 1,360 1.7 1,371 0.6 Wearing apparel 8,552 5,911 7.5 14,463 6.5 Footwear, not plastic 3,111 21 - - 3,132 1.4 Furniture, except metal 9,41/3 51 - - 9,454 4.2 Structural metal products 2,672 116 - - 2,788 1.2 Fabricated metal products,
except machinery 6,385 119 - - 6,504 2.9 Other 736 25 - - 761 0.3
Wholesale/retail trade 66,096 59,248 74.8 125,344 56.2
Restaurants, cafes, other eating & drinking places 11,743 7,687 9.7 19,430 8.7
Supporting services to land transport 3,746 - - - - 3,746 1.7
Community, social & personal services 31,023 4,179 5.3 35,2112 15.8
Repair of footwear 5,895 59 - - 5,954 2.7 Repair of motor vehicles &
cycles 7,891 7 - - 7,898 3.5 Watch, jewelry repair 2,492 9 - - 2,5111 1.1 Other repair 4,817 186 - - 5,11113 2.2 Barber & beauty shops 2,361 3,547 4.5 5,9118 2.6 Other services 8,968 371 - - 9,339 4.2
100
2.1 3.5
36.8 8.0
24.1 7.1
16.6 1.9
*Omits 40 persons engaged in construction engaged in construction is excluded. Source: CBS (unpublished b).
in Nairobi: it is not worth including these when the bulk ol persons

KENYA'S INFORMAL SECTOR 657
trade plays an important role in facilitating production and exchange: but it is a different role from that associated with the common under- standing of the informal sector. This distinction is therefore a primary one, and failure to make it can result in misleading conclusions.
The dominance of the trade and service sectors within the informal sector is not just a Kenyan phenomenon. Referring to Webb's study in Peru (1973), Merrick's work in Brazil (1976), Moir's survey in Jakarta (1978), and the Marga Insti- tute's results for Colombo (1978), House (1978) found that these "all confirm that the sector is largely made up of traders and suppliers of services," although this rather overstates the case.
Within manufacturing the most important acti- vities are, in order, tailoring (wearing apparel), woodworking, and metalworking, together accounting for 77% of persons engaged in manufacturing, excluding repair: not an immedi- ately impressive collection, though this might depend on the detailed content of the fabrication/ metalworking category. Inclusion of repair activi- ties would increase the amount of employment in the manufacturing sector by 54%. While repair may be a useful source of employment and a form of appropriate technology and appropriate goods supply in a low-income country, it is clearly "nondynamic" and likely to fall in import- ance with rising incomes.
The overwhelming proportion of SSEs in Kenya, as in many developing countries, consists of microenterprises and specifically of enterprises with only one or two employees. In 1987 in Kenya, there were 5,648 establishments em- ploying 10-49 persons, which can be compared with 153,000 establishments in main towns only counted in the CBS urban small enterprises survey in 1988. Corresponding figures for manu- facturing alone were 705 and 21,000. The differ- ence in terms of employment is less wide: in 1987 employment in establishments with 10~9 per- sons was given as 131,150 (17,232 in manufactur- ing), which may be set against the estimates in Table 2 of 504,000 for the urban informal sector (in 1985) and 717,000 if rural nonfarm employ- ment is added.
The ratio of employees to employers is very small in the microenterprises sector: in the CBS survey for 1988 the number of persons engaged per establishment was only 1.23, and 1.75 in manufacturing. This ratio does not differ be- tween a city such as Nairobi and other towns, the figures for these being 1.8 and 1.6 respectively. Other surveys of urban and rural informal sector enterprise in Kenya have yielded almost identical figures.
5. A N A T O M Y OF THE R U R A L I N F O R M A L SECTOR
Following our discussion of what constitutes rural industry and the rural informal sector, which referred to the size of the town or market center in which the activities are located (other than household-based part-time activities), we can compare first the structure of the small enterprises sector in cities, towns, and market centers, referring back to Table 3. There is very little difference in the share of trade, manufactur- ing and services according to size of town, although in trading centers the share of manu- facturing is lower and those of trade and catering both higher than for towns.
If we look specifically at the composition of SSE manufacturing by size of town/rural center (Table 6) we find this again is fairly constant, independent of the size of town; with tailoring the most important, followed by metalworking and woodworking (furniture), with footwear fourth. Tailoring is relatively more important in Nairobi, however, probably reflecting the less bulky nature of the product and thus increased competitiveness of urban-based SSEs in this activity.
A recent survey of SSEs in selected smaller towns and rural centers in Western Kenya, all centers here being below 2,000 population size, is also classified by size of center (Table 7). The main feature revealed, other than those already commented on, is the much greater relative importance of services, including all kinds of repair, in the larger rural centers and towns, and the comparative absence of these in the smaller market places.
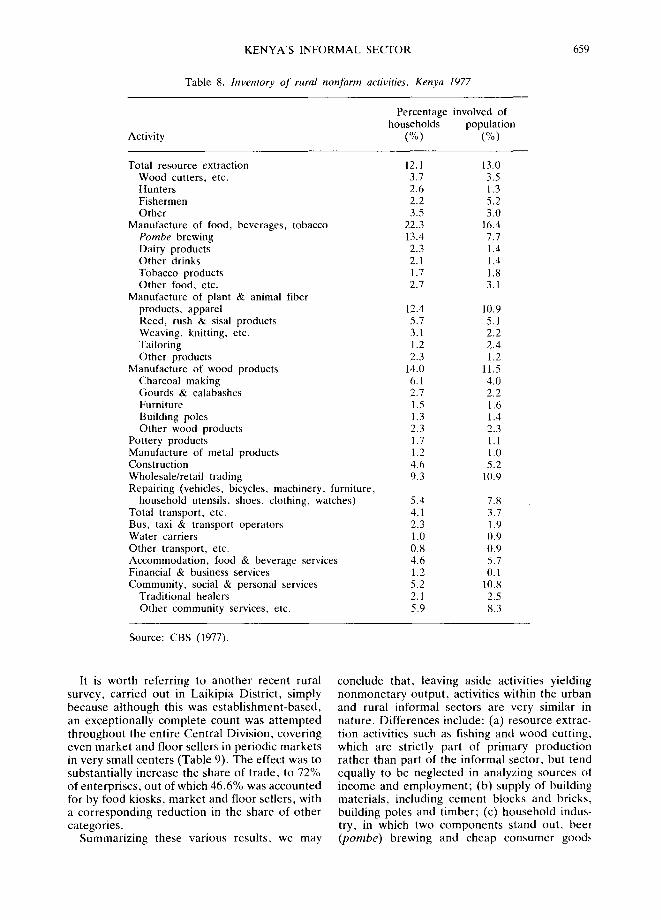
As mentioned previously, informal sector sur- veys are generally incomplete, omitting in parti- cular dispersed activities and household-based activities. Evidently, this will affect descriptions of rural activities most. To gain a better picture that includes the household sector, it is worth examining the results of the 1977 survey of rural nonfarm activities (Table 8) which was based on a household count rather than establishment enumeration. About 12% of households were involved in resource extraction activities, which could be classified with farming as primary production. There are a number of activities which appear significant but do not gain mention in surveys of urban SSEs: pombe (beer) brewing (13% of households), reed, rush and sisal pro- ducts, especially mats and bags (nearly 6% of households), gourds and calabashes, charcoal making (6%), building poles (also grown now as a high-value cash crop), construction (4-5%), water carriers, and traditional healers.

658 W O R L D D E V E L O P M E N T
T a b l e 6. Composition o f informal sector manufacturing, by size of town, 1988
W e a r i n g S p i n n i n g , a p p a r e l , w e a v i n g &
e x c e p t F o o t w e a r , W o o d e n M e t a l f i n i s h i n g f o o t w e a r n o n p l a s t i c f u r n i t u r e p r o d u c t s t e x t i l e s O t h e r
% o f p e r s o n s e n g a g e d N a i r o b i 40. l 8 .0 21 .5 2 2 . 6 4 ,8 3.1
K i s u m u / N a k u r u / T h i k a / N y e r i / E I d o r e t 3 3 . 6 8 .2 24 .2 2 8 . 4 2 .3 3 .4 11 n e x t l a r g e s t t o w n s 3 3 . 9 7 .3 24 .7 2 7 . 3 2 .8 2 .4
O t h e r t o w n s 34 .7 8 .2 28 .7 19.8 2 . 6 6 .0 T r a d i n g c e n t e r s 26 .3 10.8 1(I.8 31 .5 2 .3 8 .3
T o t a l 36 .5 8 .0 24 .0 24.(t 3 .5 4.1
S o u r c e : C B S ( u n p u b l i s h e d b) .
"Fable 7. Distribution of establishments' by activity and by size of rural center* located in a s'urvey of rural western Kenya, 1988
L a r g e r u r a l M e d i u m - s i z e d c e n t e r s & t o w n s r u r a l c e n t e r s
N o . % N o . %
S m a l l e r m a r k e t p l a c e s T o t a l
N o . % N o . %
M a n u f a c t u r i n g 177 20.1 82 24.1 25 22.1 284 21 .9
Posho mil l s 27 - - 11 - - 6 - - 44 3 .4 S l a u g h t e r h o u s e s 1(1 - - 1 2 - - 13 1.0
H i d e s / s k i n s 3 - - 3 - - 2 - - 8 0 . 6 T a i l o r i n g 57 36 8 - - 101 7 .8 S h o e m a k i n g 14 I 7 - - 1 - - 22 1.7
C a r p e n t r y 41 18 - - 6 - - 65 5 .0 M e t a l W o r k i n g 25 - - 6 - - I 31 2 .4
T r a d e / c a t e r i n g 576 65 .5 231 67 .9 47 6(I.3 854 65 .8
G e n e r a l r e t a i l 308 139 - - 26 - - 473 36 .4
B u t c h e r s 42 - - 17 7 66 5. l O i l / P e t r o l 12 - - 6 - - - - 18 1.4 Textile/clothing/shoe/dukas 44 - - 3 - - - - 47 3 .6
H a r d w a r e / w h o l e s a l e 38 - - 6 - - 2 - - 46 3 .5 M a i z e m e r c h a n t s 2(I - - 11 I 31 2 .4
O t h e r r e t a i l 12 - - 1 - - I __ 13 1.0
H o t e l s / b a r s 100 - - 48 - - 12 - - 16(1 12.3
S e r v i c e s t 2 7 14.4 27 7 .9 6 7 .7 160 12.3
F o o t w e a r r e p a i r 24 - - 9 - - 2 - - 35 2 .7 E l e c t r i c a l r e p a i r 13 6 - - - - 19 1.5 M o t o r r e p a i r 10 . . . . . 10 (1.8 B i c y c l e r e p a i r 6 I 2 - - - - 8 0 . 6 O t h e r r e p a i r 36 - - - - - - 2 - - 38 2 .q L a u n d r i e s 3 . . . . 3 (I.2 B a r b e r s 8 - - - - - - £ 11.6
P h o t o s t u d i o s 11 - - 2 - - - - 13 1.11 P r i v a t e c l in ics 16 8 - - 2 - - 26 2 .0
T o t a l N = 880 100 34t) 100 78 100 1,298 10t)
* R u r a l c e n t e r s i n c l u d e d a r e K e r o k a , K e n y e n y a , O g e m b o , K i a n m k a m a , M a g e n c h c , I b a c h o , R w k m d o ( K i s i i D i s t r i c t ) S c r e m , H a m i s i , B a n j a , Sencnde a n d K i n u ( K a k a m e g a D i s t r i c t ) a n d S o n d u , S o s i o t , K i p t e r e , a n d K e b e r n e t ( K e r i c h o D i s t r i c t ) , all c e n t e r s w i t h p o p u l a t i o n s b e l o w 2,11110 ( i . e . , " ' o t h e r t o w n s r u r a l " in t h e C B S I n f o r m a l S e c t o r S u r v e y c l a s s i f i c a t i o n ) .
S o u r c e : A g g r e g a t e d f r o m B i l l e t o f t ( 1989 ) , T a b l e s 6 .6 , 6 .7 , 6 .8 .
KENYA'S INFORMAL SECTOR
Table 8. Inventory of rural nonfarm activities, Kenya 1977
659
Activity
Percentage involved of households population
(%) (%)
Total resource extraction 12.1 13.0 Wood cutters, etc. 3.7 3.5 Hunters 2.6 1.3 Fishermen 2.2 5.2 Other 3.5 3.0
Manufacture of food, beverages, tobacco 22.3 16.4 Pombe brewing 13.4 7.7 Dairy products 2.3 1.4 Other drinks 2.1 1.4 Tobacco products 1.7 1.8 Other food, etc. 2.7 3.1
Manufacture of plant & animal fiber products, apparel 12.4 10.9 Reed, rush & sisal products 5.7 5.1 Weaving, knitting, etc. 3.1 2.2 Tailoring 1.2 2.4 Other products 2.3 1.2
Manufacture of wood products 14.0 11.5 Charcoal making 6.1 4.0 Gourds & calabashes 2.7 2.2 Furniture 1.5 1.6 Building poles 1.3 1.4 Other wood products 2.3 2.3
Pottery products 1.7 1.1 Manufacture of metal products 1.2 1.0 Construction 4.6 5.2 Wholesale/retail trading 9.3 10.9 Repairing (vehicles, bicycles, machinery, furniture,
household utensils, shoes, clothing, watches) 5.4 7.8 Total transport, etc. 4.1 3.7 Bus, taxi & transport operators 2.3 1.9 Water carriers 1.0 0.9 Other transport, etc. 0.8 0.9 Accommodation, food & beverage services 4.6 5.7 Financial & business services 1.2 0.1 Community, social & personal services 5.2 10.8
Traditional healers 2.1 2.5 Other community services, etc. 5.9 8.3
Source: CBS (1977).
It is worth referring to another recent rural survey, carried out in Laikipia District, simply because although this was establishment-based, an exceptionally complete count was at tempted throughout the entire Central Division, covering even market and floor sellers in periodic markets in very small centers (Table 9). The effect was to substantially increase the share of trade, to 72% of enterprises, out of which 46.6% was accounted for by food kiosks, market and floor sellers, with a corresponding reduction in the share of other categories.
Summarizing these various results, we may
conclude that, leaving aside activities yielding nonmonetary output, activities within the urban and rural informal sectors are very similar in nature. Differences include: (a) resource extrac- tion activities such as fishing and wood cutting, which are strictly part of primary production rather than part of the informal sector, but tend equally to be neglected in analyzing sources of income and employment ; (b) supply of building materials, including cement blocks and bricks, building poles and t imber; (c) household indus- try, in which two components stand out, beer (pombe) brewing and cheap consumer goods

~ 0 W O R L D D E V E L O P M E N T
T a b l e 9. Inventory of small-scale enterprises in Central Division, Laikipia District, 1986
O t h e r T o t a l N a n y u k i c e n t e r s No . %
C a r p e n t e r / j o i n e r 25 18 43 - - B l a c k s m i t h / t i n s m i t h 13 9 22 - - M a s o n 1 - - 1 - -
S l a u g h t e r h o u s e 1 14 15 - - Posho mill 6 17 23 - - Sawmi l l 5 4 9 - - Ta i lo r / t ex t i l e s 27 13 40 - - S h o e m a k i n g 13 1 14 - - K n i t t i n g 16 9 26 - -
T o t a l , m a n u f a c t u r i n g 108 85 193 9 .4
M o t o r r e p a i r / g a r a g e 22 2 24 - - Bicyc le r e p a i r 7 5 12 - - E lec t r i ca l r e p a i r 1 - - 1 - -
S h o e r e p a i r 22 12 34 - - T a i l o r i n g r e p a i r 19 16 35 - - W a t c h / r a d i o r e p a i r 8 2 1(1 - -
T o t a l r e p a i r 79 37 116 5 .7
W h o l e s a l e r s 19 5 24 - - F o o d / v e g e t a b l e re ta i l 177 126 303 - - B u t c h e r i e s 42 34 76 - - Miraa/tobacco s h o p s 10 10 2(I - - - C h a r c o a l se l l ing 36 13 49 - - O t h e r re ta i l s h o p s 46 4 50 - - P e t r o l s t a t i o n s 7 2 9 F o o d k iosks 49 29 79 M a r k e t stal l , f o o d / v e g e t a b l e s 26(I 127 387 O t h e r stal ls 81 35 116 46 .6 F l o o r se l lers , f o o d / v e g e t a b l e s 280 64 344 F l o o r se l lers , o t h e r - - 20 20
T o t a l , t r a d e 1,018 470 1,488 72.5
B o a r d & l o d g i n g 21 7 28 - - R e s t a u r a n t / H o t e l 46 26 72 - - T e a r o o m 30 37 67 - - B a r 23 26 49 - -
T o t a l , c a t e r i n g & a c c o m m o d a t i o n 1211 96 216 1(I.5
L a u n d r y / c l e a n i n g 9 - - 9 - - H a i r d r e s s i n g / b a r b e r 13 4 17 - - S h o e sh ine 14 14 - -
T o t a l se rv ices ,* incl. c a t e r i n g & a c c o m m o d a t i o n 156 100 256 12.5
T o t a l , all e s t a b l i s h m e n t s 1,361 692 2 ,053 10(1
*Exc ludes d o m e s t i c s c r v a n t s , p ro s t i t u t e s , bee r b r e w i n g . Sou rce : Le i s e r (19871.

KENYA'S INFORMAL SECTOR 661
based on local materials, such as mats, baskets, gourds, calabashes and goatskins; (d) supply of fuel and water to rural households, i .e., charcoal making and water carrying, though these may extend into urban areas; and (e) market vending. A difference in small rural trading centers is the limited presence of repair and other service activities.
6. E A R N I N G S IN T H E I N F O R M A L S E C T O R
Not a great deal of information is available on the level of earnings among SSEs in Kenya: most of that which is available relates to the urban informal sector and is limited to microenter- prises. The evidence is that within the urban microenterprise sector there is a wide spread of earnings but that the average level compares quite satisfactorily with minimum wages and with a good deal of employment in the formal sector, while at the upper end earnings can be high. House ' s mid-1977 survey of 577 informal sector enterprises in Nairobi brought out the lack of homogenei ty in the sector (House, 1978). Thus the average weekly income in auto repair was more than 10 times that in shoe repair. There
was, on the o ther hand, a spread of earnings within individual activities, with a proport ion of very low earners in each trade; even in auto repair 35% of workers earned less than the minimum wage. A more recent survey carried out by the ILO (Aboagye, 1986) provides infor- mation on entrepreneurial earnings in urban informal sector activities in Nairobi, Mombasa and Kisumu (Table 10). 3
Information with respect to rural enterprises is given in a report by Ng 'e the et al. (1989) covering four districts, Nyeri (Central Province), Meru (Eastern Province), Siaya (Nyanza Province) and Uasin Gishu (Rift Valley Province). The enterprises covered included trade and services as well as manufacturing: in fact it is important to note that only 16% of establishments sampled were engaged in manufacturing, 69% in trade. Since the number of persons engaged per estab- lishment was only 1.5 to 2 (Table 11), value added per person engaged is a good indicator of the level of monthly earnings. These were very low in two districts compared with the others, the figure for Uasin Gishu being just 27% of that for Nyeri and that for Siaya just 33%. This indicates quite major differences in the lucrativeness of nonfarm activities between districts, with very high earnings in Central Province, nearly four
Table 10. Distribution of entrepreneurial earnings in urban informal sector activities, Nairobi, Mombasa and Kisumu. 1985
Monthly Wood Food Textile, Metal Earnings processing processing leather fabrication Garage Services All (KShs) % % % % % % activities
Nil 2.6 32.0 . . . . 2.3 1-200 3.9 4.0 6.2 3.2 - - - - -3.4 201-400 6.4 8.0 3.1 6.4 2.6 14.3 4.3 401q500 8.9 8.0 22.9 20.4 7.9 10.2 15.9 601-800 20.5 4.0 11.5 13.4 15.8 28.6 15.5 801-1,000 11.5 10.0 29.2 22.3 18.4 16.3 20.7 1,001-1,500 28.2 12.0 13.5 19.8 29.0 14.3 19.8 1,501-2,000 11.5 8.0 6.2 10.8 5.3 10.2 9.4 2,001-3,000 6.4 4.0 7.3 7.0 13.2 2.0 6.7 3,001 + - - - - - - 2.6 7.9 4.1 2.0 Total 100 100 100 100 100 100 100
Median (KShs) 934 550 843 859 1,091 778 883
Mean earnings: Nairobi 1,093 1,187 988 1,291 1,958 912 1,183 Mombasa - - 1,013 1,116 1,668 1,088 867 1,110 Kisumu 1,122 - - 733 1,258 1,056 1,017 1,148
Earnings of workforce: Nairobi 531 632 619 645 536 439 567 Mombasa - - 640 646 862 600 477 657 Kisumu 548 - - 580 527 686 604 630
Source: Aboagye (1986).

662 WORLD DEVELOPMENT
Table 11. Value added in rural in]brmal sector establishments, 1986
District*
Mean value Value added Gross output per added per pcr person
Mean no. establishment establishment engaged of persons (KShs) (KShs) (KShs)
engaged per month per month per month
Nyeri 1.5t) 14,401.5 3,092.3 2,062 Meru 2.(16 12,936.0 2,491.3 1,209 Siaya 1.86 10,453.7 892.4 4811 Uasin Gishu 1.825 9,152.0 1,026.7 563
*The minimum wage outside Nairobi/Mombasa in June 1987 was KShs.589. Source: Ng'cthe et al. (1989).
times the minimum wage level outside Nairobi and Mombasa. In turn, the variation would seem to confirm what one would have anticipated, that the level of agriculture incomes, i.e., the richness of the underlying agricultural economy, is the principal determinant of the scope for nonfarm act iv i t ies) This link would tend to follow, of course, from the fact that the majori ty of rural people are engaged in agriculture, and that trade accounts for more than half of employment in the nonfarm sector.
Ano the r recent rural survey, of 129 rural enterprises in western Kenya, mostly in manufac- turing and repair (Billetoft, 1989), shows a bimodal distribution of monthly entrepreneurial income (probably the result of sampling): 49.6% earning less than KShsl,(J00 in 1988, and 24.4% more than KShs2,000 (14.3% above KShs 3,000). The greatest scope for high earnings was in metalworking (36% above KShs2,000) and carpentry (27% above) , while the largest propor- tion of low-income earners was in tailoring (64% below KShsl ,000) and shoemaking (67% be- low), all based on very small samples. As Billetoft points out, tailoring and shoemaking are those trades which have been most exposed to competi t ion from urban-based, mass-produced goods.
7. " ' D I V I D E D I t O U S E t t O L D S ' " A N D T H E I M P L I C A T I O N S F O R T I l E I N F O R M A L
S E C T O R
In understanding the role of both urban and rural nonfarm activities, it is important to bring out one factor which has been entirely neglected in the past, the importance of so-called female- headed households. According to the t tousehold Budget Survey of 1981-82, 16 out of 30 districts covered had proport ions of female-headed households between 29 and 49%. Weighted by
population, the overall proportion was as high as one-third female-headed households.
From the numbers inw~lved, it is evident that these do not refer necessarily to widowed or single women, but in the main to what are better referred to as "'divided households," in which the husband (in some cases other male members of the household) is seeking to augment family income through nonfarm activity in an urban area or local town, while the wife and rest of the family at tempt to maintain the farm component of income. A comparison of the level and composit ion of male- and female-headed house- holds, again based on the 1981 82 Rural t]ouse- hold Survey, reveals the importance of compar- ing income per adult rather than per household since, with the husband away m one case, household sizes will differ. This shows that, overall , there was not such a big difference in income per head; " ' female-headed households" benefit from "'other income" in the form ot remittances, the objective of the husband's ab- sence being to send such remittances home. A more detailed breakdown of households shows that, within the broad category of female-headed households, those headed by married women secure substantially higher aggregate incomes than those with widowed or separated heads, a large part of the difference being due to remitt- ances, l | ouseholds headed by separated women had much lower in-kind farm income, half the remittances, and depended in a major way on employee income, probably in large part as cheap agricultural labor. More commonly, what we have are "'divided households" dependent on income from two sources, rural and urban.
The absence of a proport ion of male workers has been identified recently in a World Bank report (World Bank, 198,9) as the cause ot agricultural labor scarcity in parts of rural Kenya. For the moment , we may note a number of implications with respect to the nonfarm sector.

KENYA'S INFORMAL SECTOR 663
First, there [nay be some real competition for labor time between nonfarm activities and farm- ing, though this may vary between ecological zones and districts, and with the proportion of divided households.
Most significantly, it would appear that returns to labor at the margin in the two sectors are being closely assessed by households and that the return to labor in the nonfarm sector generally is higher, inducing labor to transfer on quite a significant scale. This represents a rather new perspective on the informal or small-scale enterprise sector. Given the high proportions of divided house- holds, it suggests a very strong interdependence between rural and urban activities in supporting Kenyan households.
8. SSE GROWTH: THE "MISSING MIDDLE" OF MODERN SSEs AND THE EXPANSION OF MICROENTERPRISE
If we are looking to the informal sector to contribute to the dynamic growth of the eco- nomy, it is natural to consider whether informal enterprises operating within the microenterprise sector have themselves managed to expand and evolve into "modern" SSEs employing larger numbers of people. A recent World Bank report (World Bank, 1987) points to what is seen as a major weakness of Kenyan industrial develop- ment, an "extreme paucity" of modern, small- scale manufacturing establishments above the microenterprise category, i.e., employing 1(~49 persons. The report compares the share of manufacturing employment in this category with- in total manufacturing employment in establish- ments employing 10 or more persons in Kenya (14% in 1976, 12% in 1984) and, for example, Nigeria (63°/,, in 1972), Indonesia (30% in 1977) and Jamaica (25% in 1978).
While in part this reflects the more developed manufacturing sector in Kenya, and hence more large-scale production than in some of these countries, it is also likely to reflect biases of macroeconomic policy and industrial strategy favoring large-scale production techniques. It also shows a more unequal income distribution, in the past due to a substantial expatriate population, and now with major rural-urban and formal-informal divisions, producing segmented markets for formal (large-scale) and informal (microenterprise) sector goods and services.
In support of the thesis of "the missing middle" of modern SSEs, statistics for the period 1979-87 show that while there was an increase in the number of manufacturing establishments in the range of 10-19 employees, the number in the
category 20~9 persons was actually lower in 1987 than in 1979 (Table 12). Over the whole size range during 1983-87, the annual employment growth rate was no more than 1.1%. Rather than counting against informal sector promotion, however, this points to particular difficulties in development within this large-sized category at the present time. This is reflected no doubt in the rather unsuccessful attempts by Kenya Industrial Estates (KIE) to promote formal sector manufac- turing SSEs in Kenya. It also demonstrates the need to give proper consideration to the micro- enterprise sector. The wide variation in average earnings noted above is indicative of potential here, albeit strongly influenced by the level of agricultural incomes. It might be noted that the main activities appearing in the "'modern" SSE sector are very similar to those in the microenter- prise sector: wearing apparel, metal products, wooden furniture, and food products, including bakeries. Exceptions are printing, railroad equip- ment and chemicals and paints.
In considering growth in the informal or microenterprise sector, we need to distinguish growth in aggregate employment, which may occur through increases in the number of enter- prises, and growth and development of individual enterprises within the sector, reflected in in- creases in numbers employed, capital, or de- velopment in technology or product. The data referred to earlier (Table 1) suggest that the (very) small-scale enterprise sector has seen a remarkably high rate of growth in aggregate employment, amounting to 11% per year over the period 1985 88. This contribution to employ- ment is immensely important since, at the same time, modern sector employment has grown relatively slowly, at only 3.9% per year. Modern private sector employment has grown even more slowly, at 2.7% with the public sector expanding more than in proportion, reflecting its role as an employer of last resort.
Despite this aggregate growth, there has been comparatively little growth of individual enter- prises. The vast majority are at the bottom end of the microenterprise category, employing only one or two persons, as would be deduced from the mean size of establishment indicated earlier. The sector expands not as a result of establish- ments hiring more people (changes in capital assets are discussed presently) but as a result of an increase in the number of self-employed. Thus outside his "Intermediate Sector," 80-85% of establishments in House's urban survey (House, 1981) employed the same number or fewer as when they started. Turnover is rapid and many enterprises are ephemeral: in a survey of rural enterprises in Central Province by Norcliffe and

Tab
le
12.
Num
bers
of
"m
oder
n"
srna
ll-sc
ale
man
ufac
turi
ng
esta
blis
hmen
ts,
1979
-87
Act
ivit
y
No
. o
f em
plo
yee
s ('
00
0s)
N
o.
of
esta
bli
shm
ents
N
o.
of
esta
bli
shm
ents
es
tab
lish
men
ts
wit
h
10
-49
1
0-1
9
per
son
s 2
(>4
9
per
son
s p
erso
ns,
in
crea
se
1979
19
83
1987
19
79
1983
19
87
1983
19
87
198_
3-87
19
87
(%)
Wea
rin
g
app
arel
, ex
cep
t fo
otw
ear
--
21
Wo
od
en
furn
itu
re
--
14
Met
al
pro
du
cts
--
49
Mac
hin
ery
22
R
ailr
oad
eq
uip
men
t --
16
P
rin
tin
g
--
37
S
awm
ills
--
15
C
hem
ical
s,
pai
nts
, et
c.
--
20
Bak
erie
s --
15
G
rain
m
ill
pro
du
cts
--
2 D
airy
p
rod
uct
s --
8
Oth
er
foo
d
pre
par
atio
n
&
pro
cess
ing
--
13
O
ther
--
41
To
tal
259
273
Av
erag
e an
nu
al
rate
o
f in
crea
se
(%):
--
--
28
51
38
1,91
4 1,
793
211
20
--
29
24
2,27
1 90
2 -1
39
34
67
4(
1 1,
891
1,71
5 -1
76
28
--
30
26
1,
239
1,29
3 54
21
--
33
30
1,
248
1,23
9 -9
46
--
36
38
1,
575
1,78
5 21
0 29
26
25
1,
004
1,17
2 16
8 28
--
22
26
99
2 1,
208
216
19
7 12
41
0 62
3 21
3 2
--
5 2
196
95
-10
1
0 4
1 20
(/
46
154
10
23
41
1,02
4 1,
801
777
64
--
59
73
2,5
32
3
,56
0
1,02
8
329
397
4(13
37
6 16
,496
17
,232
73
6
..
..
..
I.
10.4
5.
2 10
.0
7.5
7.2
10.4
6.
8 7.
0 3.
6 0
.6
0.3
10.5
2
0.7
100
©
t-
.<
(--
©
Z
So
urc
e:
CB
S
(198
4 an
d
1988
).

KENYA'S INFORMAL SECTOR 665
Freeman (1979), the median enterprise was three years old and the modal establishment one year old. In the survey carried out by Ng'ethe et al. (1989), 85% of workers had worked only one or two years in their enterprises, while in Leiser (1987) enterprises were reported as "mostly fairly recent." Accordingly, expansion of the sector is via a net increase in the number of self-employed and their assistants.
The situation is not entirely stagnant at the enterprise level, though any movement in terms of numbers employed is from 1-2 persons up- wards within the microenterprise sector: any search for informal enterprises "graduating" from the ranks of the self-employed is largely misdirected, though some informal sector enter- prises may not start as microbusinesses. In an early survey in Bungoma and Meru districts (Williams and McClintock, 1979) covering over 2,000 l i censed establishments, a large majority, 76-78%, employed 1-3 persons. Some 7-8% employed 6-10 persons, and just under 2% employed more than 10. Within the urban informal sector, the "intermediate sector" of more substantial units has a more significant employment effect, as is evident from House (1981): in this sector 20% had shown "large" increases in numbers employed since their incep- tion. All three categories - - the intermediate sector, a middle sector, and the "community of the poor" category - - had expanded significantly in terms of capital, 10-fold in the first case, but six or seven times in the other two.
9. DYNAMIC SECTOR OR URBAN LABOR "SPONGE"?
A less optimistic view sees the informal sector as a last resort for people without alternatives, i.e., as a residual urban labor "sponge." Certain- ly it is possible that average earnings in the sector are adequate, but marginal earnings much less so as diminishing returns set in. Thus growth in the number of establishments only means more self- employed, with more competing in the same market, not real growth in the sector. This could also mean that recession in the formal sector increases the numbers in the informal sector but again leads to income-sharing. This question of marginal productivity has not gained close atten- tion, although it has been raised in a theoretical way by Mazumdar (1976). Mazumdar produced a two-sector model of an urban economy which yields the prediction that the income differential between the formal and informal sectors will widen over time as informal sector income is shared among an ever-growing informal sector
labor force. The same phenomenon could apply in the rural areas with respect to nonfarm activities and indeed is likely to apply there more directly. In all developing countries it appears that the greatest degree of competition, and the lowest level of return to labor, is among women's cottage industries such as beer brewing or mat making. In the basic trades, intense competition is particularly evident in tailoring, reducing the level of earnings (McCormick, 1988) while tracer studies (Caplen, 1981; Keter, 1988) indicate oversupply in the rural areas of carpenters and other products of the village polytechnics, with leavers unemployed or on their parents' farm, not using acquired skills. q
Calculations by the World Bank (1987) for the period 1978-85 give the elasticity of urban modern sector employment with respect to GDP as 0.94, but with respect to private formal sector employment as only 0.49 and public sector employment as 1.48, with that for public adminis- tration (where diminishing returns certainly exist) as 2.09. The elasticity of modern sector manufacturing wage employment with respect to manufacturing value added was 0.66, with those for private employment at 0.51 and public em- ployment as 1.22. In contrast, the elasticity of informal sector employment for the period 1981- 85 with respect to GDP can be estimated as 2.87. 5 In an earlier period, similarly, House estimated that the proportion of the Nairobi labor force in formal sector jobs fell from 88 to 56% over the period 1964-72.
It does appear that in Kenya at least the informal sector has been capable of growing independently of the formal sector and without any obvious change in the level of average earnings. The most important stimulating factor has probably been rising agricultural incomes and urban as well as rural purchasing power. One should not expect the sector inevitably to absorb additions of labor without problems, any more than one would expect this of agricultural land, other things being the same: in each country it is likely to require a balance between these addi- tions and the capacity of the informal sector to absorb more without reducing incomes.
10. THE WEAKNESS OF EXISTING LINKAGES AND THE NEED FOR TECHNOLOGICAL UPGRADING
Sectors with substantial linkages to others are likely to contribute more to development than just the immediate value added and employment they generate. The microenterprise sector offers many potential linkages between formal/large-

,566 WORLD I)EVEI.OPMENT
scale and informal/small-scale sectors, urban and rural sectors, and with the agricultural sector. There are substantial forward linkages from agriculture toward SSEs in Kenya, particularly in the areas of processing and trade, while much of the rural SSE production of consumer goods and services is demand-linked to agricultural earn- ings. A major structural factor limiting SSIE development in Kenya, however, is the virtual absence of backward linkages from agriculture, as suggested by data from the Rural Nonfarm Survey of 1977 (Table 8). SSE activities forward- linked from agriculture (31%, including about 5% from trade) and natural resources (33%) together account for 64% of total activities. Demand-linked consumer goods and services account for 28%, with backward linkages leading SSEs to supp(v agricultural producers amounting to no more t/ran 1.5%.
These backward linkages appear generally much weaker in Africa than in Asia. In Pakistan, for example, agro-oriented industries (not just small-scale) including fertilizers, tractors, agri- cultural implements, thrcshcrs, tubewells and surface pumps, accounted for 10% of manufac- turing output in 1986-87 (Choudhury, 1988). In Asia, there is widespread usc of irrigation pumps, for example. The transport sector, in the form of trucks and buses, is more developed, generating an elaborate network of metal and welding workshops throughout the rural areas. Thus "'in Bangladesh, even in small villages, they employ a remarkable number of lathe machines, drilling bores, and electrical welding equipment, representing an enormous potential for furthcr development of small enterprises" (}taan, 1989). Evidently the development and level o f techno- logy in agriculture is critical in determining thc extent of linkages. To explain the limited extent of backward linkages from agriculture in Kenya, we can refer to information from the Rural Household Budget Survey of 1981-82, which showed that, for example, only 12% of rural households owned even a plough.
11. A G G L O M E R A T I O N OF INFORMAL SECTOR ENTERPRISES AND ITS
POSSIBILITIES
A feature of manufacturing microenterprises which is rarely commented upon in the literature, at least in relation to African informal sectors, is their tendency to form agglomerations or clusters in urban areas, sometimes in their hundreds. An example, noted by a recent IFAD Mission to Kenya (IFAD, 1990), is the Kebuye estate in Kisumu where over 500 metalworkers are con-
gregated together, along with a similar number ot carpenters and furniture makers. The phenome- non is common to Africa, Asia and Latin America.
The fact that this clustering is spontaneous, and very often divided according to particuhu trades and specializations, is indicative of extcr- nalities perceived by small producers, .just as externalities lead to concentrations of large enterprises. In the Kebuye estate, the following specific advantages were noted: (a) loans of tools among producers; (b) renting of equipment, such as sewing machines, wood lathes and wcldmg equipment, to other producers; (c) subcontract- ing to neighbors when a large order is secured: (d) obtaining ideas for new and improved designs from neighbors; and (e) attraction of customers as a result of a large collection of similm workshops m close proximity.
The potential adwmtages of such agglomera- tions are even greater. They could iilclude (a) establishment of "'production lines" by groups oI cooperating producers to supply large orders; (b) discounts on purchases of materials or cstablish- ment of more regular supp[y; (c) establishment ol small mntual trust credit groups: (d) provision ot useful cornmon facilities on site: (c) provision ol improved infrastructure, including land/space, sewerage, power and lockable stores: (f) provi- sion of a better target for research and develop- ment, testing out and disseminating new products and technologies; (g) development of a more effective apprenticeship system within the infor- mal sector; and (hi use as a vehicle for articulat~ ing the felt needs of producers. Some African countries have already moved in this direction: Maldonado (198;9) refers to particular progress in Rwanda.
One factor facilitating agglomeration of micro- enterprises in urban areas in Kenya is that, in densely populated high-potential areas at least, local transportation by bus or taxi makes it easy for rural consumers to purchase essential items in town. Even in the case of bulky items such as furniture, where dispersed production would be expected, urban clusters may offer the consumer a wider choice. By producing essential items at the lowest possible cost, urban SSEs may be critical to the rural-urban terms of trade, substi- tuting for expensive imported or factory-made items to the benefit of rural consumers. These considerations make a distinction between urban and (small-scale) rural industry to some extent artificial in the Kenyan context. From the Kisumu numbers, we would expect the tendency toward agglomeration to lead to quite a high concentration of microenterprises in urban areas. The 1988 CBS survey (Table 3) shows S1% ot

KENYA'S INFORMAL SECTOR 667
employment in urban SSEs (excluding trading centers) to be in the 18 largest towns (48% in Nairobi/Mombasa) and only 19% in "other towns," defined above as rural industry.
Reinforcing the tendency for microenterprises to be concentrated in urban areas is the relative importance of urban purchasing power in terms of cash expenditure, this purchasing power in- cluding that of a larger proportion of middle- income households. The importance of this effect is reflected also within the rural areas where, as the recent IFAD report on Kenya (WAD, 1990) observes, civil servants, teachers and the like provide a significant market for whatever rural enterprises exist. This is observed also by Bille- toft (1989, p. 128) who states that
As just a minor fraction of the peasant households is capable and willing to buy desirable and other more costly consumer goods, teachers and other public employees account for an over-proportionate share of the rural purchasing power . . , it is the middle- income clientele which at present make up the major market for rural tailors, shoe-makers, car- penters, etc. Products from the rural informal sector substitute formal sector products at lower prices for the middle and low income groups. But the middle- income groups weigh most due to the little purchas- ing power of low income consumers.
If this is an accurate description, it implies that the market for rural entrepreneurs may be quite circumscribed. On the other hand, it indicates greater scope for microenterprise manufacturing (especially urban-based) to substitute for formal sector output if the quality, range and attractive- ness of products can be improved. The above brings out, again, the importance of rural pur- chasing power in determining the scope for rural nonfarm activity.
12. A REVISED INTERPRETATION OF THE URBAN AND RURAL INFORMAL
SECTORS
As stated at the outset, the informal/ microenterprise sector turns out to be quite a heterogeneous set of activities, many of them in trade and services, so that it is unwise to make blanket judgments, completely positive or nega- tive, regarding its potential contribution to de- velopment: rather, one should assess its various roles and consider in what ways its contribution can be enhanced.
The quantitative importance of the sector within the urban and rural economy shows that it is capable of substituting for large-scale units, both large-scale factories and "modern" small- scale enterprises. 6 This is despite the pursuit of
microeconomic and sectoral policies which are generally biased against microenterprises. Even if special small industry development programs exist, the basic industrial development strategy pursued in Kenya and other African countries has been one of import-substituting industrializa- tion, usually centering on large-scale, capital- intensive industry, often foreign-owned and us- ing imported technologies. Other macroecono- mic policies are well-known: duty-free import of capital goods (but taxed imports of microenter- prise capital goods, treated as consumer goods) assisting large-scale units but competing with potential small-scale capital goods production; special depreciation provisions, subsidized real interest rates and special access to finance; and overvalued exchange rates, apart from direct support measures. A particular feature of SSI promotional programs and assistance measures, moreover, is usually a complete absence of technology improvement and product develop- ment components. With more even-handed macroeconomic and sectoral policies - - including positive measures to promote linkages between large- and small-scale industry, and to upgrade microenterprise products and technologies - - it should be possible to shift the boundary of production between large-scale and small-scale production.
A principal reason why informal sector pro- ducers are able to substitute for larger enterprise is that, in a market dominated quantitatively by low-income consumers, they offer cheap and "appropriate" goods and demand only a very low supply price for their services. As observed above, one form of "appropriateness" is to make goods last longer, hence the share of repair services of all kinds within the sector. Cheap but risky and uncomfortable transportation is another example.
This aspect has led some economists to suggest that informal sector manufacturing has no long- run development role, inevitably to be replaced by factory production as incomes rise. This neglects the time scale involved: only when development has proceeded far enough to sub- stantially raise the supply price of labor will informal sector production modes become un- economic. Even Asian countries with significant- ly higher per capita incomes than most African countries continue to have substantial informal sectors.
As noted above, the sector expands not through the growth of individual enterprises but through an increase in the number of establish- ments, each employing only one or two persons. Given the numbers to be absorbed, and the inability of the formal sector to absorb them,
668 WORLD DEVELOPMENT
labor is sufficiently cheap to make 1-2 person enterprises competi t ive. Informal sector enter- prises represent a means of providing employ- ment rather than potential developing firms (though not exclusively).
A substantial port ion of rural Kenyan house- holds are "divided": nonfarm self-employment and farm employment both contribute to rural household viability, even though family members may need to work in urban areas to secure the former. Household-based nonfarm activities also provide supplementary income to maintain via- bility. The substantial proport ion of such "divided households" in rural Kenya implies a relatively favorable return to labor in the infor- mal sector, but may in turn cause labor shortages and lower productivity in agriculture. It would be desirable to raise technology to improve produc- tivity simultaneously in both sectors.
Disdain for the informal sector is produced by frequent reference to marginal activities such as shoe shining, car washing or selling discarded whisky bottles. Evidence from an actual study of shoe shining in Nairobi (Elkan el al. , 1983) puts at different perspective on this. Al though l touse clearly places shoe shiners within his " 'community of the poor , " Elkan found average net earnings in the trade to be around KShs600 a month, noting that this was "'a good deal higher than had been expected ." The significant finding, how- ever, was that the chief customers were Kenyans, not tourists, and not even well-to-do Kenyans, but an intermediate category of "'shop assistants, office clerks and civil servants of the lower grades, none of whom have serwmts but all of whom like to look smart ." This suggests that, rather than being a marginal occupation and a form of disguised unemployment , shoe shining has a natural place in the market economy of Kenya at its present stage of development . Many other "'informal sector activities," of course, will have a much more important place in that economy, and the whole set of activities will basically reflect the level of income in the population. Thus in Asian developing econo- mies, the urban and rural informal sectors may be much richer in content. Conversely, it is evident that in other African countries where rural incomes and rural purchasing power arc much lower than Kenya the informal sector is thin. This wide variation was observed also within one country, in different districts of Kenya.
Part of the dichotomy, in fact, between the formal and informal sectors arises out of a corresponding income dichotomy between the mass of consumers making use of informal sector goods and services (and, of course, some mass- produced factory goods) and a wealthy class largely patronizing the formal sector. In some cases there may be a clear e lement of price discrimination involved, reflecting the effect of income levels. Thus a short taxi ride in the " formal" sector across Nairobi for the tourist or middle-class Kenyan will cost the same as an 80- mile ride from Nairobi to Embu in an "'informal sector" taxi, even when the city taxi is consider- ably more ramshackle. Much of the service sector in Kenya and other developing countries (prosti- tution is an example) is characterized by price discrimination and segmented markets. How- ever, informal manufacturing may be similarly if less obviously based on price discrimination, by supplying rough-and-ready goods such as furni- ture, household utensils and garments for the mass market , while leaving the often much sma l l e r quality market to the formal sector. Low- income consumers do not simply consume less: they consume goods and services which serve similar purposes but at a much lower price informal scctor taxis, local beer instead of canned beer, charcoal instead of electricity, simplc houses instead of expensive houses, and less hygienic eating houses and food kiosks instead of modern hotels. There are, indeed, usually two price levels depending on the income category of the consumer.
The sharper the division between income categories, the clearer will be the gap between formal and informal producing sectors: also because a larger poor sector provides the ncccs- sary source of ultra-cheap labor. It is not a coincidence that much of the early litcrattu-c on the informal sector focused on Kenya, and less so on West African countries such as Nigeria, and that the issue was taken up subsequently by thc l~atin American countries especially. In many Asian countries there is nlore of a spectrum than a dichotomy, but there remains a complex set of low-priced activities which reflect the general level of i n c o m e s , ;.is these cw)lvc over time, in each country. It is especially this level of income difference which produces differences in the content of the typical African economy and man~ of the Asian economies at the present time.
N()TES
1, Tastes differ in drawing thc line between small and medium enterprises (SSEs and MEs) and to a less extent belween medium and large (MEs and l,Es).
2. Considered presently is whether microenterprises in the inlormal sector are capable o1 graduating to the next higher category.

KENYA'S INFORMAL SECTOR 669
3. It appears the samples may not be fully representa- tive, since the numbers employed per establishment, averaging more than three, are larger than is common throughout Kenya's informal sector. Consequently, the average level of earnings in the sample may be an overstatement.
4. The figures correlated with the income per head figures by district for 1981-82, which can be derived from the Rural Household Budget Survey, except in the case of Uasin Gishu: the low figure here for informal sector earnings may be related to the sample selected.
5. Using CBS time series on informal sector employ- ment from annual surveys and GDP at constant 1982 prices.
6. A study of Malawi (UNIDO, 1983), for instance, refers to the existence of some 25,0(01-30,000 tailors distributed throughout the country, generally operating as individuals from rented khondes or shop verandahs. This informal garment-making industry, catering for the mass of low-income consumers in the country, constitutes the main outlet for David Whitehead's, a Lonrho subsidiary, which limits itself to producing basic cotton fabrics, providing an interesting case of forward linkage from a major large-scale enterprise into an informally organized second-stage industry. The same report refers to the rural brick-making industry, employing some 15,000 women and children working cheaply as seasonal off-peak labor and using very simple techniques, which proved too competitive for the survival of a formal sector brick factory producing higher quality bricks but at a very much higher cost.
REFERENCES
Aboagye, A., Informal Sector Employment in Kenya (Addis Ababa: ILO/JASPA, 1986).
Allen, H., "'The informal urban industrial sector and growth: Some thoughts on a modern mythology," Discussion Paper No. 259 (Nairobi: Institute for Development Studies, 19771.
Bienefeld, M., "The informal sector and peripheral capitalism: The case of Tanzania," IDS Bulletin, Vol. 6, No. 3 (February 1975).
Billetoft, J., Rural Nonfarm Enterprises in Western Kenya: Spatial Structure and Development, CDR Project Paper 89:3 (Copenhagen: Centre for De- velopment Research, November 19891.
Caplen, B., The Village Polytechnic Training Scheme in Kenya -- Education for Stagnation or Development?, Report to the Ministry of Labour (Nairobi: February 1981).
Central Bureau of Statistics (CBS), Economic Survey, 1989 (Nairobi: Central Bureau of Statistics, 19891.
Central Bureau of Statistics, Statistical Abstracts, (Nairobi: Central Bureau of Statistics, 1984 and 1988).
Central Bureau of Statistics (CBS), IRS Rural Non- farm Activity Survey (Nairobi: Central Bureau of Statistics, 1977).
Central Bureau of Statistics (CBS), Rural Household Budget Survey, 1981-2 (Nairobi: Central Bureau of Statistics, unpublished a).
Central Bureau of Statistics (CBS), Urban Small Scale Enterprises Survey, 1988 (Nairobi: Central Bureau of Statistics, unpublished b).
Child, F. C., An Empirical Study of Small Scale Rural Industry in Kenya, Working Paper No. 127 (Nairobi: Institute for Development Studies, 1973).
Choudhury, F. A., Integrated Agro-industrial Develop- ment in Rural Areas: An Overview (Bangalore, India: Centre for Integrated Rural Development for Asia and the Pacific, 1988).
Coopers and Lybrand, Report on Specifications for a Standard Matatu (Nairobi: Coopers and Lybrand, 1980).
Davies, R., The Informal Sector: A Solution to Unem-
ployment? (London: Catholic Institute for Interna- tional Relations, 1978).
Elkan, W., T. C. I. Ryan, and J. T. Mukui, "The economics of shoe shining in Nairobi," African Affairs, Vol. 81, No. 323 (1983).
Haan, C., Small Scale~Micro Enterprises and Rural Non-Farm Employment in Africa: Options for IFAD involvement, Mimeo (Rome: Africa Division, IFAD, November 1989).
Hart, K., "Informal income opportunities and urban employment in Ghana," Journal of Modern African Studies, Vol. 2, No. 1 (19731, pp. 61-89.
House, W. J., "Nairobi's informal sector: An explana- tory study," in A. C. Killick lEd.), Papers on the Economy of Kenya (Nairobi: Heinemann Educatio- nal Books, 1981).
House, W. J., "Nairobi's informal sector: A reservoir of dynamic entrepreneurs or a residual pool of surplus labour?" Working Paper No. 347 (Nairobi: Institute for Development Studies, December 19781.
International Fund for Agricultural Development (IFAD), Kenya: Special Programming~General Iden- tification Mission on Small Scale Enterprises, Report No. 0204-KE, 2 Vols. (Rome: International Fund for Agricultural Development, April 1990).
International Labor Office (ILO), Employment, In- comes and Equality: A Strategy for Increasing Pro- ductive Employment (Geneva: International Labor Office, 19721.
Kapila, S., M. Manundu, and D. Lamba, The Matatu Mode of Public Transport in Metropolitan Nairobi (Nairobi: Mazingera Institute, 1982).
Keter, S., Youth Polytechnic Trained Craftsmen: Train- ing and Work Experience, A Tracer Study of Leavers from Youth Polytechnics in Laikipia District (Kenya), Laikipia Report No. 11 (Berne: Institute of Geography, University of Berne, 1988).
Leiser, F., Inventory of Main Non-Farm Activities in the Central Division, Laikipia District, Kenya, (Berne, Switzerland: Institute of Geography, Uni- versity of Berne, Laikipia Report No. 10, 1987).
Leys, C., Underdevelopment in Kenya: The Political

6711 WORLD DEVELOPMENT
Economy of Neocolonialism (London: Heinemann, 1975).
Livingstone, ]., Rural Development, Employment and Incomes in Kenya (London: Gower, 1986).
Livingstone, I., "'The rural and urban dimensions of the informal sector: A discussion of Kenya,'" Discussion Paper No. 154 (Norwich, UK: School of Develop- ment Studies, University of East Anglia, 1984).
Maldonado, C., "'The underdogs of the urban economy join forces - - results of an ILO programme in Mali, Rwanda and Togo,'" International Labour Review, Vol. 128, No. 1 (1989), pp. 65 84.
Marga Institute, "'The informal sector of Colombo City," WEP 2-19, Working Paper No. 30 (Gencwl: International Labor Office, 1978).
Mazumdar, D., "The urban informal sector," World Development, Vol. 4, No. 8 (1976), pp. 655-679.
McCormick, D., Small Manulacturing Enterprises in Nairobi: Golden Opportuni O' or Dead End? PhD dissertation (Baltimore: Johns Hopkins University, 1988).
Merriek, T. W., "'Employment and earnings in the informal sector in Brazil: The casc of Belo ttori- zonte,'" Journal o f Developing Areas, Vol. 10, No. 3 (April 1976), pp. 351-353.
Moir, H., "The Jakarta informal sector," WEP 2 19, Working Paper No. 31 (Geneva: International Labor Office, 1978).
Mosley, P., "'Implicit models and policy recommenda- tions: Policy towards the 'informal sector" in Kenya," IDS Bulletin, Vol. 9, No. 3 (1978), pp. 3-1(I.
Ng'cthe, N., J. G. Wahomc, and G. Ndua, The Rural Informal Sector in Kenya: A Study of Micro- Enterprises in Niger, Meru, Uasin Gishu and Siayu Districts, IDS Occasional Paper No. 54 (Nairobi: Institute for Development Studies, 1989).
Norcliffe, G. B., and D. B. Freeman, Nott@lrm Activities in Market ('entres of Central Province, Kenya, Research Report No. 3 (Nairobi: Ministry ol Planning and Community Affairs, Kenya Rural Non Farm Sector Project, 1979).
UNIDO, The Potential for Resonrce-Based Industrial Development in the Least Developed ('ountries No. 5: Malawi, UNIDO/15.389 (Vienna: UNIDO, 1983).
Webb, R., "Income and employment in the urban traditional sector in Peru", Mimco (Washington: World Bank, 1973).
Williams, K. G., and H. McClintock, District Dewqop- ment Planning attd Growth ('entre Strategies: Em- ployment lmplications Jor Kenyan Planning (Notting- ham: Institute of Planning Studies, University of Nottingham. 1979).
World Bank, Kenya's Agricultural Growth Pro~pect.~ and Strategy Options (Nairobi: World Bank, 1989).
World Bank, Employment attd Growth in Kenya: A Worhl Bank Economic RtT)ort (Nairobi: World Bank, 1988a).
World Bank, Women attd Kenya's Economic Prospects' (Nairobi: World Bank, 1988b).
World Bank, Kenya: bMustrial Sector l'olicies ]br Investment attd Export Growth, Report No. 6711 KE (Washington: World Bank, 1987).