a re-appraisal of groundwater quality in parts of central...
TRANSCRIPT

International Journal of Advanced Materials Research
Vol. 1, No. 3, 2015, pp. 102-112
http://www.aiscience.org/journal/ijamr
* Corresponding author
E-mail address: [email protected]
A Re-Appraisal of Groundwater Quality in Parts of Central Benue Trough, Nigeria
Okonkwo Austin Chukwuemeka*
Department of Geology and Mining, Enugu State University of Science and Technology, Enugu, Nigeria
Abstract
A re-appraisal of groundwater quality in some parts of Central Benue Trough had been carried out. Areas sampled are within
the Lafia-Keana in the Central Benue Trough. Water wells in the area tap the shallow Lafia Formation which is made up of
whitish to brownish, feldsparthic and ferroginized sandstone. Physic-chemical analyses indicate pH range (4.7 – 8.20) from
acidic through neutral to moderate alkalinity. Total Dissolved Solids (TDS) values were high in most locations with their
corresponding high electrical conductivity (EC). Total hardness (TH) shows that 75% of the groundwater is classified as very
hard as a result of high calcium content. Piper Trilinear diagram show Calcium – Bicarbonate water type. High sulphate ion
enrichment may be due to the ionic reaction from coaly formation underlying the area. Sodium Adsorption Ration (SAR) show
excellent for irrigation purpose. Calcite saturation analysis shows that most of the wells are oversaturated with respect to
calcite. Generally the groundwater in the study area is greatly impaired when compared with the WHO standard limits for
drinking water. Possible ways of improving the groundwater quality are through aeration method and installing a workable
water treatment plant.
Keywords
Hydro Geochemistry, Sodium Absorption Ratio, Calcite Saturation index and Groundwater Quality
Received: April 3, 2015 / Accepted: May 21, 2015 / Published online: June 23, 2015
@ 2015 The Authors. Published by American Institute of Science. This Open Access article is under the CC BY-NC license.
http://creativecommons.org/licenses/by-nc/4.0/
1. Introduction
The Central Benue Trough is the Middle sequence in the
elongate, broad synclinal NE-SW stretching Benue Trough
(Figure 1). It is about 800km in length and 150km in width
(Obaje, et al, 1999). The area is characterized by many
human activities ranging from mining, quarry, indiscriminate
disposal of solid and liquid waste, poor landuse and huge
earthworks (boring) constructions. Previous studies in this
area include the petroleum potential of rocks in the area
(Obaje, et al, 1999), sedimentation, paleogeography and
geodynamic evaluation (Nwajide, 1990, Ojoh, 1992), the
geology with emphasis on the natural water system (Offodile,
1976) and the environmental implications of the mining
activities. However, based on the foregoing if appears that
the study area is environmentally degraded and this to an
extent will affect the natural water system. This study hopes
to re-appraise the geochemical characteristic of the Natural
water system for the benefit of the end-users (domestic
purposes).
2. Geology and Hydrogeology
The study area consists of six upper cretaceous lithogenetic
formation (Table 1).These include Albian Arufu, Uomba,
Gboko Formations, generally referred to as the Asu River
Group (Offodile, 1976 and Nwajide, 1990). These are
overlain by the cenomanian keana and Awe Formation and
the Cenomanian – Turonian Ezeaku Formation. The Ezeaku
Formation is coterminous with the Konshisha River Group
and the Wadata Limestone in the Makurdi area. The late

International Journal of Advanced Materials Research Vol. 1, No. 3, 2015, pp. 102-112 103
Turonian-Early Santonian coal-bearing Awgu Formation lies
conformably on the Ezeaku Formation. In the Makurdi area,
the Makurdi sandstone interfingers with the Awgu Formation.
The Mid-Santonian was a period of folding throughout the
Benue Trough. The post-folding Campano-Maastrichtian
Lafia Formation ended the sedimentation in the Central
Benue Trough, after which widespread volcanic activities
took over the Tertiary.
Figure 1. The Benue Trough of Nigeria (modified from Petters 1982).
Table 1. Stratigraphic succession of formation in the Central Benue Trough (Source: Modified from Offodile, 2000)
Geologic Age Formation Lithologic Description
Paleocene Volcanic Undifferentiated Granite
Maastrichtian Lafia Formation It consists of ferrogunized sandstones, red, loose sands, flaggy mudstones, clays and claystones
Santonian Unconformity Unconformity
Coniacian Awgu Formation It consists of bluish-grey to dark-black carbonaceous shales, calcareous shales, shaley limestones,
limestones, sandstones, siltstones, and coal seams
104 Okonkwo Austin Chukwuemeka: A Re-Appraisal of Groundwater Quality in Parts of Central Benue Trough, Nigeria
Geologic Age Formation Lithologic Description
Turonian
Ezeaku/Makurdi Formation It mainly consists calcareous shales, micaceous fine to medium friable sandstones and beds of
limestones which are in places shelly
Keana Formation cross-beded coarse-grained feldsparthic sandstones occasional conglomerates, and bands of shales
and limestones towards the top
Cenomanian Awe Formation Flaggy, whitish, medium to coarse grained, carlcarous sandstone, carboneaceous shales and clays
Mid-Late Albian Asu River Formation Comprises mainly limestones, shales, micaceous siltstones mudstones and clays
BASEMENT COMPLEX
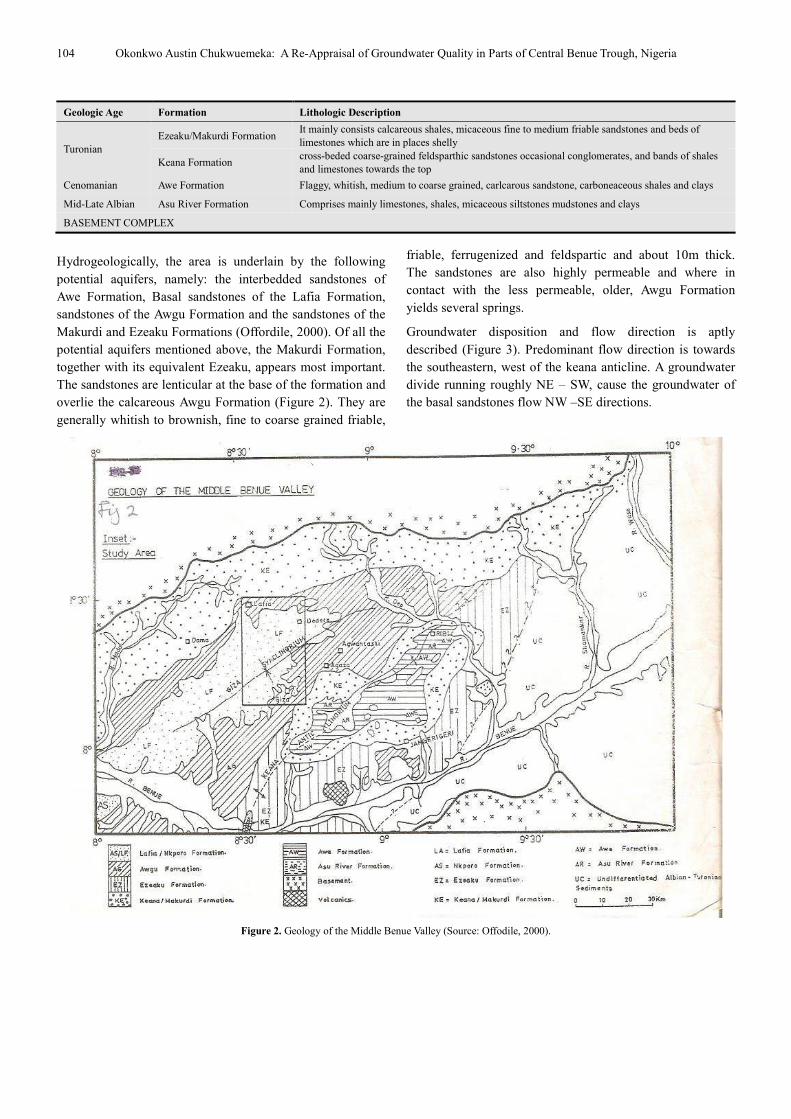
Hydrogeologically, the area is underlain by the following
potential aquifers, namely: the interbedded sandstones of
Awe Formation, Basal sandstones of the Lafia Formation,
sandstones of the Awgu Formation and the sandstones of the
Makurdi and Ezeaku Formations (Offordile, 2000). Of all the
potential aquifers mentioned above, the Makurdi Formation,
together with its equivalent Ezeaku, appears most important.
The sandstones are lenticular at the base of the formation and
overlie the calcareous Awgu Formation (Figure 2). They are
generally whitish to brownish, fine to coarse grained friable,
friable, ferrugenized and feldspartic and about 10m thick.
The sandstones are also highly permeable and where in
contact with the less permeable, older, Awgu Formation
yields several springs.
Groundwater disposition and flow direction is aptly
described (Figure 3). Predominant flow direction is towards
the southeastern, west of the keana anticline. A groundwater
divide running roughly NE – SW, cause the groundwater of
the basal sandstones flow NW –SE directions.
Figure 2. Geology of the Middle Benue Valley (Source: Offodile, 2000).

International Journal of Advanced Materials Research
Figure 3
Table 2. Physico-chemical characteristics of Natural water in some parts of Central Benue Trough (Source: Offodile, 1976). Values in parts
S/No Location
1 River Ome, Paint N.E. Keana. HDW 1
2 Agwantashi Market. HDW 2
3 Well, Front of Chief’s house. HDW 3
4 Dedere Market. HDW 4
5 Akarekwu Market. HDW 5
6 Well behind Min. of Natural Resources, Lafia.
7 Akwunza Junction Lafia. HDW 7
8 Akwunza Junction Lafia. HDW 8
9 Kadarko. HDW 9
10 Agyaragu. HDW 10
11 Sabo Urme Lafia. HDW 11
12 River Ome, Paint W. of Keana. HDW 12
13 Lafia Division (Asakio) HDW 13
14 Udei Town. HDW 14
15 Udei Railway Station
16 Obi Town HDW 14
17 Agaza Town HDW 17
18 Well at Giza HDW 18
19 Adudu. HDW 19
International Journal of Advanced Materials Research Vol. 1, No. 3, 2015, pp. 102
Figure 3. Water Table Contours in Lafia-Keana Area.
chemical characteristics of Natural water in some parts of Central Benue Trough (Source: Offodile, 1976). Values in parts
pH Temp oC Na+ k+ Ca2+ Mg
7.1 28 30.00 10.00 15.22 6.30
7.3 28 40.00 18.00 44.04 3.80
7.3 28 5.00 56.00 69.67 24.00
6.60 28.2 10.00 40.00 28.83 16.00
4.7 28.5 3.00 6.00 10.41 6.50
Well behind Min. of Natural Resources, Lafia. 6.6 27 2.00 2.00 6.90 0.25
7.0 28 33.00 11.00 65.70 9.50
5.7 27 3.00 4.00 4.00 5.00
6.70 27.5 3.00 6.00 16.00 6.00
7.00 27.5 7.00 12.50 29.00 14.30
6.80 30 44.00 11.00 35.20 2.90
6.85 28 7.00 8.00 4.81 4.50
7.50 - 33.00 16.00 108.90 4.45
7.60 27.5 17.00 5.00 5.60 1.30
6.35 28 7.00 2.00 4.40 0.30
6.3 28 0.20 3.40 5.61 0.50
7.7 28 128.00 11.00 63.26 22.00
7.6 28.5 130.00 3.40 48.45 24.30
8.20 28.5 53.00 100.00 181.38 50.00
102-112 105
chemical characteristics of Natural water in some parts of Central Benue Trough (Source: Offodile, 1976). Values in parts per million (ppm).
Mg2+ -3HCO Cl-
2-4SO
6.30 69.60 58.00 4.39
3.80 24.40 28.00 4.96
24.00 152.00 135.00 18.65
16.00 156.00 40.00 12.10
6.50 38.00 21.00 6.59
0.25 24.00 4.00 0.30
9.50 129.00 28.20 122.80
5.00 14.80 4.00 4.40
6.00 40.00 5.80 4.10
14.30 150.00 10.00 4.92
2.90 72.00 12.00 121.80
4.50 37.00 11.00 6.00
4.45 308.00 38.00 41.60
1.30 45.00 3.00 4.11
0.30 16.00 5.00 5.00
0.50 24.00 3.00 3.60
22.00 274.00 10.00 280.00
24.30 512.00 20.00 25.24
50.00 164.00 180.00 516.00

106 Okonkwo Austin Chukwuemeka: A Re-Appraisal of Groundwater Quality in Parts of Central Benue Trough, Nigeria
3. Methodology
A total of 19 (Nineteen) groundwater samples were collected
from different locations in the study area, for the re-appraisal
of the groundwater quality. All water samples are from Hand-
Dug Wells (HDW). The groundwater samples were collected
into sterilized polyethylene bottles. The water samples were
transferred to the laboratory for physical and chemical
analyses. The pH meter was used to determine the pH values
while the Atomic Absorption Spectrophotometer (AAS) and
Titration methods were used to determine the concentration
of Calcium, Magnesium, Potassium, Sodium, Bicarbonate
and Chloride ion (Table 2). The values were expressed in
parts per million (ppm). They were converted to milligram
per litre (Mg/L) for the purpose of other water quality
characterization (Table 3) using the relation (equation 1).
Mg/L = Density x ppm (1)
(Houlsow, 1995)
The cations Na2+
, and Mg2+
from all the analyzed water
samples have been used to determine the Sodium Absorption
Ratio (SAR) as parameter in classifying water for irrigation
purposes (Etu-Efeotor, 1981), according to the equation 2
12 2 2
2
NaSAR
Ca Mg
+
+ += +
(2)
with all the cations calculated in milliequivalent (meq/L)
Table 5.
Table 3. Physico-chemical characteristics of Natural water in some parts of Central Benue Trough. Values of Ionic species in Milligram per litre (Mg/L).
S/No Location pH
Temp oC
EC µs/cm TDS Na+
k+ Ca
2+ Mg
2+
-3HCO Cl
-
2-4SO
-3NO
TH
1 River Ome, Paint N.E. keana HDW 1
7.1 28 357.00 754.80 29.10 8.60 23.59 10.76 462.14 186.18 34.19 103.91
2 Agwantashi Market
HDW 2 7.3 28 604.00 419.70 38.80 15.48 68.26 6.61 162.02 89.88 38.64 197.75
3 Well, front of chief’s
house HDW 3 7.3 28 1027.00 1790.70 4.85 48.16 107.98 41.76 1009.28 433.35 145.28 441.17
4 Dedere Market.
HDW 4 6.6 28.2 653.00 1402.70 9.70 62.00 44.68 27.84 1035.84 128.40 94.26 225.84
5 Akarekwu Market.
HDW 5 4.7 28.5 200.00 406.60 2.91 5.16 16.14 11.31 252.32 67.41 51.34 86.72
6
Well behind Min. of
Natural Resources,
Lafia. HDW 6
6.6 27 69.00 189.30 1.94 1.72 10.69 0.47 159.36 12.84 2.34 28.53
7 Akwunza Junction
Lafia. HDW 7 7.0 28 807.00 2063.5 32.01 9.46 11.84 16.53 856.56 90.52 956.61 322.37
8 Akwunza Junction Lafia. HDW 8
5.7 27 125.00 166.60 2.91 3.44 6.20 8.70 98.27 12.84 34.27 51.17
9 Kadarko. HDW 9 6.70 27.5 302.00 358.50 2.91 5.16 24.80 18.44 265.60 18.62 31.94 137.60
10 Agyaragu. HDW 10 7.00 27.5 487.00 1153.80 6.79 10.76 44.95 24.88 996.00 32.10 38.33 214.38
11 Sabo Urme Lafia.
HDW 11 6.80 30 524.00 1577.2 42.68 9.46 54.56 5.05 478.08 38.52 948.82 157.11
12 River Ome, Paint W.
of Keana. HDW 12 6.85 28 149.00 356.70 6.79 6.88 7.46 7.83 245.68 35.31 46.74 50.75
13 Lafia Division
(Asakio) HDW 13 7.50 - 1080.00 2713.50 32.01 13.76 168.80 7.74 2045.12 121.98 324.06 453.73
14 Udei town. HDW 14 7.60 27.5 145.00 372.20 16.49 4.30 8.68 2.26 298.80 9.63 32.02 30.97
15 Udei Railway Station. HDW 15
6.35 28 72.00 177.10 6.79 1.72 6.82 0.52 106.24 16.05 38.95 19.18
16 Obi Town. HDW 16 6.3 28 124.00 217.70 0.19 2.92 8.69 8.87 159.36 9.63 28.04 58.09
17 Agaza Town. HDW
17 7.7 28 1368.00 4302.60 124.16 9.46 98.05 38.28 1819.36 32.10 2181.20 402.07
18 Well at Giza. HDW
18 7.6 28.5 1279.00 3906.9 126.10 2.92 75.09 42.28 3399.68 64.20 196.62 361.07
19 Adudu. HDW 19 8.20 28.5 2563.00 6192.00 51.41 86.00 281.14 87.00 1088.96 577.80 4019.64 1059.55
Average 6.88 30 628.15 1501 28.34 16.17 60.96 19.33 786.24 104.07 486.48 231.68
International Journal of Advanced Materials Research Vol. 1, No. 3, 2015, pp. 102-112 107
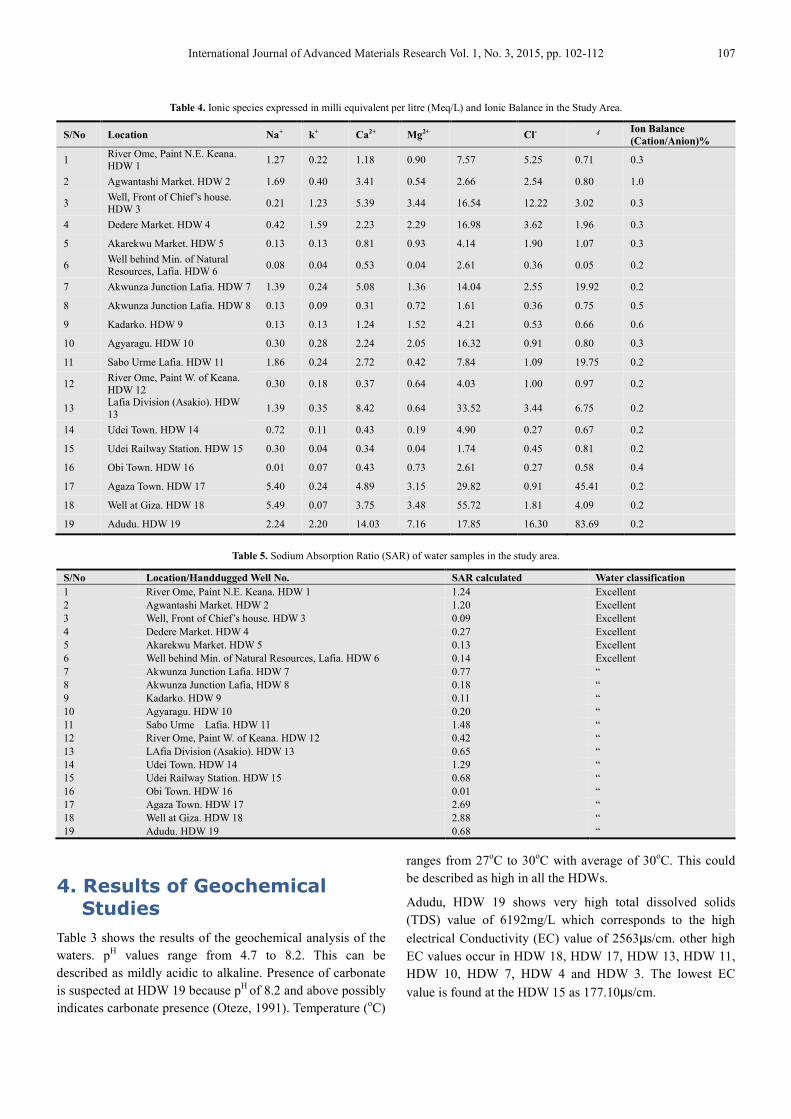
Table 4. Ionic species expressed in milli equivalent per litre (Meq/L) and Ionic Balance in the Study Area.
S/No Location Na+ k+ Ca2+ Mg2+ -3HCO Cl-
2-4SO
Ion Balance
(Cation/Anion)%
1 River Ome, Paint N.E. Keana. HDW 1
1.27 0.22 1.18 0.90 7.57 5.25 0.71 0.3
2 Agwantashi Market. HDW 2 1.69 0.40 3.41 0.54 2.66 2.54 0.80 1.0
3 Well, Front of Chief’s house. HDW 3
0.21 1.23 5.39 3.44 16.54 12.22 3.02 0.3
4 Dedere Market. HDW 4 0.42 1.59 2.23 2.29 16.98 3.62 1.96 0.3
5 Akarekwu Market. HDW 5 0.13 0.13 0.81 0.93 4.14 1.90 1.07 0.3
6 Well behind Min. of Natural
Resources, Lafia. HDW 6 0.08 0.04 0.53 0.04 2.61 0.36 0.05 0.2
7 Akwunza Junction Lafia. HDW 7 1.39 0.24 5.08 1.36 14.04 2.55 19.92 0.2
8 Akwunza Junction Lafia. HDW 8 0.13 0.09 0.31 0.72 1.61 0.36 0.75 0.5
9 Kadarko. HDW 9 0.13 0.13 1.24 1.52 4.21 0.53 0.66 0.6
10 Agyaragu. HDW 10 0.30 0.28 2.24 2.05 16.32 0.91 0.80 0.3
11 Sabo Urme Lafia. HDW 11 1.86 0.24 2.72 0.42 7.84 1.09 19.75 0.2
12 River Ome, Paint W. of Keana.
HDW 12 0.30 0.18 0.37 0.64 4.03 1.00 0.97 0.2
13 Lafia Division (Asakio). HDW
13 1.39 0.35 8.42 0.64 33.52 3.44 6.75 0.2
14 Udei Town. HDW 14 0.72 0.11 0.43 0.19 4.90 0.27 0.67 0.2
15 Udei Railway Station. HDW 15 0.30 0.04 0.34 0.04 1.74 0.45 0.81 0.2
16 Obi Town. HDW 16 0.01 0.07 0.43 0.73 2.61 0.27 0.58 0.4
17 Agaza Town. HDW 17 5.40 0.24 4.89 3.15 29.82 0.91 45.41 0.2
18 Well at Giza. HDW 18 5.49 0.07 3.75 3.48 55.72 1.81 4.09 0.2
19 Adudu. HDW 19 2.24 2.20 14.03 7.16 17.85 16.30 83.69 0.2
Table 5. Sodium Absorption Ratio (SAR) of water samples in the study area.
S/No Location/Handdugged Well No. SAR calculated Water classification
1 River Ome, Paint N.E. Keana. HDW 1 1.24 Excellent
2 Agwantashi Market. HDW 2 1.20 Excellent
3 Well, Front of Chief’s house. HDW 3 0.09 Excellent
4 Dedere Market. HDW 4 0.27 Excellent
5 Akarekwu Market. HDW 5 0.13 Excellent
6 Well behind Min. of Natural Resources, Lafia. HDW 6 0.14 Excellent
7 Akwunza Junction Lafia. HDW 7 0.77 “
8 Akwunza Junction Lafia, HDW 8 0.18 “
9 Kadarko. HDW 9 0.11 “
10 Agyaragu. HDW 10 0.20 “
11 Sabo Urme Lafia. HDW 11 1.48 “
12 River Ome, Paint W. of Keana. HDW 12 0.42 “
13 LAfia Division (Asakio). HDW 13 0.65 “
14 Udei Town. HDW 14 1.29 “
15 Udei Railway Station. HDW 15 0.68 “
16 Obi Town. HDW 16 0.01 “
17 Agaza Town. HDW 17 2.69 “
18 Well at Giza. HDW 18 2.88 “
19 Adudu. HDW 19 0.68 “
4. Results of Geochemical Studies
Table 3 shows the results of the geochemical analysis of the
waters. pH values range from 4.7 to 8.2. This can be
described as mildly acidic to alkaline. Presence of carbonate
is suspected at HDW 19 because pH
of 8.2 and above possibly
indicates carbonate presence (Oteze, 1991). Temperature (oC)
ranges from 27oC to 30
oC with average of 30
oC. This could
be described as high in all the HDWs.
Adudu, HDW 19 shows very high total dissolved solids
(TDS) value of 6192mg/L which corresponds to the high
electrical Conductivity (EC) value of 2563µs/cm. other high
EC values occur in HDW 18, HDW 17, HDW 13, HDW 11,
HDW 10, HDW 7, HDW 4 and HDW 3. The lowest EC
value is found at the HDW 15 as 177.10µs/cm.

108 Okonkwo Austin Chukwuemeka: A Re-Appraisal of Groundwater Quality in Parts of Central Benue Trough, Nigeria
Sodium (Na+) concentration ranges from 0.19mg/L in HDW 16 to 126.10mg/L in HDW 18 with of 28.34mg/L.
Table 6. Ionic Species in the Study Area expressed in molarity (Mol).
S/No Location Na+ K+ Ca2+ Mg2+ -3HCO Cl- 2-
4SO
1 River Ome, Paint N.E. Keana. HDW 1 0.00126 0.00022 0.00058 0.00045 0.00757 0.00524 0.00035
2 Agwantashi Market. HDW 2 0.00168 0.00039 0.00170 0.00027 0.00265 0.00253 0.00040
3 Well, Front of Chief’s house. HDW 3 0.00021 0.00123 0.00269 0.00174 0.01654 0.01220 0.00151
4 Dedere Market. HDW 4 0.00042 0.00158 0.00111 0.00116 0.01698 0.00361 0.00098
5 Akarekwu Market. HDW 5 0.00012 0.00013 0.00040 0.00047 0.00413 0.00189 0.00053
6 Well behind Min. of Natural Resources, Lafia.
HDW 6 0.00008 0.00004 0.00026 0.00002 0.00261 0.00036 0.00002
7 Akwunza Junction Lafia. HDW 7 0.00139 0.00024 0.00254 0.00068 0.01404 0.00254 0.00996
8 Akwunza Junction Lafia, HDW 8 0.00012 0.00008 0.00015 0.00036 0.00161 0.00036 0.00035
9 Kadarko. HDW 9 0.00012 0.00013 0.00062 0.00076 0.00435 0.00052 0.00033
10 Agyaragu. HDW 10 0.00029 0.00027 0.00112 0.00103 0.01632 0.0090 0.00039
11 Sabo Urme Lafia. HDW 11 0.00185 0.00024 0.00136 0.00021 0.00783 0.00108 0.00988
12 River Ome, Paint W. of Keana. HDW 12 0.00029 0.00017 0.00018 0.00032 0.00402 0.00099 0.00048
13 LAfia Division (Asakio). HDW 13 0.00139 0.00035 0.00422 0.00032 0.03352 0.00343 0.00337
14 Udei Town. HDW 14 0.00071 0.00011 0.00021 0.00009 0.00489 0.00027 0.00033
15 Udei Railway Station. HDW 15 0.00029 0.00004 0.00017 0.00002 0.00174 0.00045 0.00040
16 Obi Town. HDW 16 0.00001 0.00007 0.00021 0.00036 0.00261 0.00027 0.00029
17 Agaza Town. HDW 17 0.00539 0.00024 0.00245 0.00159 0.02982 0.00090 0.02272
18 Well at Giza. HDW 18 0.00548 0.00007 0.00187 0.00176 0.05573 0.00180 0.00204
19 Adudu. HDW 19 0.00222 0.00220 0.00702 0.00362 0.01785 0.01627 0.04187
Table 7. Values of Calcite Saturation Index in the Study Area.
S/No Location Ionic Strength Kiap/Ksp S.I. Calcite Remarks
1 River Ome, Paint N.E. Keana. HDW 1 0.0099 10-1.53 0.03 Under saturated
2 Agwantashi Market. HDW 2 0.0083 10-0.18 0.70 Slightly under saturated
3 Well, Front of Chief’s house. HDW 3 0.0269 10+0.78 6.02 Over saturated
4 Dedere Market. HDW 4 0.0096 10-0.08 0.83 Slightly under saturated
5 Akarekwu Market. HDW 5 0.0059 10-3.19 0.0006 Very under saturated
6 Well behind Min. of Natural Resources, Lafia. HDW 6 0.0021 10-1.62 0.02 Under saturated
7 Akwunza Junction Lafia. HDW 7 0.0354 10+0.26 1.81 Over saturated
8 Akwunza Junction Lafia, HDW 8 0.0003 10-2.90 0.001 Very under saturated
9 Kadarko. HDW 9 0.0059 10-1.88 0.01 Under saturated
10 Agyaragu. HDW 10 0.0133 10+0.19 1.54 Over saturated
11 Sabo Urme Lafia. HDW 11 0.0135 10-0.36 0.43 Under saturated
12 River Ome, Paint W. of Keana. HDW 12 0.0046 10-1.38 0.04 Under saturated
13 LAfia Division (Asakio). HDW 13 0.0351 10+1.35 22.38 Over saturated
14 Udei Town. HDW 14 0.0042 10-0.48 0.33 Under saturated
15 Udei Railway Station. HDW 15 0.0024 10-2.24 0.005 Very under saturated
16 Obi Town. HDW 16 0.0034 10-2.04 0.009 Very under saturated
17 Agaza Town. HDW 17 0.0716 10+1.15 14.22 Over saturated
18 Well at Giza. HDW 18 0.0428 10+1.29 19.61 Over saturated
19 Adudu. HDW 19 0.1242 10+1.79 62.83 Over saturated

International Journal of Advanced Materials Research Vol. 1, No. 3, 2015, pp. 102-112 109
Table 8. Water Classification based on Sodium Absorption Ratio (SAR).
(Source: Etu-Efeofor, 1981).
SAR Water classification
0 – 10 Excellent
10 – 18 Good
18 – 26 Fair
>26 Poor
Table 9. Water classification based on Total Hardness as CaCo3. (Source:
Hem, 1970).
Hardness, Mg/L as CaCo3 Class of water
0 – 60 Soft
61 – 120 Moderately hard
121 – 180 Hard
>180 Very hard
Calcium (Ca2+
) values range from 6.20mg/L at HDW 8 to
281mg/L at HDW 19. Calcium is a major contributor to the
hardness of water (Ozoko, 2004). High Ca2+
values in HDW
19 may be due to dissolution of clay material in sandstones
of Lafia Formation. Magnesium (Mg2+
) values range from
0.44mg/L at HDW 6 to 87mg/L at HDW 19 with an average
of 19.33 mg/L. The general low concentration of Mg2+
may
be attributed to the fact that dolomite contribute is absent in
the area.
Bicarbonate ( 3HCO−) values are generally high in most
locations sampled. It ranges from 3399.68mg/L at HDW 18
to 106.24mg/L at HDW 15 with an average of 786.24mg/L.
Possible sources of sulphate in the HDW may not be
anthropogenic but may be referred as a result of calcite
reduction in the waters.
Sulphate ion (2
4SO −) is very high in Adudu HDW 19 with a
value of 4019.64mg/L. Others are at HDW 17, HDW 13,
HDW 11, HDW 7. The high concentration in these HDW
may be due to the contact of the underlying coaly Awgu
Formation.
Chloride ion (Cl-) values range from 9.63mg/L in HDW 14
and HDW 16 to 577.80mg/L in HDW 19. The reason for the
high chloride concentration may be not clear.
The Total Hardness of all the investigated water samples as
CaCo3 was determined using the following relation (equation
3) Hem (1970).
TH 2.5Ca2+ + 4.1Mg2+ (3)
On this basis, 75% of the waters can be described as very
hard, 15% are described as soft water while 10% can be
described as moderately hard.
The SAR calculated range from 0.01 to 2.88 in all location
(HDW) and are classified as excellent for irrigation purposes.
5. Classification of Groundwater
It is important to classify the entire waters so as to obtain the
broad groupings. The basis of the classification here is the
major ion percent ages (Table 10). The groupings are also
confirmed by using the piper’s trilinear diagram (Fig. 4a, b).
The basic deduction is that Hand dug well water are mainly
calcium – bicarbonate type of groundwater in which calcium
(Ca2+
) and bicarbonate 3( )HCO− are the dominant ions.
6. Calcite Saturation Analysis
Equilibrium calculation can provide information on whether
a mineral or gas will dissolve or precipitate in a particular
aqueous environment. In addition to providing information
on saturation indices, these calculations can define masses of
elements that may not have been directly analyzed. The
relevant equations employed in such calculations are found in
the works of Freeze and Cherry (1979), Knobel and Philips
(1988) and Hem (1989).
Equilibrium calculations are useful in predicting calcite
saturation in groundwater systems. Information on calcite
saturation is particularly necessary because calcite is one of
the commonest minerals in aquifers and to an extent
predicting its contribution to Borehole failure geochemically.
When the saturation indices (S.I) are greater than unity, super
saturation is indicated but S.I. values of less than unity show
under saturation. An S.I. value of unity (1) means the water is
in equilibrium with the calcite.
Table 7 shows the values of calcite saturation index in the
Study Area. Two locations; HDW 2 and HDW 4 with S.I.
values of 0.70 and 0.83 respectively indicate closeness to
calcite equilibrium when approximated. While HDW 1,
HDW 5, HDW 6, HDW 8, HDW 9, HDW 11, HDW 12,
HDW 14, HDW 15, and HDW 16 are under saturated with
respect to calcite. Locations strongly over saturated with
respect to calcite are HDW 3, HDW 7, HDW 10, HDW 13,
HDW 16, HDW 17 and HDW 19.
Calcite equilibrium is given as
����� ⇌ Ca�+ CO�
��
When the reaction proceeds to the right it indicates mineral
dissolution and S.I. is less than unity. While to the left
indicates mineral precipitation and S.I. is greater than unity.
Geochemical implications of Hand dug wells oversaturated
with respect to calcite is that, if surface pumps are installed,

110 Okonkwo Austin Chukwuemeka: A Re
there may be tendency of scaling on the wal
connected to the pump. This conclusion was based on the
analytical approach used.
7. Conclusions
In all the sampled and the analytical approach utilized, the
Table 10. Classification of the Natural
S/No Location/Hand dugged well No
1 River Ome, Paint N.E. Keana. HDW 1
2 Agwantashi Market. HDW 2
3 Well, Front of Chief’s house. HDW 3
4 Dedere Market. HDW 4
5 Akarekwu Market. HDW 5
6 Well behind Min. of Natural Resources, Lafia. HDW 6
7 Akwunza Junction Lafia. HDW 7
8 Akwunza Junction Lafia, HDW 8
9 Kadarko. HDW 9
10 Agyaragu. HDW 10
11 Sabo Urme Lafia. HDW 11
12 River Ome, Paint W. of Keana. HDW 12
13 LAfia Division (Asakio). HDW 13
14 Udei Town. HDW 14
15 Udei Railway Station. HDW 15
16 Obi Town. HDW 16
17 Agaza Town. HDW 17
18 Well at Giza. HDW 18
19 Adudu. HDW 19
Figure 4a. Hydrochemical Analysis Groundwater (Piper Trilinear Diagram)
Okonkwo Austin Chukwuemeka: A Re-Appraisal of Groundwater Quality in Parts of Central Benue Trough, Nigeria
aling on the walls of the pipe
connected to the pump. This conclusion was based on the
In all the sampled and the analytical approach utilized, the
elemental concentration were compared with WHO standard
limits for drinking water purpose. And ionic concentrations
in most of the Hand dug wells largely exceed the WHO limits,
therefore may not be portable for
be suitable for domestic use.
Classification of the Natural water system in the study area on the basis of their major ion percentages
Major Cation Type Major Anion Type
No dominant type HCO
Ca2+ type No dominant type
Ca2+ type HCO
No dominant type HCO
No dominant type HCO
Well behind Min. of Natural Resources, Lafia. HDW 6 Ca2+ type HCO
Ca2+ type SO
Mg2+ type HCO
Mg2+ type HCO
No dominant type HCO
Ca2+ type SO
River Ome, Paint W. of Keana. HDW 12 No dominant type HCO
Ca2+ type HCO
Na+ or k+ type HCO
No dominant type HCO
Mg2+ type HCO
Ca2+ type HCO
Ca2+ type HCO
Ca2+ type SO
Hydrochemical Analysis Groundwater (Piper Trilinear Diagram).
of Central Benue Trough, Nigeria
elemental concentration were compared with WHO standard
urpose. And ionic concentrations
in most of the Hand dug wells largely exceed the WHO limits,
table for drinking purposes but may
water system in the study area on the basis of their major ion percentages.
Major Anion Type
3HCO
− type
No dominant type
3HCO
− type
3HCO
− type
3HCO
− type
3HCO
− type 2
4SO
− type
3HCO
− type
3HCO
− type
3HCO
− type 2
4SO
− type
3HCO
− type
3HCO
− type
3HCO
− type
3HCO
− type
3HCO
− type
3HCO
− type
3HCO
− type 2
4SO
− type

International Journal of Advanced Materials Research
Figure 4b. Hydrochemical Analysis Groundwater (Piper Trilinear Diagram)
However, they are excellent for irrigation purposes (Table 5).
Offodile (1976) had classified the waters in these areas as
medium mineralized because the wells are near the boundary
of the Lafia and Coaly Awgu Formations, where water from
the two formations appear to mix.
The natural groundwater in the study areas bel
−+ −3
2 HCOCa type. The quality of any groundwater is due to
the mineralogic composition of the aquifer. Rock water
reaction helps to define the geochemical environment within
an aquifer. An environment may be acidic or reducing or may
change from acidic to reducing within the same aquifer
thereby producing a complex hydrochemical framework
(Ozoko, 2004).
The pH range (4.7 – 8.20) shows acidic through neutral to
moderate alkaline. The high sulphate ion ( )
may be attributed to the mixing of water from the underlying
coaly Awgu formation.
Finally, general study of the cation concentrations shows that
calcium is a more significant contributor to the water
hardness than magnesium.
Recommendation
The hand dug wells in the study area should
International Journal of Advanced Materials Research Vol. 1, No. 3, 2015, pp. 102
Hydrochemical Analysis Groundwater (Piper Trilinear Diagram).
However, they are excellent for irrigation purposes (Table 5).
Offodile (1976) had classified the waters in these areas as
medium mineralized because the wells are near the boundary
of the Lafia and Coaly Awgu Formations, where water from
The natural groundwater in the study areas belongs to
type. The quality of any groundwater is due to
the mineralogic composition of the aquifer. Rock water
reaction helps to define the geochemical environment within
an aquifer. An environment may be acidic or reducing or may
nge from acidic to reducing within the same aquifer
thereby producing a complex hydrochemical framework
8.20) shows acidic through neutral to 2
4( )SO −in the wells
may be attributed to the mixing of water from the underlying
Finally, general study of the cation concentrations shows that
calcium is a more significant contributor to the water
wells in the study area should be properly
treated to reduce its hardness properties to increase its
portability for domestic use. Pipes of installed pumps should
be checked often to avoid s
oversaturation with respect to calcite.
References
[1] Etu-Efeotor, J.O., 1981. Preliminary hydrogeochemical investigations of the sub-surface waters in parts of the Niger Delta. Journ. Min. Geol. Vol. 18. No. 1. P. 103
[2] Freeze, R.A. and Cherry, J.A., 1979. Groundwater. Prentice Hall, Inc. New Jersey.
[3] Houlsow, A.W., 1995. Water Quality: Data Analysis and interpretation. Lewis Publishers, Flordia. 386p.
[4] Hein, J.D., 1970. Study and Interpretation of Chemical characteristics of natural waters. Water supply papers. Publication of U.S. Geological1473, p. 254 – 255.
[5] Hein, J.D., 1989. Study and Interpretation of the Chemical Characteristics of natural waters. 4Water – Supply paper 2254.
[6] Knobel, L.L., and Philips, S.W., 1988. Aqueous geochemistof the Magothy Aquifer, Maryland. U.S. Geol. Surv. Paper 2323.
[7] Nwajide, C.S., 1990. Sedimentation and Paleogeography of the Central Benue Trough, Nigeria, in C.O. Ofoegbu, edition. The Benue Trough Structure and Evolution. Viewer Braunschwaig, p. 19 – 38.
102-112 111
treated to reduce its hardness properties to increase its
Pipes of installed pumps should
be checked often to avoid scaling as a result of the
oversaturation with respect to calcite.
Efeotor, J.O., 1981. Preliminary hydrogeochemical surface waters in parts of the Niger
Delta. Journ. Min. Geol. Vol. 18. No. 1. P. 103 – 105.
Freeze, R.A. and Cherry, J.A., 1979. Groundwater. Prentice –
Houlsow, A.W., 1995. Water Quality: Data Analysis and interpretation. Lewis Publishers, Flordia. 386p.
Hein, J.D., 1970. Study and Interpretation of Chemical characteristics of natural waters. Water supply papers. Publication of U.S. Geological survey, Washington DC. No.
Hein, J.D., 1989. Study and Interpretation of the Chemical Characteristics of natural waters. 4th Edition. U.S. Geol. Surv.
Knobel, L.L., and Philips, S.W., 1988. Aqueous geochemistry of the Magothy Aquifer, Maryland. U.S. Geol. Surv. Paper
Nwajide, C.S., 1990. Sedimentation and Paleogeography of the Central Benue Trough, Nigeria, in C.O. Ofoegbu, edition. The Benue Trough Structure and Evolution. Viewer

112 Okonkwo Austin Chukwuemeka: A Re-Appraisal of Groundwater Quality in Parts of Central Benue Trough, Nigeria
[8] Offodile, M.E., 1976. The Geology of the Middle Benue of Nigeria. University of Uppasala, Paleo. Inst., Special Vol. 4 p. 146 – 160.
[9] Offodile, M.E. 2000. Groundwater Study and Development in Nigeria. Mecon Geology & Eng. Services Ltd. 453p.
[10] Oteze, G.E., 1991. Portability of Groundwater from the Rima Group in the Sokoto Basin. Nigeria. Journ. Min. and Geology. Vol. 27. No. 1. p. 17 – 23.
[11] Ojoh, K.A., 1992. The southern part of the Benue, Trough (Nigeria) cretaceous stratigraphy, Basin Analysis, Paleo-oceanography and geodynamic evaluation in the equatorial domain of the South Atlantic: NAPE Bulletin. Vol. 7. No. 2. p. 131 – 152.
[12] Obaje, N.G., Ulu, O.K. and Petters, S.W., 1999. Biostratigraphic and geochemical controls of hydrogcarbon prospects in the Benue Trough and the Anambra Basin, Nigeria. NAPE Bulletin, Vol. 14. No. 1. p. 18 – 54.
[13] Ozoko, D.C., 2004. Geochemical and Microbial Studies of the natural water system in Agila, Benue State, Nigeria. NAH water resources Jour. Vol. 15, No. 2. p. 60 – 64.
[14] Petters, S.W. and Ekweozor, C.M., 1982. Origin of Mid-cretaceous black shales in the Benue Trough, Nigeria. Paleogeography, Paleoclimatology, Paleoecology, vol. 40, p. 311 – 319.
[15] Stednick, J.D., 1991. Wildland Water Quality Sampling and Analysis. Academic Press Inc. San Daigo, 216p.