a rapid emergency food security assessment agok
TRANSCRIPT

A Rapid Emergency Food Security Assessment
of residents and displaced people living in Agok
Agok ,Abyei, Sudan July 2008
Vulnerability Analysis and Mapping Unit
World Food Programme, Sudan

Agok Rapid Food Security Assessment Report, September 2008-FINAL VERSION
2
Table of contents List of tables and figures..................................................................................................... 3 Summary ............................................................................................................................. 4 1. Background................................................................................................................. 6
1.1. Ongoing assistance.............................................................................................. 7 1.2. Secondary information........................................................................................ 7 1.3. Objectives ........................................................................................................... 8 1.4. Methodology....................................................................................................... 8 1.5. Limitations ........................................................................................................ 10
2. Demographics ........................................................................................................... 10 2.1. Basic demographics .......................................................................................... 10 2.2. Displacement..................................................................................................... 10
3. Education, housing, nutrition and sanitation............................................................. 11 3.1. Literacy ............................................................................................................. 11 3.2. Housing ............................................................................................................. 11 3.3. Nutrition (Mid-upper-arm circumference)........................................................ 12 3.4. Water and sanitation ......................................................................................... 13
4. Food access ............................................................................................................... 15 4.1. Household assets............................................................................................... 15 4.2. Crop production ................................................................................................ 15 4.3. Livestock........................................................................................................... 17 4.4. Income sources.................................................................................................. 18 4.5. Food sources ..................................................................................................... 21 4.6. Expenditures ..................................................................................................... 22 4.7. Food access classification ................................................................................. 24
5. Food consumption..................................................................................................... 25 6. Food security............................................................................................................. 28 7. Coping strategies....................................................................................................... 29 8. Lives and livelihoods at risk ..................................................................................... 31 9. Priorities.................................................................................................................... 32 10. What are the characteristics of the food insecure?................................................ 33 11. Chronic versus transitory Food insecurity ............................................................ 34 12. Scenarios ............................................................................................................... 35
12.1. Short-term scenarios (3 months)................................................................... 35 12.2. Long-term scenarios (12 months) ................................................................. 36
13. Response Options.................................................................................................. 36 14. Recommendations................................................................................................. 39 Appendix 5: Team members............................................................................................. 40

Agok Rapid Food Security Assessment Report, September 2008-FINAL VERSION
3
List of tables and figures
Tables Table 1: Population figures and sample size information................................................... 8 Table 2: Household assets and residency status ............................................................... 15 Table 3: Proportion of households owning animals per residency status......................... 18 Table 4: Average animal ownership per residency status................................................. 18 Table 5: Food consumption pattern per food consumption group.................................... 27
Figures Figure 1: Map of assessment locations ............................................................................... 9 Figure 2: Arrival month of displaced persons................................................................... 10 Figure 3: Housing structure per residency group.............................................................. 12 Figure 4: MUAC measurement and residency status ....................................................... 13 Figure 5: MUAC and gender of households head ............................................................ 13 Figure 6: Main water source per resident group ............................................................... 14 Figure 7: Type of toilet facility per residency group ........................................................ 14 Figure 8: Current cultivation and residency status ........................................................... 16 Figure 9: Level of cereal self sufficiency per residency status......................................... 17 Figure 10: Livestock ownership and residency status ...................................................... 17 Figure 11: Main income source per residency group........................................................ 19 Figure 12: Secondary income source per residency group ............................................... 20 Figure 13: Income generation diversification per residency group .................................. 20 Figure 14: Income generation constraints per resident group........................................... 21 Figure 15: Food sources, residents.................................................................................... 22 Figure 16: Food sources, IDPs.......................................................................................... 22 Figure 17: Share of expenditure spent on food (frequency chart) .................................... 23 Figure 18: Share of expenditures spent on food per residency status............................... 23 Figure 19: Food access by residency group...................................................................... 25 Figure 20: Food item consumption per residency group .................................................. 26 Figure 21: Food consumption classification per residency group .................................... 26 Figure 22: Number of meals per day for adults, per residency group .............................. 28 Figure 23: Number of meals per day for children, per residency group........................... 28 Figure 24: Food security classification per residency group ............................................ 29 Figure 25: Food shortage per residency group ................................................................. 29 Figure 26: Frequency of Consumption related coping per residency group..................... 30 Figure 27: Long-term coping and residency group........................................................... 30 Figure 28: Risk to lives and livelihoods per residency group........................................... 31 Figure 29: First short-term priority per residency group .................................................. 32 Figure 30: Second short-term priority per residency group.............................................. 33 Figure 31: Sex of household head and food security status.............................................. 34
Agok Rapid Food Security Assessment Report, September 2008-FINAL VERSION
4
Summary
After months of increased militarization and rising tensions between the Sudan People’s Liberation Army (SPLA) and Sudan Armed Forces (SAF) in the region of Abyei, a disputed territory on the border between North and South Sudan, clashes between SPLA and SAF forces erupted on 14 May 2008 in the city of Abyei. The violence created a rapid displacement of people, leaving the town of Abyei and surrounding villages empty within hours.
Out of the total number of displaced persons, estimated to be nearly 50,000, the majority settled in the area of Agok, a small town south of the River Kiir/Bahr al Arab, approximately 40km south of Abyei town. While the bulk of the displaced population settled in the more secure area immediately south of the river, others moved on to be accommodated with family in Twic county, Warrap state and other parts of Sudan. With the population of Agok increasing rapidly over such a short period of time, the assumed vulnerability of those displaced, along with the stress on resources and coping mechanisms of the host population, provided the rationale for a food security assessment.
The objectives of the food security assessment were to: 1. Estimate prevalence and degree of food insecurity among displaced and host populations in
the Agok area 2. Profile food insecure households, finding common characteristics 3. Explain reasons for food insecurity and make appropriate operational recommendations 4. Describe livelihood strategies and constraints, coping strategies employed and other socio-
economic circumstances, helpful to improving the general understanding of the situation The assessment was conducted in July 2008. A total of 180 households in 7 communities were interviewed as part of the assessment. Results There is some difference in food consumption between the internally displaced persons (IDPs) and residents, with a higher proportion of IDP households eating fewer meals per day compared to residents. However, food consumption is generally good and only 10 percent of residents and 16 percent of IDPs have poor food consumption1. One of the indicators used to determine the level of household food access is expenditures on food. There is little difference between IDPs and residents in this regard. Moreover, food access is believed to be influenced by seasonality: Residents’ food stocks are likely to be depleted as harvest is only a couple of months away and thus residents can be assumed to purchase more food on the market during this lean period. 42 percent of the IDPs and 35 percent of the residents have poor food access2. Undoubtedly, a huge difference exists between the IDPs and residents in regards to asset ownership. The residents have better housing and own four times the number of productive assets. The average resident household holds 4 goats – 21 times greater than the average IDP household. Eighty six percent of the IDPs do not cultivate and have no access to land. Two thirds
1 Poor food consumption is a precisely defined classification. See chapter 5 for details. 2 Food access is defined and explain in chapter 4.

Agok Rapid Food Security Assessment Report, September 2008-FINAL VERSION
5
of the residents cultivate an average of 5.3 feddan3 which is regarded as just enough to ensure self sufficiency in cereals at household level. Food security analysis (a cross tabulation of food access and food consumption) indicates a very small difference between IDPs and residents, partly due to the current poor food access of residents. Forty four (44) percent of IDPs and 40 percent of residents are classified as currently severely food insecure. A final cross tabulation is made between food security and coping strategies. Based on the food security situation and the type of coping strategy employed, possible effects on the household’s lives or livelihood can be determined. Three final groups emerge from this analysis. The result indicates that, by employing current coping strategies, 49 percent of the IDPs are endangering their lives and 16 percent are putting their livelihoods at risk. Coping strategies for thirty seven (37) percent of residents are associated with risk to life and 25 percent of resident households are putting their livelihood at risk. Approximately 35 percent of the total population are not at risk. Recommendations These recommendations are based on the most likely scenario and are ongoing activities that should continue.
• Supplementary and Therapeutic Feeding for malnourished individuals are recommended as previous assessment show a precarious nutritional situation.
• Continue General Food distributions until December 2008 to 36,000 beneficiaries.
January-October 2009
• Returning IDPs to Abyei should be supported until October 2009 (main crop harvest) as there homes and livelihoods have been destroyed and it would take time to re-establish their livelihoods. It is recommended that it is done in the form of Food for Recovery (conditioned GFD however the ration could be the same as GFD).
• The returnees should also be considered for Agricultural support programmes (seeds, tools and livestock restocking) in order to speed up the livelihood recovery.
• Remaining IDPs in Agok would also need support until the end of next year’s main harvest as they have not been able to plant anything this season. WFP will have to set up a system whereby households would only be able to receive food assistance in one location, either as returnee in Abyei or as IDP in Agok. (As explained in the scenario section, households will most likely split up and some members go ahead to Abyei whilst the rest remain in Agok).
• 5,000 vulnerable residents could be supported through FFW and the Mercy Corps project. Once the IDP population reduces and it is easier to identify IDPs from residents then any GFD to this group should be terminated after the lean season ends.
• The total food assistance requirement of the above interventions is approximately 550MT/month.
3 1 feddan = 4,200 m2 = 0.42 hectare = 1.038 acres

Agok Rapid Food Security Assessment Report, September 2008-FINAL VERSION
6
• Food For Education could be an alternative response to reach vulnerable residents in Agok.
• Once large number of IDPs have returned to Abyei then it is recommended that a follow-up assessment is carried out to base future responses on the actual conditions there.
1. Background4
After months of increased militarization and rising tensions between Sudan People’s Liberation Army (SPLA) and Sudan Armed Forces (SAF) in the region of Abyei, a disputed territory on the border between North and South Sudan, clashes erupted on 14 May 2008 in the city of Abyei. Fighting between SPLA and SAF forces in Abyei continued for over a week and the conflict involved heavy artillery, rocket propelled grenades, small arms fire and the looting and burning of shelter, public buildings and markets. The violence set off the rapid displacement of the population, leaving the town of Abyei and surrounding villages empty of people within hours.
The oil-rich region of Abyei is one of three “transitional areas”, given special consideration under the 2005 Comprehensive Peace Agreement (CPA) between North and South Sudan, an agreement which ended one of the longest running civil wars in Africa. Under the Abyei protocol, the area was to be provided with its own administration reporting directly to the presidency and given the option of acceding to South Sudan or staying with the north contingent on the results of a popular referendum to be held in 2011. The protocol also indicated that the geographical extent of the area would be determined through arbitration by the Abyei Boundaries Commission (ABC) should the National Congress Party (NCP) and the Sudan People’s Liberation Movement (SPLM) fail to reach consensus on the final status of the borders.
Abundant mineral resources, the ambiguity of its geographical status, and its pivotal importance in the relationship between the parties to the CPA have consistently complicated efforts to resolve the Abyei issue. The latest efforts to absolve the Abyei crisis, known as the ‘Abyei Roadmap’, including a broad set of security arrangements, power-sharing structures, and deference to international arbitration, represents the best hope to date that the dispute over Abyei will be definitively resolved.
The majority of residents north of the River Kiir/Bahr al Arab prior to the May 2008 conflict were recent returnees. Some had been resident in areas to the immediate south of Abyei, such as Twic County, but the vast majority inhabited urban areas in northern Sudan. Data from the World Food Programme (WFP) and the Return, Reintegration and Recovery (RRR) section of the United Nations Mission in Sudan (UNMIS) indicates that approximately 75-85% of the population of Abyei was comprised of returnees. The population of Abyei town, for example, increased from approximately 5,000 people to 35,000 between 2005 and 2008. Many of these returnees had been displaced for nearly 25 years and, especially for those previously residing in urban areas to the north, lacked the skills and knowledge required for sustaining rural livelihoods.
The social dynamics in the region are made more problematic by historical disputes related to the use of natural resources between the Ngok Dinka agro-pastoralists and Misseriya Arab pastoralists. At the start of the dry season in November-December, Misseriya herders migrate with their cattle along established corridors that transit Abyei area. As the dry season progresses, these cattle move further south in search of water and grazing lands. As these cattle pass through
4 WFP and OCHA documentation

Agok Rapid Food Security Assessment Report, September 2008-FINAL VERSION
7
Abyei area, competition for resources, such as pasture and water points, leads to increased tensions between the two ethnic groups.
Traditional conflict mitigation mechanisms limited the role of violence in resolving such disputes prior to the North-South civil war. National political dynamics, combined with the undermining of traditional authority structures and the formation of proxy militia forces and proliferation of small arms during the conflict, has led to an increased incidence of violence along these migration corridors. Following the conflict of 14 May, underlying and historically based ethnic tensions between Ngok Dinka and Misseriya Arabs present the greatest threat to stability in Abyei area.
Out of the total number of displaced persons, which is estimated to be nearly 50,000, the majority settled in the area of Agok, a small town across the River Kiir/Bahr al Arab, approximately 40km south of Abyei town. While the bulk of the displaced population settled in the more secure area immediately south of the river, others moved on to be accommodated with family in Twic county, Warrap state and other parts of Sudan. With the population of Agok increasing rapidly over such a short period of time, concerns over the food security of the displaced populations, along with the expected stress on resources and coping mechanisms of the host population, provided the rationale for a rapid food security assessment.
1.1. Ongoing assistance The World Food Programme has been active in Abyei area, including Agok and surrounding villages, since 2005. Interventions included general food distribution (GFD) to support returning IDPs and vulnerable residents, supplementary feeding programmes, school feeding and support to a variety of livelihood projects through Food for Work and Food for Training. Since soon after the onset of the most recent conflict, WFP began providing GFD to IDPs and vulnerable residents in areas south of the River Kiir/Bahr al Arab. WFP is currently assisting approximately 31,000 IDPs and 4,000 residents in Agok area. The ration is standard for WFP Sudan: 450g cereals (sorghum), 50g pulses (lentils), 20g vegetable oil and 10g salt.
Other food security interventions include collaboration between WFP and Mercy Corps on a combined Cash for Work/Food for Work project that supports emergency shelter construction for the most vulnerable IDPs, as well as FFW projects targeting female-headed households, such as a vegetable gardening project. FAO has been active in vaccinating cattle and assisting with technical support to government bodies.
World Food Programme has been providing general food distribution to the population of Agok – displaced persons as well as residents – since the onset of the most recent conflict in May. Given the perceived requirement for magnitude of the humanitarian crisis, the Food Security and Livelihood Sector of Abyei/Agok5 requested that an assessment of the food security situation should be undertaken.
1.2. Secondary information
Additionally, reports on high malnutrition rates have underlined the need to better understand the food security situation of both resident and displaced households. Specifically, a rapid nutrition assessment, based on Mid Upper Arm Circumference (MUAC), of children 12-59 months old conducted by GOAL in late May 2008 estimated severe acute malnutrition (SAM)6 to 2.1 percent
5 The Food Security and Livelihood Sector is a UN coordinating body. 6 Severe malnutrition was defined as being <110 mm MUAC and/or oedema

Agok Rapid Food Security Assessment Report, September 2008-FINAL VERSION
8
and moderate acute malnutrition (MAM)7 to 10.3 percent. These results are below emergency thresholds but should never the less be addressed. The assessment teams also mentioned over-population, common illnesses (including eye infection, diarrhoea and respiratory tract infection) in their general observation of the area.
A nutritional survey based on weight for height was conducted by Médecins Sans Frontières (MSF) in Agok area in July estimating SAM to 7.0 percent, MAM to 19.1 percent and thus the Global Acute Malnutrition rate to 26.1percent.8
1.3. Objectives
The objectives of the food security assessment were to:
1. Estimate prevalence and degree of food insecurity among displaced and host populations in the Agok area
2. Profile food insecure households, finding common characteristics
3. Explain reasons for food insecurity and make appropriate operational recommendations
4. Describe livelihood strategies and constraints, coping strategies employed and other socio-economic circumstances, helpful to improving the general understanding of the situation
1.4. Methodology For sampling, a list of 8 villages was compiled, constituting all locations in Agok area thought to be feasible for assessment teams to reach, as constrained by insecurity and inaccessibility. Following standard three-stage sampling of the WFP Emergency Food Security Assessment (EFSA) guidelines, the first stage of selection included spreading a total of 20 clusters – with 10 households per clusters – randomly across the 8 locations, probability of selection made proportional to population size9. Estimation of IDP and resident population is difficult due to the recent population movements and lack of census information. Population estimates differ depending on source. The estimates used for the purposes of this assessment were compiled by the WFP sub-office in Agok.
Table 1: Population figures and sample size information
Location/village IDP population
Resident population
Total population
Number of sampled households
Abathok 4,600 2,000 6,600 20 (2 clusters) Awal 3,000 2,000 5,000 20 (2 clusters) Wauchin 3,300 1,500 4,800 20 (2 clusters) Mading Jokthiang 5,000 3,000 8,000 30 (3 clusters) Joljok 4,000 3,000 7,000 30 (3 clusters) Agok 7,500 7,000 14,500 50 (5 clusters) Mabun 3,100 2,000 5,100 30 (3 clusters)
7 Moderate malnutrition was defined as being 110-124 mm MUAC 8 Sampling and survey design of the two surveys are unknown to this assessment team. 9 The selection was made by generating a random initial population number, and then performing a systematic walk with a fixed sample interval through cumulative population numbers.
Agok Rapid Food Security Assessment Report, September 2008-FINAL VERSION
9
Wunpeth 500 2,000 2,500 0 (0 clusters) Total 31,000 22,500 53,500 200
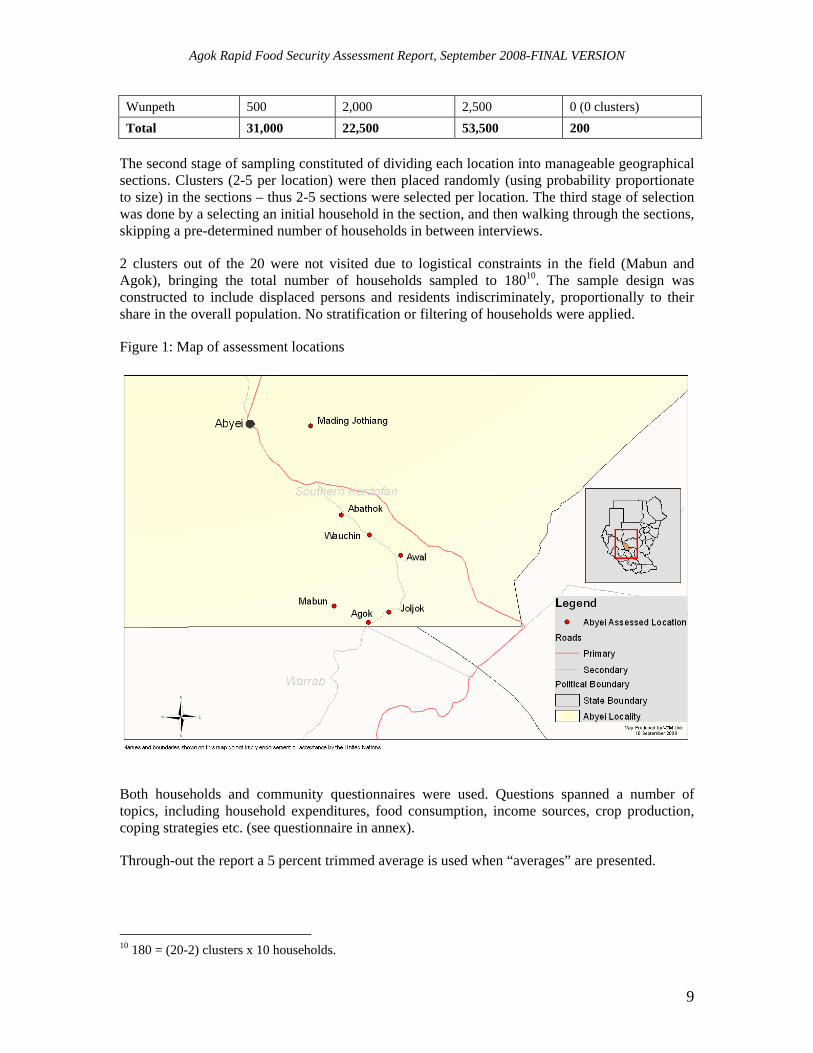
The second stage of sampling constituted of dividing each location into manageable geographical sections. Clusters (2-5 per location) were then placed randomly (using probability proportionate to size) in the sections – thus 2-5 sections were selected per location. The third stage of selection was done by a selecting an initial household in the section, and then walking through the sections, skipping a pre-determined number of households in between interviews.
2 clusters out of the 20 were not visited due to logistical constraints in the field (Mabun and Agok), bringing the total number of households sampled to 18010. The sample design was constructed to include displaced persons and residents indiscriminately, proportionally to their share in the overall population. No stratification or filtering of households were applied.
Figure 1: Map of assessment locations
Both households and community questionnaires were used. Questions spanned a number of topics, including household expenditures, food consumption, income sources, crop production, coping strategies etc. (see questionnaire in annex).
Through-out the report a 5 percent trimmed average is used when “averages” are presented.
10 180 = (20-2) clusters x 10 households.

Agok Rapid Food Security Assessment Report, September 2008-FINAL VERSION
10
1.5. Limitations
The out-stretched layout of villages in South Sudan poses a challenge to assessment teams looking to cover an entire village. In some instances, teams were forced to focus their interviews to the central part of a location, excluding the outskirts, which introduces a distortion in the randomness of the household selection.
With regard to the residents, no pre-crisis information was gathered and comparisons between before and after the shock are difficult to make. Therefore, the full impact on the host community is unknown.
The design and the approach of an Emergency Food Security Assessment is one of a snapshot and this assessment does not allow for a seasonal analysis of food security. The results in this report are representative for the time of the assessment, which coincided with the lean season.
2. Demographics
2.1. Basic demographics
Households headed by females – a characteristic typically associated with vulnerability to food insecurity – accounted for 24 percent of the population. 42 percent household heads were married monogamous and 51 percent polygamous. Average household size was 8.711 persons, which is above the national average of 6.1 and the South Sudan average of 6.412. Dependency ratio13 was 13414, while average dependency ratio for South Sudan is 139 – an insignificant divergence from the regional average.
2.2. Displacement
IDPs were found to constitute 62 percent of the sampled population, with residents representing 35 percent of the total. The massive influx of Abyei residents caused more than a doubling of the population in the Agok area.
The population figures presented in table 1 above are slightly different, as IDPs constitute 58 percent and residents 42 percent. However, as explained above, due to the recent population movements it is believed that the sample does represent an accurate break down of the population in Agok.
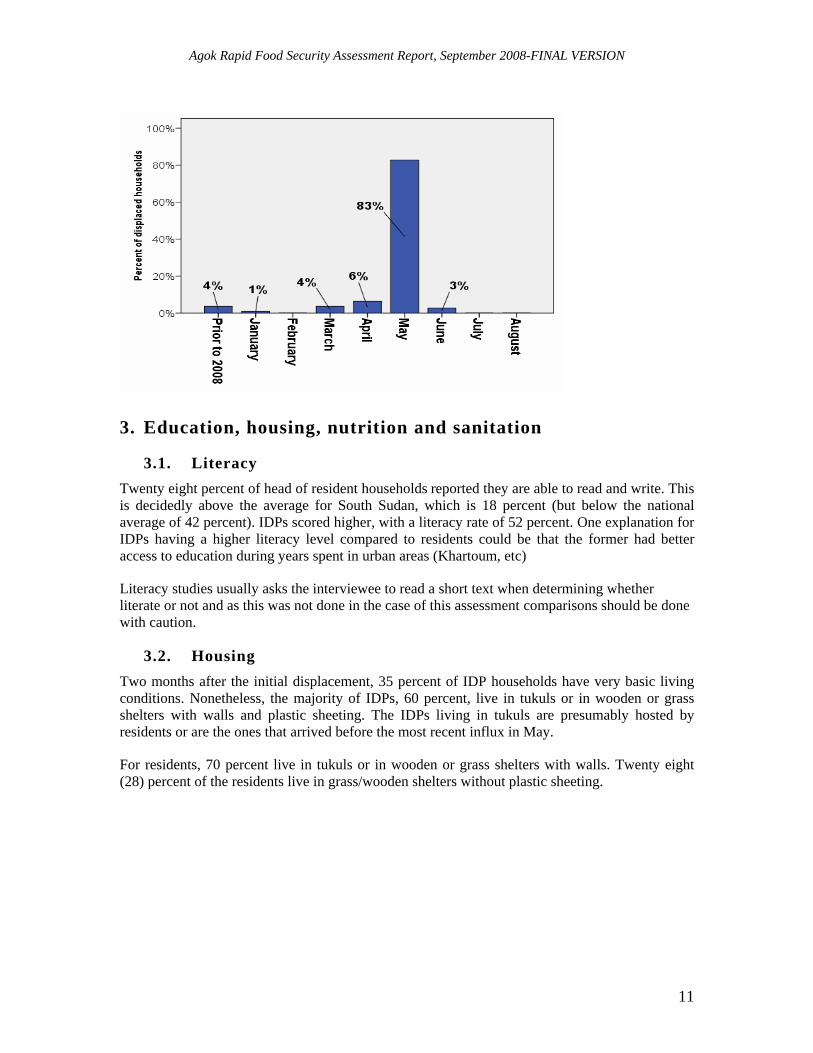
Figure 2: Arrival month of displaced persons
11 Standard deviation: 3.7. 12 Average household size and dependency ratio for South Sudan is taken from the Comprehensive Food Security and Vulnerability Analysis, WFP, 2007. 13 Dependency ratio is calculated as (number of persons aged 0-14 plus persons aged 66 and above) divided by (persons aged 15-65). Thus, high dependency ratio indicates high share of household members in non-productive age. Simplified, low dependency ratio indicates high productivity. 14 Standard deviation: 87.
Agok Rapid Food Security Assessment Report, September 2008-FINAL VERSION
11
3. Education, housing, nutrition and sanitation
3.1. Literacy Twenty eight percent of head of resident households reported they are able to read and write. This is decidedly above the average for South Sudan, which is 18 percent (but below the national average of 42 percent). IDPs scored higher, with a literacy rate of 52 percent. One explanation for IDPs having a higher literacy level compared to residents could be that the former had better access to education during years spent in urban areas (Khartoum, etc)
Literacy studies usually asks the interviewee to read a short text when determining whether literate or not and as this was not done in the case of this assessment comparisons should be done with caution.
3.2. Housing Two months after the initial displacement, 35 percent of IDP households have very basic living conditions. Nonetheless, the majority of IDPs, 60 percent, live in tukuls or in wooden or grass shelters with walls and plastic sheeting. The IDPs living in tukuls are presumably hosted by residents or are the ones that arrived before the most recent influx in May.
For residents, 70 percent live in tukuls or in wooden or grass shelters with walls. Twenty eight (28) percent of the residents live in grass/wooden shelters without plastic sheeting.

Agok Rapid Food Security Assessment Report, September 2008-FINAL VERSION
12
Figure 3: Housing structure per residency group
3.3. Nutrition (Mid-upper-arm circumference) As previously mentioned, there have been a number of nutritional assessments done in recent months which indicated a precarious nutritional situation: Two recent surveys estimated Severe Acute Malnutrtion (SAM) to 2.1 percent and 7.0 percent respectively, and with Moderate Acute Malnutrtion (MAM) to 10.3 percent and 19.1 percent respectively15. MUAC was included in this assessment in order to enable better understanding of the causes of malnutrition and to determine whether food insecurity was directly related to the high GAM rates reported by MSF. The results from this assessment’s MUAC findings should not be compared with MSF nor GOAL’s as sampling was done differently and covers different population groups. Of children surveyed in this assessment 3.7 percent had MUAC measurements below 110mm; 9.7 percent were between 110-124mm. Taken together with previous assessment by GOAL and MSF, the nutritional situation is believed to be precarious. This assessment therefore recommends supplementary and therapeutic feeding for malnourished individuals as per recommendation section. The results below indicate that there is no difference between residents and IDPs in terms of the rate of severe MUAC and a very small, insignificant difference in moderate MUAC. In Figure 4, interestingly, there is a marked difference in MUAC results and whether the head of household is male or female. The male headed households contained all the severe cases of malnutrition identified in this assessment. It is possible that this is a coincidence as the numbers are small. The moderate cases are equally found in both types of households.
15 See chapter 1.2 above for details about nutritional surveys conducted.

Agok Rapid Food Security Assessment Report, September 2008-FINAL VERSION
13
Figure 4: MUAC measurement and residency status
Figure 5: MUAC and gender of households head
3.4. Water and sanitation For the purposes of this assessment, public standpipe, borehole and protected dug well were considered safe; unprotected dug well, unprotected spring, rivers and ponds were considered unsafe. Attention was given only to the quality of water sources, while the quantity and sustainability of the water sources were not considered. In many situations potable water is contaminated through unhygienic collection methods and unclean vessels; however further information on this issue was considered beyond the scope of the assessment.
Safe water sources are widely available to the sampled population and residency status does not seem to have major implications for households’ ability to access safe water. Ninety (90) percent of IDPs have a safe main source of water. For residents the figure is 97 percent.
Water is often one of the first resources that a host community have to share with an IDP population. If the available quantities are sufficient to support a larger population then there should not be a problem, however over-crowding and limited quantities have a tendency to increase the risk for water born diseases, as the first thing households would reduce is personal hygiene.

Agok Rapid Food Security Assessment Report, September 2008-FINAL VERSION
14
Figure 6: Main water source per resident group
The sanitation situation is poor, 65 percent of the population does not use any form of latrine and defecates in the open air. This is a traditional practice, which is common in scarcely populated places where each household has defined places for defecation. Information in this assessment was not collected on whether a well demarcated defecation area was used, in which case the risk of transmission of disease could be less. However, reports on morbidity16 – specifically on the commonness of diarrhoea – combined with what seems to be very poor toilet facilities, underlines the importance of improving sanitation. This is especially important due to increased population and associated over-crowding of villages with IDPs living interspersed with residents throughout Agok area.
Figure 7: Type of toilet facility per residency group
16 GOAL Rapid nutrition assessment, 30-31 May 2008.

Agok Rapid Food Security Assessment Report, September 2008-FINAL VERSION
15
4. Food access
4.1. Household assets
Looking at household ownership of a number of common household assets in table 2 reveals that residents possess significantly17 more assets than IDPs. On average, resident households own nearly three times more assets than their IDP counterparts (see table below).
Given that some of the assets are core agricultural tools, the lack of assets can affect productivity. Sixty one (61) percent of IDPs but only 11 percent of residents have no assets, making lack of productive assets not a major constraint for the majority of the resident households.
Table 2: Household assets and residency status
Asset types Mean number per
IDP household Mean number per
residents household Percent
difference Hoe/axe 0.74 2.33 215% Animal drawn plough 0 1.19 N/A Seeder-weeder 0.05 0.16 196% Cart (for horse or donkey) 0.02 0.03 78% Manual grinding mill 0.05 0.14 167% Bicycle 0.07 0.11 56% Radio 0.13 0.37 173% Television 0.04 0.02 -56% Generator 0.01 0.03 256% All assets 1.11 4.38 296%
4.2. Crop production
Residents engage in agriculture to a much greater extent than IDPs, which is to be expected as the majority of IDPs arrived in May this year, thus missing the start of the agricultural season. Eighty six (86) percent of IDPs do not cultivate land. The 14 percent that cultivate are mainly the households who arrived earlier in the year. Among residents, 74 percent do cultivate, as shown in figure 7.
Of the IDPs arriving in Agok area immediately following the hostilities in Abyei (arriving in May and June 2008), 88 percent do not cultivate.
The generally precarious status of the recently arrived IDPs makes the undertaking of agricultural production risky. Furthermore, the timing of the displacement caused people to move at the end of the period typically used for clearing land, making the time of arrival in Agok too late to clear any meaningful area of land. Thus amongst those not cultivating (mainly IDPs), 68 percent reported lack of access to land as the major reasons for not farming even though land is available in abundance. Ten percent reported insecurity as a main reason and 14 percent “not living in normal location”.
17 Results are based on two-sided tests assuming equal variances with significance level 0.05.

Agok Rapid Food Security Assessment Report, September 2008-FINAL VERSION
16
Figure 8: Current cultivation and residency status
For residents who report that they cultivate, the average18 area cultivated is 5.3 Feddan19. The corresponding number for cultivating IDPs is 1.9 Feddan. An average family requires 5.3 Feddan to satisfy its caloric needs.20 This would indicate that, on average, residents tend to cultivate just enough to support themselves in terms of cereals requirements. Sorghum is the most commonly cultivated crop, followed by maize and sesame. Some 43, 16 and 6.3 percent, respectively, of the resident households produced these crops in the last harvest (see the chart below). However the Agok area benefits from two harvests per year and the one referred to as the last harvest in the questionnaire is the smaller and less important of the two and could be a reason why only 43 percent reported having cultivated sorghum, and is also a reflection of the demographic composition of the Agok population, i.e. 62% being IDPs.
Besides a relatively low frequency of cultivation in the last harvest, crop production volumes were also meagre, making it indeed the less important of the two yearly harvests. On average, resident households (both cultivating and not cultivating) produced 108 kg of sorghum and 14 kg of maize, which is not so poor considering that this is the less productive of the two harvests. Production information was also gathered for millet, sesame, groundnuts, beans and cassava. However, the trimmed mean for production volumes for these crops was 0 kg for the past harvest.
As shown in Figure 8 below, the proportion of households producing enough to be self sufficient (the white segments of the bars) is insignificant when considering only the last harvest. It is however also questionable whether the data on number of bags produced is reliable, as the locations selected for the assessment are far away from markets and the majority of people store their crops in traditional containers rather than in bags. The production results in this section should thus be interpreted with caution for the two reasons mentioned above.
18 The 5 percent trimmed mean is used, so as to remove the distortion of some extreme values. 19 1 feddan = 4,200 m2 = 0.42 hectare = 1.038 acres 20 The calculation assumes on average 8.7 family members, a yield of 269kg of sorghum per Feddan, and 450gram of sorghum per day per person and a cereal requirement of xxx kg per person per year.

Agok Rapid Food Security Assessment Report, September 2008-FINAL VERSION
17
Figure 9: Level of cereal self sufficiency per residency status
Crop Constraints For households that cultivate, three main constraints were reported among half the households interviewed: Pests/weed, lack of seeds, and shortage of labour. In addition, lack of security, lack of tools and floods were mentioned by almost one third of households as being important constraints to crop cultivation.
4.3. Livestock
Eighty one (81) percent of the IDPs but only 44 percent of residents have no livestock. Even among those who own some livestock, the average livestock ownership is 3.5 for residents compared to 0.28 TLU21 among IDPs, indicating that IDPs own much less number of livestock.
Figure 10: Livestock ownership and residency status
21 Tropical Livestock Unit (TLU) is one method of describing animal ownership. Animals are weighted according to approximate body mass:
130101025.125.11 horsespoultrysheepgoatsdonkeyscattleTLU ====== . Thus, the average number of
1.1 TLU per household corresponds to owning for example 1 donkey and 3 goats.

Agok Rapid Food Security Assessment Report, September 2008-FINAL VERSION
18
From the tables 3 and 4 below, it is clear that IDPs in Agok area own far less livestock than residents. Some of the recently displaced households lost their animals as a result of the conflict in Abyei, while others, having returned to Abyei from Khartoum, Juba or other areas not long ago, might not have had enough time in Abyei to establish herds. Livestock is an important source of income and food (mainly in the form of milk and eggs), as well as being a means for accumulating and distributing wealth.
Goats, cattle, poultry and sheep are the most commonly owned types of animals. Ownership of animals is rare among IDPs, however. Even the most commonly owned type of animal – goats – is owned at a rate of only one fifth of one goat per IDP household.
The average resident household owns 4 goats – which is 21 times greater than animal ownership by the average IDP household.
Table 3: Proportion of households owning animals per residency status
Animal Percent of resident
households owning any Percent of IDP
households owning any Percent of overall
households owning any Goat 48% 9.8% 23% Cattle 27% 9.8% 16% Poultry 24% 4.5% 11% Sheep 16% 1.8% 6.7% Donkey 3.2% 0.9% 1.7% Horse 1.6% 0% 0.6% Any animal ?? ?? ??
Table 4: Average animal ownership per residency status
Animal
Average number of animals per resident households
Average number of animals per IDP
households
Average number of animals per overall
household Goat 4.0 0.2 1.24 Cattle 3.3 0.15 0.95 Poultry 1.1 0 0.30 Sheep 0.6 0 0.04 Donkey 0 0 0 Horse 0 0 0 Any animal ?? ?? ??
4.4. Income sources Crop production and raising livestock are important activities for residents, as detailed in the chapters above. However, the most commonly reported income source is salaried work, reported by 37 percent of residents as their main income source and 34 percent of IDPs. These figures are unexpectedly high, in fact so high that interpretation becomes difficult. Even though there is some government administration in Agok, and significant military presence, it is not possible that one third of households receive their main income from working within these institutions. Rather, it is likely that the question was understood to also include remittances, from members of the nuclear

Agok Rapid Food Security Assessment Report, September 2008-FINAL VERSION
19
or extended family, having a salaried job in Juba, Khartoum or other places. Given this, the high number of reports of salaried was excluded from the food security analysis.
Discounting salaried work, the most common main income source for IDPs is food aid sales, at 22 percent. Thus, the food aid distribution is contributing greatly to the income generation of IDPs. Casual labour, firewood/charcoal sales, petty trade and kinship are also important sources of income for IDP households.
Figure 11: Main income source22 per residency group
Kinship, sale of firewood and charcoal, food aid sales, and brewing are the most important secondary income sources. In addition, sale of livestock is an important income source for residents.
22 Income sources reported by fewer than 3 percent of the population have been grouped in the category labelled “other”.

Agok Rapid Food Security Assessment Report, September 2008-FINAL VERSION
20
Figure 12: Secondary income source23 per residency group
Income diversification can be an indicator of a household’s vulnerability to food insecurity in some circumstances. As apparent from the chart below, the resident population has more diverse income generation compared to IDP households – although the difference is not substantial – with average number of income sources at 3.0 and 2.6 respectively. The graph below indicates that some 70 percent of the residents have over 3 income sources whilst this is less than 50 percent amongst the IDPs.
Figure 13: Income generation diversification per residency group
Limited employment opportunities, insecurity, and lack of manpower in the households are the most commonly reported constrains to income generation. The difference in reporting between IDPs and residents reflects their differences in income generation: Residents are over-represented in constraint types relating to domestic production – such as lack of manpower in the households, low agricultural production, and low prices for household production – while IDPs are over-
23 Income sources reported by fewer than 3 percent of the population have been grouped in the category labelled “other”. Delete duplicate footnote

Agok Rapid Food Security Assessment Report, September 2008-FINAL VERSION
21
represented in limited employment opportunities (although this is a major constraint also for residents).
Figure 14: Income generation constraints per resident group
0
10
20
30
40
50
60
70C
losu
re o
f mar
kets
Heal
th p
robl
ems
Inse
curit
y
Lack
of c
redi
t
Lack
of m
anpo
wer
in th
eho
useh
olds
Lim
ited
empl
oym
ent
Low
agr
icul
tura
l pro
duct
ion
Low
live
stoc
k pr
oduc
tion
Low
pric
es o
r dem
and
ofho
useh
olds
pro
duct
ion
Perc
ent o
f hou
seho
lds IDP
Resident
4.5. Food sources Each household was asked about its main sources of food for each of the food items included in the seven day consumption recall. The market is currently clearly the most important source for the residents with some indicating food aid as a second source for sorghum, beans and oil. Gathering is the second most important source of vegetables after the market. The market is also the most important source for the IDPs but sorghum is to a greater extent coming from food aid.

Agok Rapid Food Security Assessment Report, September 2008-FINAL VERSION
22
Figure 15: Food sources, residents
Figure 16: Food sources, IDPs
4.6. Expenditures The share of expenditure spent on food is a proxy indicator of households’ ability to acquire food to meet its needs. It describes a household’s capacity to cope with price increases, as well as its ability to remain productive by investing in health services, education, tools and other productive assets for its members. The frequency chart below shows that the average proportion of expenditure spent on food is 56 percent. Typically, 0-50 percent is regarded as good, 50-65 percent as borderline and 65-100 percent as poor.
Perc
ent o
f hou
seho
lds
Perc
ent o
f hou
seho
lds

Agok Rapid Food Security Assessment Report, September 2008-FINAL VERSION
23
Figure 17: Share of expenditure spent on food (frequency chart)
Classifying the population into the above mentioned three groups based on share of expenditure spent on food, and breaking it down by residency status generates the chart below, revealing no meaningful differences between resident and IDP households. This is one of the few indicators by which the IDP population is not performing worse than residents. Considering that the assessment was carried out during the lean season, resident households who are mainly farmers will have depleted their food stocks and depend much more on the market.
Figure 18: Share of expenditures spent on food per residency status
Share of expenditure spent on food will be influenced by the population receiving food aid. Other things being equal, a household which receives food aid will spend a smaller proportion of its income on food. Nonetheless, the fact that 41 percent of the population spends more than 65 percent of their expenditures on food, despite receiving food aid, is a sign of vulnerability.

Agok Rapid Food Security Assessment Report, September 2008-FINAL VERSION
24
4.7. Food access classification In determining the population’s ability to provide for its basic food needs it was decided to approximate this by using a set of indicators consisting of: 1) Area cultivated, 2) Share of expenditures spent on food, 3) Number of income sources.
The first variable – area under cultivation – is thought to capture the part of the population that rely on own production for a significant portion if its food needs. The second variable, as already mentioned above, indicates households’ ability to cope with price shocks and to acquire important non-food items (including productive assets, health care, education etc.). The third element was also chosen for its ability to predict households’ coping capacity and also because the variable was found to correlate with several other food access indicators. The three core indicators were cross-tabulated and households scored according to the table below.
Access indicators and classification
Area cultivated
0 Feddan/capit
a 0-0.3
Feddan/capita 0.3-0.6
Feddan/capita 0.6-
Feddan/capita
1 12 0 0 0
2 19 7 0 1
3 10 7 0 0
0-50%
Number of income sources
4 10 6 0 1
1 4 0 0 0
2 5 4 1 0
3 4 3 0 0 50-65%
Number of income sources
4 6 2 1 1
1 6 0 1 1
2 15 0 1 0
3 10 7 1 0
Share of expenditure
spent on food
65-100%
Number of income sources
4 20 3 4 4
Green cells indicate good food access, yellow indicates borderline food access and red cells indicates poor food access. Figures in cells are number of households. This information is summarized below in Figure 16.
It is apparent from the chart below that residents are performing somewhat better than IDPs, although this difference is not statistically significant. However it must be noted that the indicators might mask the access situation of the residents somewhat due to the seasonal variations in terms of expenditure, as previously mentioned.
The graph indicates that some 42 percent of the IDP population and 35 percent of the residents have a poor food access, while 17 and 19 percent of the IDPs and the residents respectively have a borderline access situation.

Agok Rapid Food Security Assessment Report, September 2008-FINAL VERSION
25
Figure 19: Food access by residency group
5. Food consumption Food consumption analysis is based on information gathered about food consumption in the week preceding the assessment field work. For a number of common food items, presented in table 5, households are asked about 1) how many days in the last week they a that particular food item and 2) its main source.
Sorghum is the primary staple food for people living in the Agok area. Figure 17 below shows that meat products, vegetables and to some extent dairy products are eaten relatively frequently and the pattern between residents and IDPs are similar.
Using standard WFP food consumption classification techniques and thresholds24, households are classified as having poor, borderline or good food consumption, based on the diversity of their food consumption and the frequency they consume these items. Figure 18 indicate that there more IDPs with poor food consumption score than residents. The majority of both IDPs and residents have good food consumption, 63 percent and 67 percent, respectively.
24 A score of 0-21=poor food consumption, 21,5-35= borderline and >35= good food consumption

Agok Rapid Food Security Assessment Report, September 2008-FINAL VERSION
26
Figure 20: Food item consumption per residency group
Figure 21: Food consumption classification per residency group
The table below details the food consumption patterns of the three food consumption groups. Sixty five (65) percent of the population – with good food consumption – falls in the right column, with acceptable consumption of cereals, animal protein, vegetables and fats. However, the poor and borderline groups, representing the remaining 35 percent of the population, have diets dominated by cereals.
The borderline group consumes a modest frequency of vegetables and fats, and only very seldom animal proteins. It is most likely inadequate in micronutrients.

Agok Rapid Food Security Assessment Report, September 2008-FINAL VERSION
27
The poor consumption group – representing 13 percent of the population – has an entirely inadequate diet, composed almost exclusively of cereals, lacking in protein and micronutrients.
Table 5: Food consumption pattern per food consumption group Average number of days eaten in the last week
Poor food consumption
Borderline food consumption
Good food consumption
Sorghum 5 7 7 Millet Other cereal 1 Tubers 1 Beans, peas, legumes 1 2 Groundnuts, sesame 1 Meat, fish, egg 1 4.5 Vegetables 1 3 4 Fruit Oil 1 3 6 Sugar 2 4 6
Food items
Dairy 3
Colour Legend: 0-1 days/week 2-3 days/week 4-5 days/week 6-7 days/week The numbers in the table cells represent average number of days that a particular food item was eaten during the week preceding the assessment field work.
For adults, the average number of meals consumed per day25 for residents was found to be 1.8 and 1.7 for IDPs. The graph below however indicates that the number of adults consuming one meal or less is higher amongst the IDPs than amongst the residents.
The average number of meals consumed by the children <5 years of age was 2.1 for residents and 1.8 for IDPs. Graph 20 indicates a further difference, as there are no children amongst the residents whose children only ate one meal.
25 The information was gathered by asking household how many meals they ate during the one day preceding the day of the interview.

Agok Rapid Food Security Assessment Report, September 2008-FINAL VERSION
28
Figure 22: Number of meals per day for adults, per residency group
Figure 23: Number of meals per day for children, per residency group
6. Food security Using standard WFP techniques, food security classifications were derived by cross-tabulating food access and food consumption. Forty one (41) percent of the overall population was classified as severely food insecure, 17 percent as moderately food insecure and 41percent as food secure.
Food consumption
Poor food consumption
Borderline food consumption
Good food consumption
Poor access 13 19 37
Borderline access 5 5 21 Food access
Good access 4 15 58
Green cells indicate food security, yellow indicates moderate food insecurity and red cells indicate severe food insecurity. Figures in cells are number of households.

Agok Rapid Food Security Assessment Report, September 2008-FINAL VERSION
29
The resident population performs better than the displaced population, but the difference is small and statistically insignificant – see chart below.
Figure 24: Food security classification per residency group
7. Coping strategies Coping strategies are employed by households to mitigate effects of shocks – in this case food shortage. Fifty seven (57) percent of the population reported experiencing difficulty providing food for their households in the week preceding the assessment, which is not surprising considering that the assessment was done during the lean season. Slightly fewer residents experienced food shortage, but the difference is small (see chart below).
Figure 25: Food shortage per residency group
Coping strategies can be divided into Consumption- and Non-Consumption (related to changes income generation or asset ownership). The most common strategy in the consumption category is relying on less expensive/preferred food, to reduce number of meals per day, reduce meal size, borrow food and to gather wild food (figure 23). With the exception of relying on less

Agok Rapid Food Security Assessment Report, September 2008-FINAL VERSION
30
expensive/preferred food, no coping strategy is employed on average more than 1 day in the past week.
Figure 26: Frequency of Consumption related coping per residency group
0
0.2
0.4
0.6
0.8
1
1.2
1.4R
ely
on le
ssex
pens
ive/
pref
erre
d
Bor
row
ed fo
od
Gat
her w
ild fo
od
Har
vest
imm
atur
ecr
ops
Con
sum
e se
edst
ock
Red
uce
mea
l siz
e
Red
uce
num
bers
of
mea
lsG
o da
ys w
ithou
tea
ting
Res
tric
t adu
ltco
nsum
ptio
n
Send
aw
ay c
hild
ren
Red
uce
expe
nditu
res
on
Spen
d sa
ving
s
Sell
food
aid
Beg
Ave
rage
day
s pe
r wee
k
IDP
Resident
For the Non-Consumption category the recall period was one month and these are not strategies that you use on a daily basis. The most commonly used strategies were found to be; borrowing money, selling household articles (utensils, blankets, jewellery etc.) and selling furniture. These practices were common for both IDPs and residents. In addition, a common way of coping for residents was to sell animals.
Figure 27: Long-term coping and residency group
0
5
10
15
20
Sold
HH
artic
les
Sold
agric
ultu
ral
inpu
ts
Sold
build
ing
mat
eria
l
Sold
furn
iture
Sold
poul
try
Sold
sm
all
anim
als
Sold
larg
ean
imal
s
Bor
row
edm
oney
Perc
ent o
f hou
seho
lds
IDPResident
Agok Rapid Food Security Assessment Report, September 2008-FINAL VERSION
31
8. Lives and livelihoods at risk Food security analysis typically takes into account coping strategies employed by households, since coping is believed to be potentially harmful to the health or livelihood of households, as seen by some of the examples above. Analyzing the sustainability of employed coping practices also sheds light on the future food security status of households. In order to incorporate coping to food security analysis, a set of strategies were selected, assigned severity and combined into a composite indicator of severity of employed coping. Depending on the answers, the household was classified as being at risk to lives, at risk to livelihoods, or not at risk.
Taking into account some of the core elements described above – specifically food consumption, food access and risks associated with employed coping strategies – households are classified as being not at risk, at risk to livelihoods or at risk to lives.
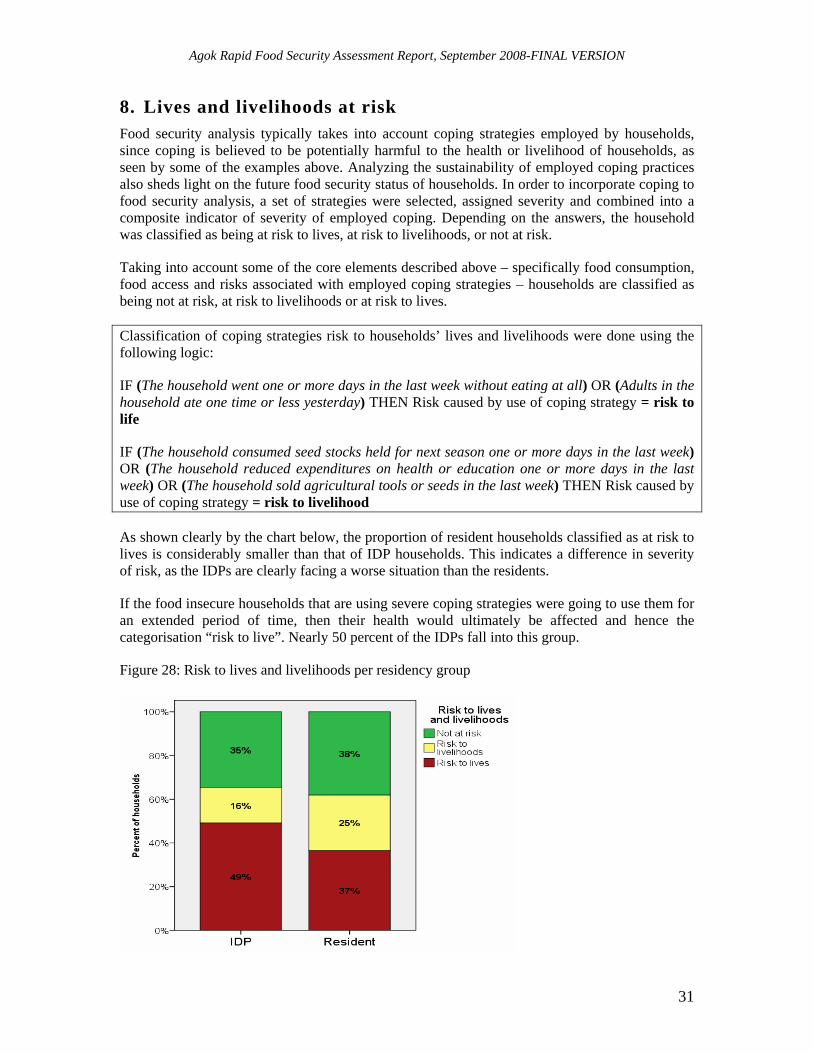
Classification of coping strategies risk to households’ lives and livelihoods were done using the following logic:
IF (The household went one or more days in the last week without eating at all) OR (Adults in the household ate one time or less yesterday) THEN Risk caused by use of coping strategy = risk to life
IF (The household consumed seed stocks held for next season one or more days in the last week) OR (The household reduced expenditures on health or education one or more days in the last week) OR (The household sold agricultural tools or seeds in the last week) THEN Risk caused by use of coping strategy = risk to livelihood
As shown clearly by the chart below, the proportion of resident households classified as at risk to lives is considerably smaller than that of IDP households. This indicates a difference in severity of risk, as the IDPs are clearly facing a worse situation than the residents.
If the food insecure households that are using severe coping strategies were going to use them for an extended period of time, then their health would ultimately be affected and hence the categorisation “risk to live”. Nearly 50 percent of the IDPs fall into this group.
Figure 28: Risk to lives and livelihoods per residency group

Agok Rapid Food Security Assessment Report, September 2008-FINAL VERSION
32
9. Priorities Immediate priorities were similar across residency groups: Both residents and IDPs identify food assistance, improved security and shelter/housing as the most important short-term priorities. However, IDPs prioritize improved security and shelter/housing more than residents do, and residents put more emphasis on food assistance than IDPs do. This is not surprising as IDPs were receiving food assistance at the time of the assessment and would therefore tenbd to prioritize other needs that have not yet been met.
Figure 29: First short-term priority26 per residency group
Food assistance and shelter/housing remain at the top also for second most important short-term priority, for both IDPs and residents. Cash assistance is also mentioned by a significant portion of the population.
26 Priorities reported by less than 2 percent of the population were grouped in the “other” category.

Agok Rapid Food Security Assessment Report, September 2008-FINAL VERSION
33
Figure 30: Second short-term priority27 per residency group
10. What are the characteristics of the food insecure? So far this report has outlined the differences in food insecurity between the two residency groups where IDPs were slightly more food insecure than residents. More importantly, when looking at the severity of food insecurity IDPs, were much worse off with nearly 50 percent being at risk to lives caused by the type of coping strategy they have adopted . Figure 28 below shows an interesting result as it would seem that female headed households are better off than the male headed ones. This could depend on the type of income sources that currently are available, being easier for women to get than men. It could also depend on the size of the households where the female headed households are generally smaller. It may also have to do with the fact that some of female-headed HHs receive remittances from husbands based in larger towns of Khartoum and Juba. Polygamous marriages are common in the area and thus even though reported as female-headed households they may be supported a husband even though he might not be strictly part of the household i.e. eating regularly from the same pot. Households with high and low dependency ratios were not very different in terms of food security.
27 Priorities reported by less than 2 percent of the population were grouped in the “other” category. Delete duplicate footnote.

Agok Rapid Food Security Assessment Report, September 2008-FINAL VERSION
34
Figure 31: Sex of household head and food security status
Figure 29 indicates that there is little or no relation between a low MUAC and food security status. Very low MUAC is found in all three food security categories, even amongst the food secure and the moderately low MUAC is equally found amongst severely food insecure as amongst food secure households.
Figure 29: MUAC measurement and food security status
11. Chronic versus transitory Food insecurity Based on the level of assets (land access and livestock ownership), number of income sources and the food consumption score the residents can be classified as transitory food insecure due to seasonal variation. They mainly fall into the food insecure category due to their current dependency on the market and thus the share of expenditure on food is higher than normal. The types of coping strategies that they adopt do not indicate at this point a stress beyond the normal, and any assistance given should be aimed at protecting their livelihoods. The IDPs have suffered a severe shock; have lost assets, land, homes and income sources. Their food consumption is relatively fine but may be masked by their current receipt of food aid. The coping strategies indicate a more severe situation than the residents caused by their displacement

Agok Rapid Food Security Assessment Report, September 2008-FINAL VERSION
35
and the shock itself. Thus the food security situation they find themselves in now might be transitory, if the time they remain in Agok is limited. It is not known from this assessment whether they were chronically food insecure in Abyei and thus whether they would return to a food secure or food insecure situation.
12. Scenarios
12.1. Short-term scenarios (3 months) While relevant to the next three months, the scenarios below will cover a sensitive period of time that will have significant impact on events over the coming 12 months. Although it is very difficult to predict political outcomes in Abyei at present, the likelihood of the scenarios are graded from most likely to worst case based on current dynamics at the local and national levels.. These grades could be reconsidered over coming months if and when changes in the political environment dictate. The worst case scenario should be used for contingency planning.
Most likely short-term scenario: successful transition (probability: high)
• Newly appointed administration is provided with financial and logistical support necessary to function effectively over the near term
• JIU (Joint Integrated Units) and JIPU (Joint Integrated Police Units) establish stable security environment in area of deployment between River Kiir/Bahr al Arab and oil field towns of Nyama and Difra
• Ethnic tensions are reduced through reconciliation efforts led by UNMIS and Government of National Unity (GNU); leading to large-scale return to Abyei and contiguous areas. This scenario would help to build trust between parties to the CPA and allow recovery and reconstruction efforts to begin immediately.
• Possibly 1/3 to 1/2 of the IDPs will begin to return to their locations of origin to resettle north
of the river. Based on informal interviews, households will most likely divide themselves between the north and south of river, with adults constructing shelter and clearing land and many female caretakers and children staying behind in Agok. Should conflict resume, however, even if only at localized ethnic level, many of these households would move back to Agok completely and be joined by additional households currently north of river in outlying villages.
Operational Requirements: Access to rural areas in areas to the north and possible return of population would increase caseload by approximately 10,000-15,000, lead to resumption of FFE activities in schools unaffected by the conflict, and FFR/FFW would increase to assist in recovery and reconstruction and to cover rural populations unaffected by conflict. Logistics hub for operation would begin gradual shift to Abyei once Sub-Office is re-established. Limited and temporary increase in staffing levels may be required to assist with registration of IDPs in villages of return.
Worst case scenario: Status Quo (probability: medium)
Agok Rapid Food Security Assessment Report, September 2008-FINAL VERSION
36
(a) Failure of SPLM and NCP to implement critical aspects of the Abyei Road Map, such as establishment of a functional and effective administration in Abyei (b) inability of the JIU and JIPU to maintain adequate levels of security in areas north of the River Kiir/Bahr al Arab, especially in Abyei town and villages to its immediate north, or (c) chronic ethnic conflict in and around Abyei town between Misseriya and Dinka during early phase of return will limit population movement of IDPs and delay the resettlement process. This scenario would increase the likelihood of conflict emerging at a later stage unless resolved through further negotiations.
Operational Requirements: With most of the population remaining in current locations, the Sub-Office would continue operating out of Agok with logistical support from Wunrok Field Office.
12.2. Long-term scenarios (12 months) These scenarios extend through the 2009 rainy season (when is this?).
Most likely scenario: successful transition (probability: medium)
The “successful transition” scenario described above continues through dry season, oil revenues from GNU assist in speeding up recovery and reconstruction, agencies re-establish presence in Abyei. IDP population resettles Abyei town and abandoned villages. Ethnic relations and security environment in Southern Kordofan remain stable, allowing for robust logistics pipeline.
Operational Requirements: Same as the “successful transition” scenario above, although temporary staffing surge would end following registration of IDPs and logistics hub would shift completely to Abyei.
Worst case scenario: conflict resumes (probability: medium)
(a) Clashes between SAF and SPLA in Abyei in Nuba or border areas has spill-over effect on Abyei, or (b) ethnic violence along Misseriya migration corridors, or (c) ICJ arbitration results released in second quarter 2009 are rejected and Abyei roadmap fails, or (d) ICC proceedings, failure of elections and/or consequences of Darfur conflict alter relations between SPLM and NCP; leading to sustained conflict and/or collapse of CPA Operational Requirements: Same as in the “conflict resumes” scenario above, although operational capacity may be more severely affected as conflict takes on broader or more intensive dimensions. An additional 10,000 IDPs may be expected in Agok area.
13. Response Options
The findings and the decision tree on the next page would indicate the need for responses in the health, sanitation and nutritional education field for households who have malnourished children but are not facing food shortages Addressing these critical elements of child malnutrition, as also recommended by previous nutritional assessments, should be a feature of the on-going humanitarian response. Supplementary and Therapeutic feeding, with a possibly Community Therapeutic Care as locations are spread out, are activities that would address malnutrition including the non-food responses mentioned above addressing feeding and hygiene practices etc.
Food is available in the market but limited quantities due to the lean season. As soon as the crops have been harvested this is expected to improve. The majority of households have access to

Agok Rapid Food Security Assessment Report, September 2008-FINAL VERSION
37
markets with less than an hour walking time so in principle cash/vouchers could be an option if capacity was available. This is however not the case and thus not a realistic option.
Food for Work has been considered and is theoretically an option. However, schemes would not cover all beneficiaries or all locations and thus patterns of people moving to GFD locations from FFW locations have unfortunately been noted. Whilst FFW would be a good option for vulnerable residents it is however not very relevant for an IDP population who is waiting to see if they can return before investing to much time and efforts in setting up a livelihood in Agok and thus they might lack the interest to enrol in schemes that they in the end would not benefit from.
Food for Work is however a good option in three months time if the “Most likely Scenario” takes place and IDPs begin to return. FFW could then be possible for remaining residents as the caseload has reduced and implementing partners can move on to recovery and development. The project that WFP has with Mercy Corps could then be expanded looking at kitchen gardens and shelters.
Food For Recovery (General Food Distribution with conditions) should be considered for the returnees when they begin to return to Abyei until the main harvest in 2009. The ration should basically be the same as a GFD but with light conditions of land clearance, cultivation, shelter constructions etc.

Agok Rapid Food Security Assessment Report, September 2008-FINAL VERSION
38
Are there current or anticipated food shortages at household level (based
on their food consumption and access)?
Is food available in the local markets or nearby markets?
If yes:
If no:
If no:
Can constraints to market supplies be removed in a timely
manner (such as with road repairs, transport, storage, credit to traders,
better security)?
If yes:
If no:
Is physical access to markets possible (based on roads, transportation,
distance, security)?
If yes:
If yes:
If no:
If no:
Advocate for responses in health, water, sanitation,
care, cooking means, nutrition education (based
on non-food causes of malnutrition)
DECISION-TREE on RESPONSE OPTIONS
Are nearby markets well connected (based on
roads, transport means)?
Can constraints to communications be removed
in a timely manner (such as with road repairs, transport,
better security)?
If no:
If yes:
Will traders be able to bring in additional supplies in a
timely manner if households’ demand increases
(based on markets integration)?
Is there current or anticipated malnutrition at individual level (based on their nutritional status)?
If no:
No nutritional intervention
required
If yes:
Can household access to food be restored in a timely manner
(such as with public works, cash-for-work, cash/voucher transfers)?
If no:
If yes:
Advocate for therapeutic feeding if
malnutrition rates are high
If yes:
Consider food distributions or food-for-work
Consider or advocate for cash/
vouchers distributions or cash-for-work
Advocate for responses in infrastructure repairs,
assistance with transportation, storage,
traders’ credit and improved security
Advocate for responses to support livelihoods, such as
agriculture production (crops, livestock), employment, social safety nets, skills, education,
households’ credit
Consider food-for-training and school feeding
Consider supplementary feeding while household food access is restored, if
malnutrition rates are moderate
Consider supplementary feeding together with non-
food responses to malnutrition, if malnutrition
rates are moderate
Food procurement in
nearby local markets NOT
recommended
Consider food procurement in
nearby local markets
Entry points

Agok Rapid Food Security Assessment Report, September 2008-FINAL VERSION
39
14. Recommendations These recommendations are based on the most likely scenario and are ongoing activities that should continue. • Supplementary and Therapeutic Feeding should continue as possibly expand to rural areas
through CTC for malnourished individuals are recommended as previous assessment show a precarious nutritional situation.
• Continue General Food distributions until December 2008 to 36,000 beneficiaries.
January-October 2009 (does this time frame also apply for the above two recommendations?)
• Returning IDPs to Abyei should be supported until October 2009 (main crop harvest) as there homes and livelihoods have been destroyed and it would take time to re-establish their livelihoods. It is recommended that it is done in the form of Food for Recovery (conditioned GFD, however the ration could be the same as GFD).
• The returnees should also be considered for Agricultural support programmes, seeds, tools and livestock restocking in order to speed up the livelihood recovery.
• Remaining IDPs in Agok would also need support until the end of next year’s main harvest as they have not been able to plant anything this season. WFP will have to set up a system whereby households would only be able to receive food assistance in one location, either as returnee in Abyei or as IDP in Agok. (As explained in the scenario section, households will most likely split up and some members go ahead to Abyei whilst the rest remain in Abyei).
• 5,000 vulnerable residents could be supported through FFW and the Mercy Corps project. Once the IDP population reduces and it will be easier to register IDPs from residents then any GFD to this group should be terminated as their food security situation does not support it after the lean season ends.
• Food For Education is an alternative response to reach vulnerable residents in Agok.
• Once large number of IDPs have returned to Abyei then it is recommended that a follow-up assessment is carried out to base future responses on the actual conditions there.
• The requirements of the above is approximately 550MT/month

Agok Rapid Food Security Assessment Report, September 2008-FINAL VERSION
40
Appendix 5: Team members Assessment design, analysis, report writing Anders Petersson, WFP VAM Khartoum Report writing Yvonne Forsén, WFP VAM Khartoum Report writing, editing etc Brian Bogart, Head of WFP Agok sub office Field team leader Paul Anywayo, WFP VAM Juba Enumerators Agency Madit Abol Salva SSCCSE Ring Yai Kuol FAO Ajack Mijack Koj SC-USA Joseph Simiyu AMA Deng Mayol SSRRC Chol Aguek SSRRC Alloc Chol SSRRC Joseph Kissanga WFP Isaac Makau WFP Arob Aguek NDO Makuaj Abem GOAL Jok Kuol SSRRC Deng Kur GOAL Abraham Ring GOAL Samuel Chol S.WELFARE Marco Dumbek WFP John Aleu SOAARF Afaf John S.WELFARE William Wol WARDS