a randomized, double-blind, crossover study on the pharmacokinetics of a novel formulation of coq 10...
TRANSCRIPT
A Randomized, Double-Blind, Crossover Study onthe Pharmacokinetics of a Novel Formulation of
CoQ10 With Pyridoxal 5′-Phosphate andPhosphatidyl Choline
Malkanthi Evans, PhDPrachi Sharma, MScNajla Guthrie, HBSc
ABSTRACT. The pharmacokinetics of a single 30-mg dose of a novel enteric-coatedcoenzyme Q10 (CoQ10) formulation with pyridoxal 5′-phosphate and phosphatidylcholine (CoQ10-P5P-PC) was investigated against two comparators CoQ10 (NPN02176955) and CoQ10 (DIN 02231736) in 21 healthy volunteers, with screening CoQ10
levels of 0.8 ± 0.2 mg/L. A randomized, double-blind, crossover study was designedwith a washout period of 2 weeks between each formulation and blood sampled at 2,4, 5, 6, 8, 12, 24, 48 and 72 hr postdose. Significantly, higher plasma concentrationswere demonstrated for the CoQ10 (NPN 02176955) formulation at 6 and 8 hr postdose(p = .010 and p = .042, respectively). There were no significant differences betweenformulations with respect to the area under the curve, AUC(0–72 hr), or the maximumplasma concentration (Cmax). Total CoQ10 (Tmax) reached maximum plasma concen-trations at 6.4 ± 2.5 hr after supplementation with CoQ10 (NPN 02176955), 8.0 ±9.8 hr with CoQ10-P5P-PC, and 9.5 ± 9.3 hr with CoQ10 (DIN 02231736). The esti-mated elimination half-life (t1/2) was 92.3 hr after a single oral dose of CoQ10-P5P-PC,38.2 hr with CoQ10 (NPN 02176955), and 80.7 hr with CoQ10 (DIN 02231736). Theresults suggest that CoQ10 is available for a longer time in subjects’ administered withCoQ10-P5P-PC in comparison with the other two formulations studied. There wereno significant differences in adverse events, by severity, causality, or organ system.The CoQ10-P5P-PC formulation was found to be superior in the t1/2, and it may besuggested that fewer doses are required to maintain healthy circulatory CoQ10 levels.
KEYWORDS. CoQ10, pyridoxal 5′-phosphate, phosphatidyl choline, half-life, phar-macokinetics
Malkanthi Evans, Prachi Sharma, and Najla Guthrie are affiliated with KGK Synergize, Inc.,London, ON, Canada.
Address correspondence to: Dr. Malkanthi Evans, Scientific Director, Contract Research ServicesDivision, KGK Synergize, Inc., Suite 1440, One London Place, 255 Queens Avenue, London, ON,Canada N6A 5R8 (E-mail: [email protected]).
314
Journal of Dietary Supplements, Vol. 7(4), 2010Available online at www.informaworld.com/WJDS
C© 2010 by Informa Healthcare USA, Inc. All rights reserved.doi: 10.3109/19390211.2010.522551
J D
ieta
ry S
uppl
Dow
nloa
ded
from
info
rmah
ealth
care
.com
by
Uni
vers
ity L
ibra
ry U
trec
ht o
n 09
/14/
13Fo
r pe
rson
al u
se o
nly.
Evans et al. 315
INTRODUCTION
Clinical and experimental studies indicate that coenzyme Q10 (CoQ10) deficiencymay be associated with hypertension, hyperlipidemia, coronary artery disease, andcongestive heart failure (Greenberg & Frishman, 1990; Wajda, Zirkel, & Schaffer,2007). Evidence from human trials suggests CoQ10 supplementation to be of benefitfor individuals taking β-blockers and statins, both of which have been found to reduceplasma CoQ10 levels by up to 40% (Ghirlanda et al., 1993; Greenberg & Frishman,1990; Kishi, Watanabe, & Folkers, 1977; Mortensen, Leth, Agner, & Rohde, 1997).Supplementation with CoQ10 has also been investigated in individuals with neurologicaldisorders, cancer, diabetes, migraine, asthma, and other clinical conditions (Miles et al.,2006).
CoQ10 is the most common coenzyme Q in human mitochondria (Ernster &Dallner, 1995) and is a component of the electron transport chain generating 95%of the energy required in the form of adenosine triphosphate (Mitchell, 1991). There-fore, organs with the highest energy requirements, such as the heart, liver, and brain,are reported to have the highest CoQ10 concentrations (Dutton et al., 2000). CoQ10 isan endogenously produced cofactor in oxidative respiration in the Krebs cycle and theelectron transport chain (Bhagavan & Chopra, 2006). In the blood, CoQ10 is associ-ated primarily with low-density lipoprotein (LDL) (Alleva, Tomasetti, Bompadre, &Littarru, 1997). The reduced form of CoQ10 (CoQ10H2) functions as an antioxidant toreduce oxidative stress on LDL. Early work suggested that CoQ10 levels were modifiedwith age, disease (cardiovascular and neuromuscular diseases), medications (statins),and impaired synthesis (Wajda et al., 2007).
Absorption of CoQ10 in the gastrointestinal (GI) tract is enhanced in the presenceof lipids that induce the release of bile. This in turn promotes emulsification that helpsin CoQ10 absorption (Ostlund, Spilburg, & Stenson, 1999). Thus, oil-suspended or oil-solubilized CoQ10 may increase bioavailability of CoQ10 because of its fat solubility(Weis et al., 1994). Nonlinear CoQ10 absorption has been suggested from a few humanstudies (Miles, 2007), and information from animal models suggests that CoQ10 is takenup by all tissues following oral administration (Bhagavan & Chopra, 2006). Peak levelsof CoQ10 occur at 5–10 hr following administration, with a half-life of 34 hr (Bhagavan& Chopra, 2006; Greenberg & Frishman, 1990; Tomono, Hasegawa, Seki, Motegi, &Morishita, 1986). A second peak may occur at approximately 24 hr, probably due toenterohepatic recirculation (Miles, 2007).
The pharmacokinetics of a novel formulation of CoQ10 with pyridoxal 5′-phosphateand phosphatidyl choline (CoQ10-P5P-PC) was investigated in this study. The activeform of vitamin B6, pyridoxal 5′-phosphate, also known as PLP and P5P, has beenreported to be deficient in individuals with low plasma CoQ10 (Willis, Anthony, Sun,Honse, & Qiao, 1999). Phosphatidyl choline or lecithin is a naturally occurring emulsifierand has been demonstrated to significantly increase the bioavailability of a phytosterolcompound, sitostanol (Ostlund et al., 1999). It was hypothesized that a CoQ10 sup-plement formulated with P5P and lecithin (>35% phosphatidyl choline) may increasebioavailability of CoQ10 over currently marketed forms of CoQ10, which have CoQ10 asthe sole active ingredient. Furthermore, this formulation uses an enteric coating process(cellulose acetate phthalate), which may enhance the delivery of the active ingredient,CoQ10, to the small intestine, bypassing the digestion process of the stomach.
The objective of this trial was to compare the area under the concentration curve(AUC), the maximum concentration (Cmax), the time of maximum concentration (Tmax),
J D
ieta
ry S
uppl
Dow
nloa
ded
from
info
rmah
ealth
care
.com
by
Uni
vers
ity L
ibra
ry U
trec
ht o
n 09
/14/
13Fo
r pe
rson
al u
se o
nly.
316 JOURNAL OF DIETARY SUPPLEMENTS
and the estimated elimination half-life (t1/2) of a single 30-mg dose of CoQ10-P5P-PCwith that of two commercial CoQ10 preparations, in healthy adults.
METHODS
Materials
CoQ10-P5P-PC was provided by Enerex Botanicals Ltd., Burnaby, BC, Canada, andmanufactured by Canadian Phytopharmaceuticals Corp., Richmond, BC, Canada. Eachcaplet consisted of CoQ10 (30 mg), vitamin B6 (as P5P, 10 mg), lecithin (>35% phos-phatidyl choline, 250 mg), and nonmedicinal filling of dicalcium phosphate, magnesiumstearate, microcrystalline cellulose, silicon dioxide, vegetable stearin, and cellulose ac-etate phthalate. The product was manufactured under the quality control regulations ofgood manufacturing practice.
CoQ10-P5P-PC was tested against two comparator products, 30-mg CoQ10 (DIN02231736, WN Pharmaceuticals Ltd., Coquitlam, BC, Canada) and 30-mg CoQ10 (NPN02176955, Jamieson Laboratories Ltd., Windsor, ON, Canada). Each capsule of CoQ10
(DIN 02231736) contained 30-mg CoQ10 (ubidecarenone) with nonmedicinal ingredi-ents, cellulose and gelatin capsule. Each capsule of CoQ10 (NPN 02176955) contained30-mg CoQ10 (ubiquinone) with black iron oxide, gelatin, glycerin, red iron oxide,soy lecithin, soybean oil, yellow iron oxide, and yellow beeswax, as the nonmedicinalingredients.
Subjects
This study was conducted in accordance with good clinical practice guidelines and theethical principles of the Declaration of Helsinki (2000). The study protocol was approvedby an Institutional Review Board (IRB Services, Aurora, ON, Canada). The study wasreviewed by Health Canada’s Natural Health Products Directorate (NHPD) and wasconducted in accordance with NHPD regulations. Informed consent was obtained fromeach subject prior to participation.
Twenty-one healthy subjects were recruited from the patient database and by adver-tisement. Inclusion required that subjects should have a screening CoQ10 level of 0.8 ±0.2 mg/L, body mass index between 18 kg/m2 and 30 kg/m2, be 18 years or older, andbe nonsmokers. Exclusion criteria included pregnancy, breastfeeding, alcohol, or drugabuse, as well as the presence of food restrictions, allergies or intolerances, unstablemedical conditions, use of Coumadin (warfarin), supplements containing CoQ10, orother natural health products within 2 weeks of randomization and use of any acutemedication within 72 hr of the study.
Randomization and Blinding
Subjects were randomized using a computer-generated randomization table and as-signed to one of three treatment sequences in blocks of three. To protect blinding,envelopes containing product were labeled with individual unique randomization num-bers and a treatment (1, 2, or 3) labeled according to the order to be received. In-dividual sealed envelopes containing treatment assignment were maintained for each
J D
ieta
ry S
uppl
Dow
nloa
ded
from
info
rmah
ealth
care
.com
by
Uni
vers
ity L
ibra
ry U
trec
ht o
n 09
/14/
13Fo
r pe
rson
al u
se o
nly.
Evans et al. 317
subject. Subjects, investigators, and clinic coordinators were blinded to test product andsequence. In the event that an adverse event was considered serious and related to theproduct under investigation, the blind would be broken for that individual. Personnelrelated to analysis, statistics, and report writing remained blinded.
Study Design
This study was a randomized, double-blind, crossover, 72 hr, bioavailability studyconducted at a single site in London, ON, Canada. CoQ10 formulations were admin-istered as single oral dose in the morning, with a 2-week washout period between thethree CoQ10 formulations. At screening medical/medication history including concomi-tant medications was reviewed, and anthropologic measurements and routine blood testswere conducted. Fasting blood samples were taken predose for CoQ10 determination.Subjects were given one capsule of the test product at time 0 with 125 mL of water andprovided with breakfast. Blood samples were taken from subjects at 2, 4, 5, 6, 8, 12,24, 48 and 72 hr postdose. Subjects were provided with a meal after the 4- and 8-hrblood sampling and were allowed to leave the clinic after the 12-hr sampling. Identicalmeals were supplied to all subjects on each test day. Subjects returned to the clinic forthe 24-, 48-, and 72-hr blood sampling. Concomitant therapies and inclusion/exclusioncriteria were reviewed at each visit. Adverse events were discussed with subjects at eachvisit in order to determine if the subject experienced any events since the last visit. Anychanges in medications and/or health status were recorded. All adverse events reportedwere assessed by the medical investigator for relatedness to the study product, andseverity, frequency/duration, and outcome of event were recorded.
Analytical Procedures
Laboratory tests (routine hematology and clinical chemistry) were conducted at Life-Labs Medical Laboratory Services, London, ON, Canada. The plasma concentrations oftotal CoQ10 were analyzed by high performance liquid chromatography with ultravioletdetection (HPLC-UV) by KGK Synergize Laboratory, London, ON, Canada. Data en-try and verification were executed according to KGK Synergizes’ Standard OperatingProcedures.
Determination of Plasma Concentration of CoQ10
The concentrations of CoQ10 in plasma were quantified by high-performance liquidchromatography (HPLC) described previously (Mosca, Fattorini, Bompadre, & Littarru,2002). In brief, 200 µL of plasma sample were mixed with 50 µL of 1,4-benzoquinone(2 mg/mL in ethanol, prepared fresh daily) and vortex mixed for 10 s. After a 10-min incubation at room temperature, 0.5 mL of n-propanol was added to the mixture.The solution was vortexed vigorously for 10 s and was centrifuged at 10,000 rpmfor 2 min. Further, 200 µL of the clear supernatant were transferred to a HPLC vialwith glass insert and 50 µL injected into the HPLC system. The HPLC system iscomposed of Varian solvent delivery module 210, Varian Autosampler model 410,Varian 335 Photodiode Array Detector for detection, and Microsoft workstation software6.4.1 for data acquisition. Reverse-phase isocratic HPLC analysis was performed on a
J D
ieta
ry S
uppl
Dow
nloa
ded
from
info
rmah
ealth
care
.com
by
Uni
vers
ity L
ibra
ry U
trec
ht o
n 09
/14/
13Fo
r pe
rson
al u
se o
nly.
318 JOURNAL OF DIETARY SUPPLEMENTS
Nova-Pak C18 Column (3.9 × 150 mm, 5 µm, Waters, Mississauga, ON, Canada);guard column was Pursuit C18 (2 mm, 3 µm, Varian, Santa Clara, CA, USA). Theflow rate was kept at 1 mL/min, and CoQ10 was detected at 275 nm, using HPLC grademethanol:ethanol (35:65, Fisher Scientific, Ottawa, ON, Canada) as the mobile phase.An external standard graph was prepared by spiking pooled plasma sample with CoQ10
(Sigma-Aldrich, Oakville, ON, Canada) at the following concentrations: 150 ηg/µL,75 ηg/µL, 37.5 ηg/µL, 18.75 ηg/µL, 9.38 ηg/µL, 4.7 ηg/µL, 2.3 ηg/µL, 1.2 ηg/µL,0.59 ηg/µL, and 0.29 ηg/µL. All standards were run in duplicate. Plasma samples spikedwith CoQ10 were used for quality control runs. The best-fitted graph was linear with aR2 value of 0.9999. The intra-assay and interassay coefficient of variance was less than4.74% and 2.02%, respectively.
Pharmacokinetic Analysis
The Cmax and Tmax were determined from the actual data. The area under the plasmaconcentration-time curve from 0 to 72 hr (AUC0−t) was calculated using the lineartrapezoidal rule.
Group mean concentrations were used in the calculation of t1/2. The log of theconcentrations was calculated, and curves were examined to determine the log-linearphase and were based on the first 24 hr postdose. A linear regression was used todetermine the slope, and the elimination rate was determined for the calculation of t1/2.
Statistical Analysis
Descriptive statistics for the plasma CoQ10 concentrations and AUC, Tmax andCmax, were provided, and between-treatment comparisons were made using a repeated-measures analysis of variance. For CoQ10, AUC, Tmax, and Cmax, were calculated forconcentrations between predose and 72 hr. In order to calculate individual subjectAUC0–t, data were corrected to their respective baselines. Estimated t1/2 was calculatedfrom the group mean curve and not on individual data, and standard deviations werenot calculated. Data were log transformed prior to statistical analysis, using repeated-measures one-way analysis of variance followed by the Holm–Sidak analysis to de-termine statistically significant differences between groups. Because of some negativevalues (decreases), analyses of log-transformed concentrations or areas under the curvewere not performed. Statistical comparisons were based on their nontransformed values.Probability values less than .05 were considered statistically significant. SAS version9.1 was used to perform the statistical analysis.
RESULTS
Twenty-one healthy subjects, 14 females and 7 males, aged 41.6 ± 15.9 years (range,21–75 years) were enrolled in the study. All subjects were in good health, as assessedby laboratory results, medical history, and physical examination. There were no with-drawals, and all subjects completed the study with 100% compliance.
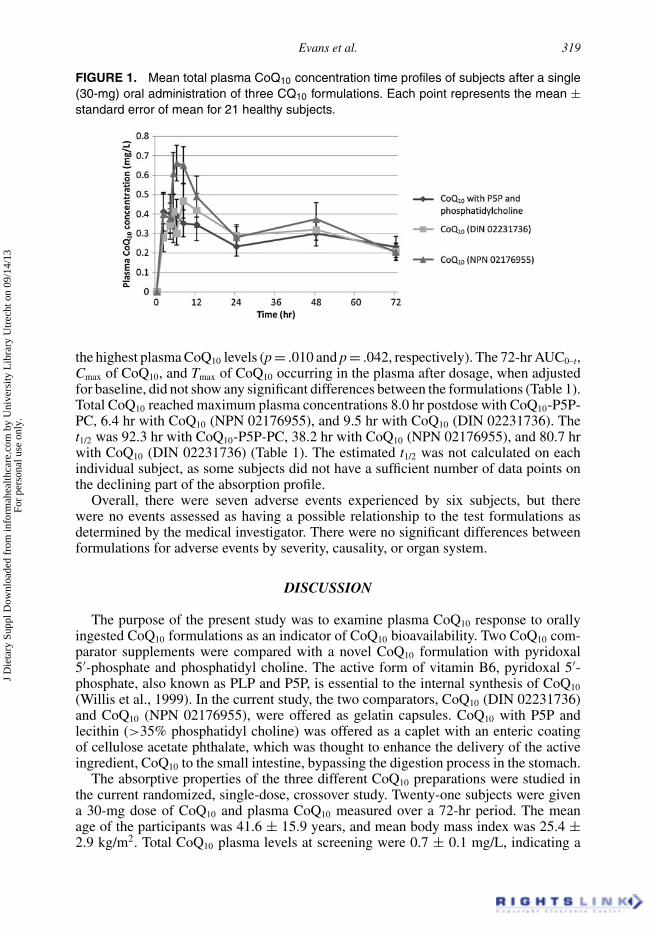
The mean plasma concentration-time curves for three CoQ10 formulations were sim-ilar (Figure 1). The plasma total CoQ10 concentration demonstrated a significant differ-ence in treatments at 6 and 8 hr after dosing with CoQ10 (NPN 02176955), demonstrating
J D
ieta
ry S
uppl
Dow
nloa
ded
from
info
rmah
ealth
care
.com
by
Uni
vers
ity L
ibra
ry U
trec
ht o
n 09
/14/
13Fo
r pe
rson
al u
se o
nly.
Evans et al. 319
FIGURE 1. Mean total plasma CoQ10 concentration time profiles of subjects after a single(30-mg) oral administration of three CQ10 formulations. Each point represents the mean ±standard error of mean for 21 healthy subjects.
the highest plasma CoQ10 levels (p = .010 and p = .042, respectively). The 72-hr AUC0–t,Cmax of CoQ10, and Tmax of CoQ10 occurring in the plasma after dosage, when adjustedfor baseline, did not show any significant differences between the formulations (Table 1).Total CoQ10 reached maximum plasma concentrations 8.0 hr postdose with CoQ10-P5P-PC, 6.4 hr with CoQ10 (NPN 02176955), and 9.5 hr with CoQ10 (DIN 02231736). Thet1/2 was 92.3 hr with CoQ10-P5P-PC, 38.2 hr with CoQ10 (NPN 02176955), and 80.7 hrwith CoQ10 (DIN 02231736) (Table 1). The estimated t1/2 was not calculated on eachindividual subject, as some subjects did not have a sufficient number of data points onthe declining part of the absorption profile.
Overall, there were seven adverse events experienced by six subjects, but therewere no events assessed as having a possible relationship to the test formulations asdetermined by the medical investigator. There were no significant differences betweenformulations for adverse events by severity, causality, or organ system.
DISCUSSION
The purpose of the present study was to examine plasma CoQ10 response to orallyingested CoQ10 formulations as an indicator of CoQ10 bioavailability. Two CoQ10 com-parator supplements were compared with a novel CoQ10 formulation with pyridoxal5′-phosphate and phosphatidyl choline. The active form of vitamin B6, pyridoxal 5′-phosphate, also known as PLP and P5P, is essential to the internal synthesis of CoQ10
(Willis et al., 1999). In the current study, the two comparators, CoQ10 (DIN 02231736)and CoQ10 (NPN 02176955), were offered as gelatin capsules. CoQ10 with P5P andlecithin (>35% phosphatidyl choline) was offered as a caplet with an enteric coatingof cellulose acetate phthalate, which was thought to enhance the delivery of the activeingredient, CoQ10 to the small intestine, bypassing the digestion process in the stomach.
The absorptive properties of the three different CoQ10 preparations were studied inthe current randomized, single-dose, crossover study. Twenty-one subjects were givena 30-mg dose of CoQ10 and plasma CoQ10 measured over a 72-hr period. The meanage of the participants was 41.6 ± 15.9 years, and mean body mass index was 25.4 ±2.9 kg/m2. Total CoQ10 plasma levels at screening were 0.7 ± 0.1 mg/L, indicating a
J D
ieta
ry S
uppl
Dow
nloa
ded
from
info
rmah
ealth
care
.com
by
Uni
vers
ity L
ibra
ry U
trec
ht o
n 09
/14/
13Fo
r pe
rson
al u
se o
nly.

TAB
LE1.
Pha
rmac
okin
etic
Par
amet
ers
for
Pla
sma
Tota
lCoQ
10A
fter
aS
ingl
e30
-mg
Ora
lDos
eof
One
ofT
hree
CoQ
10
For
mul
atio
nsin
Hea
lthy
Sub
ject
s
Stu
dyG
roup
s
CoQ
10-P
5P-P
CC
oQ10
(NP
N02
1769
55)
CoQ
10(D
IN02
2317
36)
pva
lue
Par
amet
er( N
)M
ean
±S
DM
edia
n(M
in.,
Max
.)( N
)M
ean
±S
DM
edia
n(M
in.,
Max
.)( N
)M
ean
±S
DM
edia
n(M
in.,
Max
.)S
eque
nce
Trea
tmen
taP
erio
d
AU
C(0
–72
hr)
(mg/
L·hr)
(21)
20.3
±14
.5(2
1)25
.3±
15.5
(21)
22.1
±10
.6.3
55.4
15.0
9220
.3(−
0.0,
60.3
)23
.1(1
.8,6
0.4)
21.2
(−0.
2,36
.4)
Cm
ax(m
axim
umco
ncen
trat
ion)
(mg/
L)(2
1)0.
9±
0.4
0.8
(0.4
,1.7
)(2
1)1.
1±
0.3
1.1
(0.2
,1.8
)(2
1)0.
9±
0.3
0.9
(0.4
,1.5
).9
74.1
13.0
30
Tm
ax(t
ime
ofm
axim
umco
ncen
trat
ion)
(hr)
(21)
8.0
±9.
86.
0(2
.0,4
8.0)
(21)
6.4
±2.
56.
0(2
.0,1
2.0)
(21)
9.5
±9.
38.
0(2
.0,4
8.0)
.995
.267
.608
Not
e:S
tatis
tical
anal
ysis
was
cond
ucte
dus
ing
are
peat
ed-m
easu
res
anal
ysis
ofva
rianc
eon
nont
rans
form
edda
ta.
ap
valu
es<
.05
dem
onst
rate
stat
istic
ally
sign
ifica
ntbe
twee
ndi
ffere
nces
trea
tmen
t(gr
oup)
.
320
J D
ieta
ry S
uppl
Dow
nloa
ded
from
info
rmah
ealth
care
.com
by
Uni
vers
ity L
ibra
ry U
trec
ht o
n 09
/14/
13Fo
r pe
rson
al u
se o
nly.
Evans et al. 321
healthy population group as confirmed by the results from Grossi et al. (1992) whoreported total CoQ10 plasma levels of 0.80 ± 0.20 mg/L in healthy subjects.
Previous clinical studies have demonstrated the importance of monitoring plasmalevels of CoQ10 to verify absorption and compliance when assessing differing formula-tions of products (Ferrante et al., 2005; Kaikkonen, Tuomainen, Nyyssonen, & Salonen,2002; Miles et al., 2006; Permanetter et al., 1992; Strijks, Kremer, & Horstink, 1997).The AUC0–t is used for calculating the relative efficiency of investigational productsand has a number of important applications in toxicology, biopharmaceutics, and phar-macokinetics. Systemic bioavailability is best described by the measurement of therelative amount of an administered dose that reaches the general circulation (AUC),the maximum concentration achieved (Cmax), and the time (Tmax) at which this occurs(Wiela-Hojenska & Orzechowska-Juzwenko, 2003). For a supplement or drug to beconvenient for a person to self-administer, it is best available in an oral form, andfor it to be effective, it must be readily absorbed from the GI tract. As nutrients passthrough the liver before reaching the general circulatory system (the first-pass) and tobe effective, the product should also show some resistance to metabolism by the liver.Bioavailability is described as the ability of a supplement or drug to successfully passfrom the GI tract to the plasma.
Plasma CoQ10 has a biphasic profile following oral dosing with an initial peak inplasma concentration at 5–6 hr and a second peak between 12 and 24 hr from baseline(Constantinescu et al., 2007). The second peak reflects tissue redistribution (from theliver) and release into the circulation. Pharmacokinetic studies have shown that afteroral administration, CoQ10 plasma levels begin to increase above baseline levels within1–2 hr if taken prior to consumption of a meal (Miles et al., 2002; Tomono et al., 1986).The present study confirmed these results, as subjects were provided with breakfastimmediately after predose blood sampling, resulting in an increase in plasma CoQ10
levels within 1–2 hr from the baseline (predose).Following oral ingestion, the uptake and distribution of CoQ10 depend on its biochem-
ical characteristics. Because of its lipophilic 10-carbon chain and lipid characteristics(Miles, 2007), CoQ10 is insoluble in aqueous solutions, and thus, the first step in theuptake of exogenous CoQ10 is incorporation into chylomicrons in the small intestinefor transport into the lymph and to the peripheral blood, to be finally taken up by theliver cells (Reahal & Wrigglesworth, 1992; Scalori, Alessandri, Giovannini, & Bertelli,1990). The distribution phase occurs during the 6–12-hr period after the Cmax. In theliver, CoQ10 is incorporated into lipoproteins and released into the blood, and plasmaCoQ10 is associated with lipoproteins and shows affinity for very-low-density lipoprotein(VLDL) and LDL-cholesterol (Elmberger, Kalen, Brunk, & Dallner, 1989; Kaikkonenet al., 2002). Previous studies have shown a secondary plasma peak at approximately24 hr following CoQ10 administration (Miles et al., 2002; Tomono et al., 1986; Weiset al., 1994). This peak is most likely a result of enterohepatic recirculation, whereCoQ10 is released along with bile via the biliary tract and partially reabsorbed duringa second pass through the small intestine. In the present study, this recirculation peakwas seen at 48 hr following CoQ10 administration.
In the present study, after oral supplementation with three CoQ10 formulations 72 hrpostsupplementation, no significant differences between groups with respect toAUC(0–72 hr) were demonstrated. The Cmax of CoQ10 in the plasma after supplementationof each test product did not show significant differences between groups with respect tothe maximum concentration achieved. It was observed that total CoQ10 reached maxi-mum plasma concentrations (Tmax) at 8.0 hr after supplementation with CoQ10-P5P-PC,
J D
ieta
ry S
uppl
Dow
nloa
ded
from
info
rmah
ealth
care
.com
by
Uni
vers
ity L
ibra
ry U
trec
ht o
n 09
/14/
13Fo
r pe
rson
al u
se o
nly.

322 JOURNAL OF DIETARY SUPPLEMENTS
6.4 hr with CoQ10 (NPN 02176955), and 9.5 hr with CoQ10 (DIN 02231736). Thisdifference was not significant between groups. The profile of the plasma response curvewas similar to the three treatment groups. The plasma total CoQ10 concentration aftersupplementation of the three CoQ10 formulations showed that there was a significantdifference in treatments 6 and 8 hr after dosing with CoQ10 (NPN 02176955), demon-strating the highest plasma CoQ10 levels (p < .05).
The prolonged elimination phase in the CoQ10 pharmacokinetics curve shows theredistribution of CoQ10 from peripheral tissues into plasma. The biological half-life orthe estimated half-life of a substance is the time it takes for the product to lose halfof its pharmacologic, physiologic, or radiologic activity. This may also be a reflectionof the tissue redistribution and the subsequent release back into the circulation of thetest product. Previous studies in healthy subjects reported a prolonged termination half-life of approximately 33 hr following a single dose of CoQ10, and approximately 5–6days were required for plasma CoQ10 levels to return to baseline (Miles et al., 2002;Tomono et al., 1986; Weis et al., 1994). In the present study, the t1/2 was 92.3 hrafter supplementation with CoQ10-P5P-PC, 38.2 hr with CoQ10 (NPN 02176955), and80.7 hr with CoQ10 (DIN 02231736). These results suggest that CoQ10 remains in theblood stream and is available for a longer time in subjects taking CoQ10-P5P-PC incomparison with the other two formulations studied. Depending upon the presence ofCoQ10 in the circulation for a longer time after single-dose supplementation, fewerdoses may be required to maintain healthy circulatory CoQ10 levels and that the timeto pharmacological steady state is fairly prolonged (1–2 weeks). Further, this studydemonstrated similar predose CoQ10 levels in the subjects demonstrating that 2 weekswas sufficient for CoQ10 levels to return to baseline.
Previous studies have indicated the importance of product formulation (Bhagavan &Chopra, 2006). Using lipid formulations and taking CoQ10 with food are reported toincrease absorption. The presence of lipids in product formulations has been indicatedas promoting better absorption of CoQ10. In a previous bioavailability study, it wasfound that the increase per 100 mg of reduced CoQ10 formulation was remarkably highwhen offered with oil (Evans, Baisley, Barss, & Guthrie, 2009). CoQ10 absorption isenhanced in the presence of lipids by inducing the release of bile in turn promotingemulsification and hence absorption (Ostlund et al., 1999). Phosphatidyl choline fromsoybean lecithin, a naturally occurring emulsifier, has been demonstrated to increasethe absorption of lycopene, another fat-soluble compound (Nishimukai & Hara, 2004).Significantly, higher plasma CoQ10 levels after 6 and 8 hr of dosing with CoQ10 (NPN02176955) (p < .05) suggest that specific formulation with soy lecithin, soybean oil,and beeswax may have contributed toward higher bioavailability of this product.
In this study, CoQ10 with P5P and lecithin (>35% phosphatidyl choline) was offeredas a caplet with an enteric coating of cellulose acetate phthalate. The administration ofthe caplet was followed with the provision of a meal to the subjects. As enteric coating ofcellulose acetate phthalate is involved in enhancing the delivery of the active ingredientto the small intestine, bypassing the digestion process in the stomach, administration ofthis product on an empty stomach, without the consumption of a meal may contribute tobetter bioavailability in comparison with the other two products which were nonentericcoated. The competitor formulations were required to be taken with a meal, and itis noteworthy that the CoQ10 with P5P and lecithin demonstrated an increased t1/2 ascompared with the comparator products.
In conclusion, CoQ10-P5P-PC though showing similar AUC, Tmax, and Cmax to thecomparators demonstrated a better t1/2, suggesting the product is available in blood for
J D
ieta
ry S
uppl
Dow
nloa
ded
from
info
rmah
ealth
care
.com
by
Uni
vers
ity L
ibra
ry U
trec
ht o
n 09
/14/
13Fo
r pe
rson
al u
se o
nly.
Evans et al. 323
a longer period of time. It may be suggested that fewer doses of CoQ10-P5P-PC need tobe consumed in order to maintain healthy circulatory levels.
Declaration of Interest: The authors report no conflict of interest. The authors aloneare responsible for the content and writing of this article.
REFERENCES
Alleva R, Tomasetti M, Bompadre S, Littarru P. Oxidation of LDL and their subfractions: kineticaspects and CoQ10 content. Mol Aspects Med. 1997;18:s105–s112.
Bhagavan HN, Chopra RK. Coenzyme Q10: absorption, tissue uptake, metabolism and pharmacoki-netics. Free Rad Res. 2006;40:455–453.
Constantinescu R, McDermott MP, DiCenzo R, Elisabeth A, de Blieck EA, Christopher H, Beal MF,Bednarczyk EM. A randomized study of the bioavailability of different formulations of coenzymeQ10 (ubiquinone). J Clin Pharmacol. 2007;47:1580–1586.
Dutton PL, Ohnishi T, Darrouzet E, Leonard, MA, Sharp RE, Cibney BR, Daldal F, Moser CC. 4coenzyme Q oxidation reduction reactions in mitochondrial electron transport. In: VE Kagan andPJ Quinn (Eds.), Coenzyme Q: Molecular mechanisms in health and disease, pp. 65–82. BocaRaton, FL: CRC Press, 2000.
Elmberger PG, Kalen A, Brunk UT, Dallner G. Discharge of newly-synthesized dolichol andubiquinone with lipoproteins to rat liver perfusate and to the bile. Lipids 1989;24:919–930.
Ernster L, Dallner G. Biochemical, physiological and medical aspects of ubiquinone function. BiochimBiophys Acta. 1995;1271:195–204.
Evans M, Baisley J, Barss S, Guthrie N. A randomized, double-blind trial on the bioavailability oftwo Q10 formulations. J Funct. Foods 2009;1:65–73.
Ferrante KL, Shefner J, Zhang H, Betensky R, O’Brien M, Yu H, Fantasia M, Taft J, Beal MF, TraynorB, Newhall K, Donofrio P, Caress J, Ashburn C, Freiberg B, O’Neill C, Paladenech C, Walker T,Pestronk A, Abrams B, Florence J, Renna R, Schierbecker J, Malkus B, Cudkowicz M. Toleranceof high-dose (3,000 mg/day) coenzyme Q10 in ALS. Neurology 2005;65:1834–1836.
Ghirlanda G, Oradei A, Manto A, Lippa S, Uccioli L, Caputo S, Greco A, Littarru G. Evidenceof plasma CoQ10-lowering effect by HMG-CoA reductase inhibitors: a double-blind, placebo-controlled study. J Clin Pharmacol. 1993;33(3):226–229.
Greenberg S, Frishman WH. Co-enzyme Q10: a new drug for cardiovascular disease. J Clin Pharmacol.1990;30:596–608.
Grossi G, Bargossi AM, Fiorella PL, Piazzi S, Battino M, Bianchi GP. Improved high-performanceliquid chromatographic method for the determination of coenzyme Q10 in plasma. J Chromatogr.1992;593:217–226.
Kaikkonen J, Tuomainen TP, Nyyssonen K, Salonen JT. Coenzyme Q10: absorption, antioxidativeproperties, determinants, and plasma levels. Free Radic Res. 2002;36:389–397.
Kishi T, Watanabe T, Folkers K. Bioenergetics in clinical medicine XV. Inhibition of coenzymeQ10-enzymes by clinically used adrenergic blockers of beta-receptors. Res Commun Chem PatholPharmacol. 1977;17(1):157–164.
Miles MV. The uptake and distribution of coenzyme Q10. Mitochondrion 2007;7(Suppl. 1): S72–S77.Miles MV, Horn P, Miles L, Tang P, Steele P, DeGrauw T. Bioequivalence of coenzyme Q10 from
OTC supplements. Nutr Res. 2002;22:919–929.Miles MV, Patterson BJ, Schapiro MB, Hickey FJ, Chalifonte-Evans M, Horn PS, Hotze SL. Coen-
zyme Q10 absorption and tolerance in children with Downs’ syndrome: a dose-ranging trial. PedNeurol. 2006;35:30–37.
Mitchell P. The vital protomotive role of coenzyme Q. In: K Folkers, Y Yamamura, GP Littarru (Eds.).Biomedical and clinical aspects of coenzyme Q (Vol 6), (pp. 3–10). Amsterdam, the Netherlands:Elsevier, 1991.
Mortensen SA, Leth A, Agner E, Rohde M. Dose-related decrease of coenzyme Q10 during treatmentwith HMG-CoA reductase inhibitors. Mol Aspects Med. 1997;18(Suppl.):137–144.
J D
ieta
ry S
uppl
Dow
nloa
ded
from
info
rmah
ealth
care
.com
by
Uni
vers
ity L
ibra
ry U
trec
ht o
n 09
/14/
13Fo
r pe
rson
al u
se o
nly.

324 JOURNAL OF DIETARY SUPPLEMENTS
Mosca F, Fattorini D, Bompadre S, Littarru GP. Assay of coenzyme Q10 in plasma by a single dilutionstep. Anal Biochem. 2002;305:49–54.
Nishimukai M, Hara H. Enteral administration of soybean phosphatidylcholine enhances thelymphatic absorption of lycopene, but reduces that of alpha-tocopherol in rats. J Nutr.2004;134(8):1862–1866.
Ostlund RE, Jr., Spilburg CA, Stenson WF. Sitostanol administered in lecithin micelles potentlyreduces cholesterol absorption in humans. Am J Clin Nutr. 1999;70(5):826–831.
Permanetter B, Rossy W, Klein G, Weingartner F, Seidl KF, Blomer H. Ubiquinone (coenzyme Q10)in the long term treatment of idiopathic dilated cardiomyopathy. Eur Heart J. 1992;13:1528–1533.
Reahal S, Wrigglesworth J. Tissue concentrations of coenzyme Q10 in the rat following its oral andintraperitoneal administration. Drug Metab Dispos. 1992;20:423–427.
Scalori V, Alessandri MG, Giovannini L, Bertelli A. Plasma and tissue concentrations of coen-zyme Q10 in the rat after intravenous, oral and topical administrations. Int J Tissue React.1990;12:149–154.
Strijks E, Kremer HP, Horstink MW. Q10 therapy in patients with idiopathic Parkinson’s disease. MolAspects Med. 1997;18(Suppl.):S237–S240.
Tomono Y, Hasegawa J, Seki T, Motegi K, Morishita N. Pharmacokinetic study of deuterium-labelledcoenzyme Q10 in man. Int J Clin Pharmacol Ther Toxicol. 1986;24:536–541.
Wajda R., Zirkel J, Schaffer T. Increase of bioavailability of coenzyme Q10 and vitamin E. J MedFood 2007;10:731–734.
Weis M, Mortensen SA, Rassing MR, Moller-Sonnergaard J, Poulsen G, Rasmussen SN. Bioavail-ability of four oral coenzyme Q10 formulations in healthy volunteers. Mol Aspects Med. 1994;(15Suppl.):s273–s280.
Wiela-Hojenska A, Orzechowska-Juzwenko K. Bioavailability and its significance in pharmacother-apy. Pol Merkur Lekarski. 2003;14(79):89–93.
Willis R, Anthony M, Sun L, Honse Y, Qiao G. Clinical implications of the correlation betweencoenzyme Q10 and vitamin B6 status. Biofactors 1999;9(2–4):359–363.
J D
ieta
ry S
uppl
Dow
nloa
ded
from
info
rmah
ealth
care
.com
by
Uni
vers
ity L
ibra
ry U
trec
ht o
n 09
/14/
13Fo
r pe
rson
al u
se o
nly.