a r nnual eport 2016 -...
TRANSCRIPT
DARE TO DREAM, PLAN TO SUCCEED
ANNUAL REPORT 2016
Page 2
DARE TO DREAM, PLAN TO SUCCEED
Darling Range Sports College students are encouraged to follow their dreams, plan to succeed and persevere to attain their goals. Staff are committed to ensuring that teaching, learning and daily practices maintain high standards to support students in this endeavour. We are all part of the Darling Range Sports College team, demonstrating respect, acknowledging the achievements of others and being accountable for our actions in ensuring the Darling Range Sports team achieves the highest outcomes possible.
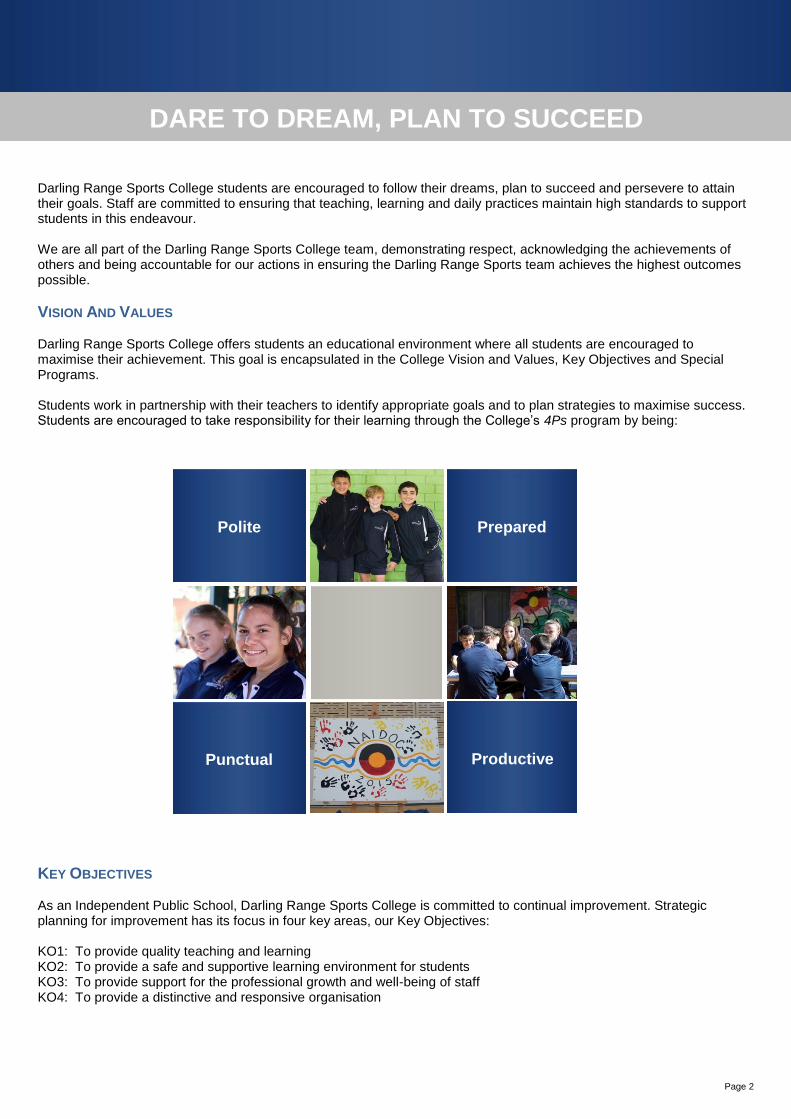
VISION AND VALUES Darling Range Sports College offers students an educational environment where all students are encouraged to maximise their achievement. This goal is encapsulated in the College Vision and Values, Key Objectives and Special Programs. Students work in partnership with their teachers to identify appropriate goals and to plan strategies to maximise success. Students are encouraged to take responsibility for their learning through the College’s 4Ps program by being:
KEY OBJECTIVES As an Independent Public School, Darling Range Sports College is committed to continual improvement. Strategic planning for improvement has its focus in four key areas, our Key Objectives: KO1: To provide quality teaching and learning KO2: To provide a safe and supportive learning environment for students KO3: To provide support for the professional growth and well-being of staff KO4: To provide a distinctive and responsive organisation
Punctual
Prepared Polite
Productive
Page 3
HIGHLIGHTS AND ACHIEVEMENTS QUALITY TEACHING AND LEARNING TO IMPROVE STUDENT PERFORMANCE IN ALL YEAR GROUPS Strategies include:
Continued and improved used of evidence-based planning
Senior school tutorial classes
Mentoring of students
Improve standard of literacy and numeracy through tutorials and specialised literacy and numeracy classes
Upgrade teacher qualifications to Certificate IV Training and Assessment and relevant Certificate courses
Increased variety of Certificate courses
Increased used of information technology in the classroom
Increased involvement in competitions
SAFE AND SUPPORT ENVIRONMENT DRSC is committed to providing a safe and supportive environment for all its students. Programs include:
leadership skills
Student Council
sports captains
peer mentors
student hosts
‘Bloke’ and ‘Chic’ character based programs
behaviour management strategies, including restorative practice
student Services team that focuses on attendance, behaviour and student well-being
SUPPORT FOR STAFF PROFESSIONAL GROWTH AND WELLBEING Staff professional growth and well-being is a priority of the College. To achieve this, DRSC:
provides a variety of activities for staff
relevant professional development for staff including:
Explicit teaching
Positive schools and classroom Engagement (PCSE)
Student performance data
Western Australian/Australian Curriculum
Peer review and classroom observation
Vocational Education and Training – Certificate IV
Coaching
DISTINCTIVE AND RESPONSIVE ORGANISATION
DRSC is building a culture of evidence-based decision making to inform planning
The College increasing and improving expertise in information technology through the introduction of ‘Bring Your Own Device’ (BYOD) beginning with Year 7 and Year 8 cohorts in 2015 and improving all student and staff knowledge and skills in information technology
Maintaining and expanding industry and community partnerships is a key aspect of the College’s forward planning
numerous buildings and grounds developments in 2015 including installation of a gazebo for students, road works to the Sports Stadium and upgrade of the school ovals
Page 4
HIGHLIGHTS AND ACHIEVEMENTS ACADEMIC CHALLENGE & ENRICHMENT STUDIES Improved ATAR results – most improved South-East Metropolitan Education region
Improved NAPLAN results
Study Skills Program Year 7-12
Weekend revision seminars (ATAR)
Academic Challenge Day for Years 7 – 10
Junior Academy Conference Year 9 and 10
THE ARTS Game of Frames Photographic Exhibition of student work
Charity fundraising through the sale of student artworks
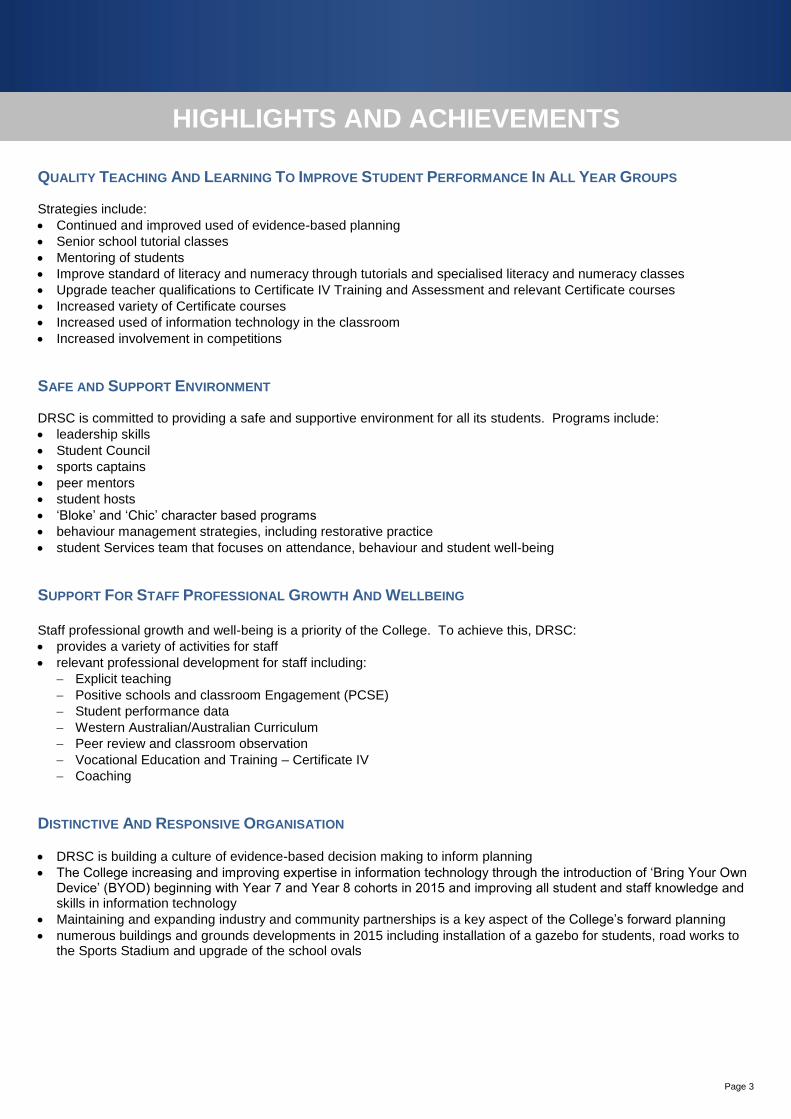
Charlie and the Chocolate Factory musical production - students from all year groups demonstrated their talents by performing to packed houses of community members at the Kalamunda Performing Arts Centre
Students showcased their considerable artistic talents through community competitions such as the Royal Show, YOHfest, OPSM: Through my eyes; with students being rewarded through recognition and prize money
ENGLISH Writer’s Festival
MATHEMATICS Year 10 Academic Challenge & Enrichment Studies students
UNSW Global Mathematics 6 credits/4 Merit
SCIENCE Primary school students and Primary Academic and Enrichment
Studies (PACES) students visited the College to use laboratories for experiments
Year 10 Academic and Enrichment Studies (ACES) Science students explored careers in the Resources Sector at Get Into Resources excursion at Central TAFE
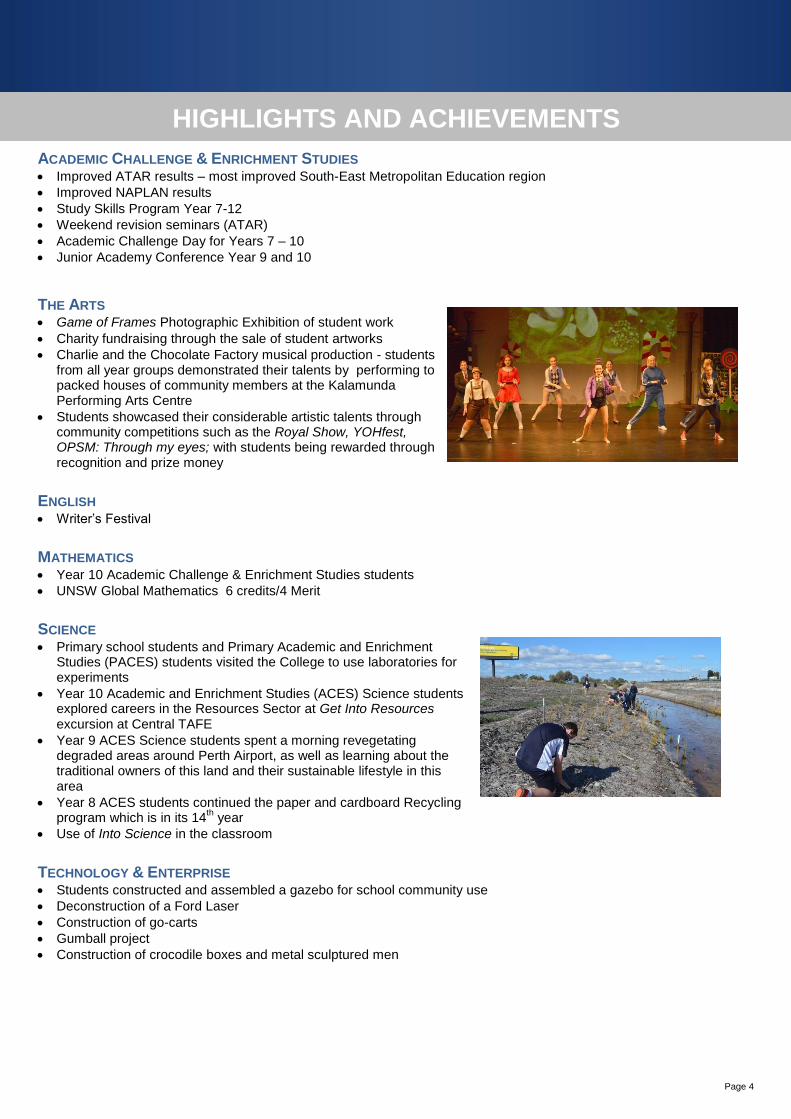
Year 9 ACES Science students spent a morning revegetating degraded areas around Perth Airport, as well as learning about the traditional owners of this land and their sustainable lifestyle in this area
Year 8 ACES students continued the paper and cardboard Recycling program which is in its 14
th year
Use of Into Science in the classroom
TECHNOLOGY & ENTERPRISE Students constructed and assembled a gazebo for school community use
Deconstruction of a Ford Laser
Construction of go-carts
Gumball project
Construction of crocodile boxes and metal sculptured men
Page 5
HIGHLIGHTS AND ACHIEVEMENTS VOCATIONAL EDUCATION AND TRAINING Vocational Education and Training saw an increase in classes from four to five classes for Year 11 and 12 students
Try a Trade – a three day bricklaying course for Years 11-12 with all 20 student participants gaining a Completion Certificate
71 students participated in an Authority-Developed Endorsed Program; Workplace Learning (ADWPL)
165 Certificate II or higher qualifications were successfully attained by Year 11 students
121 Certificate II or higher qualifications were successfully attained by Year 12 students
15 students gained Apprenticeships or Traineeships
The College auspiced with two Registered Training Organisations (RTOs), delivering Certificate II Business, Certificate II Sampling & Measurement, Certificate II and III in Visual Arts, Certificate II and III in Sport and Recreation and Certificate II in Financial Services
CITIZENSHIP Whole School Fun Run: fundraising event
School Volunteer Program
Senator Glenn Sterle ANZAC Leadership Tour to Britain, France & Belgium for 22 students, 2 teachers and 8 accompanying adults
GENERAL ANZAC Commemoration
NAIDOC Week
Indigenous Awards Night
Sports Star Awards Night
College Ball
College Year Book
Student Tours: intrastate, interstate & international
Page 6
HIGH PERFORMANCE SPORTS PROGRAMS Darling Range Sports College is the state’s first and only sports high school, offering quality individual sporting programs which have been developed in conjunction with relevant peak sporting bodies. The specialist programs provide the largest range of Specialist Sports programs in any W.A. school.
2016 HIGHLIGHTS INCLUDED: AFL
Upper School RediMed Cup Premiers (Cable Division – A division) played as a curtain raiser before Fremantle vs Carlton match
Upper School RediMed Cup Finalists (Jakovich Division – B division)
Zone Carnival Premiers Years 8, 9 and 10
SchoolSport WA Year 10 State Champions
Year 8/9 girls AFL Fremantle Dockers Cup Champions
Maribyrnong Sports Academy visit and games against DRSC AFL teams
West Coast Eagles visit by Sharrod Wellingham and Will Maginness
Super clinics with specialist coaches Bill Monaghan (West Perth League Coach), Murray Couper (former Bernie Naylor Medallist for leading goal kicker at Perth Football Club)
Swan League debut (WAFL) Brody Sutton
Athletics
Third place B grade Athletics interschool carnival (narrowly missing out on promotion)
Super clinic conducted by Lyn Foreman, Australian Level 5 Coach
Whole school inter-house athletics carnival
WA Schools Knockout champion teams for Junior and Senior boys
Champion Boy Jake Teague
Champion Junior Girl Kaitlyn Billing
Champion intermediate boy Josh Jones Baseball
State School Championships Lower School Champions
State School Championships Upper School Runner-up Champions
2 Australian U15 representatives - Matthew Martin, Dylan Walsh
1 Graduate in U18 Australian qualifiers - Alex Hall
Perth Heat ABL Player 2016/17- Alex Hall
Super Clinic American College special guest coaches
Ken McGee State League Head Coach
Cricket
Year 9 Rockingham Carnival
Third place in the Kim Hughes Shield Competition
Graeme Wood Shield Competition
Special guest coach Wayne Clarke
Page 7
HIGH PERFORMANCE SPORTS PROGRAMS Netball
High School Cup Open Division State Champions
High School Cup Lower Division State Champions
High School Cup Middle Division State Runners Up
Zone Champions In Years 7, 8, 9 and 10
U15 state team representative - Katie Te Ao
U17 state team representative - Amber Clemesha
U19 state team representative - Morgan Millar
Mrs Karly Guadagnin achieved State League coach qualification
Miss Samantha McShane achieved State League coach qualification
State League representatives - Amy Delcaro, Elodie McFarland, Tia McFarland, Paris Isaacs- Dunn
High Performance Clinic and Leadership Day (High Performance Squad)
Fever FIT State U17s Squad
Specialist Coaching sessions (High Performance Squad) by Lyn Pemberton, West Coast Fever defender Courtney Bruce and Caitlyn Bassett
Soccer
Australian School Girls team and State team representative - Breanne Alexander
U18s Perth Glory representative - Josh Samson
Year 9 Lightning Carnival Champions
Three ECU Joondalup fitness testing sessions
Guest speaker Ken Lowe, Perth Glory Head Coach
Guest speaker Jessine Bonzas, Women’s Perth Glory Assistant Coach Swimming
Schools Sports WA Division A Swimming Carnival
Fransiskus Raymond Year 10 Runner Up Champion Boy
Chelsea Excell 14 year old Silver Medal 200m backstroke State Championships
Page 8
STATE AND NATIONAL SPORTING REPRESENTATIVES AUSTRALIAN SPORTING REPRESENTATIVES Emily Maguire AFL Tayla McAuliffe AFL Alex Hall Baseball Matthew Martin Baseball Maddux Stivey Baseball Dylan Walsh Baseball Amber Clemesha Netball Morgan Millar Netball Katie Te Ao Netball Breanne Alexander Soccer
WESTERN AUSTRALIAN SPORTING REPRESENTATIVES Emily Maguire AFL Tayla McAuliffe AFL Kaitlyn Billing Athletics Josh Jones Athletics Jake Teague Athletics Daniel Carter Baseball Bailey-Jay Cooke Baseball Alex Hall Baseball Matthew Martin Baseball Mason Talbot Baseball Dylan Walsh Baseball Chloe Redmond Dance and Cheerleader Alexandria Dercksen Futsal Owen Roberts–Mok Judo Bronson Pickett Motorbike State Champion 12-16 years Amber Clemesha Netball Morgan Millar Netball Katie Te Ao Netball Anaya Umu Rugby Devontai Tauiti Rugby League Breanne Alexander Soccer Dillon Blackwood Soccer Ellie La Monte Soccer Josh Samson Soccer Shae Muggridge Softball Paige Smith Softball Damien Ledington Touch Football Referee Nicole Ledington Touch Football Ula-Mari Time-Cribb Touch Football
Page 9
ENROLMENTS ENROLMENT TRENDS
APPARENT RETENTION AND PROGRESSION RATES
Years 8 – 10 Years 8 – 12 Years 10 – 12 Years 10 – 11 Years 11 - 12
2014 93% 72% 64% 84% 81%
2015 92% 58% 61% 79% 74%
2016 94% 58% 62% 89% 79%
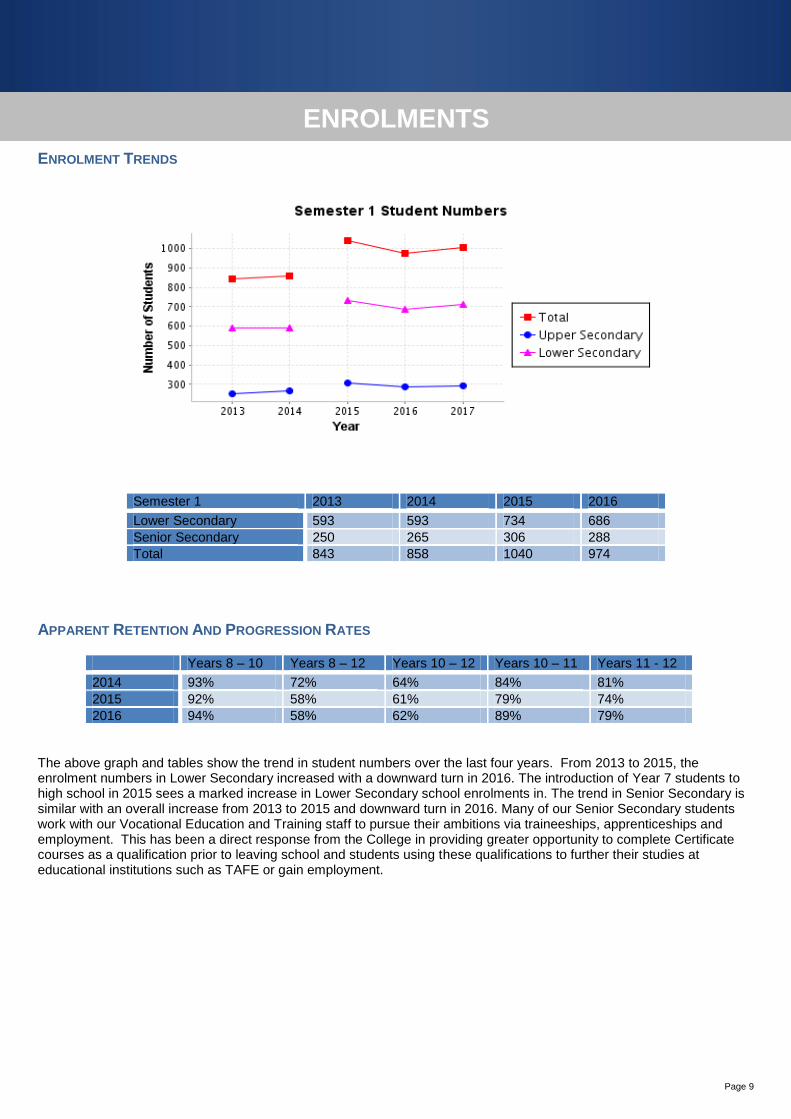
The above graph and tables show the trend in student numbers over the last four years. From 2013 to 2015, the enrolment numbers in Lower Secondary increased with a downward turn in 2016. The introduction of Year 7 students to high school in 2015 sees a marked increase in Lower Secondary school enrolments in. The trend in Senior Secondary is similar with an overall increase from 2013 to 2015 and downward turn in 2016. Many of our Senior Secondary students work with our Vocational Education and Training staff to pursue their ambitions via traineeships, apprenticeships and employment. This has been a direct response from the College in providing greater opportunity to complete Certificate courses as a qualification prior to leaving school and students using these qualifications to further their studies at educational institutions such as TAFE or gain employment.
Semester 1 2013 2014 2015 2016
Lower Secondary 593 593 734 686
Senior Secondary 250 265 306 288
Total 843 858 1040 974
Page 10
ATTENDANCE
PERCENTAGE ATTENDANCE BY YEAR LEVEL
STUDENT PARTICIPATION – OVERALL ATTENDANCE PERCENTAGE RATES
Non- Aboriginal Aboriginal Total
School Like Schools
State School Like Schools
State School Like Schools
State
2014 86.3% 86.7% 88.6% 78.9% 72.5% 66.3% 85.7% 86.0% 86.9%
2015 87.6% 87.4% 89.7% 78.0% 74.5% 68.0% 86.9% 86.5% 87.9%
2016 85.5% 87.5% 89.5% 71.8% 74.8% 67.4% 84.2% 86.9% 87.7%
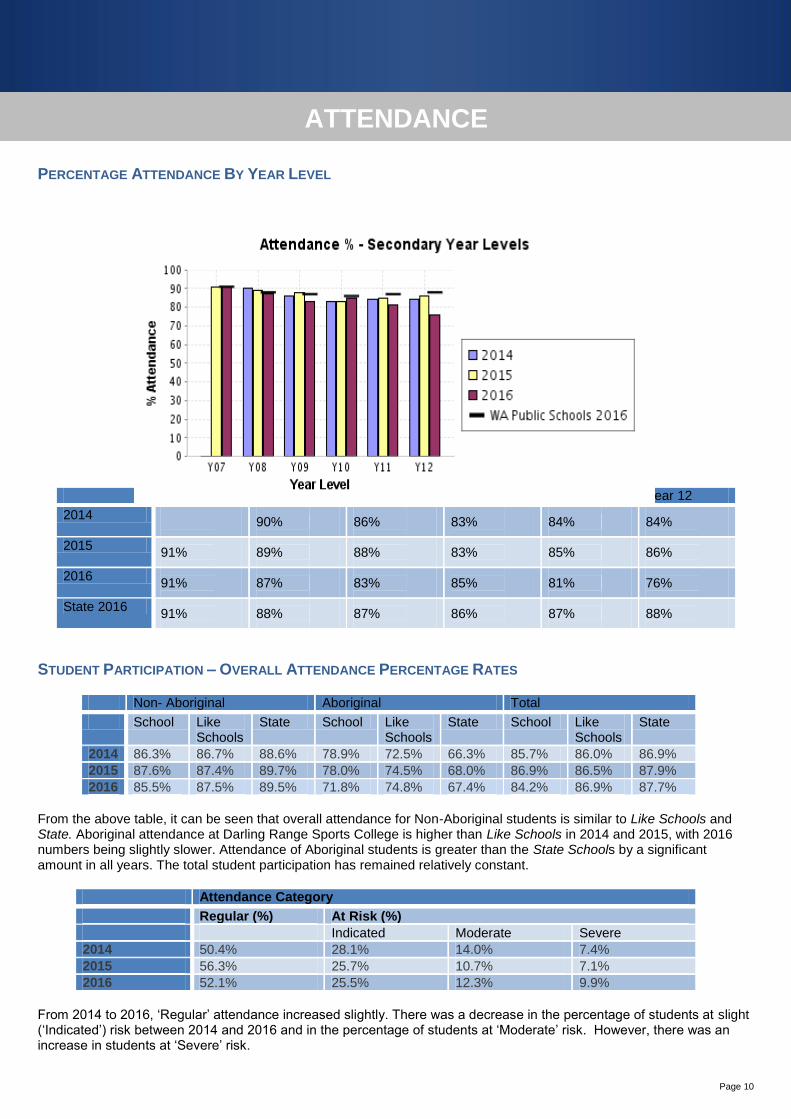
From the above table, it can be seen that overall attendance for Non-Aboriginal students is similar to Like Schools and State. Aboriginal attendance at Darling Range Sports College is higher than Like Schools in 2014 and 2015, with 2016 numbers being slightly slower. Attendance of Aboriginal students is greater than the State Schools by a significant amount in all years. The total student participation has remained relatively constant.
Attendance Category
Regular (%) At Risk (%)
Indicated Moderate Severe
2014 50.4% 28.1% 14.0% 7.4%
2015 56.3% 25.7% 10.7% 7.1%
2016 52.1% 25.5% 12.3% 9.9%
From 2014 to 2016, ‘Regular’ attendance increased slightly. There was a decrease in the percentage of students at slight (‘Indicated’) risk between 2014 and 2016 and in the percentage of students at ‘Moderate’ risk. However, there was an increase in students at ‘Severe’ risk.
Year 7 Year 8 Year 9 Year 10 Year 11 Year 12
2014
90%
86%
83%
84%
84%
2015 91%
89%
88%
83%
85%
86%
2016 91%
87%
83%
85%
81%
76%
State 2016 91%
88%
87%
86%
87%
88%
Page 11
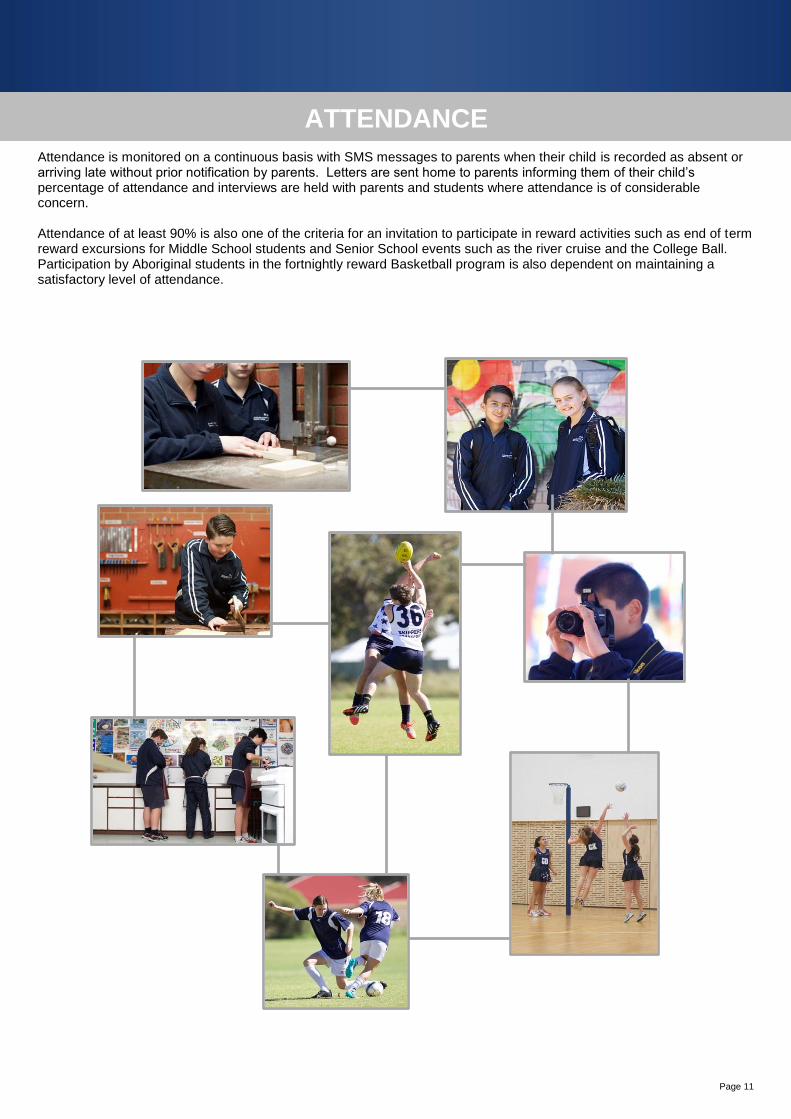
ATTENDANCE Attendance is monitored on a continuous basis with SMS messages to parents when their child is recorded as absent or arriving late without prior notification by parents. Letters are sent home to parents informing them of their child’s percentage of attendance and interviews are held with parents and students where attendance is of considerable concern. Attendance of at least 90% is also one of the criteria for an invitation to participate in reward activities such as end of term reward excursions for Middle School students and Senior School events such as the river cruise and the College Ball. Participation by Aboriginal students in the fortnightly reward Basketball program is also dependent on maintaining a satisfactory level of attendance.
Page 12
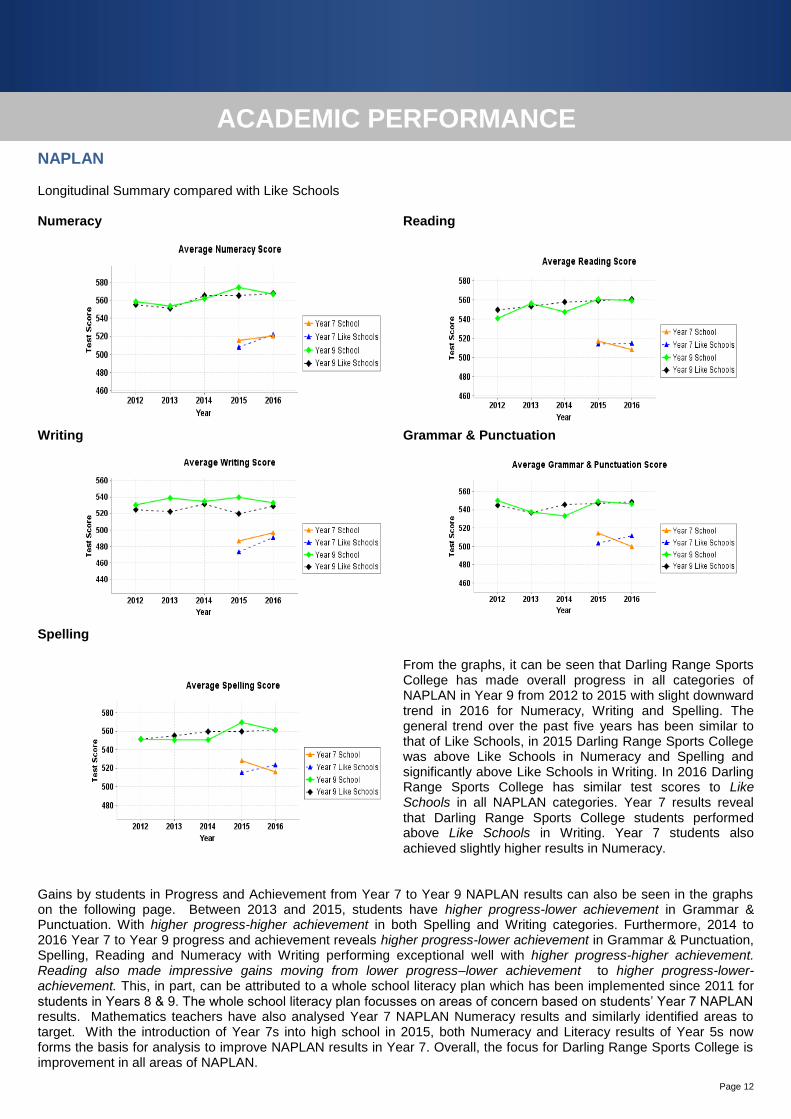
ACADEMIC PERFORMANCE NAPLAN Longitudinal Summary compared with Like Schools Numeracy
Reading
Writing
Grammar & Punctuation
Spelling
From the graphs, it can be seen that Darling Range Sports College has made overall progress in all categories of NAPLAN in Year 9 from 2012 to 2015 with slight downward trend in 2016 for Numeracy, Writing and Spelling. The general trend over the past five years has been similar to that of Like Schools, in 2015 Darling Range Sports College was above Like Schools in Numeracy and Spelling and significantly above Like Schools in Writing. In 2016 Darling Range Sports College has similar test scores to Like Schools in all NAPLAN categories. Year 7 results reveal that Darling Range Sports College students performed above Like Schools in Writing. Year 7 students also achieved slightly higher results in Numeracy.
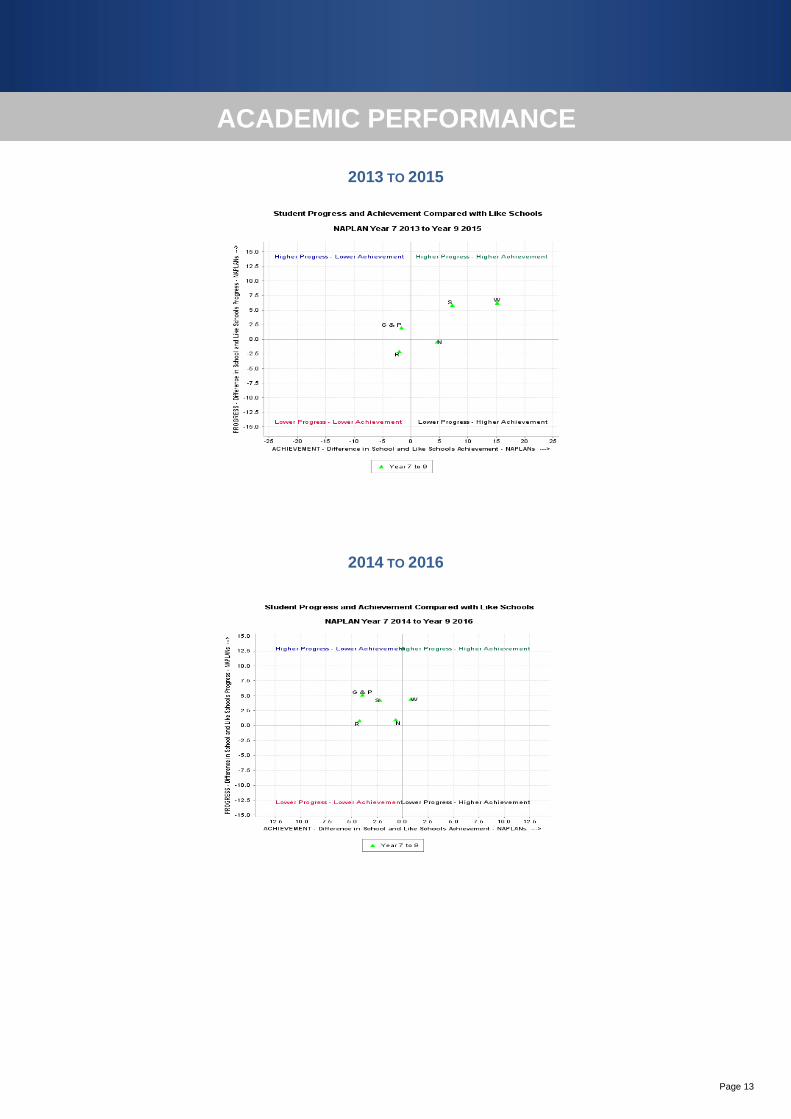
Gains by students in Progress and Achievement from Year 7 to Year 9 NAPLAN results can also be seen in the graphs on the following page. Between 2013 and 2015, students have higher progress-lower achievement in Grammar & Punctuation. With higher progress-higher achievement in both Spelling and Writing categories. Furthermore, 2014 to 2016 Year 7 to Year 9 progress and achievement reveals higher progress-lower achievement in Grammar & Punctuation, Spelling, Reading and Numeracy with Writing performing exceptional well with higher progress-higher achievement. Reading also made impressive gains moving from lower progress–lower achievement to higher progress-lower-achievement. This, in part, can be attributed to a whole school literacy plan which has been implemented since 2011 for students in Years 8 & 9. The whole school literacy plan focusses on areas of concern based on students’ Year 7 NAPLAN results. Mathematics teachers have also analysed Year 7 NAPLAN Numeracy results and similarly identified areas to target. With the introduction of Year 7s into high school in 2015, both Numeracy and Literacy results of Year 5s now forms the basis for analysis to improve NAPLAN results in Year 7. Overall, the focus for Darling Range Sports College is improvement in all areas of NAPLAN.
Page 13
ACADEMIC PERFORMANCE
2013 TO 2015
2014 TO 2016
Page 14
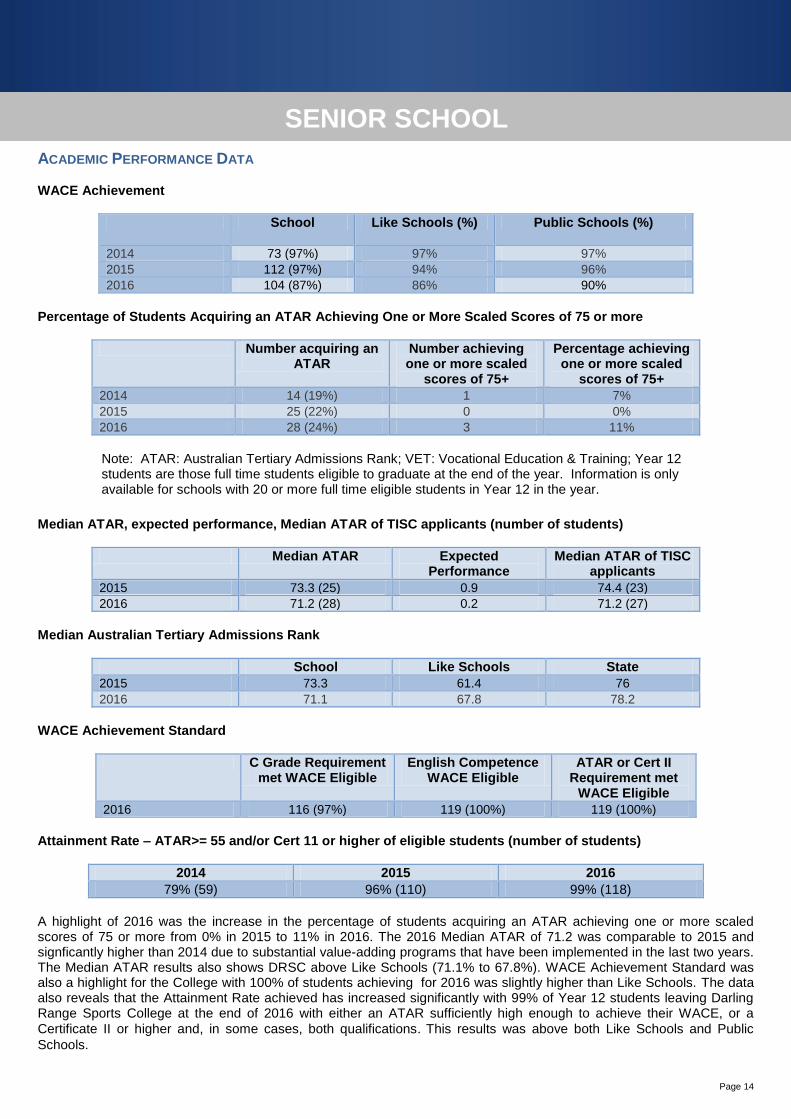
SENIOR SCHOOL ACADEMIC PERFORMANCE DATA WACE Achievement
School Like Schools (%) Public Schools (%)
2014 73 (97%) 97% 97%
2015 112 (97%) 94% 96%
2016 104 (87%) 86% 90%
Percentage of Students Acquiring an ATAR Achieving One or More Scaled Scores of 75 or more
Number acquiring an ATAR
Number achieving one or more scaled
scores of 75+
Percentage achieving one or more scaled
scores of 75+
2014 14 (19%) 1 7%
2015 25 (22%) 0 0%
2016 28 (24%) 3 11%
Note: ATAR: Australian Tertiary Admissions Rank; VET: Vocational Education & Training; Year 12 students are those full time students eligible to graduate at the end of the year. Information is only available for schools with 20 or more full time eligible students in Year 12 in the year.
Median ATAR, expected performance, Median ATAR of TISC applicants (number of students)
Median ATAR Expected Performance
Median ATAR of TISC applicants
2015 73.3 (25) 0.9 74.4 (23)
2016 71.2 (28) 0.2 71.2 (27)
Median Australian Tertiary Admissions Rank
School Like Schools State
2015 73.3 61.4 76
2016 71.1 67.8 78.2
WACE Achievement Standard
C Grade Requirement met WACE Eligible
English Competence WACE Eligible
ATAR or Cert II Requirement met
WACE Eligible
2016 116 (97%) 119 (100%) 119 (100%)
Attainment Rate – ATAR>= 55 and/or Cert 11 or higher of eligible students (number of students)
2014 2015 2016
79% (59) 96% (110) 99% (118)
A highlight of 2016 was the increase in the percentage of students acquiring an ATAR achieving one or more scaled scores of 75 or more from 0% in 2015 to 11% in 2016. The 2016 Median ATAR of 71.2 was comparable to 2015 and signficantly higher than 2014 due to substantial value-adding programs that have been implemented in the last two years. The Median ATAR results also shows DRSC above Like Schools (71.1% to 67.8%). WACE Achievement Standard was also a highlight for the College with 100% of students achieving for 2016 was slightly higher than Like Schools. The data also reveals that the Attainment Rate achieved has increased significantly with 99% of Year 12 students leaving Darling Range Sports College at the end of 2016 with either an ATAR sufficiently high enough to achieve their WACE, or a
Certificate II or higher and, in some cases, both qualifications. This results was above both Like Schools and Public
Schools.
Page 15
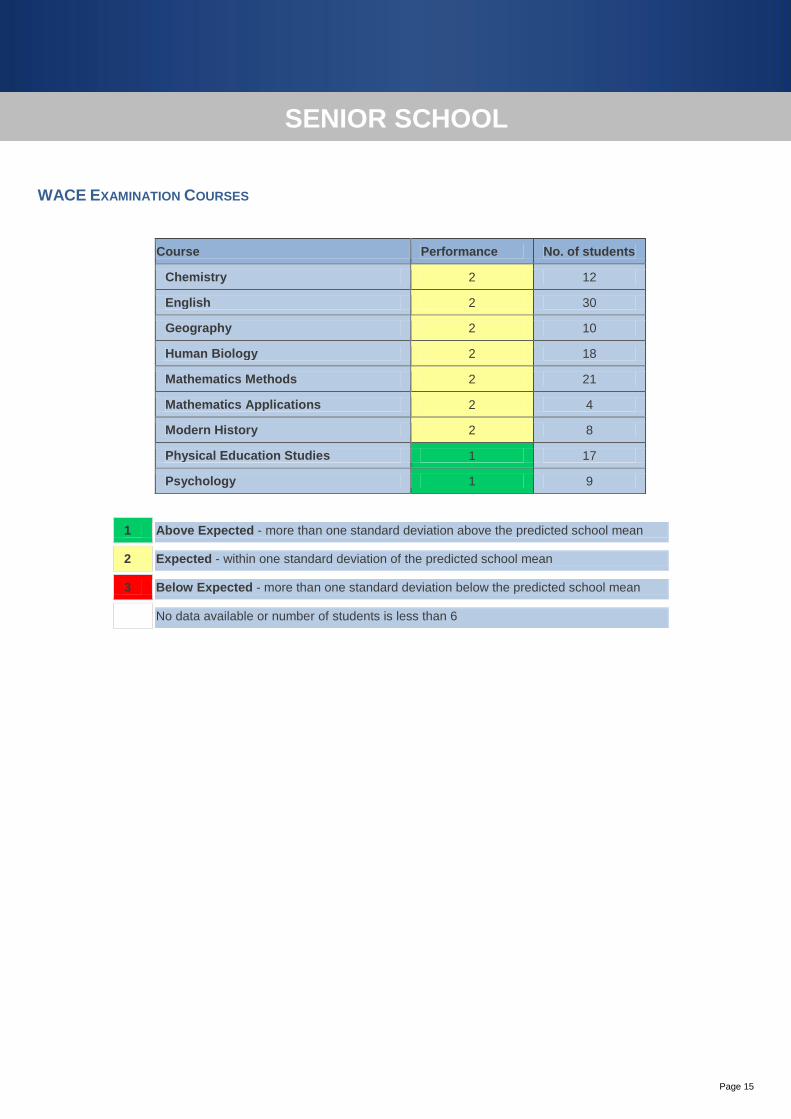
SENIOR SCHOOL WACE EXAMINATION COURSES
Course Performance No. of students
Chemistry 2 12
English 2 30
Geography 2 10
Human Biology 2 18
Mathematics Methods 2 21
Mathematics Applications 2 4
Modern History 2 8
Physical Education Studies 1 17
Psychology 1 9
1 Above Expected - more than one standard deviation above the predicted school mean
2 Expected - within one standard deviation of the predicted school mean
3 Below Expected - more than one standard deviation below the predicted school mean
No data available or number of students is less than 6
Page 16
SENIOR SCHOOL
Page 17
STAFF
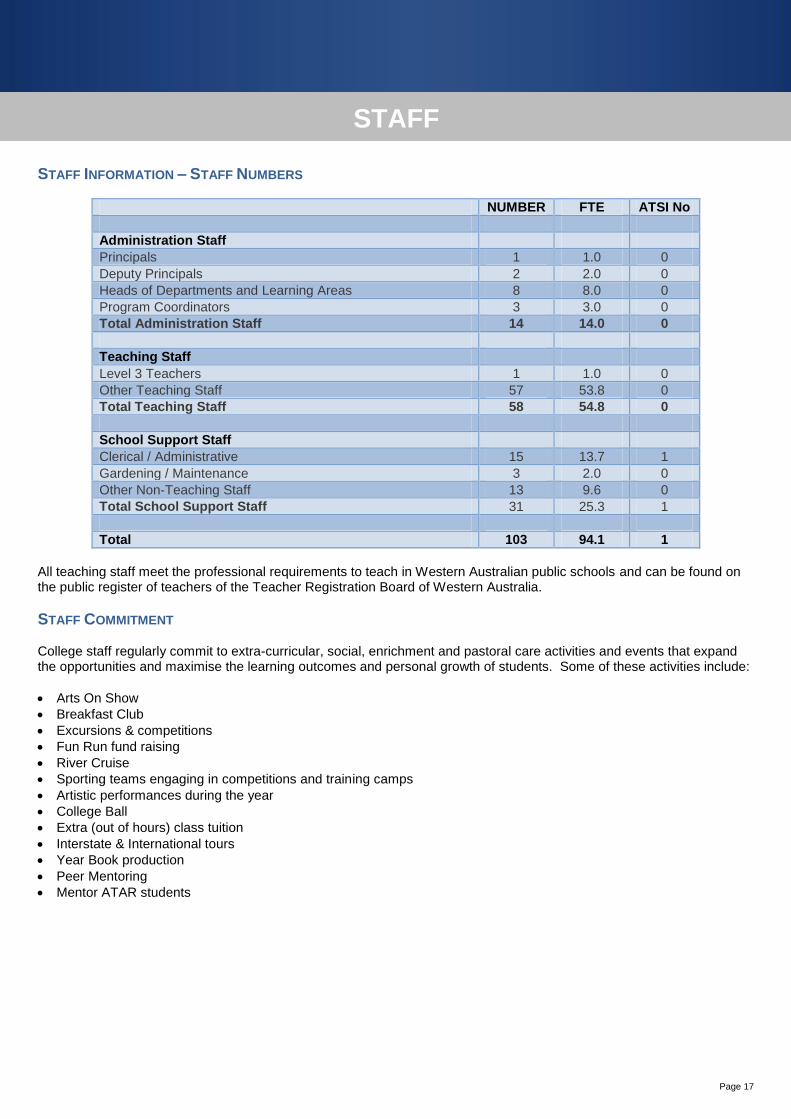
STAFF INFORMATION – STAFF NUMBERS
NUMBER FTE ATSI No
Administration Staff
Principals 1 1.0 0
Deputy Principals 2 2.0 0
Heads of Departments and Learning Areas 8 8.0 0
Program Coordinators 3 3.0 0
Total Administration Staff 14 14.0 0
Teaching Staff
Level 3 Teachers 1 1.0 0
Other Teaching Staff 57 53.8 0
Total Teaching Staff 58 54.8 0
School Support Staff
Clerical / Administrative 15 13.7 1
Gardening / Maintenance 3 2.0 0
Other Non-Teaching Staff 13 9.6 0
Total School Support Staff 31 25.3 1
Total 103 94.1 1
All teaching staff meet the professional requirements to teach in Western Australian public schools and can be found on the public register of teachers of the Teacher Registration Board of Western Australia.
STAFF COMMITMENT College staff regularly commit to extra-curricular, social, enrichment and pastoral care activities and events that expand the opportunities and maximise the learning outcomes and personal growth of students. Some of these activities include:
Arts On Show
Breakfast Club
Excursions & competitions
Fun Run fund raising
River Cruise
Sporting teams engaging in competitions and training camps
Artistic performances during the year
College Ball
Extra (out of hours) class tuition
Interstate & International tours
Year Book production
Peer Mentoring
Mentor ATAR students
Page 18
NATIONAL SCHOOL OPINION SURVEY
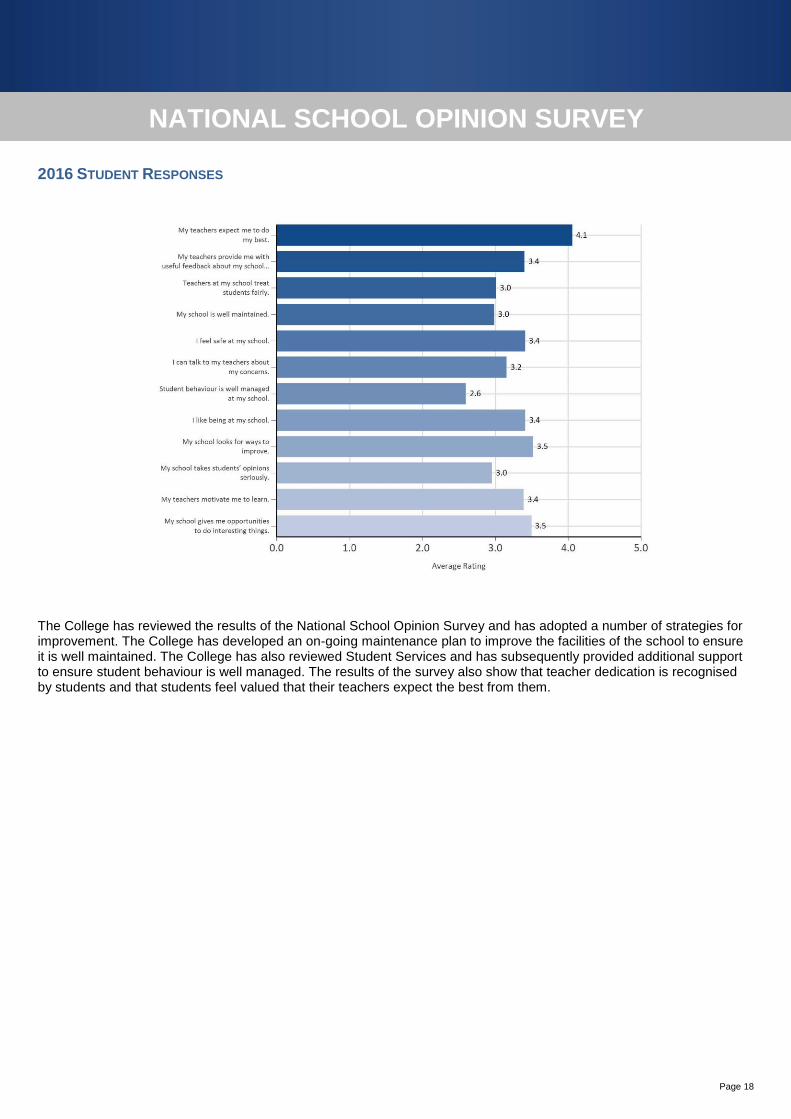
2016 STUDENT RESPONSES
The College has reviewed the results of the National School Opinion Survey and has adopted a number of strategies for improvement. The College has developed an on-going maintenance plan to improve the facilities of the school to ensure it is well maintained. The College has also reviewed Student Services and has subsequently provided additional support to ensure student behaviour is well managed. The results of the survey also show that teacher dedication is recognised by students and that students feel valued that their teachers expect the best from them.
Page 19
VALUE ADDING Staff at Darling Range Sports College regularly offer school-based programs which add to the academic, social, health and behavioural aspects of school life for our students. Some of these programs include:
THE ACADEMIC CHALLENGE & ENRICHMENT STUDIES PROGRAM (ACES) The ACES program provides the opportunity for high achieving students to maximise their educational potential through an emphasis on problem solving, analytical ability and creativity. ACES students participate in a variety of national, subject-based competitions as well as the College-run Academic Challenge Day (Years 7-10). The students participate in joint programs with university faculties and are offered the opportunity to research future university study opportunities through a program of university excursions.
THE PRIMARY ACADEMIC CHALLENGE & ENRICHMENT STUDIES PROGRAM (PACES) The program is also offered to Year 5 & 6 students in our partner primary schools (PACES) where identified students attend the College for two hours each week to be extended, particularly in their Science/Mathematics learning, with a teacher from the College. In 2016, Year 6 students discovered the fascinating world of Archaeology and Anthropology while Year 5 students investigated Healthy Eating and Nutrition. Both groups of PACES students presented the results of their learning to parents at a function at the end of the semester. .
DARLING RANGE LEARNING COMMUNITY (DRLC) In addition to the PACES program, staff involvement in the DRLC has led to improved learning opportunities for students through several initiatives, including:
A focus on Explicit Teaching by all schools in the community to provide a consistent and seamless progression in learning from K-12 over time.
The ongoing work of the Teaching and Learning team that promotes explicit instruction and supports teaches through ongoing professional development
Other learning area networks such as the DRLC Physical Education network that is led by Teacher Development School leaders at DRSC.
A seamless transition to high school led by DRSC staff; including a transition day, orientation day and multiple parent evenings to ensure students and parents are fully supported in the movement from primary to secondary school.
MIDDLE SCHOOL TRANSITION PROGRAM The College works closely with partner primary schools to improve ease of entry by students into Year 7 through activities during Year 5 and Year 6 such as the PACES program, the DRSC Writers’ Festival and College students umpiring and coaching primary school teams in their interschool carnivals. In 2016, Year 9 and 10 students were trained as peer support leaders. These students led the primary school students on their Orientation Day in Term 4 and will continue as leaders with the Year 7 and 8 students throughout 2017, on Year 7 transition days, sports carnivals, form and assemblies. A strong pastoral care support program also assists students to cope with a range of school, emotional, social and behavioural problems during transition to high school, as well as throughout students’ time at DRSC.
SPECIALIST SPORTS PROGRAMS Many students travel considerable distance to attend the Specialist Sports programs offered by the College. In 2016 students enrolled into Year 7 from over 40 different primary schools. The sports programs provide improved self-esteem and engagement in students, as well as opportunities for leadership roles and healthier lifestyles. They also enable students to combine their sporting talents with their academic program.
Page 20
VALUE ADDING THE ARTS PROGRAMS A range of performance and exhibition opportunities in the Arts have enhanced the cultural and social life of students with many students from across the College participating in our new initiative ‘Arts Week’. The 2016 Arts Week extravaganza highlighted one Arts discipline each day allowing students and staff the opportunity to take part in workshops, watch performances & view Visual Art and Photographic works. Many students also participated in the annual ‘Arts on Show’ performances which took place in the Performing Arts Centre using lighting purchased with funding from Bendigo Bank. The College also held Art and Photographic Exhibitions, organised by the students as part of their course work, showcasing the work of Senior School students. New courses designed to engage students in The Arts using new technologies were also implemented and will continue in 2016.
VOCATIONAL & EDUCATIONAL TRAINING (VET) Vocational & Educational Training (VET) engages students in work-related learning built on strategic partnerships between schools, training organisations, business, industry and the wider community. The successful completion of VET provides students with a national recognised VET qualification and forms an integral part of the WACE. Gaining at least one full qualification in a Certificate II is one of the minimum requirements for achievement for students not completing at least four ATAR courses. Of the 115 Year 12 students in 2015, 149 achieved Certificate II or higher. Of the 158 Year 11 students, 165 qualifications were undertaken and either completed or are in the process of completion for 2016. 15 students were fortunate enough to gain an apprenticeship or traineeship in their chosen field. Additionally, 20 students participated in a three day bricklaying Try-A-Trade course at the College, giving these students technical skills leading to a pathway within Certificate II in Building and Construction.
COMMUNITY PARTNERSHIPS Groups and individuals committed to support Darling Range Sports College and its students include: Baseball WA Curtin University Engineering Faculty Mead St Physiotherapy Darling Range Learning Community; Dawson Park, Edney, Wycombe, Wattle Grove, Woodlupine Primary Schools Darling Range Netball Association
Netball WA Rugby WA Senator Glenn Sterle
Football West Slater Gartrell Sports Forrestfield Community Bank (Bendigo Bank) Softball WA Hills Callisthenics Association Springburn Foundation Hillside Church Swift Print Kalamunda & Districts Basketball Club WACA Kalamunda & Districts Swimming Club WA Football Commission
Page 21
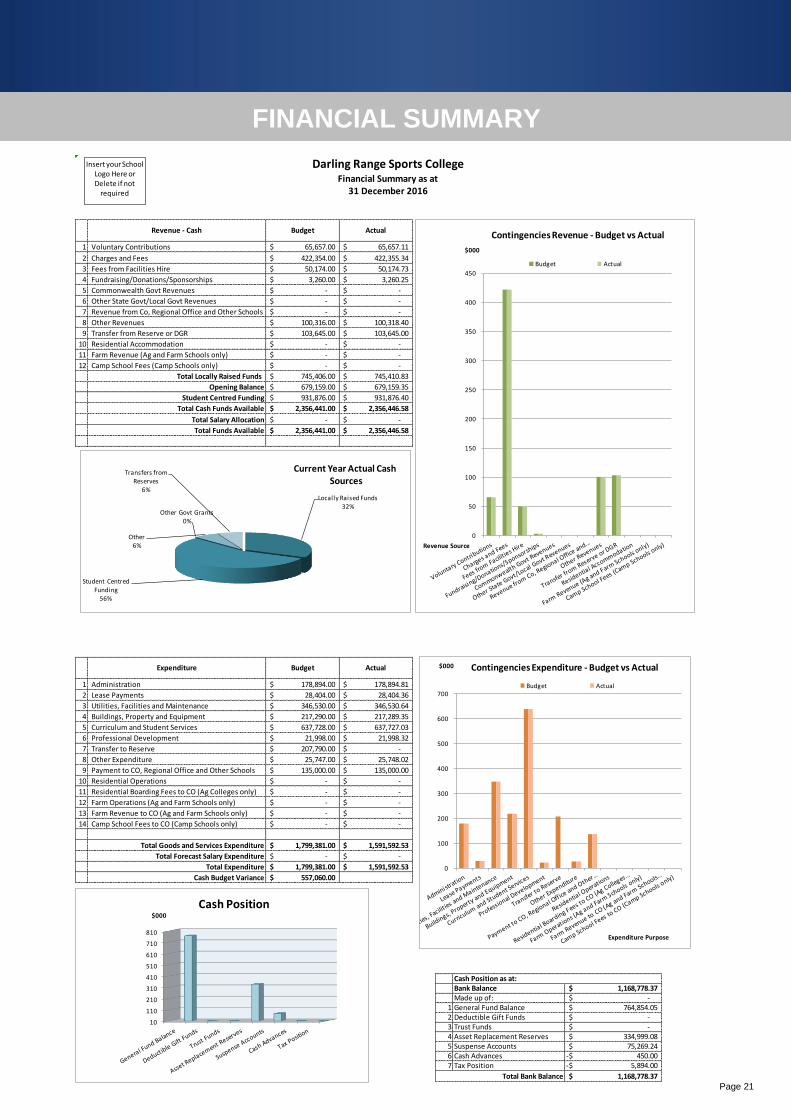
FINANCIAL SUMMARY
1 65,657.00$ 65,657.11$
2 422,354.00$ 422,355.34$
3 50,174.00$ 50,174.73$
4 3,260.00$ 3,260.25$
5 -$ -$
6 -$ -$
7 -$ -$
8 100,316.00$ 100,318.40$
9 103,645.00$ 103,645.00$
10 -$ -$
11 Farm Revenue (Ag and Farm Schools only) -$ -$
12 -$ -$
745,406.00$ 745,410.83$
679,159.00$ 679,159.35$
Student Centred Funding 931,876.00$ 931,876.40$
2,356,441.00$ 2,356,446.58$
-$ -$
2,356,441.00$ 2,356,446.58$
Locally Raised Funds541,447.43$
Student Centred Funding931,876.40$
Other Govt Grants -$
Other 100,318.40$
Transfers from Reserves103,645.00$
1,677,287.23$
1 178,894.00$ 178,894.81$
2 28,404.00$ 28,404.36$
3 346,530.00$ 346,530.64$
4 217,290.00$ 217,289.35$
5 637,728.00$ 637,727.03$
6 21,998.00$ 21,998.32$
7 207,790.00$ -$
8 25,747.00$ 25,748.02$
9 135,000.00$ 135,000.00$
10 -$ -$
11 -$ -$
12 Farm Operations (Ag and Farm Schools only) -$ -$
13 Farm Revenue to CO (Ag and Farm Schools only) -$ -$
14 Camp School Fees to CO (Camp Schools only) -$ -$
1,799,381.00$ 1,591,592.53$
-$ -$
1,799,381.00$ 1,591,592.53$
557,060.00$
Bank Balance 1,168,778.37$ Made up of: -$
1 General Fund Balance 764,854.05$ 2 Deductible Gift Funds -$ 3 Trust Funds -$ 4 Asset Replacement Reserves 334,999.08$ 5 Suspense Accounts 75,269.24$ 6 Cash Advances 450.00-$ 7 Tax Position 5,894.00-$
1,168,778.37$ Total Bank Balance
Cash Position as at:
Residential Boarding Fees to CO (Ag Colleges only)
Cash Budget Variance
Total Forecast Salary Expenditure
Total Expenditure
Total Goods and Services Expenditure
Other Expenditure
Buildings, Property and Equipment
Curriculum and Student Services
Total Salary Allocation
Total Funds Available
ActualBudget
Residential Operations
Total Locally Raised Funds
Fundraising/Donations/Sponsorships
Opening Balance
Total Cash Funds Available
Camp School Fees (Camp Schools only)
Expenditure
Payment to CO, Regional Office and Other Schools
Administration
Lease Payments
Utilities, Facilities and Maintenance
Professional Development
Transfer to Reserve
Transfer from Reserve or DGR
Residential Accommodation
Other State Govt/Local Govt Revenues
Revenue from Co, Regional Office and Other Schools
Darling Range Sports CollegeFinancial Summary as at
Actual
31 December 2016
Other Revenues
Commonwealth Govt Revenues
BudgetRevenue - Cash
Voluntary Contributions
Charges and Fees
Fees from Facilities Hire
0
50
100
150
200
250
300
350
400
450
$000
Revenue Source
Contingencies Revenue - Budget vs Actual
Budget Actual
Locally Raised Funds32%
Student Centred Funding
56%
Other Govt Grants0%
Other 6%
Transfers from Reserves
6%
Current Year Actual CashSources
0
100
200
300
400
500
600
700
$000
Expenditure Purpose
Contingencies Expenditure - Budget vs Actual
Budget Actual
10
110
210
310
410
510
610
710
810
$000
Cash Position
Insert your School Logo Here or Delete if not
required
117 Berkshire Road, Forrestfield WA 6058
Tel: 9453 01 00
Fax: 9453 1464
www.darlingrangesc.wa.edu.au