a quantum theory of the scattering of soft x-ray …...photon momentum receding grating standing...
TRANSCRIPT

Turk J Phys
35 (2011) , 75 – 114.
c© TUBITAK
doi:10.3906/fiz-1101-81
A Quantum theory of the scattering of soft x-ray from
Compton effect caused electron standing wave in the
materials
Biswajit MALLICKInstitute of Physics, Bhubaneswar 751005, INDIA
e-mail: bmallick [email protected]
Received: 02.01.2011
Abstract
In the present investigation, low-energy x-rays (< 15 keV) scattered from powder, polymer, crystals
and hydrogenous liquids (with preference for materials of low binding energy) at different scattering angles
have been analysed. The scattered x-rays show unambiguous existence of a new modified line along with
unmodified and Compton line. Since, the experimental observation of the inverse Doppler effect, i.e. increase
of frequencies of reflecting waves from a receding boundary, has already been reported [Seddon and Bearpark
(2003) Science, 302, 1537–1540]. Hence, it is quite logical to think that x-rays may also gain energy in
contrast to Compton effect (where they lose energy) in material medium. Such type of new modified x-
ray scattering (angle dependent) was observed. Expressions for photon of enhanced energy, �ω3 , initial
momentum of plasmon q′ and the total scattering cross section σN of this new phenomenon have been
derived. The σN is found out to be proportional to√∈ and is about 100 times less than the Compton
cross section using high-energy x-ray photon (100’s of keV), usually used for Compton scattering studies.
Both theoretically calculated and experimentally observed data match well with one another. The new
modified line is to be clearly expected from materials of low atomic number with high dielectric constant
using low-energy x-rays.
Key Words: X-ray scattering, Compton effect, plasmon excitation, inverse Doppler effect
PACS: 78.70.Ck, 78.70.-g, 71.45.Gm, 81.05.Xj, 71.20.Rv
1. Introduction
Discovered in 1921, Compton scattering [1] is used to measure the electron momentum distribution of
atoms [2–8]. Subsequently, Smekal-Raman [9, 10] and plasmon scattering [11] were discovered. Moreover, Stokes
and anti-Stokes lines were observed using both light and x-rays [12]. A number of good works on incoherent
scattering of radiation by plasma have already been reported by various authors [13–20]. Existence of inverse
Compton [21, 22], virtual Compton [23], magnetic Compton [24], double Compton [25], and resonant Compton
75

MALLICK
[26] scattering were reported. Experimental verification of inverse Doppler effect [27] has been reported recently
in 2003. Electrons [28–32], protons [33–35], and neutrons [36–40] used as a probe instead of photons in Comptonscattering have also been reported. As nature loves symmetry, it is quite logical to think that x-rays may alsoexhibit inverse Doppler effect, where they gain energy in contrast to Compton effect (where they lose energy) inmaterial medium. Non-observance of this type of incoherent scattering peak in the earlier Compton scatteringexperiments may be due to the following reasons: (i) most of the earlier Compton scattering work was restricted
to relatively hard radiation and large scattering angle; (ii) the plasmon excitation in Compton scattering was
discovered nearly 50 years after the discovery of Compton scattering; (iii) the damping of the plasmon increases
with momentum transfer k (= (4π/λ) sin θ) [11], which is directly proportional to radiation energy and
scattering angle; (iv) intensity ratio of the new incoherent peak with unmodified peak was a few tens of times
less than the intensity ratio of Compton peak with unmodified peak; (v) sample gets heated due to longexposure to x-ray and the Compton peak decreases slightly when this temperature increases, hence the newpeak intensity decreases [41]; (vi) the new scattering was masked by Compton tail of the neighbouring incident
x-ray line, spurious peaks, and peak due to source fluctuation; (vii) most of the earlier workers were interested
in low-energy side (Compton region) of the unmodified peak; and (viii) the number of photons emitted per
second was much less in x-ray sources used in earlier experiments [42]. Thus, the observation of inverse Dopplereffect in x-ray was completely sidetracked.
A few years ago, the author observed the scattered x-rays of enhanced energy from solid polymer andsuggested that it is because of collision of incident photons with Compton recoil electrons (classical treatment)
[43–45]. However, it was not clear in those days; the reason may be lack of negative refractive index conceptsin the scattering. However, recent, experiments have shown the existence of such type of incoherent scatteringwhich matches well with the predicted quantum mechanical model.
Schrodinger in 1927 formulated a wave-mechanical model using simple de Broglie’s concepts of matterwaves for the Compton scattering [46], which leads precisely to the same result for the change in wavelength ofscattered x-rays as that derived on the theory of impact between photon and free electron by Compton. Thisquantum mechanical theory doubtlessly gives a more adequate picture of the wavelength change as follows.Consider a new coordinate system where impact of photon and electron are symmetrical both before and afterthe collision. If v is the velocity of the electron’s recoil (v << c) in the fixed co-ordinate, then the required
velocity of the moving coordinate is v/2. At the impact, the momentum of the electron then changes from
-mv/2 to +mv/2 as expressed in the moving system, while Y-component of the photon’s momentum changes
from +(h/λ) sin θ to −(h/λ) sin θ . Thus, the condition for the momentum conservation [46] gives
−(m0v/2) + (h/λ) sin θ = (m0v/2) − (h/λ) sin θ (1)
(2h/λ) sin θ = m0v. (2)
Thus the energy remains unchanged after impact. Applying Schrodinger and de Broglie hypothesis, the incidentelectron can be represented by a continuous train of ψ waves of wavelength λmatter = h/(m0v/2) moving along
negative y-direction and the recoil electron (atomic) by a similar train of the same wavelength moving alongpositive y-direction, the two trains together will form standing waves for which the electronic charge density isproportional to ψincψ
∗rec and for which the distance from the node to node is (λmatter/2) = h/(m0v). The de
Broglie waves representing the electron thus form a Bragg grating space d = h/(m0v). This grating will diffractthe incident x-ray waves according to the usual expression -2d sin θ = λ . The diffracted waves are modified in
76

MALLICK
wavelength by the deflection because the grating is in motion, thus resulting in a Doppler effect. Consideringthe fixed coordinate system as in Figure 1(a), the grating of stationary de Broglie waves is receding from O with
velocity v/2. Treating grating as a mirror, this is equivalent to receiving the light from a virtual image of thesource S that recedes from S with velocity v . According to the Doppler’s principle, the modified wavelengthemitted from S and reaching P can be written asλ′ = λ (1 + (v/c) sin θ). Substituting the value of v from
equation (2), the increase in wavelength can be simplified as
ΔλC = (2h/mc) sin2 θ = (h/m0c) (1 − cos 2θ) (3)
which is exactly the same expression as that obtained from photon theory given by Compton and is known asCompton shift, where 2θ is the scattering angle.
(a) (b)
vm
hd =
mv
hd =
Y
Y'
Incident wave
Scattered wave
Recoil electronIncident electron
Incident electron φ
2θ
Rec
oil
elec
tron
Incident electron (plasm
on)
S
S'' P
λh
Photon momentum
Receding grating standing wave
Scattered wave
θλ
sinh
+
Y
θλ
sinh
−
X
O
P''
' '
θ
Figure 1. Schematic diagram of. (a) collision of a photon and electron (or plasmon) in normalized coordinates,
(b) diffraction of incident waves from the standing wave pattern due to incident electron (d = h/(mv)) or plasmon
(d′ = h/(m′v′)) and recoil electrons. The incident wave diffracted from the normal dispersion media (vgroup and vphase
are parallel, positive refractive index) due to incident electron standing wave shows scattered wave of lower frequency.
Again, incident wave diffracted from the anomalous dispersive media (vgroup and vphase, are anti-parallel, negative
refractive index) due to incident plasmon standing wave possesses scattered wave of higher frequency.
2. Hypothesis
Substances with negative permittivity ε and permeability μ have some properties which differ fromthose of substances with positive ε and μ . In solid-state plasmas (ε < 0, μ > 0), the square of the refractive
index (RI), i.e.n2 becomes negative, which leads to reflection of waves from such a medium [47]. Again, due toplasmon excitation in the solid because of Compton effect, material behaves as a metamaterial. The plasmon
frequency can be defined as ω2p = e2ne/ (ε0 m∗), where ne is the electron density (electrons/cm3), e is
the electronic charge, ε0 is the permittivity of free space (dielectric constant) and m∗ is the effective mass of
electron. The total number of electrons Ne in the target can be defined as Ne = π (d2 )2 l ρ NA
A Z , where
d is the diameter of target, l is the length of the target (length of the target intercepted by the beam), ρ is
77

MALLICK
the density of the target material, NA is the Avogadro’s number (6.023×10²³), A is the atomic weight of the
target element and Z is the atomic number of the element [48].
Again, the critical electron density [49] is defined as nc = ε0m∗ω2/e2 . However, dielectric function [50]
or permittivity of the medium is usually expressed as ε (ω) = 1 − (ω2p/ω2), whence using the value of ω2 ,
critical plasmon density can be simplified in terms electron density as
nc = (ε0m∗ω2
p)/e2 (1 − ε) = ne/(1 − ε). (4)
Simplifying equation (4) for ε , and taking the square root of both sides of the expression, gives√
1 − (ne/nc) =√
ε . Again, ε = ε0 ∈ , where ε0 (=1/4π) is the permittivity of free space and ∈ is the dielectric constant ofthe material. So above-mentioned relationship can be simplified as
√1 − (ne/nc) =
√ε0 ∈ = ±R, (5)
where R is a constant. The RI of the plasmon [49] can be defined asn =√
1 − (ne/nc), since for x-rays
nc >> ne,n = 1 − (ne/2 nc), hence from equation (5) the RI can be written as
n = 1 − (ne/2 nc) = ±R. (6)
It is clear from the above that, if nc << , RI becomes negative. Also, n is directly proportional to R (=√
ε0 ∈ )
or√∈ . The numerical factor R increases with a higher value of ∈ . Again, for x-ray of wavelength λ , the
plasmon critical density [51] can be defined as nc = π/(r0λ2 ), where r0 is the classical electron radius and
the relation show that if the wavelength of x-ray increases (low energy), nc will decrease, hence RI of the
material moves towards negative. So, for the negative refractive index (NRI), i.e. n = - R, material behavesas a metamaterial. x-ray reflected from the standing wave pattern receding in the solid-state plasma media(virtual metamaterial), generated because of Compton effect, produces waves of increased frequency. For a
wave (x-ray) traveling in normal dispersive media (stationary frame of reference) incident on a receding grating,
the receding grating velocity or group velocity (vgroup) and the phase velocity (vphase) of the incident wave
(x-ray) are parallel therefore, the incident field in the frame of the receding grating oscillates with a relatively
low frequency as expected for conventional Doppler effect shown in Figure 1(b). In the anomalously dispersive
medium (solid-state plasmon), the vphase of the incident wave and vgroup are anti-parallel. In this case the
incident field in the frame of receding grating (in excited electron/plasma medium) oscillates with a relatively
high frequency as expected for the inverse Doppler effect. Again RI is given as n = c/vphase , which shows
that for NRI material (solid-state plasma) the phase velocity becomes negative and vgroup = c2/ (±vphase),
so the receding velocity. If v ′ is the velocity of standing wave (v′ << c) formed due to recoil (ejected)
electron (Compton effect) and plasmon in the fixed coordinate system, then the receding velocity in the moving
coordinate system isv′ /2. The de Broglie waves representing the plasmon thus form a Bragg grating space
d′ = h/(m′v′), where d′ < d . Similarly, the momentum of the electron then changes from − − m′v′ /2 to
+m′v′ /2 as expressed in the moving system. As per equations (1) and (2), one can have
(2h/λ) sin θ = m′v′. (7)
According to general theory of relativity and de Brogile hypothesis, energy of exited electrons can be expressed
78

MALLICK
as E = E0/√
1 − (v′/c)2 , so
v′
c=
√1 − (E0/E)2, (8)
where E0 (= m0c2) is the rest-mass energy of the electron, and E = m′c2 = E0 + ΔE , ΔE is the amount of
energy gained by the electron in collision process. The mass in terms of energy can be written as
m′ = m0(E/E0). (9)
Similarly, according to the Doppler’s principle, the new modified wavelength of the radiation can be definedasλ′′ = λ (1 − (v′/c) sin θ) . Further simplifying the above relation for solid-state plasmon system by substitut-
ing the value of v′ from equation (7) and m′ from equation (9), the change (decrease) in wavelength can bewritten as
ΔλN = [2h/ (m0(E/E0) c)] sin2 θ = (h/m0 c) (E0/E) (1 − cos 2θ) (10)
The energy enhancement in this new effect is of the same order as the amount of energy absorbed in Comptonprocess.
3. Theory
In a typical x-ray Compton scattering experiment, a beam of monochromatic radiation with energy ω1
and momentum k1 is incident on a target consisting of a set of scatterers. The radiation is scattered throughan angle 2θ with respect to the incident beam direction. The scattered radiation of energy ω2 and momentumk2(� = 1) is analysed. The various steps of interaction mechanism are discussed below.
3.1. Electron at rest
If the electron of the scatterer is supposed to be at rest and free, then from the energy momentumconservation laws we have
�ω1 = �ω2 +(�2k2/2m0
), (11)
wherek = k1 − k2. (12)
Here k is the scattering vector, and ki (i = 1, 2) are the wave vectors having magnitude |ki| = 2π/λi . Theenergy transferred to the system in this process is
Δ�ω = �ω1 − �ω2 =(�2k2/2m0
). (13)
In terms of the scattering angle2θ ,
k2 = (k1 − k2)2 = k2
1 + k22 − 2k1k2 cos 2θ. (14)
Typically, the energy of the x-ray photon is usually very high compared to its momentum. So, to a first
approximation |k1|2 ≈ |k2|2 , so
k2 = 2k21 − 2k2
1 cos 2θ = 2k21 (1 − cos 2θ) . (15)
79

MALLICK
Since, ω1 = k1c and ω2 = k2c , equation (13) may be written as
Δ�ω =(�2ω1ω2/m0c
2)
(1 − cos 2θ) (16)
This gives the final energy of the Compton scattered x-ray photon as
�ω2 =� ω1
[1 + γ (1 − cos 2θ)], (17)
where γ = � ω1m0c2 is the ratio of the incident photon energy with respect to rest mass energy of electron.
In other words, the change in wavelength of the x-ray photon is the same as defined in earlier expression(3).
3.2. Electron in motion
For an electron in motion, equation (11) is slightly modified to
�ω1 +(p21/2m0
)= �ω2 +
(p22/2m0
)(18)
and
�k1 + p1 = �k2 + p2; (19)
or,
p2 = p1 + �k, (20)
where p1 and p2 are the initial and final momentum of the electron, respectively.
Using equations (18) and (20), the amount of energy transferred to electrons may be written as
Δ�ω = �ω1 − �ω2 =(p22/2m0
)−
(p21/2m0
)=
((p1 + �k)2 /2m0
)−
(p21/2m0
);
so,
Δ�ω =(�2k2/2m0
)+ (�k · p1/m0) . (21)
Here, k is the scattering vector (Figure 2(a)); and for a fixed k , the energy resolution is linearly related to themomentum resolution. It is conventionally chosen as the z-axis of a Cartesian coordinate system. In additionto equation (16), equation (21) now contains an extra term which is linearly dependent on one component pz ofthe electrons ground state momentum and the Doppler shift associated with electron in motion. The Compton
profile (CP) is centered around k2/2m0 with a width k · p1/m0 .
80

MALLICK
(a) (b)
π - 2θ
k2
(ω2, k2)
k1
(E1, p1)
(E2, p2) k = k1-k2
(ω1, k1)
2θ
p2
2θʹ
k3
(ω3, k3)
k1
(E3, p3)
(E1, p1) kp= k3-k1
(ω1, k1)
-k1
p1
π - 2θʹ
Figure 2. Schematic diagram of. (a) Compton process showing momentum conservation, where p1 and p2 are the
initial and final momenta of the electron, k1 and k2 of the x-ray photon. E1, and E2, are the initial and final energy of
the electron, ω 1 and ω 2 of the x-ray photon. The k is the scattering vector recedes from the collision centre; (b) new
scattering process showing momentum conservation where p3 and p1 are the initial and final momenta of the excited
electron (plasmon) due to Compton effect, k1 and k3 of the x-ray photon. E3, and E1, are the initial and final energy
of the plasmon, ω 1 and ω 3 of the x-ray photon. The �kp is the scattering vector approaching to the collision centre.
Hence, we have:Δ�ω = (�ω1 − �ω2) + (�kp1/m0)
or,�ω2 = �ω1 − Δ�ω + (�kp1/m0)
or,
�ω2 = �ω1 −(�2ω1ω2/m0c
2)
(1 − cos 2θ) + (�kp1/m0)
or,
�ω2
(1 +
(�ω1/m0c
2)
(1 − cos 2θ))
= �ω1 + (�kp1/m0) . (22)
Again, the term �
m0kp1 in equation (22) can be simplified using equation (15) as
�
m0kp1 =
�
m0
√2k2
1(1 − cos 2θ) ·m0v,
�
m0kp1 =
�
m0
(2
(ω1
c
) √sin2 θ
)· m0v = 2 �ω1
(v
c
) √sin2 θ. (23)
Finally, from equation (22) and (23)
�ω2 =� ω1
[1 + γ (1 − cos 2θ)]+
2 �ω1
(vc
) √sin2 θ
[1 + γ (1 − cos 2θ)]. (24)
81

MALLICK
The second term of the above equation (24) is the width of the Compton band in terms of energy. Here,
expressing equation (24) in terms of wavelength shift, we have
δλ c = (2h/m0c) sin2 θ + 2 (λ λ′ )12 (pz/m0c) sin θ. (25)
3.3. Electron in oscillating state
In Compton effect, a photon of energy �ω1 , scattered through an angle 2θ from materials consistingof set of rest and free electrons having initial momentum p1 , becomes a scattered photon of reduced energy�ω2 . These rest and free electrons absorb the amount of energy lost by the photon scattered with a momentump2 . Hence, there is a vacancy in the atomic orbit. However, the number of positive charges in the centreremains constant. Then the electron density fluctuation takes place. Hence the excited oscillatory motion offluctuating bound electrons possesses a new momentum p3 . These excited electrons, after transforming energyto another incident x-ray photon, attain a relaxed state of momentum p′1 , which is nearly the same as the initial
momentum p1 . X-ray photon scattered from the above oscillating electrons (solid-state plasmon) shows a newtype of incoherent scattering of enhanced energy �ω3 . From energy momentum conservation laws we have
�ω1 +(p23/2m0
)= �ω3 +
(p′21 /2m0
)(26)
and�k1 + p3 = �k3 + p′1 (27)
or,
p3 = �k3 − �k1 + p1, [p′1 = p1] , (28)
where p3 and p1 are the initial and final momentum of excited plasmon, respectively, k3 is the final momentumof new scattered photon, and kp = k3 −k1 is the scattering vector shown in Figure 2(b). The amount of energy
transferred to x-ray photon from excited electron (plasmon) may be written as
Δ�ω|N = �ω3 − �ω1 =(p23/2m0
)−
(p21/2m0
)= (p1 + �kp)
2/2m0 −
(p21/2m0
),
so,
Δ�ω|N = (�kp + p1)2/2m0 −
(p21/2m0
),
or,
Δ�ω|N =(�2k2
p/2m0
)+ (�kp.p1/m0) , (29)
which is similar to equation (21). Now, the equation (29) contains an extra term, which is also linearlydependent on the electrons ground state momentum and the inverse Doppler shift associated with electron in
plasmon excitation. Hence, the new profile of the scattered photon is centred on k2p/2m0 with a widthkp ·p1/m0 .
As it is difficult to detect the scattered electron experimentally, one can only record the energy distributionof the Compton scattered x-ray photons and then infer the momentum distribution of the electron. In order toextract the information regarding the momentum of the scattering electron, let us define
q = k · p / |k| , (30)
82

MALLICK
which is the projection of the momentum p onto the scattering vector k . From equation (22), one can get afterslight modification
(�k.p1/m0) = −�ω1 + �ω2
(1 +
(�ω1/m0c
2)
(1 − cos 2θ))
so,
p1 = (m0/�k){−�ω1 + �ω2
(1 +
(�ω1/m0c
2)
(1 − cos 2θ))}
. (31)
Since q ≈ p1 , so
q =(m0/�)
{−�ω1 + �ω2
(1 +
(�ω1/m0c
2)
(1 − cos 2θ))}
√k21 + k2
2 − 2k1k2 cos 2θ
=(m0c)
{−�ω1 + �ω2 +
(�2ω1ω2/m0c
2)
(1 − cos 2θ)}
√�2ω2
1 + �2ω22 − 2�2ω1ω2 cos 2θ
(32)
Simplifying equation (32), it gives
q =(−137)
{�ω1 − �ω2 −
(�2ω1ω2/m0c
2)
(1 − cos 2θ)}
√�2ω2
1 + �2ω22 − 2�2ω1ω2 cos 2θ
(33)
where m0c = 137 = 1/α and the α is the fine structure constant. Again m0cα = �/a0 = 1 atomic unit of
momentum (= 1.99275×10⁻¹⁹ g · cm/s). In addition, 1a.u. of energy is equal to 27.2 eV. For convenience, theelectron momentum can be expressed in energy unit by multiplying it with velocity of light ‘c ’. So, 1 atomicunit of momentum (in energy unit) = 27.2×137.036 eV = 3.727 keV.
Thus, with the help of this equation (33), the photon spectrum can be transformed to an electronmomentum spectrum. The negative sign implies that for positive q values the energy shift is lower. If oneassumes k to be along z-direction, then q = pz, so the CP J(q) becomes J(pz,).
Simplifying equation (29) as per equation (13), similar to the case of electron in motion, gives
Δ�ω|N = (�ω3 − �ω1) + (�kpp1/m0)
or,
�ω3 = Δ�ω|N + �ω1 − (�kpp1/m0) . (34)
Modifying equation (16) for this scattering gives
Δ�ω|N =(�2ω1ω3/m0c
2)
(1 − cos 2θ′) . (35)
Simple algebra using equation (34) and (35) leads to the following result:
�ω3 =(�2ω1ω3/m0c
2)
(1 − cos 2θ′) + �ω1 − (�kpp1/m0) (36)
Finally, simplifying equation (37), energy of the scattered photon becomes
�ω3 =� ω1
[1 − γ (1 − cos 2θ′)]−
�
mkpp1
[1 − γ (1 − cos 2θ′)]. (37)
83
MALLICK
Simplifying the value of kp , using vector diagram shown in Figure 2(b) and applying the first approximation
|k1|2 ≈ |k3|2 as in equation (15), one can have
kp =√
(k3 − k1)2 =√
k23 + k2
1 − 2k1k3 cos 2θ′
=√
2k21 (1 − cos 2θ′) = 2
(ω1
c
) √sin2 θ′. (38)
Hence, the term �
m0kpp1 in equation (37), as per equation (28), is actually �
m0kpp
′1 and can be simplified to
�
m0kpp
′1 =
�
m0
(2
(ω1
c
) √sin2 θ′
)· m0v
′ = 2 �ω1
(v′
c
) √sin2 θ′. (39)
Finally, from Equation 37, energy of the newly scattered x-ray photon can be written as
�ω3 =� ω1
[1 − γ (1 − cos 2θ′)]−
[2 �ω1
(v′
c
) √sin2 θ′
][1 − γ (1 − cos 2θ′)]
. (40)
This equation (40) is valid for all angles when γ << 1, i.e., non-relativistic photon (< 15 keV). In this energy
range the relativistic effect can be neglected. According to the equation (40), the energy gain by the x-rayphoton in this process is of the same order as the amount of energy absorbed in Compton process.
Let us consider q′ , the plasmons initial state momentum and the new shift associated with the electronoscillation, which may be given as
q′ = kp. p / |kp| . (41)
Hence, q′ may be further simplified as,
q′ = (m0/�kp){�ω1 − �ω3 +
(�2ω1ω3/m0c
2)
(1 − cos 2θ′)}
q′ =(m0/�)
{�ω1 − �ω3 +
(�2ω1ω3/m0c
2)
(1 − cos 2θ′)}
√k21 + k2
3 − 2k1k3 cos2θ′
=(m0c)
{�ω1 − �ω3 +
(�2ω1ω3/m0c
2)
(1 − cos 2θ′)}
√�2ω2
1 + �2ω23 − 2�2ω1ω3 cos 2θ′
. (42)
Expression (42) gives
q′ =(−137)
{�ω3 − �ω1 −
(�2ω1ω3/m0c
2)
(1 − cos 2θ′)}
√�2ω2
1 + �2ω23 − 2�2ω1ω3 cos 2θ′
. (43)
Thus, with the help of this equation, the photon spectrum can be transferred to an electron momentum spectrum.Thus, q′ value will provide vital information to study the new scattering profile, i.e.J(q′).
The physical origin of the broadening of the modified line developed by Jauncey [52, 53] and DuMond
[54, 55] is known as Compton profile. In that paper, Jauncey pointed out that the interaction between the
x-ray photon and the electron in motion gives rise to a second term in the Compton’s expression (3), which isdependent on the components of electron’s ground state momentum along the scattering vector. The Compton
profile (CP), i.e., J(q) is centered around k2/2m0 with a width k · p1/m0 , where k = k1 − k2 is the scattering
84

MALLICK
vector andp1 is the initial momentum of electron. Therefore, the width of the Compton band [46] can be written
as wC = 2 (λ λ′)1/2(v/c) sin θ . Similarly, when x-ray photon scattered from oscillating electrons (plasmon)
gives rise to a second term in equation (9f), which depends on the electron’s ground state momentum and theinverse Doppler shift associated with electron in solid-state plasma media. Hence, the new modified profile, i.e.,
J(q′) is centred around k2p/2m0 with a width kp · p1/m0 , where kp = k3 − k1 is the scattering vector in solid
state plasma media. Similarly, the width of the new modified band in terms of energy can be written, insteadof wavelength as,
wN =
[2 �ω1
(v′
c
) √sin2 θ′
][1 − γ (1 − cos 2θ′)]
.
3.4. Intermediate state transition probability
In quantum electrodynamics (QED), a quantized electromagnetic field and free electron interactions
involve an initial (ground) state, an intermediate (ionization) state and a final (continuous) state. Momentumand energy are conserved between the initial state and the final state, but in the intermediate state, the theoryrequires only momentum conservation and not energy conservation. In quantum theory, an external field (if it
varies sufficient rapidly) can cause transition from a state of positive energy to state of negative energy [25].In atomic physics, the ionization level is often assigned the zero energy, and the bound states thus all havenegative energies [56]. Hence, the continuum state is assigned positive energy.
As our interest is on scattering of low energy (< 15 keV) x-ray photon, we shall confine ourselves to the
non-relativistic (NR) case and its correction to Compton effect. According to the non-relativistic interaction
(in Coulomb gauge) between an electron and the radiation field, the Hamiltonian [25, 57] is given by
Hint = − e
m0c2(pA) +
e2
2m0c2A2 = H1 + H2, (44)
where, A is the vector potential of x-ray field and p is the momentum operator for the electron.
In case of transition from bound state (or ground state) to continuous state (or final state), i.e., (E0, k1 )
→ (E , k3), as shown in Figure 3, the perturbation term can be defined as
H1 = −e∑
k
αi · ek3√2k1
(ak3e
ik3.x + a†k3
e−ik3·x)
,[a†
k = a−1]. (45)
Here, H1 is a first-order term and αi is the component of the matrix vector. It can only cause transitionsinvolving two x-ray quanta through the virtual states which differ from the initial and final states by havingonly one x-ray quantum emitted or absorbed. The free electron wave function for negative energy state,
ψ = ui(−Pμ) e−ipx+iEt , where ui is a spinor function, i is the spin indices and Pμ is a four vector. The H2 in
equation (44) can be given as
H2 =2π e2
�2c2
mc2√
k1k3
∫ψ∗
nei(k1−k3.x) · ψn0 (ek1 · ek3 )
=2π e2
�2c2
mc2√
k1k3
ei(k1−k3.x)δn0 n (ek1 · ek3 ) , (46)
85

MALLICK
where δn0 n is the delta function, ek1 , ek3 denote unit vectors in the direction of polarization of the two quantak1, k3 and the x denotes a vector specifying the position of the atom.
K
L
Ground state (O)
Intermediate state (I)
Intermediate state (II)
Final state (F)
Incident X-ray
1ωħ
New x-ray line
( ωω ħħ Δ+1 )
Compton ( ωωħ ħΔ−1 )
Raman ( Eδω ±1ħ )
Rayleigh
21 ωω ħħ =
Con
tinuu
m s
tate
Ioni
zatio
n st
ate
Bou
nd s
tate
Figure 3. Schematic energy level diagram indicating the mechanism of Compton, Raman and the new incoherent x-ray
scattering. This is divided into four sections, the ground state (O) at the bottom of the bound state; the intermediate
state (I) of lower energy at the bottom of the ionization state; the intermediate state (II) of higher energy at the top of
the ionization state and the final state (F) is the total range of continuum state. As per the transition mechanism, the
scattering phenomena are so classified as Rayleigh (between top of the ground state to bottom of the continuum state),
Raman (between bottom of the ground state to bottom of the continuum state), Compton (between lower ionization
state, i.e ., intermediate state (I) and bottom of the continuum state) and the new incoherent scattering (between higher
ionization state, i.e., intermediate state (II) and top of the continuum state).
Denoting the Dirac’s amplitudes of the electron with the momenta p0,p, p′, p′′ by u0,u, u′, u′′ , respectively,
and the αi in the direction of polarization of the two x-ray quanta k1 and k3 simply by α1 and α3 , respectively,the matrix M occurring in the transition probability (F→ O) is formulated as
M =∑ (
HOIHIF
EI − EO+
HOIIHIIF
EII − EO
)
=∑n′
(i |H1|n′) (n′ |H1| f)EI − EO
+∑n′′
(i |H1|n′′) (n′′ |H1| f)EII − EO
=∑n′
(u∗α3 u′) (u′∗α1 u0)EI − EO
+∑n′′
(u∗α3 u′′) (u′′∗α1 u0)EII − EO
, (47)
86

MALLICK
where the summations are over the four intermediate states including both signs of the energy (±E) and
both sign of the spin (↑↓). Ei is the energy of initial state and E′n, E′′
n are the energies of the two typesof intermediate state. EO , EI , and EII denote the total energies in the initial and intermediate states. Forcalculation of the transition probability from the final state F(k3 , p3 �= 0) to the initial state O(k1 , p1 = 0),assuming that the process can happen only by passing through an intermediate state which can differ by onequantum (�ω) only from O or F, the respective Hamiltonian [25], can be expressed as
HIF = (n′ |H1 |f) = −e
√2π �2c2
k3(u′∗α3 u) , (48a)
HOI = (i |H1 |n′) = −e
√2π �2c2
k1(u∗
1α1 u′) , (48b)
HIIF = (n′′ |H1 |f) = −e
√2π �2c2
k1(u′′∗α1 u) , (48c)
HOII = (i |H1 |n′′) = −e
√2π �2c2
k3(u∗
1α3 u′′) . (48d)
Only the momentum and not the energy is conserved in these intermediate or virtual states. Hence, the energydifference can be formulated as
EI − EO = E′ −(m0c
2 + k1
)(49)
EII − EO = (E′′ + k1 + k3) −(m0c
2 + k1
)= (E′′ + k3) − m0c
2.(50)
The transition probability per unit time for the new scattering process can be defined as
w =2π
�|M |2 ρF , (51)
where ρF denotes the number of final states per energy interval dE F . Since the final energy is given as afunction of k3 andθ′ , one can have
EF = k3 +√
k2p + (m0c2)2 (52)
k2p = k2
1 + k23 − 2k1k3 cos 2θ′. (53)
Thus,(
dkdEF
)θ
= E k3k1·m0c2 , where E is the electron energy in the final state and
ρF = ρk
(dk
dEF
)θ
[ρF · dEF = ρk · dk]
ρF =dΩ k2
3
(2π � c)3E k3
k1 · m0c2(54)
where dΩ = 2π sin θ dθ , is the element of solid angle for the scattered quanta.
87

MALLICK
Applying equation (49) and (50) in the equation (47), one can have
M =∑n′
(u∗α u′) (u′∗α0 u0)E′−(m0c2+k1)
+∑n′′
(u∗α u′′) (u′′∗α0 u0)(E′′+k3)−m0c2
= M1 + M2
(55)
As defined by Heitler [25], simplifying the differential cross section for this scattering of the photon into themomentum state k3 , we have
dσ =e4 E k2
3
k21 · m0c2
|M |2 dΩ. (56)
On rearranging equation (56), it becomes
dσ
dΩ=
(k23
k21
)(E
m0c2
)e4 |M |2 . (57)
This result is valid for a given polarization of both quanta and a given spin direction of the electron in the initialand final states. The summations in equation (55) are over all spin directions and both signs of the energy forthe intermediate states. Hence, the energy denominators of M are different for the positive energy and negativeenergy state.
Further simplifying, the above equation (57), one can have
dσ
dΩ=
(e2
m0c2
)2 (k23
k21
) (E m0c
2)|M |2 , (58)
where e2
m0c2 (= r0) has the dimension of length, the so-called “classical electron radius” and is equal to
2.82× 10⁻¹³cm. Hence,
dσ
dΩ= (ro)
2
(k23
k21
)(E m0c
2)|M |2 (59)
or,
dσ
dΩ= (σT )
(k23
k21
) (3 E m0c
2
8π
)|M |2 (60)
whereσT (= 6.65 × 10⁻²⁵cm2 /electron) is known as the Thompson scattering cross section. The deduction
of QED cross section can be done with the evaluation of the matrix M in equation (60) (see Appendix-A for
derivation). The derivation of the cross section, which ends up with equation (58), is based solely on the p ·A term of the interaction Hamiltonian. As mentioned in Ohmura and Matsudaira [58], in the x-ray plasmon
scattering the term p · A is negligible in Compton cross section for all possible practical scattering angles [59].
Hence, the contribution of the A2 term of the interacting Hamiltonian to the x-ray Compton cross section is the
prime interest here. Therefore, the scattering cross section (based solely on the A2 term) was derived applyingstatistical approach described below.
88
MALLICK
3.5. Scattering cross section
In the statistical model of the atom, incoherent scattering cross section of x-rays by a system of interactingparticles is expressible in terms of density distribution functions for the system [60, 61] as
σ(k) = σT
∫P (k, r) n(r) dr, (61)
where P (k, r) is the local correlation function, and n(r) is the electron density function.
However, the maximum information about the many-particle system is contained in the quantity P (k, ω),which is the Fourier transformation in space and time of the time-dependent pair-distribution function for thesystem [60–63] and is also known as spectral function. The spectral function P (k, ω) is directly measured inan inelastic-scattering experiment. Applying the Born approximation, one can find the angular and energydistribution of scattered photon as
d2σ
dΩ dω=
m20
8π3
p3
p2V 2
k P (k, ω) (62)
for the particle (electron) of mass m0 , initial momentum p2 scattered to a final momentum p3 , with energy
transfer between ω and ω + dω , and scattering angle specified by dΩ. The energy transfer Δ�ω|N is related
to the momentum transfer and scattering angle as given in expression (29). In the case of collective mode, the
Coulomb interaction factor Vk [62] is simplified as
Vk = 4π e2/k2p. (63)
However, the static Coulomb interaction generated due to the scalar field (static field) φ (r, t), a well-defined
function of the particle coordinates at the same time [25].
Again, this P (k, ω) is related to the structure factor P (k)[62] by
∫ ∞
−∞P (k, ω) dω = P (k) ne (64)
where, P (k) =⟨ψo
∣∣∣ρ†kρk
∣∣∣ ψo
⟩/ne , and the P (k) is directly measured in a scattering experiment in which one
determines the differential cross section. Then the differential cross section is determined by integrating overall energy transfers [62]:
dσ
dθ′=
∫ ∞
0
d2σ
dθ dωdω =
m20
8π3
p3
p1V 2
k P (k) ne. (65)
For the evaluation of the incoherent form factor by applying non-interacting Fermi gas models of the atom suchas Thomas-Fermi (TF) and Thomas-Fermi-Dirac (TFD) fails to explain in this system. The deficiencies of theabove models can be removed by introducing the correlations brought about by the electrostatic interactionbetween electrons, i.e., considering the interacting Fermi gas [61]. As described, the interacting Fermi gas model
deals with relation between the pair distribution function and the dielectric constant of the uniform gas [61, 64].
In the interacting Fermi gas model, the correlation term P (k, r) used in the above equation (61) can be taken
as P (k) (for brevity by omitting the argument r) and can be expressed in the random-phase approximation
89

MALLICK
(RPA) as a function of dielectric constant ∈ (k, ω) as
P (k) =� k2
p
4π2 ne e2
∫ ∞
0
∈2 (k, ω)|∈ (k, ω)|2
dω (66)
where, ∈ (k, ω) =∈1 (k, ω) + i ∈2 (k, ω).
After a bit of algebraic simplification, one can have the P (k) as the same as given in earlier expression
(64).
The various physical phenomena existing within the concept of incoherent x-ray scattering can be classifiedin three meaningful catagories according to the associated energy transfer Δ�ω (expression (21)) and momentum
transfer k (expression (15)) in relation to the characteristic energies or structural dimensions. The above three
distinct regimes are: the Compton scattering regime (Δ�ω >> EB , k rnl >> 1), i.e., the energy (momentum)
transfer is large compared to the binding energy EB (inverse of the orbital radiusrnl) of the target electron;
the characteristics excitation (Raman scattering) regime (Δ�ω ∼= EB , k rnl∼= 1), i.e., the energy (momentum)
transfer is comparable to the EB (inverse of the rnl or inter atomic distance) of the target system; and the
collective scattering regime (Δ�ω << 1 keV , k rnl << 1), i.e., the energy (momentum) transfer is very small
(< 1 keV) compared to EB (inverse of inter atomic distance) of the target material [65]. The excitation may beeither of local or collective type. In a uniform gas, for small values of the wave number kp , there are two kinds
of excitation contributions to P (k); one is the particle-hole pair excitations and the other one is the collective
excitations [61, 62]. For electron gas, the collective mode is the plasmon. A quantized plasmon oscillation
correspond to oscillations in the particle density. The collective contribution toP (k) in the small kp region is,
to an accuracy k4p/k4
TF ,
Pcoll(k) =�2 k2
p
2m ωk, (67)
where ωk is the oscillation frequency of the collective mode with the wave number kp and kTF is the Thomas-
Fermi screening wave number, k2TF = (4/π)(kF /a0), and a0 is the Bohr radius [62].
The dielectric function ε(ω, k) of the electron gas is strongly dependent on the frequency and wavevector.
A number of theories or models related to ε(ω, k) has been given [63]. Due of the complexity of the many bodyproblem, knowledge of the exact dielectric function is still lacking. However, we are interested, here, in RPAtype dielectric function. The RPA is also called the Lindhard dielectric function and is a model for a static ε(k)
or dynamic ε(ω, k) dielectric function [63]. For brevity, we do not exhibit here the frequency dependence (the
predicted scattering is highly dependent on critical number density of plasom nc).
According to the dispersion relation, the collective frequency ωk of the electromagnetic wave propagatedin solid [50] can be simplified as
ωk =
[c2k2
p
ε(ω, k)
] 12
=
[4π c2k2
p
∈
] 12
(68)
As it is already mentioned earlier, ε = ε0 ∈ , and ε0 = 1/4π (see the hypothesis, i.e., section 2). Also, using
equation (4),
ωk =
[c2k2
p
(nc − ne)/nc
] 12
. (69)
90

MALLICK
Hence, simplifying equation (65) using expressions (63) and (67), one can have
dσ
dθ′=
m20
8π3
p3
p2
(4π e2
k2p
)2�2 k2
p
2m0 ωkne
=m2
0
8π3
p3
p2
(4π e2
k2p
)2�2 k2
p
2m0
[∈
4π c2k2p
] 12
ne[substituting ωk from (68)] (70)
=(
e2
m0c2
)2 (1kp
)3 (m0c)4
16π3
p3
p2
�2
(m0c)[4π]
32 [∈]
12 ne
= (r0)2
(1kp
)3[
(m0c)3�2(4π)32
16π3
]p3
p2[∈]
12 ne
=8π
3(r0)
2
(1kp
)3[
(137)3�2(4π)32
16π3 × 8π3
]p3
p2[∈]
12 ne
= σT
(1kp
)3[
(137)3 �2
π52 × 16
3
]p3
p2[∈]
12 ne. (71)
Hence,
dσ
dθ′= σT
(1kp
)3
Mcp3
p2(∈)
12 ne, (72)
where Mc (≈ 2.756×10⁴) is a constant quantity, since,m0c = 137 and considering � = c = 1, as used to study
x-ray scattering from electron gas [17, 18]. Since the solid angle Ω(r, θ′) is a function of r and θ′ , the above
equation (72) can be written as (dσ
dΩ
)N
= σT
(1kp
)3
Mcp3
p2(∈)
12 ne (73)
However,(
dσdΩ
)over this plasmon line is already defined in DuBois and Gilinsky [14].
The total cross section of this new incoherent scattering can be obtained by integrating the equation (73)
over the solid angle, dΩ = 2π sin θ′ dθ′ :
σN =∫ (
dσ
dΩ
)N
dΩ (74)
or,
σN = σT
(1kp
)3
Mcp3
p2(∈)
12 ne
∫ π
0
2π sin θ′ dθ′. (75)
Finally, the total scattering cross section of this new scattering is found out to be
σN = σT
(1kp
)3
Mcp3
p2(∈)
12 ne (4π), (76)
where the scattering vector kp has magnitude kp = (4π/λ′′) sin θ′ . Hence, the new scattering cross section is
found out to be inversely proportional to the third power of momentum transfer, i.e., k−3p . In addition, this new
91
MALLICK
scattering cross section is found out to be directly proportional to the√∈ as predicted in the hypothesis. Also
the final momentum p3 or the momentum of the relaxed electron after scattering of the photon of enhancedenergy is the same as the initial momentum p1 , i.e. p3 ≈ p1 .
Further simplified, alternative form of the total scattering cross section of this new scattering is foundout to be
σN = σT
(1kp
)3
M ′c
p3
p2
( ∣∣∣∣nc − ne
nc
∣∣∣∣) 1
2
ne, (77)
where M ′c (= (4π)
32 Mc) is a constant.
3.6. Scattering intensity
The scattered intensity is described by the double differential cross section d2σdΩ dω , and the inelastic
scattering intensity includes both contributions of the coherent and the incoherent parts. Physical conceptsbehind both the scattering parts and their respective functions are given elsewhere [66, 67]. Theoretical
calculation of the intensity of scattering of x-rays by recoiling electrons is defined by Woo [68]. However, for
the experimental intensity of inelastic scattering as observed by Paakkari and Suortti [69] for the symmetrical-reflection geometry, i.e., the incident and detected rays making equal angle θ with the flat specimen surface,the expression is modified because of this new type incoherent scattering to
I = IO Ω MO Kpol
((dσ/dΩ)C
μO + μC+
(dσ/dΩ)TDS
2μO+
(dσ/dΩ)N
μO + μN
), (78)
where I is the intensity of the inelastic scattering, IO is the intensity of the primary beam, Ω is the solidangle subtended by the receiving slit, MO is the number of atoms per unit volume and Kpol is the ratio of the
polarization factor of the scattered radiation to that of the monochromatic primary beam. In the present case,this can be written [69] as
Kpol =(1 + K′ cos2 2θ′)
(1 + K′)(79)
where K′ (= I(π)/I(σ)) is the polarization ratio of the primary beam.
Again, in the above equation (79), the linear absorption coefficients for the unmodified, Compton-modifiedand modified by this new incoherent process are denoted by μO , μC and μN , respectively. Also, the scatteringcross sections per atom are: for the Compton process C, (dσ/dΩ)C , for the thermal diffusion scattering TDS,
(dσ/dΩ)TDS , and for the new incoherent scattering process, (dσ/dΩ)N . This new scattering cross section has
been derived in the earlier section (3.5) of this paper in equation (74). However, the other two scattering cross
sections have already been reported by others elsewhere [69].
4. Experimental
X-ray scattering experiments have been carried out using two types of x-ray instruments, i.e., wavelengthdispersive x-ray (WDXR) spectrometry [70] and energy dispersive x-ray fluorescence (WDXR and EDXRF)
spectrometry [71, 72] techniques for spectroscopic analysis of materials. The details of the WDXR, EDXRFspectrometry techniques are discussed below.
92

MALLICK
4.1. Wavelength dispersive x-ray spectrometry
A WDXR spectrometer (Philips analytical x-ray instrument, Model No.-PW 3020, Netherlands) employ-
ing Bragg-Brentano parafocusing optics with an energy resolution ΔEE
= 1 × 10⁻³ was used for the scattering
study. The system shows the FWHM of 8 eV at 8 keV x-ray, which corresponds to a momentum resolution ofabout 0.16 a.u., calculated using the relations given in references [73–75].
A section was examined via the scattering geometry shown in Figure 4(a). Incident line focus camefrom CuKα or CoKα radiation produced by a high-power ceramic tube of focus dimension 12 mm × 0.4 mm,operated at 40 kV and 40 mA using a 2.0 kW (40 kV and 50 mA) x-ray generator. Radiation was passed
through a Be window having 93% transmission, emitting CuKα x-ray (1.289×10⁻¹⁵ J) photons on the order
of 1.2 × 10¹⁶ photon/s (= 1600 W×0.93×0.011.289×10−15J , with only 1% of power converted to CuKα x-ray, which can be
achieved using modern high-power ceramic tube). Monochromatic photons of the order of 109 photon/s can
be obtained using a presently available high-power sealed-off tube [75]. The CuKα excitation from the line
focus tube was filtered by a β -filter, then the x-ray beam was collimated through Soller slit (SS) of 0.04 rad.,
fixed divergence slit (FDS) of 2◦ and mask (10 mm) before irradiating the sample. The scattered x-ray beam
from the sample was well collimated by passing it through a programmable anti-scattering slit (PASS) of 2◦
(to reduce air scattering), programmable receiving slit (PRS) of 0.8 mm and Soller slit (SS) of 0.04 rad. before
getting it reflected by the Johannson-type curved graphite crystal (002) monochromator of radius 225 mm. The
monochromator crystal has an interplaner spacing is 3.383 A. The graphite monochromator gives an intensitygain of about 70 in comparison with silicon crystals in the same geometry [76]. Since x-ray absorption depends
approximately on Z4 , while maximum possible diffraction power is proportional to Z2 (mosaic crystal case),where Z is the atomic number, the crystals of the lighter elements are expected to form better monochromatorsthen those of heavier elements [2, 77]. A sophisticated Xe-gas filled proportional counter (PW 3011) having 8
mm×26 mm window size and 19% energy resolution was mounted on the arm of the goniometer circle of radius200 mm. The counter is capable to possess maximum count rate of 750 kcps with a background of 2 cps. Stepsize chosen for this experiment was 1◦ . In this arrangement, x-rays are reflected from both the specimen andthe focusing monochromator, which is known as reflection-reflection mode in double-crystal spectrometry (+
-) [2]. Data have been collected in an absolute-scan mode (scanning 2θ and keeping sample fixed with respect
to the beam direction). Experimental set up was fully computer-controlled. The observed spectra were fitted
using X’Pert Graphics software supplied by Philips, Netherlands [78].
4.2. Energy dispersive x-ray spectrometry
Samples were also characterized via Energy Dispersive X-ray Fluorescence (EDXRF) using an Oxford
model XTF-5020/W triple-axis EDXRF spectrometer as shown in Figure 4(b). Power supply unit used is the
SPELLMAN, USA (50 kV/2.0 mA) air-cool unit. The experiment was performed on powder and crystals usingMoKβ and PbLα x-rays as a secondary radiation from a tungsten anode based x-ray tube operated at 40 kV
and 1 mA. The crystal was mounted in such a way that scattered radiation was received by the Canberra,USA make Si (Li) detector (Model no. SL30160) set at 90◦ and 125◦ with respect to the incident beam.The detector head is placed at a distance of 30 mm from the sample surface. The scattered beam consistingof coherent, incoherent components and fluorescence is directly counted by a 3 mm thick Si(Li) crystal. The
93

MALLICK
detector is biased with negative 500 V using a Canberra make HV power supply unit (Model 3106D). The Si(Li)
detector having an 8 μm thick beryllium window with a resolution of 180 eV (FWHM) at 5.9 keV x-ray with amomentum resolution about 0.39 a.u at a back scattered geometry, calculated using the relations given in thereferences [74, 75, 79]. The detector signal was further amplified (shaping time 2 μs) using an ORTEC 572A
amplifier mounted in an ORTEC BIN (Model No. 4001C). This amplified signal was fed into an automated
PC-based multi-channel analyzer (MCA) for recording the data. The peak area was set at a suitable range of
1–2 K to register the total spectrum [80]. The peak areas of each spectrum were evaluated by least squares
fitting method using the AXIL program [81] supplied by International Atomic Energy Agency (IAEA).
(a) (b)
Secondary Target (Mo, Pb)
Collimator (3mm)
Si(Li) detector
125° 90°
Sam
ple
Prim
ary
x-r
ay
Secondary x-ray
Be-window
X -
ray
tube
Prim
ary
targ
et (
W)
X-ray tube
Focusing circle
Monochromator
Goniometer circle
FDS Sample PASS
Detector
SS
SS MaskFocal point
Slit
Figure 4. (a) Geometry of the wavelength-dispersive x-ray (WDXR) spectrometry having Bragg-Brentano parafocusing
optics (the abbreviations used are. SS for solar slit, FDS for fixed divergence slit, PASS for programmable anti-scattering
slit, PRS for programmable receiving slit), and (b) geometry of triple axis energy-dispersive x-ray fluorescence (EDXRF)
spectrometry.
5. Results and discussion
Compton scattering studies were carried out using photons of energy on the order of ×102 keV, having
scattering cross section of the order of 10−25 cm2 /electron. This can be calculated using the well-known
expression for the cross section [25, 82]:
σC = σT34
{1 + γ
γ3
[2γ (1 + γ)(1 + 2γ)
− ln (1 + 2γ)]
+ln (1 + 2γ)
2γ− (1 + 3γ)
(1 + 2γ)2
}.
At the same time the total scattering cross section of this new scattering, i.e. σN , derived in equation (76) and
calculated to be of the order of 10−27 cm2 /electron, is nearly 100 times less than the σC . This is one of thevital reasons for the non observance of this type of incoherent scattering peak in the earlier Compton scatteringexperiments. However, experimentally it seems feasible to observe this kind of scattering phenomenon usinglow-energy x-ray photon. For photons of energy about 10 keV (γ << 1), the energy (maximum) absorbed
by the excited (recoil) electron is of the order of 400 eV for scattering in the backward direction. The energy
absorbed by the excited (recoil) electron is a function of the scattering angle as given in equation (16). Usually,
94

MALLICK
Thompson scattering (coherent) cross section σT is of the order of 10−24 cm2 /electron. Since a non-relativistic
(NR) description of incoherent scattering can be applied to x-rays below roughly 15 keV [83], in this energy range,the relativistic effects are negligible. Therefore, NR treatment can be applied to analyze this new scatteringcross section.
The Compton cross section is of the same order as the Thompson cross section, i.e., σC = 10−24
cm2 /electron in NR region [25]. In the Compton process, the total scattering cross section for 10 keV x-
rays is of the order of 10−24 cm2 /electron. However, the σN is of the order of 10−23 cm2 /electron, which isnearly 10 times greater than the Compton cross section in NR region. This is calculated by taking the lowest
value of the momentum (velocity) ratio of electron, i.e., p3p2
as 0.1. Since velocity ratio v3v2
= 106
107 ≈ 0.1, the
maximum velocity attained by the excited electron (plasmon or recoil) v2 due to Compton process is nearly
of the order of 107m/s or less and after transferring this energy the excited electron attains a relaxed velocity
v3 , which is same as the orbital velocity v1 and is of the order of 106m/s. In actual practice, the v2 is quite
low hence the above velocity (or momentum) ratio is high, so a high value of scattering cross section can beobserved. Again, the lifetime of plasmon excitation and the incident photon flux, which are very sensitive andbear out the idea of feasibility of this new type of scattering phenomena. The lifetime of the plasmon excitation
is of the order of 10−16 s [84, 85], at the same time the lifecycle of the plasmon standing wave generated due
to Compton effect (using low energy x-ray of 10 keV) calculated using de Brogile’s hypothesis is of the order of
10−16 s. Since, the number of photon emitted by the source is of the order of 1016 photon/s (as calculated in
Experimental section 4.1), the possibility of this type of collision cannot be ignore. Hence, it is positive to thinkthe experimental feasibility of such type of x-ray scattering from the plasmon standing wave whose lifecycle isfew hundred times greater than the previous one (x-ray wave).
Further, the√∈ term leads to a high value of scattering cross section from materials of high dielectric
constant. As discussed, for low energy (10 keV) photons, σN is on the order of 10−23 cm2 per unit solid angle,
and since there are roughly 1022 electrons (scatterers) per unit volume, one would expect one part in 10 of
the incident beam to be scattered per cm3 of sample into a unit solid angle. Observation of higher order ofmagnitude of the scattering cross section is justified, since our interest is on scattering of x-ray from materialsof negative refractive index (virtual), where, nc < ne . Since, the experimental scattering cross section depends
on both photon flux density (I0) at target and number density of electron (ne), i.e.,(
dσdΩ
)C
= Ycorr
(dΩ)D ne I0
where, Ycorr is the corrected yield (see Appendix-B) and (dΩ)D is the detector solid angle [48]. So, with our
assumption (materials of negative refractive index,nc < ne) the new scattering cross section may be given as(dσdΩ
)N
= Ycorr
(dΩ)D nc I0, when nc is the critical plasmon density where nc < ne .
Experimental existence of very low magnitude of scattering cross section such as in high-energy gamma-
ray Compton scattering (10−26cm2 /sr.) [48], x-ray Raman scattering (10−29cm2 /sr.) [9, 86, 87] and proton
Compton scattering (10−32cm2 /sr.) [33] has already been reported by various researchers. At the same time,
electron Compton scattering cross section higher by five orders of magnitude has been reported [30].
In order to ascertain that the new modified x-ray line observed is not accidental or random one, experi-ments have been performed on different samples since 2000, using different x-ray wavelengths in both energy-and wavelength-dispersive spectrometers [43]. It was found that the existence of this new peak was as real andreproducible as the Compton peak and was highly dependent upon scattering angle and characteristics of thescattering substances.
95

MALLICK
5.1. WDXR spectral analysis
As discussed in the instrumental section, CoKα and CuKα x-ray signals are detected using a Xe-filledproportional counter. Therefore, there is possibility to detect an extra peak in the patterns observed usingx-ray (Co and Cu) radiations and Xe-filled proportional counter, since CoKα (6.92 keV) and CuKα (8.04 keV)
are both energetic enough to excite XeLα (absorption edge energy 4.78 keV) and emit 4.14 keV energetic linespectra. Therefore, the spectra will contain CoKα and CuKα escape peaks in the respective x-ray spectrogram.The energy of these escape peaks will be simply the difference between the energy of XeLα and CoKα or CuKα ,respectively. However, the escape of CoKα (6.92–4.14) and CuKα (8.04–4.14) arise at 2.78 keV and 3.90 keV,respectively, in the respective spectra. This well-separated keV energy peak from its incident x-ray peak ariseson the low-energy side (high-angle side in WDXR spectra) after the Compton tail and can be easily identified,since the largest energy transfer in the Compton collision process is only a few hundred eV. Therefore, the newincoherent scattered peak can be well separated from the escape or spurious peak.
5.1.1. Solid PET
The organic substances are typically made up of many hydrocarbons and pose extremely difficult problem todetermine the scattering factors in these condensed states, since the interference effects between molecules wouldbe difficult to separate from the molecular structure factors. However, the Compton profile provides a methodfor determining the accuracy of wave functions, since there are no comparable interference effects [2, 88]. Again,these condensed states consist of low-Z elements, so the binding energy is less. Therefore, the condensed state ofhydrocarbons like polymers offers opportunity to study the Compton effect by researchers. A number of workson the Compton effect in polymers have been reported [33, 40, 89–91].
The scattered spectra of CoKα (6.923 keV) x-rays by a 3 mm thick and 15×25 mm2 area polyethylene
terephthalate ([C10H8 O4 ]n) or PET target using WDXR spectrometry are shown in Figures 5(a) and (b).
With an exposure of 10 h at 40 kV and 30 mA, at scattering angle 109.5o (2θ), the spectra possess usual
coherent, incoherent (Compton) peaks with a new x-ray incoherent peak at the low-angle (high-energy) side of
the spectrogram. The total spectrum was collected with a scan speed of 0.00075 degree/s. The raw or smeared
(a)(b)
100 105 110 115 120
1.20x10⁶
1.22x10⁶
1.23x10⁶
1.25x10⁶
1.26x10⁶
1.27x10⁶
1.29x10⁶
c
r
a
CoK
α
Inte
nsity
(co
unts
)
Scattering angle (deg.)105 110 115 120
0
10
20
30
40
50
60
70
80
CoKα
r
c
a
Inte
nsity
(a.
u)
Scattering angle (deg.)
Figure 5. (a) WDXR scattering spectra (accumulation of 10 h) of smeared intensity data obtained from PET solid at109.5◦ using CoKα X-radiation, and (b) the de-smeared data of the x-ray spectra showing unmodified line (r), Compton(c) and the new incoherent scattering (a) peak.
96

MALLICK
intensity was of the order of 106 scattered photons and is shown in Figure 5(a). However, the de-smeared data,
i.e., after subtracting background is shown in Figure 5(b). The wavelength shift of the Compton peak, which
varies with the scattering angle 2θ (109.5o), was calculated to be about 0.0327 A and is given in Table 1.
Table 1. X-ray scattered- profile data for solid PET CoKα1 applying WDXR spectrometry.
Parameter Experimental Parameter Experimentalvalue value
γ 0.014 ∈ 3.42θ / ◦ 109.5 n (6) ±0.52v/ca 0.048 Zb
eff 6.64λ / A 1.79591 nc
e/1022 e/cm3 2.91�ω1/ keV 6.923 Ed
p /eV 18.77�ω2/ keV (24) 6.874 Ee
B /eV 13.6 (H 1s)286 (C 1s)
�ω3/ keV (40) 7.008 Ia /Ir 0.394q/a.u (33) +0.952 Ic /Ir 1.479q′/ a.u (43) +0.454 Ia /Rc 12.17Δλc/A (25) 0.0327 ± 0.0002 (E) kp /A −1 (76) 5.71 ± 0.02 (E)
0.0324 ± 0.0001 (T) 5.81 ± 0.01 (T)ΔλN/A (10) 0.0320 ± 0.0002 (E) σN/10−24 (76) cm2/electron 44.88 ± 2.76 (E)
0.0324 ± 0.0002 (T) 42.50 ± 2.43 (T)
a Using the relation vc
= 1137.0377
Zeff [F. K. Richtmyer, E. H. Kennard, and J. N. Cooper, Introduction to Modern
Physics, 6th Ed., p. 236, Tata McGraw-Hill Publishing Company Ltd. New Delhi, 1976], can be obtained by simplifying
the fine structure constant for the complex material.
b The effective atomic number, Zeff = 2.94�
f1 × (z1)2.94 + f2 × (z2)2.94 + f3 × (z3)2.94 + · · · .c Electron density (electrons/cm3) of the material can be calculated using the approximate relation, ne = Zeff
NAρM
,
where NA is the Avogadro’s number (6.023×10²³) , ρ is the density, and M is the molecular weight of the complex.
d Plasmon energy (eV) of the complex system can be calculated using the relation Ep =
��
�4π e2
m
�1/2�
(ne)1/2 =
3.711 × 10⁻¹¹ √ne .
e Average binding energy of carbon 1s (PET) published in the paper [77].
As stated in the hypothesis, during Compton process the material target behaves as a virtual metama-terial, the NRI of PET (∈= 3.4) was estimated to be -0.52 (using expression (6)). Due to the NRI of the
target material, x-rays of low frequency were scattered with high frequency (low wavelength). Wavelength shift
in this process is found to be 0.0320A experimentally for the PET, which matches well with the theoretically(using expression (10)) calculated value and is given in the Table 1. The intensity ratio (de-smeared data) of
the modified (Compton) to unmodified, i.e.,Ic/Ir (=Rc) was found out to be 1.479. However, the Comptonpeak-to-background ratio obtained was about 68:1. It is interesting to note that a low-intensity peak of about26.5% of the height of the Compton peak with the standard deviation, σ [70, 92] of 1.57% was visible on the
high-energy side (with respect to coherent peak) of the spectra measured on PET. Intensity ratio of the above
new incoherent peak Ia with usual unmodified peakIr , i.e., Ia /Ir was found to be 0.394 (peak-to-background
97
MALLICK
ratio is 18:1). The position of this new peak corresponded to an energy transfer of about 123 eV(high energy side
of the CoKα1 line), whose Compton shift energy of about 138 eV (low energy side of the CoKα1 line). However,
the C1s binding energies of PET are 284.4 eV (benzene ring), 286 eV (-CH2 -O-) and 288.5 eV (-CO-O-) [93].
It is interesting to note that the Compton profile J(q) from these 1s electrons was too weak to beobserved, since the energy loss in the Compton process Δ�ω is less than the binding energy of the electronEB . This ground state energy with 1s hydrogenic wave function at its initial-state can be written as EB =
Z2me2/2�2 [2]. The effective atomic number Zeff , of the complex material (PET) can be calculated using
the methods known as “self- consistent field (SCF)” or Hartree-Fock (HF) method, but in simplified situation
Zeff = 2.94√
f1 × (z1)2.94 + f2 × (z2)2.94 + f3 × (z3)2.94 + · · · , where f1 is the fraction of the total number of
electrons associated with each element and zn is the atomic number of each element in the complex material[94]. Hence, the ground state velocity of the electron in terms of velocity of light was calculated to estimate
the peak broadening. The energy spread of the new peak, i.e., width (38 eV) found out to be less than the
Compton profile width (78 eV). Taking width of the profile into consideration, the energy of the incoherently
scattered photon of Compton type (equation (24)) was found out to be 6.874 keV and energy of the new x-ray
photon (equation (40)) is about 7.008 keV.
It was under these scattering conditions (CoKα1 radiation and2θ = 109.5◦), the profile functions q and
q′ were calculated for both types of scattering process. The value of q and q′ was found out to be +0.952 a.u.and +0.454 a.u., respectively. The negative sign of the expression (33) implies that for positive q value theenergy shift is lower. Therefore, smaller the positive value of q , smaller will be the energy shift. Hence, the lesspositive value of q′ (expression (43)) with respect to q (expression (33)) indicates that the energy exchange inthe new process is lower as compared to the Compton process. The momentum transfer kp in this process is
found out to be 5.71 ± 0.02 A−1 . The total scattering cross section σN , which is inversely proportional to the
third power of the kp (equation (76)), is found to be (44.88±2.76)×10−24 cm2 /electron. This is very close
to the theoretically calculated result ((42.50±2.43)×10−24 cm2 /electron), and is given in the Table 1. Again,
σN is directly proportional to√∈ as given in equation (76), which indicates that the materials of high value
of dielectric constant produces high value of σN .
Most polymers possess very low value of static dielectric constant; this can be further enhanced in variousways. One of the important ways for enhancing the static dielectric constant (impurity free) of the polymer is
by treating the polymer with proton beam [95–97].
5.1.2. Liquid glycerin
CuKα1 (8.048 keV) x-ray scattered from 2 mm thick pure glycerin (C3 H8 O3) shows the existence of this new
peak. The sample was packed in a special-type liquid cell (25×30 mm2) having 3 micron Mylar window atboth sides. With an exposure of 10 h at 30 kV and 20 mA at scattering angle 108.5◦ , and effective area of
83 mm2 , the total spectrum was collected with a scanning speed of 0.00112 ◦ /s. Intensity of the raw data
was on the order of 104 scattered photons and the smeared intensity was about a few hundred counts fromthe liquid target, as shown in Figure 6. Though difficult, it is very interesting to analyze the gaseous andliquid samples [98, 99]. The Compton effect of other high-dielectric liquid-like water has been well studied [37,
100–104]. Because of the presence of carbon atom, high dielectric (∈ = 68) nature, and availability in its pureform, glycerin was selected for the present study.
98
MALLICK
104 106 108 110 112 114 116
0
300
600
900
c
a
r
CuK
α
Inte
nsity
(a.
u)
Scattering angle (deg.)
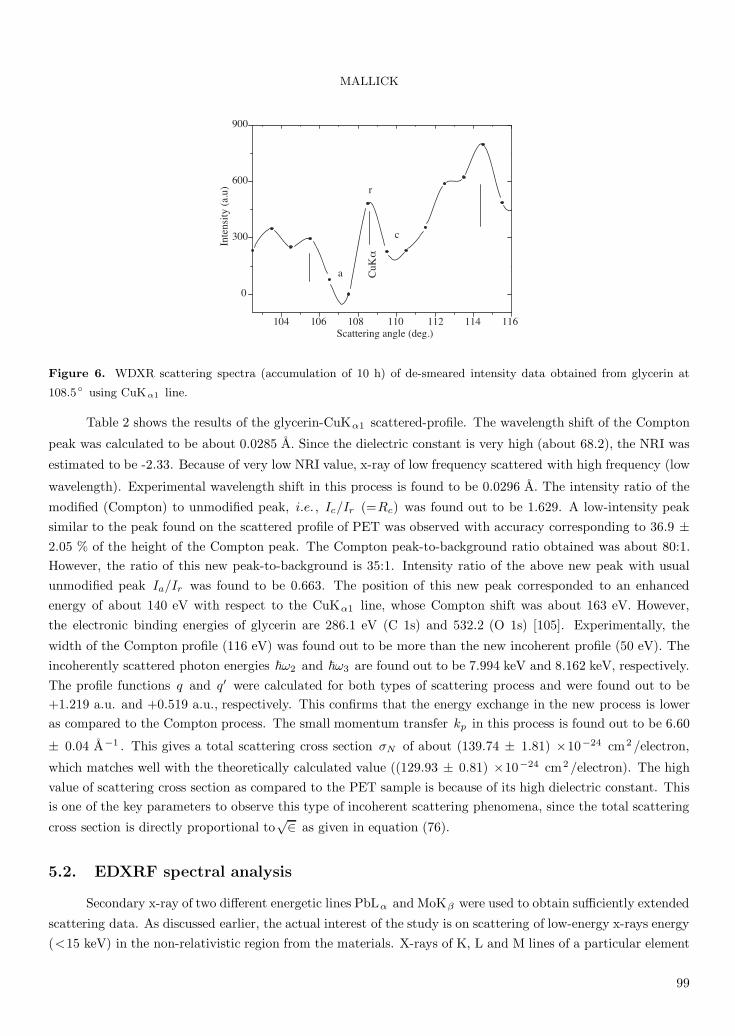
Figure 6. WDXR scattering spectra (accumulation of 10 h) of de-smeared intensity data obtained from glycerin at
108.5◦ using CuKα1 line.
Table 2 shows the results of the glycerin-CuKα1 scattered-profile. The wavelength shift of the Compton
peak was calculated to be about 0.0285 A. Since the dielectric constant is very high (about 68.2), the NRI was
estimated to be -2.33. Because of very low NRI value, x-ray of low frequency scattered with high frequency (low
wavelength). Experimental wavelength shift in this process is found to be 0.0296 A. The intensity ratio of the
modified (Compton) to unmodified peak, i.e. , Ic/Ir (=Rc) was found out to be 1.629. A low-intensity peaksimilar to the peak found on the scattered profile of PET was observed with accuracy corresponding to 36.9 ±2.05 % of the height of the Compton peak. The Compton peak-to-background ratio obtained was about 80:1.However, the ratio of this new peak-to-background is 35:1. Intensity ratio of the above new peak with usualunmodified peak Ia/Ir was found to be 0.663. The position of this new peak corresponded to an enhancedenergy of about 140 eV with respect to the CuKα1 line, whose Compton shift was about 163 eV. However,the electronic binding energies of glycerin are 286.1 eV (C 1s) and 532.2 (O 1s) [105]. Experimentally, the
width of the Compton profile (116 eV) was found out to be more than the new incoherent profile (50 eV). Theincoherently scattered photon energies �ω2 and �ω3 are found out to be 7.994 keV and 8.162 keV, respectively.The profile functions q and q′ were calculated for both types of scattering process and were found out to be+1.219 a.u. and +0.519 a.u., respectively. This confirms that the energy exchange in the new process is loweras compared to the Compton process. The small momentum transfer kp in this process is found out to be 6.60
± 0.04 A−1 . This gives a total scattering cross section σN of about (139.74 ± 1.81) ×10−24 cm2 /electron,
which matches well with the theoretically calculated value ((129.93 ± 0.81) ×10−24 cm2 /electron). The highvalue of scattering cross section as compared to the PET sample is because of its high dielectric constant. Thisis one of the key parameters to observe this type of incoherent scattering phenomena, since the total scattering
cross section is directly proportional to√∈ as given in equation (76).
5.2. EDXRF spectral analysis
Secondary x-ray of two different energetic lines PbLα and MoKβ were used to obtain sufficiently extended
scattering data. As discussed earlier, the actual interest of the study is on scattering of low-energy x-rays energy(<15 keV) in the non-relativistic region from the materials. X-rays of K, L and M lines of a particular element
99

MALLICK
show a decreasing order of energy and FWHM. From the table [46] related to wavelength of the spectral lineof important target metals and their respective spectral line width, it is clear that the AgL x-ray lines arehaving the highest spectral resolution (FWHM/λ) and the PbL shows the next to the AgL lines. However,the PbL x-ray was selected to carryout the scattering experiment for many reasons. Firstly, the wide energyspacing between the two nearby PbL x-ray lines, i.e., the energy spacing between PbLα -PbLβ or PbLβ -PbLγ1
is around 2.1 keV. Hence, the incident x-ray lines (PbLα , PbLβ , PbLγ1), their respective Compton lines, SiKα -
escape peaks (from the Si(Li) detector) and the new incoherent line can be well separated. Nevertheless, the
energy spacing between AgLα -AgLβ or AgLβ -AgLγ1 is around 270 eV. Secondly, these x-ray lines (PbL x-ray
lines) belongs to the non-relativistic photon (<15 keV) of maximum energy. Therefore, the maximum energyloss in the Compton collision process in a back scattering geometry is around 800 eV, which is expected toproduce well-intense and well-separated peak for lighter elements (smaller Z).
Table 2. Analysis of CuKα1 x-ray scattered profile from liquid glycerin applying WDXR spectrometry.
Parameter Experimental Parameter Experimentalvalue value
γ 0.016 ∈ 68.22θ /◦ 108.5 n (6) ±2.33v/c 0.061 Zeff 8.4
λ / A 1.54056 ne /1022 e/ cm3 6.93�ω1/ keV 8.048 Ep /eV 9.77
�ω2/ keV (24) 7.994 EaB /eV 13.6 (H 1s)
286.1 (C1s),532.2 (O1s)
�ω3/ keV (40) 8.162 Ia /Ir 0.663q / a.u (33) +1.219 Ic /Ir 1.629q′/ a.u (43) +0.519 Ia /Rc 198.59Δλc/A (25) 0.0285 ± 0.0003 (E) kp /A−1 (76) 6.60 ± 0.04 (E)
6.76 ± 0.04 (T)
0.0320 ± 0.0001 (T)ΔλN/ A 0.0296 ± 0.0003 (E) σN/10−24 (76) 139.74 ± 1.81 (E)
cm2/electron 129.93 ± 0.81 (T)
0.0320 ± 0.0003 (T)
a Binding energy of 1s carbon and oxygen present in glycerin published in the paper (Krebs et al., 2007).
5.2.1. Graphite
Pressed graphite powder pellet of 3 mm thick and 30 mm diameter was used to study the scattering profileof PbL x-rays. Data were collected at a 125◦ scattering angle and the running time of the total spectrumwas about 20 h. The PbL x-ray [106, 107] spectrum scattered from graphite is shown in Figure 7(a). The
PbLα x-ray intensity of the Compton scattered photons was of the order of 1.5 × 10⁴ . However, graphitehas been widely studied by various researchers [1, 2, 7, 9, 108–111] because of its small atomic number, lowbinding energy, simplicity, nontoxicity, low-price, and readily availability. As in earlier wavelength-dispersive
100

MALLICK
scattered-profiles (PET and glycerin), incoherent scattering peak of higher energy as compared to the incident
PbLα line of energy 10.5005 keV (channel number 806) was also observed.
(a)
(b)
700 800 900 1000 1100 1200 1300102
103
104
CO
MP
(PbL
γ 1)
CO
MP
(PbL
β)
CO
MP
(PbL
α)
WLβ
17 WLβ
4
Si-E
SC (
PbL
α)
Si-E
SC (
PbL
γ 2)
Si-E
SC (
PbL
γ 1)
Si-E
SC (
PbL
β) PbL
n
PbL
γ 3,4
PbL
γ 2
PbL
γ 1
PbL
β
PbL
α
Channel (number)
Inte
nsity
(co
unts
)
750 775 800 825 850102
103
104
CO
MP
Si-E
SC (
PbL
β)
PbLα
r
NE
W
Inte
nsity
(co
unts
)
Channel (number)
Figure 7. (a) Full EDXRF spectra (accumulation of 20 h) obtained from graphite pellet using PbL x-rays scattering
at 125◦ , and (b) the enlarged part of the same spectra showing unmodified PbLβ line (r), Compton (COMP) and the
new-type incoherent scattering (NEW) line.
The energy shift of the Compton peak was calculated to be 325 eV with an average energy spread ofabout 13.03 eV per channel. The NRI of graphite (∈ = 12.15) was calculated and found out to be -0.977.Experimental energy shift in this process is found to be 300 eV, which is less than the energy absorbed inCompton process and is given in Table 3.
The intensity ratio of the modified (Compton) to unmodified peak, i.e.,Ic/Ir (=Rc) was found out to
be 1.501. The Compton peak-to-background ratio obtained was about 403:1. A very low-intensity peak (at
channel no. 829) of the new incoherent line followed by Si-ESC (PbLβ) was observed (incident PbLβ line of
energy 12.618 keV occurs at channel no. 988), as shown in Figure 7(b). The peak-to-background ratio of the
above line is about 39:1, with an accuracy corresponding to 9.5 ± 0.09 % of the height of the Compton peak.Again, the low- intensity PbLn line of energy 11.349 keV [107] was observed at channel number 870, just after
the Si-ESC (PbLβ) line. Intensity ratio Ia/Ir was found to be 0.057, which is quite less as compared to the
CoKα and CuKα x-rays because of the greater photon emitting capacity of the high-power seald-off tube. Thisis because of the fact that PbLα line is relatively more energetic then those x-rays. The peak is not an escapepeak of the silicon (detector), since the energy displacement of the SiKα escape peak from its incident x-ray
peak is generally reported to be 1.740–1.755 keV [112, 113]. Again, the intensity ratio of escape peak to total
peak is reported to be 4.4×10⁻³ [113]. The incoherently scattered photon energies �ω2 and �ω3 are found out
to be 10.283 keV and 10.753 keV, respectively. Both the profile functions q and q ′ were calculated and werefound out to be +0.858 a.u. and +0.692 a.u., respectively, which confirms that the energy exchange in the newprocess is lower as compared to the Compton process.
The small momentum transfer kp in this process is found out to be 9.73 ± 0.03 A−1 . This gives a
total scattering cross section σN of about (320.44 ± 1.15) ×10−24 cm2 /electron, which matches well with the
101

MALLICK
Table 3. Analysis of PbLα x-ray scattered profile from the graphite powder applying EDXRF spectrometry. Thefactors used for the conversion of wavelength (A) and energy (keV) is λ (A) = 12.372/E (keV).
Parameter Experimental Parameter Experimentalvalue value
γ 0.021 ∈ 12.152θ /◦ 125 n (6) ±0.977v/c 0.044 Zeff 6
λ /A 1.18075 ne /1022 e/ cm3 67.2�ω1/ keV 10.5005 Ep / eV 30.42
�ω2/ keV (24) 10.283 EbB/eV 284.2 (C1s),
�ω3/ keV (40) 10.753 Ia /Ir 0.057q / a.u (33) +0.858 Ic /Ir 1.501q′/ a.u (43) +0.692 Ia /Rc 298
Δ�ω/ eV (13) 325 ± 2.45 (E) kp/A−1 (76) 9.73 ± 0.03 (E)329 ± 0.88 (T) 9.76 ± 0.03 (T)
Δ�ω|N / eV a 300 ± 4.59 (E) σN/10−24 (76) 320.44 ± 1.15(E)328 ± 9.23 (T) cm2/electron 315.74 ± 1.15(T)
a Theoretically the amount of energy transferred to x-ray photon by excited electron can be given in the energy dispersive
relation Δ�ω|N = �ω3 − �ω1 =�
12.372λ−ΔλN
�− �ω1 , where ΔλN can be calculated using equation (9).
b The binding energy of carbon 1s [49].
theoretically calculated value ((315.74 ± 1.15) ×10−24 cm2 /electron). Since energy of the PbLα line is highas compared to CoKα1 line, one would expect low value of σN for PbLα line. However, higher value σN for
PbLα line scattered from graphite is because of its high electron density (1023 electron/cm3) and relativelyhigh dielectric constant as compared to PET solid.
5.2.2. Single crystals (NaCl, MgF2)
MoK radiation (secondary x-ray) based EDXRF system was used to analyze the single crystals and the pressedpowder. The same graphite sample, which was studied using PbL x-rays, was also used. The single crystal slicesof NaCl (100) and MgF2 (110), about 3 mm thickness and 30 mm diameter, were used. The full spectrum of
MoK radiation scattered at 90◦ from pressed-powder graphite pellet is shown in the Figure 8(a). In addition,
MoK x-rays scattered at 90◦ from both the single crystals. Since there is no x-ray line after the MoKβ (20
keV) radiations, so this line was selected for analysis of the scattered-profile for the entire sample and is shown
in Figure 8(b). The running time of the total spectrum of graphite was about 10 h, which produces intensity
of MoKα -Compton line is of the order of 105 scattered photons. However, the running time for the NaCl andMgF2 single crystals were about 8 h each. A very low-intensity peak was observed at channel no. 618, whichis about < 1 % of the height of the Compton peak. The lowest background of 610 counts was obtained atchannel no. 236. For the MoKβ1 x-rays, the Compton peak-to-background ratio is about 81:1. Intensity ratio
with respect to unmodified (MoKβ1) line, i.e., Ia/Ir was found to be very less, which is nearly 15 times less
then the PbLα line. This is because of the fact that MoKβ1 (19.608 keV) line is relatively more energetic than
the PbLα (10.5005 keV) line. Experimental energy shift Δ�ω in the Compton scattering was found out to be
102

MALLICK
724 eV with energy spread of about 32.85 eV per channel and for the new process, the shift Δ�ω|N is about
689 eV. Since energy of the incident-photon (MoKβ1) is greater than 15 keV, the relativistic effect comes into
picture. The width of the Compton profile wC is estimated to be less as compared to the profile wN of newincoherent peak. Hence, for high-energy incident photon, the width of the profile becomes large with decreasedintensity; therefore, the peak vanishes. This is another reason why this type of incoherent peak is not detectedby the researchers working on Compton scattering using high-energy x-ray photons. Similarly, more energetic(as compared to the incident MoKβ1 line) and very low-intensity scattered peak was also observed from the
NaCl (channel no. 618) and MgF2 (channel no. 620) single crystals. However, detailed Compton scattering
studies of NaCl [114, 115] and MgF2 [116, 117] have been reported elsewhere.
(a) (b)
250 300 350 400 450 500 550 600102
103
104
105
MoK
β1
COMP
MoK
β2
MoK
α
COMP
c
Inte
nsity
(co
unts
)
Channel (number)560 580 600 620
101
102
103
104
MoK
β4Ι
NaCl
MgF2
Graphite
NE
W
CO
MP
MoK
β2MoK
β1Inte
nsity
(co
unts
)
Channel (number)
Figure 8. (a) Full energy spectrum (accumulation of 10 h) of MoK X-radiation scattered from powder graphite (pellet)
at 90◦ using an EDXRF system, and (b) x-ray scattering spectra obtained from graphite (above), NaCl (100) and MgF2
(110) at 90◦ using MoKβ X-radiation showing Compton modified (COMP), unmodified (r) and new modified peak
(NEW) are represented.
From the above studies on interaction of radiation with target materials, it was observed that this newx-ray effect can be observed using photons of energy of the order of 10 keV. A theoretical plot of energy shiftΔ�ω|N with scattering angles by 10 keV photons is shown in Figure 9(a). The maximum energy shift Δ�ω|N at
highest scattering angle 180◦ is about 300 eV. Again, the intensity ratio of modified (Compton) to unmodified
peak, i.e.,Ic /Ir (=Rc) is inversely proportional to the electronic binding energy of the material. The intensity
ratio of new modified peak (at scattering angle around 90◦–110◦ ) with respect to Rc (selected to prevail over
the effect of intensity ratio due to electronic binding energy of different materials), i.e., Ia /Rc increases with
increase in NRI value, as shown in Figure 9(b). This confirms that the material having high NRI value possesses
more prominent peak. Again, the intensity ratio of new modified peak (in a carbon system) with respect to
unmodified peak, i.e.,Ia /Ir decreases with increase in photon energy, as shown in Figure 9(c). A theoretical
plot of differential scattering cross section(
dσdΩ
)N
for maximum scattering angle (180◦ ) from a graphite system
was plotted using x-ray photons of energy up to 100 keV, as shown in Figure 9(d). For 10 keV and 100
keV photon the theoretical cross section was calculated to be 2.187×10⁻²³ cm2 /sr and 2.187×10⁻²⁷ cm2 /srrespectively. On the other hand, comparison with Compton cross section, the new cross sections σN at 10 keV
103
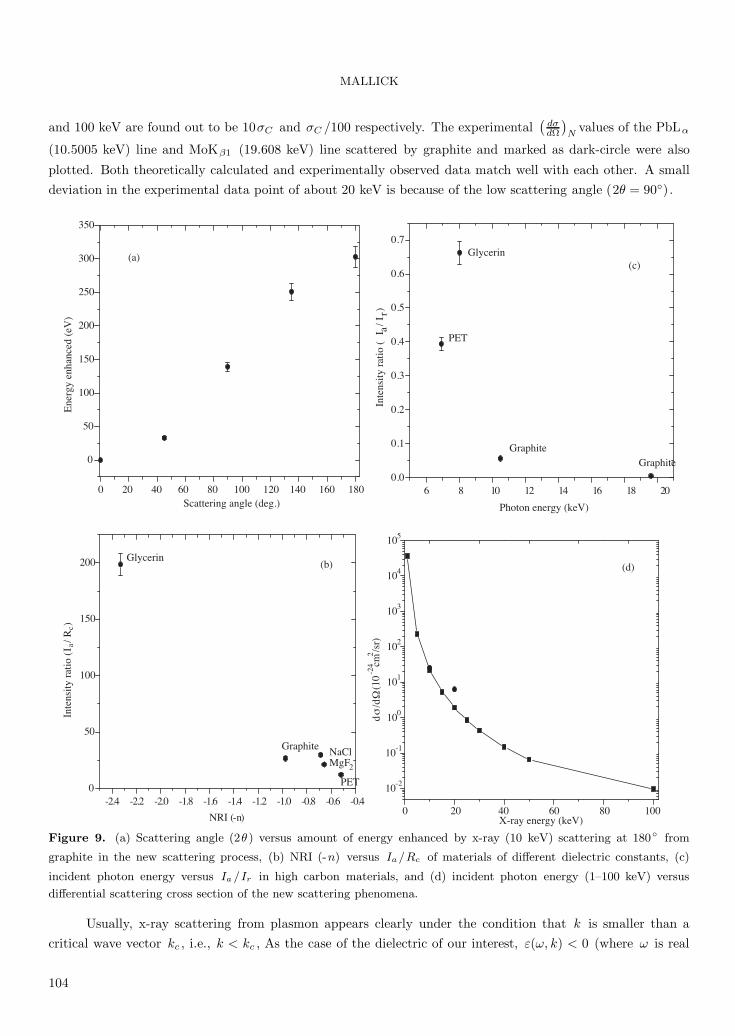
MALLICK
and 100 keV are found out to be 10σC and σC /100 respectively. The experimental(
dσdΩ
)N
values of the PbLα
(10.5005 keV) line and MoKβ1 (19.608 keV) line scattered by graphite and marked as dark-circle were also
plotted. Both theoretically calculated and experimentally observed data match well with each other. A smalldeviation in the experimental data point of about 20 keV is because of the low scattering angle (2θ = 90◦).
(a)(c)
(b) (d)
0 20 40 60 80 100 120 140 160 180
0
50
100
150
200
250
300
350
Ene
rgy
enha
nced
(eV
)
Scattering angle (deg.)
-2.4 -2.2 -2.0 -1.8 -1.6 -1.4 -1.2 -1.0 -0.8 -0.6 -0.40
50
100
150
200
NaClMgF2
PET
Graphite
Glycerin
Inte
nsity
rat
io (
I a/ R
c)
NRI (-n)
6 8 10 12 14 16 18 200.0
0.1
0.2
0.3
0.4
0.5
0.6
0.7
GraphiteGraphite
PET
Glycerin
Inte
nsity
rat
io (
I a/ I
r )
Photon energy (keV)
0 20 40 60 80 100
10-2
10-1
100
101
102
103
104
105
dσ
/dΩ
(10
-24 cm
2 /sr)
X-ray energy (keV)
Figure 9. (a) Scattering angle (2θ ) versus amount of energy enhanced by x-ray (10 keV) scattering at 180◦ from
graphite in the new scattering process, (b) NRI (-n) versus Ia/Rc of materials of different dielectric constants, (c)
incident photon energy versus Ia /Ir in high carbon materials, and (d) incident photon energy (1–100 keV) versus
differential scattering cross section of the new scattering phenomena.
Usually, x-ray scattering from plasmon appears clearly under the condition that k is smaller than acritical wave vector kc , i.e., k < kc , As the case of the dielectric of our interest, ε(ω, k) < 0 (where ω is real
104

MALLICK
and k is imaginary), the wave is damped with a characteristic length 1/ |kc| (plasmon cut-off vector). Higher
value of this traditional plasmon cut-off wave vector kc (= 0.47 × √rs kF ) has been reported in Srivastava
[118]. Indeed, x-ray scattering from plasmon with k > kc has been experimentally observed [58, 59, 119].This large value of the damping constant is because of quadratic dispersion of RPA Lindhard type dielectricconstant [120]. In addition, the plasmon dispersion curve bent over for larger values of k and showed little
dependence of ω and k . This region of little dispersion occurred for kvalues well beyond kc [119]. This is
why the dynamic dielectric function ε(ω, k) replaced in terms of static dielectric constant ∈ in equation (68).Hence, experimental observation of high value of kp , i.e., kp > kc , in the final expression for the scattering
cross section (76) is logical.
The relatively low-energetic x-rays used in this study limit the analysis of advance material systemslike quantum dots [121], superconductors [122], disordered alloys [123–127], ferromagnetic amorphous alloys
[128], and mixed crystals [129], as analyzed using the high-energy Compton scattering experiment. Also, theresearchers of our Institute have been reported a number of good works on Compton profile and electronmomentum density studies of many advance material systems for last three decades [114, 116, 129–133]. Hence,
at low photon energies the “impulse-approximation” approach [134], which requires the energy transfer in thescattering process to be large, compared to the EB involved, ceases to be valid for high-Z atoms. Again,the properties of electrons in solids can be better understood in the region of smaller energy and momentumtransfer, since x-ray Compton spectra are very sensitive to band structure near the Fermi level. Hence, the newx-ray effect may give better understanding about the solid-state physics of the material and it is expected thatthis new effect will give a new dimension to understand the electronic structure of materials in general usingthe Compton effect.
6. Conclusion
In the present paper, theoretically predicted and experimentally observed new modified x-ray peak havingthe following major features has been reported: (i) the new modified peak is slightly less wide than the Comptonpeak because the modified peak width decreases with increase in frequency and strongly depends on scatteringangle and amount of energy transfer; (ii) energy of the new modified peak is greater than that of Compton peak
for the same incident x-rays; (iii) energy shift in this collision process is less than the shift by Compton process;
and (iv) high value of total scattering cross section σN was obtained from materials of high dielectric constantand low binding energy on applying low-energy x-rays.
It has been reported that the Compton spectrometers have the best momentum resolution typicallyoperated at about 10 keV, which means that the energy transferred to the Compton electron is of the orderof 1 keV (i.e., the same order of magnitude as the binding energies of inner-shell electrons of light elements)
[135]. It is expected that, with the use of relatively less harder x-rays, high-intensity x-ray source (synchrotron),
x-ray detectors of excellent energy resolution [136, 137], position-sensitive detector [74, 108], imaging plate
[74], suitable scattering angles (considering the plasmon scattering at nc < ne) [84] and materials (possessing
low atomic number, high dielectric constant or metamaterials), it may be possible to get more prominent newmodified peak with better signal-to-noise ratio. The instrument required for this purpose should be sensitive(Compton effect) to the polarization of x-ray considering all the geometrical factors.
Where polarization sensitivity of the device is a measure of asymmetry parameter A , and is a function
105

MALLICK
of asymmetry ratio R (ratio of cross sections) and NR (ratio of coincidence counting rates) for high-energy
Compton scattering study [138–141]. However, asymmetry parameter of low energy x-ray is given elsewhere
[142, 143]. Therefore in the present WDXR instrument, the values of A are estimated as 0.037±0.002 (CoKα)
and 0.046±0.002 (CuKα), using the theory suitable for the asymmetry of Thomson scattering spectrum (since
Compton effect is less prominent in case of low energy x-ray) [143].
Similarly, for the EDXRF instruments, estimated values of A are 0.037±0.003 (PbLα) and 0.026±0.002
(MoKβ) respectively. Advanced spectrometers such as dispersion-compensating [144] scanning x-ray spectrom-
eter with high flux (in the order of 1011–1012 photons/second) [145, 146], Cauchois-type x-ray spectrometer
[147, 148], high resolution Compton spectrometer operated in the Rowland circular geometry [145] or better
x-ray spectrometer for inelastic scattering [75, 149] are the right choice to carry out the studies. The inverse
photoelectric effect (production of x-rays), the inverse Compton effect and the inverse Raman effect are theexperimental processes for the production of new radiation, whereas anti-Stokes scattering is due to materialmechanism, therefore the name of the new phenomenon may be proposed as anti-Compton scattering [43]. This
new x-ray scattering can be applied for calculation of excited volume plasmon energy of materials [11], electron
dynamics [150], or electron charge and spin density [151], valence-electron component of the atomic scattering
factor [152], usual incoherent and coherent differential scattering cross-sections [153] within the same line asCompton effect, as well as for characterizing electroactive polymers, i.e., polymers of high-dielectric constant[154] and organic liquids, and for designing x-ray laser.
Acknowledgements
Author would like to express deepest thanks to Prof. N. Shiotani, Tokyo University of Fisheries, Tokyo;Prof. A. Bansil, North Eastern University, Boston, USA; Prof. Nobuhiko Sakai, Himeji Institute of Technology,Japan; and Prof. H. C. Padhi, Retired Professor of Institute of Physics, Bhubaneswar, India, for their discussion,criticism and suggestion on experimental work over the last few years. In addition, the author is indebted toProf T. N. Tiwari, unique Research Centre, Rourkela, for reading and spending his valuable time to correct thecontents of manuscript. My special thanks go to Prof. T. Patel, Prof. R. C. Behera, and Prof. S. Panigrahi ofNIT, Rourkela, India for their help and encouragement.
Appendix A
The evaluation of the matrix element occurring in equation (55) requires multiplying E′ +(m0c
2 + k1
)with numerator and denominator of the 1st term of M , i.e., M1 . Using the wave equation,
E′ u′ =[(αip
′) + β m0c2]
u′ = H ′ u′ (A1)
where αi , β are usual Dirac Matrices and p′ is, of course, constant for the summation∑
:
|M1| =∑p′ (u∗α u′) (u′∗α0 u0)
(m0c
2 + k1 + E′)E′2 − (m0c2 + k1)
2 (A2)
|M1| =
[(m0c
2 + k1
) ∑(u∗α u′) (u′∗α0 u0) +
∑(u∗α H ′ u′) (u′∗α0 u0)
]E′2 − (m0c2 + k1)
2 (A3)
106
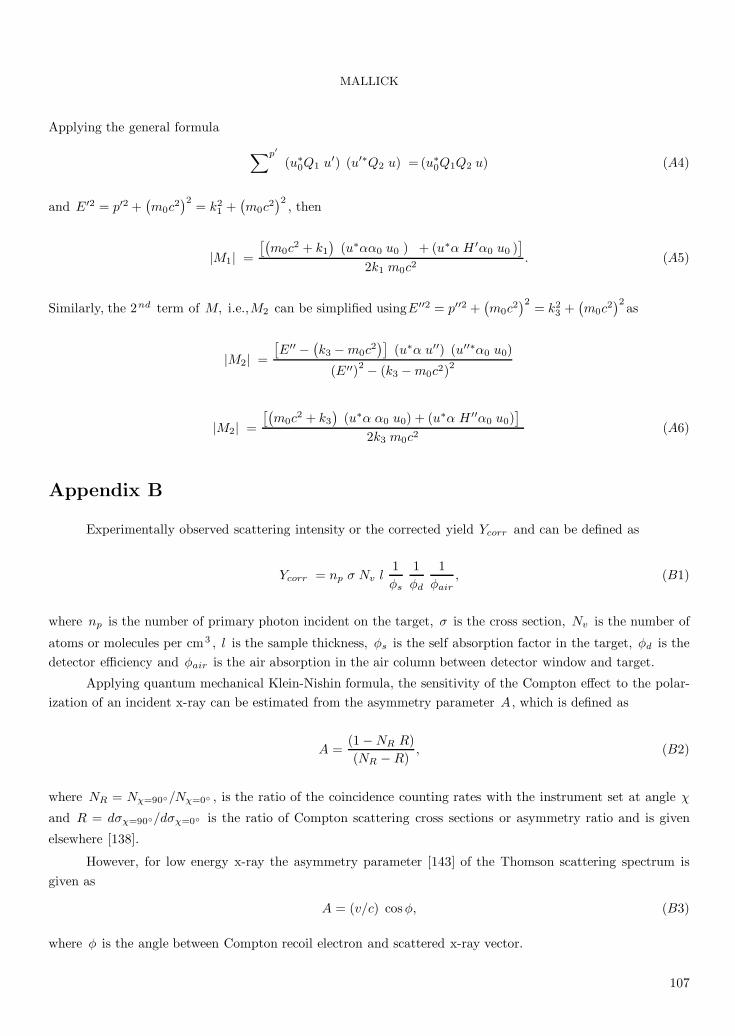
MALLICK
Applying the general formula
∑p′
(u∗0Q1 u′) (u′∗Q2 u) = (u∗
0Q1Q2 u) (A4)
and E′2 = p′2 +(m0c
2)2 = k2
1 +(m0c
2)2 , then
|M1| =
[(m0c
2 + k1
)(u∗αα0 u0 ) + (u∗α H ′α0 u0 )
]2k1 m0c2
. (A5)
Similarly, the 2nd term of M, i.e.,M2 can be simplified usingE′′2 = p′′2 +(m0c
2)2 = k2
3 +(m0c
2)2 as
|M2| =
[E′′ −
(k3 − m0c
2)]
(u∗α u′′) (u′′∗α0 u0)
(E′′)2 − (k3 − m0c2)2
|M2| =
[(m0c
2 + k3
)(u∗α α0 u0) + (u∗α H ′′α0 u0)
]2k3 m0c2
(A6)
Appendix B
Experimentally observed scattering intensity or the corrected yield Ycorr and can be defined as
Ycorr = np σ Nv l1φs
1φd
1φair
, (B1)
where np is the number of primary photon incident on the target, σ is the cross section, Nv is the number of
atoms or molecules per cm3 , l is the sample thickness, φs is the self absorption factor in the target, φd is thedetector efficiency and φair is the air absorption in the air column between detector window and target.
Applying quantum mechanical Klein-Nishin formula, the sensitivity of the Compton effect to the polar-ization of an incident x-ray can be estimated from the asymmetry parameter A , which is defined as
A =(1 − NR R)(NR − R)
, (B2)
where NR = Nχ=90◦/Nχ=0◦ , is the ratio of the coincidence counting rates with the instrument set at angle χ
and R = dσχ=90◦/dσχ=0◦ is the ratio of Compton scattering cross sections or asymmetry ratio and is given
elsewhere [138].
However, for low energy x-ray the asymmetry parameter [143] of the Thomson scattering spectrum isgiven as
A = (v/c) cosφ, (B3)
where φ is the angle between Compton recoil electron and scattered x-ray vector.
107

MALLICK
References
[1] A. H. Compton, Phy. Rev., 21, (1923), 409.
[2] L. V. Azaroff, R. Kaplow, N. Kato, R. J. Weiss, A. J. C. Wilson, and R. A. Young, X-ray Diffraction, ed. J. L.
Farnsworth and J. W. Bradley, (McGraw-Hill, USA, 1974), p.1.
[3] L. Mendelsohn and V. H. Smith, Compton Scattering, ed. B. Williams (McGraw-Hill, Inc., Great Britain, 1977),
p.102.
[4] C. V. Raman, Nature (London), 120, (1927), 950.
[5] C. V. Raman, Indian J. Phys., 3, (1928), 357.
[6] C.V. Raman and C. M. Sogani, Proc. R. Soc. (London), A119, (1928), 526.
[7] S. Manninen, V. Honkimaki and P. Suortti, J. Appl. Cryst., 25, (1992), 268.
[8] R. J. Weiss and G. Mazzone, J. Appl. Cryst., 14, (1981), 401.
[9] K. Das Gupta, Phy. Rev. Lett., 3, (1959), 38.
[10] K. Das Gupta, Phy. Rev., 128, (1962), 2181.
[11] G. Priftis, Phys. Rev., B2, (1970), 54.
[12] K. Das Gupta, Phy. Rev. Lett., 13, (1964), 338.
[13] E. E. Salpeter, Phys. Rev., 120, (1960), 1528.
[14] D. F. Dubois and V. Gilinsky, Phys. Rev., 133, (1964), A1308.
[15] D. F. Dubois and V. Gilinsky, Phys. Rev., 133, (1964), A1317.
[16] D. F. Dubois and V. Gilinsky, Phys. Rev., 135, (1964), A1519.
[17] P. M. Platzman, Phys. Rev., 139, (1965), A379.
[18] P. M. Platzman and N. Tzoar, Phys. Rev., 139, (1965), A410.
[19] P. Platzman and N. Tzoar, Compton Scattering , ed. B. Williams, (McGraw-Hill, Inc., Great Britain, 1977) p. 28.
[20] M. Jain and N. Tzoar, Phys. Rev., A 18, (1978), 538.
[21] G. R. Blumentha and R. J. Gould, Rev. Mod. Phy., 42, (1970), 237.
[22] G. B. Rybicki and A. P. Lightman, Radiative Process in Astrophysics, (Wiley, John & Sons, New York, 1985) p.
195.
[23] P. A. M. Gulchon and M. Vanderhaegben, Prog. Part. Nucl. Phys., 41, (1998), 125.
[24] N. Sakai, J. Appl. Cryst., 29, (1996), 81.
[25] W. Heitler, Quantum Theory of Radiation ,ed. N. F. Mott, E. C. Bullard and D. H. Wilkinson, (The University
Press. Oxford, 1960) p.110 & 211.
108

MALLICK
[26] P. M. Platzman, Phys. Rev., B 40, (1989), 5883.
[27] N. Seddon and T. Bearpark, Science, 302, (2003), 1537.
[28] B. G. Williams, M. P. Parkison, C. J. Eckhardt and J. M. Thomas, Chem. Phys. Lett., 78, (1981), 434.
[29] B. G. Williams, T. G. Sparrow and R. F. Egerton, Proc. R. Soc. Lond., A393, (1984), 409.
[30] P. Schattschneider and A. Exner, Ultramicroscopy, 59, (1995), 241.
[31] B. G. Williams, M. K. Uppal and R. D. Brydson, Proc. R. Soc. Lond., A409, (1986), 161.
[32] D. S. Su, P. Schattschneider and E. Zeitler, Phys. Rev., B49, (1993), 8552.
[33] G. A. Sokol, The Nucleon Compton Effect at Low and Medium Energies, ed. D. V. Skobel’tsyn (Translated from
Russian), Vol. 41 (Consultants Bureau . New York, 1969).
[34] P. A. M. Guichon, G. Q. Liu and A. W. Thomas, Nucl. Phys., A595, (1995), 606.
[35] S. Capstick and B. D. Keister, Phys. Rev., D47, (1993), 860.
[36] G. I. Watson, J. Phys.: Condens. Matter., 8, (1996), 5955.
[37] P. Zetterstrom, A. K. Soper and P. Schofield, Physica, B234-236, (1997), 337.
[38] H. D. Middendorf, U. N. Wanderlingh, R. L. Hayward and F. Albergamo, Physica, A 304, (2002), 266.
[39] B. J. Gabrys, W. Jajac, J. Mayers and M. S. Kalhoro, Appl. Phys., A74, (2002), S1645.
[40] C. A. Chatzidimitriou-Dreismann, M. Vos, C. Kleiner and T. Abdul-Redah, Phys. Rev. Lett., 91, (2003), 057403-1.
[41] Z.G. Pinsker, Dynamic Scattering of X-rays in Crystals, (Springer-Verlag, New York, 1981) p. 85.
[42] N. Shiotani, Personal communication (2001).
[43] B. Mallick, Proc. of the 87 th Ind. Sc. Cong. Young Scientist Award Abstract, Vol. III, (ISCA, Pune, India, 2000)
p. 53.
[44] B. Mallick, Proc. of the 87 th Ind. Sc. Cong. Young Scientist Award Abstract, Vol. III, (ISCA, Delhi, India, 2001)
p. 63.
[45] B. Mallick, Proc. SPIE Smart Structure and Materials , ed. Y. Bar-Cohen, Vol. 4329 (SPIE, California, 2001) p.
311.
[46] A. H. Compton and S. K. Allison, X-ray in Theory and Experiment, (D Van Nostrand Company, Inc; New York
1960).
[47] V. G. Veselago, Soviet Phys. USPEKHI, 10, (1968), 509.
[48] A. C. Melissions, Experiments in Modern Physics, (Academic press, New York, 1973) p. 264.
[49] A.C. Thompson, D. Attwood, E. Gullikson, M. Howells, K.J. Kim, J. Kirz, J. Kortright, I. Lindau, P. Pianetta,
A. Robinson, J. Scofield, J. Underwood, D. Vaughan, G. Williams and H. Winick, X-ray Data Booklet, ed. A.C.
Thompson and D. Vaughan, (Lawrence Berkeley National Laboratory, University of California, Berkeley 2001) p.
5.21.
109

MALLICK
[50] C. Kittel, Introduction to Solid State Physics, (Wily Eastern Ltd., New Delhi, 1994) p. 289.
[51] J. Nilsen, W. R. Johnson, C. A. Jglesias and J. H. Scofield, UCRL-JRNL- 208675, (Lawrence Livermore National
Laboratory, Berkeley 2004).
[52] G. E. M. Jauncey, Phys. Rev., 25, (1925), 314.
[53] G. E. M. Jauncey, Phys. Rev., 25, (1925), 723.
[54] J. W. M. DuMond, Phys. Rev., 33, (1929), 643.
[55] J. W. M. DuMond, Rev. Mod. Phys., 5, (1933), 1.
[56] E. H. Wichman, Quantum Mechanics, Berkeley Physics Course, Vol. 4, (The McGraw-Hill Companies Ltd., New
Delhi, 2008) p.102.
[57] G. N. Fowler , Quantum theory, III Radiation and High Energy Physics, ed. D.R.Bates, (Academic Press, New
York, 1962) p. 65.
[58] Y. Ohmura and N. Matsudaira, J. Phys. Soc. of Japan, 19, (1964), 1355.
[59] N. G. Alexandeopoulos, J. Phys. Soc. of Japan, 31, (1971), 1790.
[60] L.Von Hove, Phys. Rev., 95, (1954), 249.
[61] D. E. Parks and M. Rotenberg, Phys. Rev., A5, (1972), 521.
[62] D. Pines, The Many-Body Problem, (Benjamin publications, New York, 1972).
[63] G. D. Mahan, Many-Particle Physics, (Kluwer Academic/ Plenum Publishers, New York, 2000).
[64] A. J. Glick, Lectures on the Many-Body Problem, ed. E. R. Caianiello, (Academic Press, New York, 1962).
[65] J. K. Laukkanen, PhD thesis, Helsinki University, Helsinki, Finland, 2000.
[66] E. Burkel, J. Phys.: Condens. Matter, 13, (2001), 7477.
[67] P. M. Bergstrom and R. H. Pratt, Radiat. Phys. Chem., 50, (1997), 3.
[68] Y. H. Woo, Phys. Rev., 25, (1925), 444.
[69] T. Paakkari and P. Suortti, Phys. Rev., B9, (1974), 1756.
[70] E. P. Bertin, Principle and Practice of X-ray Spectrometric Analysis, (Plenum press, New York, 1975).
[71] R. Tertian and F. Claisse, Principle of Quantative X-ray Fluorescence Analysis, (Heyden & Son Ltd; London, 1982)
p. 336.
[72] Z. W. Chen, W. M. Gibson and H. Huang, X-ray Optics & Instrum. doi: 10.1155/2008/318171, (2008).
[73] W. R. McIntire, Phys. Rev., B14, (1976), 4386.
[74] N. Shiotani, N. Sakai, F. Itoh, M. Sakurai, H. Kawata, Y. Amemiya and M. Ando, Nucl. Instrum. Methods., A275,
(1989), 447.
110

MALLICK
[75] P. Pattison, P. Suorti and W. Weyrich, J. Appl. Cryst., 19, (1986), 353.
[76] E. Straube, D. Hohlwein and Th. Zeiske, J. Appl. Cryst., 31, (1998), 169.
[77] B. D. Cullity, Elements of X-ray Diffraction, (Addition-Weseley Publishing Company, Inc. London, 1978).
[78] Pro-Fit software, Philips Analytical X-ray, Netherlands (1999).
[79] P. Pattion and J. R. Schneider, Nucl. Instrum. Methods., 158, (1979), 145.
[80] G. F. Knoll, Radiation Detection and Measurements, (John Wiley & Sons, New York, 1989).
[81] AXIL, X-ray analysis software, International Atomic Energy Agency, Austria (1993).
[82] R. D. Evans, The Atomic Nucleus, (McGraw-Hill Book Company, London, 1955).
[83] P. Holm, Phys. Rev., A37, (1988), 3706.
[84] T. Suzuki and A. Tanokura, J. Phys. Soc. of Japan, 29, (1970), 972.
[85] D. M. Miliotis, Phys. Rev., B3, (1971), 701.
[86] S. L. McCall and P. M. Platzman, Phys. Rev., B22, (1980), 1660.
[87] G. G. Cohen, N. G. Alexandropoulos and M. Kuriyama, Phys. Rev., B8, (1973), 5427.
[88] W. Weyrich, P. Pattison and B. G. Williams, Chem. Phys., 41, (1979), 271.
[89] D. L. Anastassopoulos, G. D. Priftis, C. Toprakcioglu and A. A. Vradis, Phys. Rev. Lett., 81, (1998), 830.
[90] E. P. Mazarakiotis, D. L. Anastassopoulos, A. A. Vradis, G. D. Priftis, Ch. Bellin and G. Loupias, Physica, B318,
(2002), 382.
[91] M. Abdelrahman and N. Kamel, Jpn. J. Appl. Phys., 37, (1998), 4563.
[92] R. Jenkins and J. L. de Vries, Worked Examples in X-ray Analysis, (The Macmillan Press Ltd; London, 1978).
[93] K. Ueno, Y. Matsumoto, N. Nishimiya, M. Noshiro and M. Satou, Nucl. Instrum. Methods, B59/60, (1991), 1263.
[94] R. C. Murty, Nature, 207, (1965), 398.
[95] N. Saha, N. L. Singh, C. F. Desai and K. P. Singh, Radiat. Meas., 36, (2003), 699.
[96] N. L. Singh, N. Shah, K. P. Singh and C. F. Desai, Radiat. Meas., 40, (2005), 741.
[97] B. Mallick, T. N. Tiwari, S. Panigrahi and R. C. Behera, Meas. Sci. Technol., 17, (2006), 3289.
[98] P. Eisenberger, Phys. Rev., A2, (1970), 1678.
[99] P. Eisenberger, Phys. Rev., A5, (1972), 628.
[100] U. Bonse, W. Schroder and W. Schulke, J. Appl. Cryst., 12, (1979), 432.
[101] K. Nygard, M. Hakala, S. Manninen, A. Andrejczuk, M. Itou, Y. Sakurai, L. G. M. Pettersson and K. Hamalainen,
Phys. Rev., 74, (2006), 031503-1.
111

MALLICK
[102] K. Nygard, PhD Thesis, University of Helsinki, Helsinki, Finland 2007.
[103] T. Abdul-Redah, M. Krzystyniak and C. A. Chatzidimitriou-Dreismann, Phys. Rev., B72, (2005), 052202-1.
[104] A. Shukla, B. Barbiellini, T. Buslaps and P. Suortti, Zeitschrift fur Physikalische Chemie, 215, (2001), 1315.
[105] 5T. Krebs, G. Andersson and H. Morgner, Chem. Phys., 340, (2007), 181.
[106] H. Yamaoka, M. Oura, K. Takahiro, N. Takeshima, K. Kawatsura, M. Mizumaki, U. Kleiman, N. M. Kabachnik
and T. Mukoyama, Phys. Rev., A65, (2002), 062713-1.
[107] California Institute of Technology, X-ray.dat; http://www.pma.caltech.edu/∼dons/ph3-7/xray.dat (1997).
[108] P. Pattison, H-J. Bleif and J. R. Schneider, J. Phys. E. Sci. Instrum. (Great Britain), 14, (1981), 95.
[109] G. D. Priftis and J. Boviatsis, Phys. Lett., A85, (1981), 115.
[110] S. Vasudevan, T. Rayment, B. G. Williams and R. Holt, Proc. R. Soc. Lond., A391, (1984), 109.
[111] F. F. Kurp, Th. Tschentscher, H. Schulte-Schrepping, J. R. Schneider and F. Bell, Europhys. Lett., 35, (1996), 61.
[112] G. Kalinka, Nucl. Instrum. Methods, B88, (1994), 470.
[113] T. Papp and J. L. Campbell, X-ray Spectrom., 30, (2001), 77.
[114] G. Das and H. C. Padhi, Philos. Mag., B54, (1986), 415.
[115] R. Vijayakumar, Shivaramu, L. Rajasekaran, N. Ramamurthy, and M. J. Ford, Nucl. Instrum. Methods, B234,
(2005), 185.
[116] G. Das and H. C. Padhi, Phys. Lett., A128, (1988), 383.
[117] H. Lan, J. Yang and K. Wang, Phys. Lett., A144, (1990), 419.
[118] K. S. Srivastava, Solid State Commun., 30, (1979), 19.
[119] K. L. Kliewer and H. Raether, Phys. Rev. Lett., 30, (1973), 971.
[120] H. J. Hohberger, A. Otto and E. Petri, Solid State Commun., 16, (1975), 175.
[121] R., Saniz, B. Barbiellini and A. Denison, Phys. Rev., B65, (2002), 245310-1.
[122] W. Schulke, IUCr Newsletter, 1, (1993), 6.
[123] A. Bansil, R. S. Rao, P. E. Mijnarends and L. Schwartz, Phys. Rev., B23, (1981), 3608.
[124] A. Bansil and S. Kaprzyk, Phys. Rev., B57, (1991), 314.
[125] A. Bansil, S. Kaprzyk, A. Andrejczuk, L. Dobrzyski, J. Kwiatkowska, F. Maniawski and E. ukowski, Phys. Rev.,
B57, (1998), 314.
[126] D. Pal and H. C. Padhi, Phys. Status Solidi., B175, (2006), 507.
[127] B. K. Shrma, V. Purvia, B. L. Ahuja, M. Sharma, P. Chaddah, S. B. Roy, Y. Kakutani, A. Koizumi, T. Nagao,
A. Omura, T. Kawai and N. Sakai, Phys. Rev., B72, (2005), 132405-1.
112

MALLICK
[128] J. W. Taylor, J. A. Duffy, A. M. Bebb, M. J. Copper, S. B. Dugdale, J. E. McCarty, D. N. Timms, D. Greig and
Y. B. Xu, Phys. Rev., B63, (2001), 220404-1.
[129] D. P. Mahapatra and H. C. Padhi, Solid State Commun., 42, (1982), 525.
[130] D. P. Mahapatra and H. C. Padhi, J. Phys. Soc. Jpn., 42, (1982), 525.
[131] B. K. Panda, Phys. Rev., B49, (1994), 2521.
[132] B. K. Panda, D. Pal, D. P. Mahapatra, and H. C. Padhi, Positron Annihilation and Compton Scattering, ed. B.
K. Sharma, P. C. Jain and R. M. Singru, (Omega Scientific Publishers, New Delhi, 1990) p. 297.
[133] D. Pal, PhD Thesis, Utkal University, Bhubaneswar, India, 1991.
[134] R. Currat, P. D. DeCicco and R. J. Weiss, Phys. Rev., B4, (1971), 4256.
[135] S. Huotari, K. Hamalainen, S. Manninen, S. Kaprzyk, A. Bansil, T. Buslaps, V. Honkimaki and P. Suortti, Phys.
Rev., B62, (2000), 7956.
[136] Princeton Gamma-Tech (PGT) Instruments Inc; X-ray Detectors, http://www.pgt.com/prods.html (2000).
[137] S. Barkan, V. D. Saveliev, P. Pianetta, S. Brennan, C. R. Tull, L. Feng, M. Takahashi, D. Burnett and H. Ishii,
(VORTEX), Proc. European Conference on X-ray Spectrometry, http://www.siintusa.com/pdf/EXRS2008.pdf
(2008).
[138] H. Schopper, Nucl. Instrum., 3, (1958), 158.
[139] L. W. Fagg and S. S. Hanna, Rev. Mod. Phys., 31 (1959), 711.
[140] P. Taras and J. Matas, Nucl. Instrum. Methods., 82 (1970), 173.
[141] G. E. Owen and Y. K. Lee, Nucl. Instrum. Methods., 61 (1968), 317.
[142] C. Visnovesky, S. Limandri, M. E. Canafoglia, R. Bonetto and J. Trincavelli, Spectrochem. Acta., B62, (2007), 492.
[143] Th. Wrubel, S. Glenzer, S. Buscher and H. –J. Kunze, J. Atmos. Terre. Phys., 58, (1996), 1077.
[144] P. Suortti, T. Buslaps, M. DiMichiel, V. Honkimaki, M. Kretzschmer, U. Lienert, J. E. McCarthy, J. M. Merino
and A. Shukla, Nucl. Instrum. Methods., A467-468, (2001), 1541.
[145] K. Hamalainen, S. Manninen, C. –C. Kao, W. Caliebe, J. B. Hastings, A. Bansil, S. Kaprzyk and P. M. Platzman,
Phys. Rev., B54, (2000), 5453
[146] P. Suortti, T. Buslaps, P. Fajardo, V. Honkimaki, M. Kretzschmer, U. Lienert, J. E. McCarthy, M. Renier, A.
Shukla, T. Tschentscher and T. Meinander, J. Synchrotron Rad., 6, (1999), 69.
[147] M. Itou, N. Hiraoka, T. Ohata, M. Mizumaki, A. Deb, Y. Sakurai and N. Sakai, Nucl. Instrum. Methods., A467-
468, (2001), 1109.
[148] Y. Sakurai and M. Itou, J. Phys. Chem. Solids, 65, (2004), 2061.
[149] P. Suortti, P. Pattison and W. Weyrich, J. Appl. Cryst., 19, (1986), 336, 343.
113

MALLICK
[150] W. Schulke, Electron dynamics by inelastic X-ray scattering, (Oxford University press, Oxford, UK, 2007).
[151] M. Cooper, P. E. Mijnarends, N. Shiotani, N. Sakai and A. Bansil, X-ray Compton scattering, (Oxford university
press, Oxford, UK, 2007).
[152] V. A. Bushuev, A. Yu. Kazimirov and M. V. Koval’chuk, JETP Lett., 47, (1988), 187.
[153] Y. Kurucu, S. Erzeneglu, R. Durak and Y. Sahin, Turk. J. Phys., 22, (1998), 783.
[154] H. Cheng and Q. Zhang, Proc. Smart Structures and Materials 2004: Electroactive Polymer Actuators and Devices
(EAPAD), ed. Y. Bar-Cohen, Vol. 5385 (SPIE, US, 2004) p. 87.
114