a quantitative model of the oil tanker market in the
TRANSCRIPT

0
A Quantitative Model of the Oil Tanker Market in the Arabian Gulf
Lutz Kilian Nikos Nomikos
Federal Reserve Bank of Dallas Cass Business School CEPR
Xiaoqing Zhou Federal Reserve Bank of Dallas
March 24, 2020. This version: September 4, 2020 Abstract: Using a novel dataset, we develop a structural model of the Very Large Crude Carrier (VLCC) market between the Arabian Gulf and the Far East. We study how fluctuations in oil tanker rates, oil exports, shipowner profits, and bunker fuel prices are determined by shocks to the supply and demand for oil tankers, to the utilization of tankers, and to the cost of operating tankers, including bunker fuel costs. Our analysis shows that time charter rates are largely unresponsive to tanker cost shocks. In response to higher costs, voyage profits decline, as cost shocks are only partially passed on to round-trip voyage rates. Oil exports from the Arabian Gulf also decline, reflecting lower demand for VLCCs. Positive utilization shocks are associated with higher profits, a slight increase in time charter rates and lower fuel prices and oil export volumes. Tanker supply and tanker demand shocks have persistent effects on time charter rates, round-trip voyage rates, the volume of oil exports, fuel prices, and profits with the expected sign. JEL code: Q43, R41.
Key words: Shipping, VLCC, crude oil, bunker fuel, tanker, voyage, time charter, profits, exports, passthrough.
Acknowledgments: The views in this paper are solely the responsibility of the authors and should not be interpreted as reflecting the views of Federal Reserve Bank of Dallas or the Federal Reserve System. The authors have no conflict of interest to disclose. Correspondence to: Lutz Kilian, Federal Reserve Bank of Dallas, Research Department, 2200 N. Pearl St., Dallas, TX 75201, USA. E-mail: [email protected]. Nikos Nomikos, Cass Business School, 106 Bunhill Row, London EC1Y 8TZ, UK. Email: [email protected]. Xiaoqing Zhou, Federal Reserve Bank of Dallas, Research Department, 2200 N. Pearl St., Dallas, TX 75201, USA. Email: [email protected].

1
1. Introduction
There has been increasing interest in recent years in understanding the market for the
shipping vessels used in transporting bulk industrial commodities.1 Much of this literature has
focused on dry-bulk cargo trade, while some studies have specifically focused on modeling
the market for oil tankers. It is widely understood that the demand for vessels responds to
shifts in the demand and supply of the industrial commodities awaiting transportation. There
is also a growing recognition of the importance of accounting for shocks to the cost of
shipping (including, most importantly, the cost of the bunker fuel used to operate vessels),
shocks to the utilization of the fleet of vessels, and shocks to the fleet size, with new cargo
vessels being added in response to higher demand and older cargo vessels being scrapped, as
demand subsides.
Most studies in this literature have examined the theoretical foundations of the
shipbuilding and scrapping cycle, the determination of ship charter rates, and the
determinants of shipowners’ profits. The remainder of this literature has documented lead-lag
patterns and correlations of key variables in shipping markets.2 None of these studies,
however, addresses the question of how key variables in this market such as tanker rates, oil
exports, bunker fuel prices, and the cyclical component of shipowner profits are determined
by shocks to the supply of and demand for oil tankers, tanker cost shocks and shocks to the
utilization of the fleet of tankers.
Our paper develops a structural model of the Very Large Crude Carrier (VLCC)
tanker market between the Arabian Gulf and the Far East.3 About one third of the global trade
1 Examples include Glen and Martin (2005), Stopford (2009), Kalouptsidi (2014), Parker (2014), Greenwood and Hanson (2015), Kilian and Zhou (2018), Brancaccio, Kalouptsidi and Papageorgiou (2020), and Brancaccio, Kalouptsidi, Papageorgiou and Rosaia (2020). For a recent review of this literature see Alexandridis, Kavussanos, Kim, Tsouknidis and Visvikis (2018). 2 For example, Nomikos and Regli (2019) document the predictive correlations between oil tanker rates, bunker fuel prices, and the availability of oil tankers in the Arabian Gulf measured by high-frequency satellite data. 3 The body of water called the “Arabian Gulf” in this paper, consistent with conventions in the shipping industry, is more commonly referred to as the “Persian Gulf” in other contexts.

2
in crude oil takes place in this region and 70% of this oil is shipped on VLCCs. We use two
alternative specifications of a structural vector autoregressive model to quantify the causal
effects of shocks to the cost of operating a tanker, the utilization of tankers, tanker supply and
tanker demand on the volume of oil exports from the Arabian Gulf, bunker fuel prices, one-
year VLCC time charter rates, round-trip VLCC voyage rates from the Arabian Gulf to East
Asia, and the profits of the owners of VLCCs chartered for round-trip voyages on this route.
We show that a positive tanker cost shock has a negligible effect on the real time
charter rate, but higher voyage costs are associated with a decline in the demand for time
charters because charterers’ profits are reduced by higher operating costs. This helps explain
the decline in the overall volume of oil exports from the Arabian Gulf. The magnitude of this
response is small, consistent with the view that the demand for shipping is fairly inelastic
with respect to changes in freight costs (see Stopford 2009). Moreover, real voyage profits
decline in response to positive cost shocks, suggesting that cost shocks are only partially
passed on to round-trip voyage rates. This finding is consistent with the fact that real
roundtrip rates increase in response to positive cost shocks only with a delay. Positive
utilization shocks are associated with higher profits, an increase in time charter rates and
lower fuel prices and oil export volumes. Tanker supply and tanker demand shocks have
persistent effects on time charter rates as well as on the volume of oil exports and the bunker
fuel price with the expected sign. Lower tanker supply and higher tanker demand are
reflected in persistently higher voyage profits for vessel owners as well as higher round-trip
voyage rates.
Whereas the variability of the real voyage profits of ship owners and round-trip
voyage rates depends mainly on utilization shocks and tanker demand shocks, that of time-
charter rates depends first and foremost on tanker demand and supply shocks. The variability
of bunker fuel prices mainly depends on tanker demand and supply shocks, followed by

3
tanker cost shocks, with utilization shocks playing only a small role. The main determinants
of the variability of the volume of oil exports are tanker demand, tanker cost, and utilization
shocks.
Our analysis also allows us to quantify the extent to which the historical evolution of
oil exports, bunker fuel prices, time charter rates, round-trip voyage rates and shipowner
profits is explained by each of the structural shocks. The results are reasonably robust across
model specifications. We find that, until 2008, the volume of oil exports from the Arabian
Gulf was largely determined by tanker demand shocks, consistent with conventional wisdom.
Since then cost shocks have been the main determinant. Interestingly, there is robust evidence
of a tanker-demand driven spike in oil export volumes (as well as in both tanker rates)
associated with the temporary détente in U.S. trade policy in 2018/19, confirming that trade
disputes have real effects on industrial commodity markets.
Cost shocks have only minor effects on the evolution of real time charter rates. The
demand-driven cycle in time charter rates largely mirrors that found in oil export volumes
and voyage profits. Between 2010 and 2015 (and again between 2016 and 2019), there is
evidence of a trough in real time charter rates caused by the cumulative effects of tanker
supply shocks, consistent with the delivery of many newly built vessels during this period.
Finally, the results for the real round-trip voyage rate from the Arabian Gulf to East Asia and
for the real vessel owners’ profits from these round-trip voyages are qualitatively similar. The
historical evolution of these variables is more sensitive to utilization and tanker demand
shocks than tanker supply or cost shocks.
The remainder of the paper is organized as follows. In section 2, we review the
institutional details of the tanker market and the construction of the data. Section 3 describes
the structural model and the econometric methodology. Section 4 discusses the impulse
responses and variance decompositions for real time charter rates, oil export volumes and real

4
profits in the baseline model. Section 5 presents an alternative model specification that allows
us to assess the determination of real round-trip voyage rates and discusses the corresponding
empirical results. In section 6, we draw on both models to examine the historical evolution of
the model variables. The concluding remarks are in section 7.
2. Institutional Background
Our analysis focuses on the market for Very Large Crude Carriers (VLCCs) which refers to
oil tankers with a capacity of between 200,000 and 325,000 dwt. These vessels are the
backbone of long-distance oil shipping from the Arabian Gulf to East Asia.4 This industry is
competitive with the largest company owning only 6.3% of the VLCC fleet. By construction,
oil tankers can only be used to transport crude oil, so the market for oil tankers can be viewed
in isolation from the market for other vessels.
VLCCs may be chartered for transporting crude oil by entering into a voyage charter
contract or a time charter contract. A voyage charter involves a payment to the ship owner for
a voyage from one port to another port. The shipowner is responsible for all voyage costs,
including fuel costs, cargo loading and discharge costs, port charges, as well as the costs
associated with the up-keep and maintenance of the vessel such as maintenance fees,
insurance premia and crew wages. Voyage charter spot rates are available for the most
commonly used routes. These quotes serve as a reference price for transactions.
Short-term voyage contracts account for the bulk of crude oil cargoes due to their
flexibility and convenience. Voyage contracts can be executed on short notice and rates
reflect the all-inclusive cost of seaborne transportation. These contracts are also amenable to
the practices of physical crude oil trading, as cargoes of crude oil are traded whilst in transit
and the final ownership and/or final destination of the cargo may change many times during a
4 As of April 2020, there were 815 VLCCs in operation, accounting for 40% of the total cargo carrying capacity of the global oil tanker fleet. They are exceeded in size only by ULCCs (Ultra Large Crude Carriers). There are currently only two ULCCs in service, however, allowing us to focus on the VLCC market.
5
voyage.
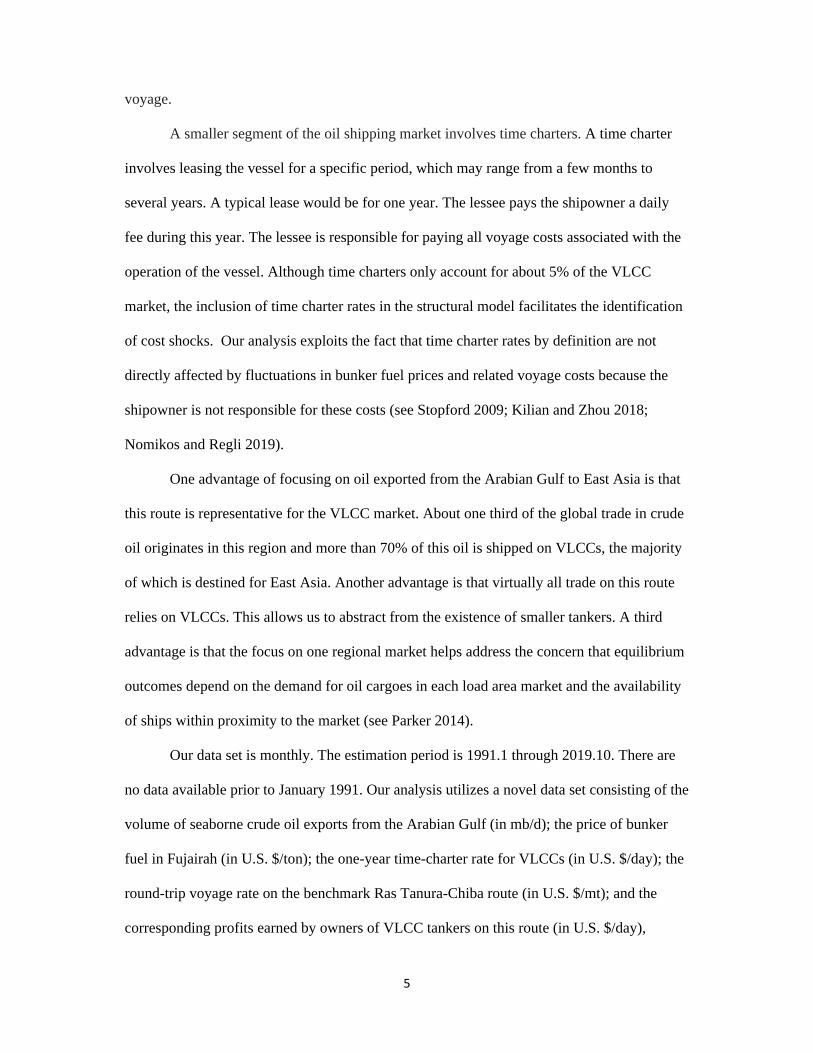
A smaller segment of the oil shipping market involves time charters. A time charter
involves leasing the vessel for a specific period, which may range from a few months to
several years. A typical lease would be for one year. The lessee pays the shipowner a daily
fee during this year. The lessee is responsible for paying all voyage costs associated with the
operation of the vessel. Although time charters only account for about 5% of the VLCC
market, the inclusion of time charter rates in the structural model facilitates the identification
of cost shocks. Our analysis exploits the fact that time charter rates by definition are not
directly affected by fluctuations in bunker fuel prices and related voyage costs because the
shipowner is not responsible for these costs (see Stopford 2009; Kilian and Zhou 2018;
Nomikos and Regli 2019).
One advantage of focusing on oil exported from the Arabian Gulf to East Asia is that
this route is representative for the VLCC market. About one third of the global trade in crude
oil originates in this region and more than 70% of this oil is shipped on VLCCs, the majority
of which is destined for East Asia. Another advantage is that virtually all trade on this route
relies on VLCCs. This allows us to abstract from the existence of smaller tankers. A third
advantage is that the focus on one regional market helps address the concern that equilibrium
outcomes depend on the demand for oil cargoes in each load area market and the availability
of ships within proximity to the market (see Parker 2014).
Our data set is monthly. The estimation period is 1991.1 through 2019.10. There are
no data available prior to January 1991. Our analysis utilizes a novel data set consisting of the
volume of seaborne crude oil exports from the Arabian Gulf (in mb/d); the price of bunker
fuel in Fujairah (in U.S. $/ton); the one-year time-charter rate for VLCCs (in U.S. $/day); the
round-trip voyage rate on the benchmark Ras Tanura-Chiba route (in U.S. $/mt); and the
corresponding profits earned by owners of VLCC tankers on this route (in U.S. $/day),

6
defined as earnings net of bunker fuel and other cargo-related costs. Details of the
construction of the data can be found in the appendix. The nominal data have been deflated
by the U.S. CPI for all urban consumers to control for dollar inflation.
3. The Baseline Structural Model of the VLCC Oil Tanker Market in the Arabian Gulf
In this section we introduce a structural VAR model of the VLCC oil tanker market in the
Arabian Gulf that serves as the baseline for our analysis. An alternative model specification is
discussed in section 5. The challenge is how to identify economically meaningful exogenous
variation in the data with the few variables available. Using a comparatively short estimation
period rules out the construction of more elaborate models. Although not all estimates of the
structural relationship between these variables are precise, we show that there is nevertheless
useful information in these data. The baseline structural model includes the log of the real
time-charter (TC) rate for VLCCs, the log-linearly-detrended volume of oil exports from the
Arabian Gulf, the real profits of owners of VLCCs from the Ras Tanura-Chiba trade route,
and the real price of bunker fuel in Fujairah (see Figure 1).5
This model can be understood within a framework where the demand for tankers is
derived demand that depends on the level of economic activity in oil-importing countries in
the Far East, the demand for storing oil at sea, and a range of other determinants. The VLCC
market is competitive and voyage freight rates are determined by market forces. Round-trip
voyage rates reflect the cost of operating tankers, including notably fuel costs, but also
depend on factors such as the number of vessels that are active in the market as well as the
intensity with which these vessels operate. Tanker owners are profit maximizers. The supply
of tankers depends on the ship-building and scrapping cycle, which is allowed to respond to
demand conditions.
5 Linear detrending preserves the long-cycles in measures of the volume of oil exports and hence is widely used in modeling commodity markets (e.g., Kilian and Zhou 2018). It can be shown that the results are not overly sensitive to expressing the volume of oil exports in log-differences.

7
Our objective is to explain variation in the four model variables in terms of four
mutually uncorrelated structural shocks: (1) A tanker utilization shock that captures changes
in the intensity with which VLCCs are being used. (2) A cost shock that captures, for
example, unexpected changes in the cost of the bunker fuel used to run tankers, which
accounts for as much as 70% of overall voyage costs and much of their variability. (3) A
tanker supply shock that reflects unexpected additions to the VLCC tanker fleet as well as the
scrapping of older tankers over time due to wear and tear, new regulations, and technological
or economic obsolescence.6 Allowing for tanker supply shocks is particularly important,
given the acceleration in the average annual growth of the VLCC fleet from 2.9% during
1991-2000 to 5% during 2010-2019. (4) A tanker demand shock that reflects unexpected
shifts in the demand for tanker transportation services. Such shifts are typically triggered by
changes in the demand for crude oil from oil-importing countries. They may also reflect an
unexpected increase in oil supplies. A good example is the increase in tanker rates in early
2020 (which occurred outside of our sample), when Saudi Arabia expanded its oil exports in
an effort to gain market share.
3.1. Identifying Restrictions
Let (TC rate, exports, profits,fuel price)ty be generated by a covariance stationary
structural VAR(12) process of the form 0 1 1 12 12.... ,t t t tB y B y B y w where the stochastic
error tw is mutually uncorrelated white noise and the deterministic terms have been
suppressed for expository purposes. We follow Kilian and Lütkepohl (2017) in setting a
conservative lag order of 12, which avoids the pitfalls of data-based lag order selection. The
6 An example of a tanker supply shock induced by regulatory changes is the gradual decommissioning of the single-hull tanker fleet in the 1990s, following the passage of the 1990 Oil Pollution Act by Congress. Another interesting example of a tanker supply shock is the lockdown of all major recycling destinations in the Indian subcontinent in March 2020, following the Covid-19 outbreak. This stalled all ship scrapping activity globally, since scrapyards in the subcontinent account for more than 90% of the global demolition capacity.

8
reduced-form errors may be written as 10 ,t tu B w where 1
0B denotes the structural impact
multiplier matrix, 1 1 12 12... ,t t t tu y A y A y and 10 ,l lA B B 1,...,12.l The { }ij th
element of 10 ,B denoted 0
ijb , represents the impact response of variable i to structural shock
,j where 1,..., 4i and 1,..., 4 .j Given the reduced-form estimates, knowledge of 10B
suffices to recover estimates of the structural impulse responses, variance decompositions and
historical decompositions from the reduced-form estimates, as discussed in Kilian and
Lütkepohl (2017).
3.1.1. Static and dynamic identifying restrictions on the structural impulse responses
Let cost supply demand, , ,utilizationt t t t tw w w w w and TC rate exports profits, , , .fuel price
t t t t tu u u u u We postulate
that
exp cost
supply
demand
0
0
TC rate utilizationt t
ortst tprofits
t tfuel price
t t
u w
u w
u w
u w
. (1)
The model distinguishes between tanker supply shocks on the extensive margin and the
intensive margin. The extensive margin is defined as changes to the aggregate number of
VLCCs in the fleet, as vessels are launched and take into service or retired ( supplytw ). The
intensive margin measures how hard these vessels are being worked ( utilizationtw ). Higher
utilization of vessels may occur, for example, as trading routes are affected by the risk of
storms, piracy or military attack, forcing vessel owners to take detours, to sit idle until the
risk has passed, or to wait to travel in convoys. It may also occur, as VLCCs are chartered for
storing crude oil at sea and become unavailable for transportation (see Adland and Regli

9
2019).7 Higher utilization may also reflect congestion at ports or the temporary closure of
shipping channels after accidents, and it may reflect refinery outages or storage constraints in
the receiving country. In addition, it may reflect sanctions on owners of tankers.8 In all these
cases, fewer vessels are available for loading cargoes of oil in the Arabian Gulf, causing
tanker rates to increase. As tanker rates increase, fewer cargoes are being moved and the
volume of oil exports falls. The impact on profits is positive because tanker rates increase,
and the elasticity of seaborne trade to freight costs is known to be low (see Stopford 2009).
Fuel prices are unaffected on impact, because a typical roundtrip voyage from the Arabian
Gulf to East Asia takes 50 days and VLCCs facing utilization shocks tend to be at sea.
A positive cost shock associated with higher bunker fuel prices leaves unaffected the
real TC rate on impact, but lowers the volume of oil exports and the real profits from round-
trip voyages. The restriction that the TC rate does not respond within one month to a cost
shock follows directly from the fact that such costs are borne by the lessee rather than the
lessor of the vessel (for related discussion of this point see Stopford 2009; Kilian and Zhou
2018; Nomikos and Regli 2019). Following a positive cost shock, operating costs for time
charterers increase, so there is less demand for shipping oil and the volume of oil exports
must fall. Likewise, the real profits of the owners of VLCCs must also drop, given prior
evidence of imperfect cost passthrough (see Agnolucci et al. 2014).9
A negative tanker supply shock raises both the TC rate and the round-trip voyage rate.
The increase in tanker rates causes a reduction in the demand for oil tankers and hence in oil
7 An example is the steep contango in the crude oil futures markets caused by Covid-19 in early 2020 that led to a surge in the chartering of VLCC for floating storage. As of April 17, 2020, 54 VLCCs were used as floating storage, according to Lloyd's List Intelligence. This is 7% of the entire fleet. 8 An example is the decision of the Trump administration in September 2019 to prohibit several Chinese firms including a unit of COSCO Shipping Corp from carrying crude in retaliation for violations of Iran sanctions. This decision effectively reduced the available VLCC fleet in the tanker market. 9 If cost shocks are fully passed on to round-trip voyage rates, the impact response of profits would be zero. However, if cost shocks are only partially passed on to round-trip voyage rates in the impact period, profits will fall on impact. This effect will be reinforced by a decline in the shipping volume. We therefore impose a negative sign on impact.

10
exports. Likewise, the demand for bunker fuel and hence the price of fuel decline. Profits
must increase, in contrast, given the low elasticity of seaborne trade to changes in freight
costs. Finally, a positive shock to the demand for tankers raises both time charter rates and
round-trip voyage tanker rates and hence is associated with higher oil exports, higher real
profits, and higher fuel prices.
In addition, we impose the dynamic sign restriction that the response of the volume of
oil exports from the Arabian Gulf, the response of the real time charter rate, and the response
of real profits to a positive tanker demand shock remains positive for at least 6 months. This
restriction makes sense given that the effects of such a shock are expected to be persistent.
3.2. Estimation and Inference
The model is estimated using the state-of-the-art Bayesian methods of Arias, Rubio-Ramirez
and Waggoner (2018) and Antolin-Diaz and Rubio-Ramirez (2018), which in turn build on
Rubio-Ramirez, Waggoner and Zha (2010). As is standard in the literature, we postulate a
diffuse Gaussian-inverse Wishart prior for the reduced-form VAR parameters and a uniform
prior for the 4 4 rotation matrix ,Q where 'QQ I and I is the identity matrix. Let
1 12,...,A A A denote the autoregressive slope parameters, u the residual variance-
covariance matrix, and P the lower triangular Cholesky decomposition of u with the
diagonal elements normalized to be positive. For every realization of A and ,P obtained
from the reduced-form posterior, we draw many realizations of the matrix Q as described in
Arias et al. (2018).10 We use these candidate solutions in conjunction with A to construct the
candidate structural models and their structural impulse responses.
Given the diffuse Gaussian-inverse Wishart prior distribution for the reduced-form
10 It should be noted that the presence of an exclusion restriction in 1
0B invalidates the standard approach to
generating draws from the posterior distribution of the structural impulse responses discussed in Rubio-Ramirez et al. (2010).

11
parameters, this procedure may be repeated for a large number of reduced-form posterior
draws for , uA to account for parameter estimation uncertainty. We retain the set of
models that satisfy the static and dynamic restrictions on the impulse responses. We then
reweight these candidate solutions using the importance sampler based on numerical
derivatives discussed in Arias et al. (2018) to allow for the fact that zero restrictions on Q
render draws from the space of all possible Q matrices non-uniform. All results are based on
5,000 draws from the distribution of reduced-form parameters combined with 200 draws each
for .Q
4. Empirical Results for the Baseline Model
4.1. Impulse Responses
Figure 2 summarizes the dynamic responses of the variables of interest to each of the
structural shocks. Each subplot traces the response of a given variable to a given structural
shock for up to 18 months. We evaluate the impulse response functions under absolute loss,
as discussed in Inoue and Kilian (2020), taking account of the dependence of the impulse
responses. The response functions associated with the optimal model solution under absolute
loss are shown as dark solid lines and the responses of the models in the joint 68% credible
set derived under the same loss function are shown in a lighter shade.
All response functions make economic sense. A positive utilization shock persistently
raises the real TC rate, slightly lowers the volume of oil exports, causes a short-run surge in
profits and a persistent decline in bunker fuel prices. A positive tanker cost shock has a
negligible effect on the real TC rate, but higher voyage costs are associated with a decline in
the demand for time charters because charterers’ profits are reduced by higher operating
costs. This helps explain the negative response of the volume of oil exported from the
Arabian Gulf. The real profits of VLCC owners from round-trip voyage runs decline in the
short run. The fact that real profits decline by more at short horizons than at long horizons is

12
particularly interesting. It suggests that increased costs are not being fully passed on to round-
trip voyage rates right away. If they were, one would expect profits to remain unchanged in
the voyage market, for a given volume of shipping, and the decline in real profits should
mirror the decline in export volume.11 Only after half a year, real profits temporarily turn
positive, allowing vessel owners to recuperate some of the initial decline in real profits.
A negative tanker supply shock, as expected, causes a persistent increase in the real
time charter rate and a slight, but persistent decline in the oil export volume, as there are
fewer vessels available and the cost of shipping increases. Given the lack of alternative
means of transportation, seaborne exports are not very responsive to changes in freight costs.
The net effect on the real profits of owners of VLCCs chartered for round-trip voyages is
positive and persistent. On balance, tanker shortages raise real profits in the industry, but the
extent of these gains declines over time. Bunker fuel prices respond negatively to a reduction
in the number of vessels. Finally, a positive shock to tanker demand also raises the real time
charter rate and bunker fuel prices, but is associated with a persistent increase in the volume
of oil exports from the Arabian Gulf and in real voyage profits.
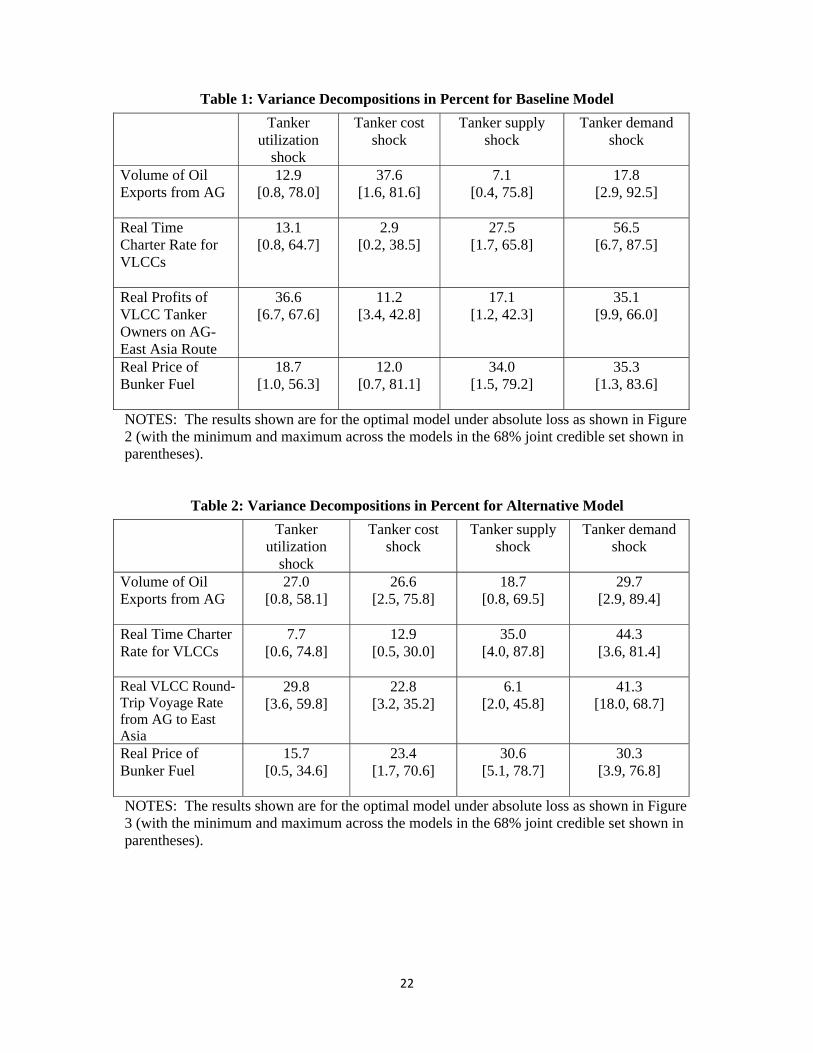
4.2. Variance decompositions
Variance decompositions allow us to assess to what extent the variability of the model
variables is explained by each shock on average. Table 1 shows the variance decomposition
for the model that is optimal under absolute loss. It also reports the minimum and maximum
contribution across the models contained in the 68% joint credible set, shown in Figure 2.
Table 1 indicates that variation in the real voyage profits of VLCC owners operating
on the Arabian Gulf (AG)-East Asia route depends mainly on the tanker demand shock and
the tanker utilization shock. Whereas short-term utilization shocks are most important in
11 This finding is also consistent with evidence from the dry-bulk shipping industry that owners are only partially able to recover investments in more fuel-efficient vessels through higher time charter rates (Agnolucci, Smith and Rehmatullah 2014; Adland, Alger, Banyte and Haiying 2017).

13
explaining the profits from short round-trip voyage of 50 days, for time-charter contracts, the
impact of short-term utilization shocks is diffused over the longer duration. Thus, the
variability of the real time charter rate is largely determined by a combination of tanker
demand shocks and to a lesser extent tanker supply shocks. The variability of real bunker fuel
prices reflects mainly tanker demand shocks and tanker supply shocks, followed by cost
shocks, with only a small role for utilization shocks. Finally, the variability in the volume of
oil exports from the Arabian Gulf appears driven mainly by tanker cost and tanker demand
shocks.
5. An Alternative Structural Model of the VLCC Oil Tanker Market in the Arabian
Gulf
In this section, we propose an alternative model that differs from the baseline model in that
the real round-trip (RT) voyage rate replaces the real profits variable.
5.1. Identifying Restrictions
We postulate that
exp cost
supply
demand
0
0
TC rate utilizationt t
ortst tRT ratet tfuel price
t t
u w
u w
u w
u w
, (2)
where entries left blank indicate that no sign or exclusion restriction is imposed. As in the
baseline model, we exploit the fact that bunker fuel prices do not respond to the utilization
shock and that time charter rates do not respond to cost shocks on impact. A higher
utilization of VLCCs is associated with higher demand for VLCCs and hence higher TC and
RT rates, which explains the negative sign of the volume of oil exports. The fuel price does
not respond on impact, since the utilization shock applies to vessels already at sea. A positive
cost shock is associated with higher bunker fuel prices and lower exports, as voyage profits

14
decline. TC rates are not affected on impact. We do not impose the restriction that positive
cost shocks raise the real round-trip voyage rate on impact, since VLCC owners may not be
able to immediately pass on a cost shock to the RT rate. Negative tanker supply shocks raise
the real round-trip voyage rate and lower the volume of oil shipped (which is proportionate to
the number of available carriers), as the VLCC supply curve shifts to the left. They also lower
the demand for fuel and hence the bunker fuel price. Finally, positive tanker demand shocks
raise all model variables on impact. Otherwise, the identifying restrictions and model
specification are the same.
This alternative model not only helps us to make statements about the determinants of
the real round-trip voyage rate, but it also helps cross-validate the conclusions reached based
on the baseline model.12
5.2. Empirical Results for the Alternative Model
5.2.1. Impulse Responses
Figure 3 shows that the responses of the volume of oil exports and of the real time charter
rate are quite similar to Figure 2. Of particular interest are the additional estimates of the
response of the real round-trip voyage rate. A positive tanker utilization shock raises the real
round-trip voyage rate, but the response largely dies out after only three months. A positive
shock to voyage costs raises the real roundtrip rate only with a delay, mirroring the results for
real profits in Figure 2. Tanker supply shocks have negligible effects on the real round-trip
voyage rate, although most responses in the credible set are positive, consistent with the
positive response of profits in Figure 2. Real roundtrip rates show a clearly positive response
to positive tanker demand shocks that gradually dies out after about one year.
12 It may seem that one could simply have added the real round-trip voyage rate to the baseline model instead of specifying the alternative model. This is not the case because without adding an identified shock the inclusion of real profits would render the covariance structure of this extended VAR model singular.

15
5.2.2. Variance decompositions
Table 2 shows the corresponding variance decompositions. For the model variables contained
in both the baseline and the alternative model, the variance decompositions are remarkably
similar to those in Table 1. Table 2 confirms that costs shocks are not an important
determinant of the real time charter rate. This finding is consistent with earlier evidence from
the dry-bulk shipping industry about the imperfect cost pass through in the presence of a
principal agent problem, with the vessel owner being the agent and the time charterer being
the principal (see Agnolucci et al. 2014; Adland et al. 2017). Instead, much of the variation in
that rate comes from a combination of tanker supply and tanker demand shocks. Moreover,
the variability of round-trip rates is largely driven by utilization and tanker demand shocks,
much like the variability of voyage profits in Table 1, and that of bunker fuel prices mainly
reflects tanker supply and demand shocks. One difference is that the variability of export
volumes depends to a large extent on tanker demand and tanker cost shocks, as in Table 1,
but also equally on utilization shocks.
6. Understanding the Historical Evolution of the Model Variables
The historical decompositions in Figures 4-8 provide additional information on how each
shock cumulatively affected the evolution of the variables of interest, drawing on results from
both the baseline and the alternative model. We focus on the decomposition of the optimal
model under absolute loss. Each subplot shows the cumulative effect of a given shock on the
variable of interest at each point in time, while setting to zero all other structural shocks. We
deal with the transition dynamics in the construction of the historical decomposition by
discarding the first ten years of data (see Kilian and Lütkepohl 2017). Since the results are
quite similar across model specifications, we mainly focus on the baseline model.
6.1. Volume of oil exports from the Arabian Gulf
Figure 4 indicates that until 2008, the volume of oil exports from the Arabian Gulf was

16
largely determined by tanker demand shocks, consistent with the view that oil tanker demand
is ultimately derived from demand for oil. For example, tanker demand shocks accounted for
a 32% cumulative increase in export volumes during the Great Surge in oil markets. Neither
utilization shocks nor tanker cost shocks or tanker supply shocks cumulatively had much of
an effect over this period. The sustained demand-driven boom from 2003 until mid-2008, is
followed by a contraction during the financial crisis and an incomplete recovery in 2009 and
2010.
Since early 2011, the demand-driven component of the volume of oil exports from the
Arabian Gulf has gradually declined, but there has been a sustained increase in the oil export
volume driven by lower voyage costs. This pattern is consistent with the gradual renewal of
the fleet and the introduction of newer, more fuel efficient vessels over the last decade. This
conjecture is supported by aggregate fleet statistics about the average age of the fleet and the
deliveries of new vessels. Moreover, from 2008 onwards, tankers started adopting the
practice of “slow steaming”, i.e., reducing the sailing speed, which is an effective way of
reducing fuel consumption.13 The average speed of the VLCC fleet decreased from 14.2
knots in 2008 to 12.8 knots in 2012 and to 11.57 knots in 2019. These negative tanker cost
shocks are consistent with the pattern observed in Figure 4.14
A particularly interesting additional finding that holds regardless of the specification,
is a temporary expansion in oil export volumes (and, as we will see later, in both tanker rates)
due to higher demand associated with the temporary détente in U.S. trade policy in 2018/19.
This evidence shows that trade disputes may have real effects on industrial commodity
markets, consistent with the empirical findings of Ademuyiwa and Siklos (2019). Even
13 A laden VLCC, for example, consumes 80 mt of fuel oil per day when sailing at 13.5 knots, but only 70 mt per day when sailing at 13 knots. 14 Reducing the average speed, means it takes longer for a tanker vessel to complete a round-trip voyage, which reduces the utilization of the fleet. The fact that utilization shocks remained unimportant over the same period of time indicates that the larger volume of crude oil exports was accommodated by an expanding tanker fleet operating at reduced capacity, so that the overall utilization did not decline much.

17
granting that some aspects of the structural models are only imprecisely estimated, the
baseline and the alternative structural model paint a coherent picture of the role of tanker
demand shocks.
6.2. Real VLCC Time Charter Rates
Figure 5 shows that in the baseline model real time charter rates were relatively unaffected by
tanker cost shocks, which is not surprising since such costs are not borne by the owner of the
tanker. Much of the evolution of real time charter rates is driven by tanker demand shocks.
It is useful to characterize this point numerically. During the Great Surge from 2002 to mid-
2008, tanker demand shocks accounted for a 107% cumulative increase in real time charter
rates, with no other shock even remotely as important. During the financial crisis, they caused
a sharp cumulative decline in time charter rates of 105%, followed by a 46% cumulative
increase during the recovery. There is also a slight slump in the tanker demand-driven
component from mid-2011 to 2013, but interestingly not in 2014/15, suggesting that demand
for crude oil from East Asia remained stable during the 2014/15 oil price decline. Likewise,
time charter rates fell in 2017/18, as tanker demand fell, before the trade policy induced blip
in 2018/19 that we already mentioned.
There is no evidence that tanker supply shocks help explain the rise in tanker rates in
the first half of the estimation period. Tanker supply shocks did help lower real time charter
rates during part of the second half of the estimation period, however. There is a sustained
trough in tanker rates in 2010-12 and another trough in 2016-19 driven by positive tanker
supply shocks. This result is consistent with anecdotal evidence of a vessel glut in oil tanker
markets. Demand for raw materials, including crude oil, surged in the 2000s, following rapid
growth in many emerging economies and China’s admission to the WTO in 2001. This
caused a surge in the demand for seaborne transportation which, after a prolonged period of
underinvestment in the shipping industry in the 1990s, caused a sustained increase in
18
shipping rates. The strong freight market, from 2003 to mid-2008, coincided with an increase
in the orderbook for new vessels. Significant construction lags meant that these vessels were
delivered, just as the financial crisis was unfolding and the shipping market contracted. The
pattern of overinvestment at the peak of the market cycle is a key feature of the shipping
industry (e.g., Kalouptsidi, 2004; Greenwood and Hanson, 2015; Moutzouris and Nomikos,
2020).
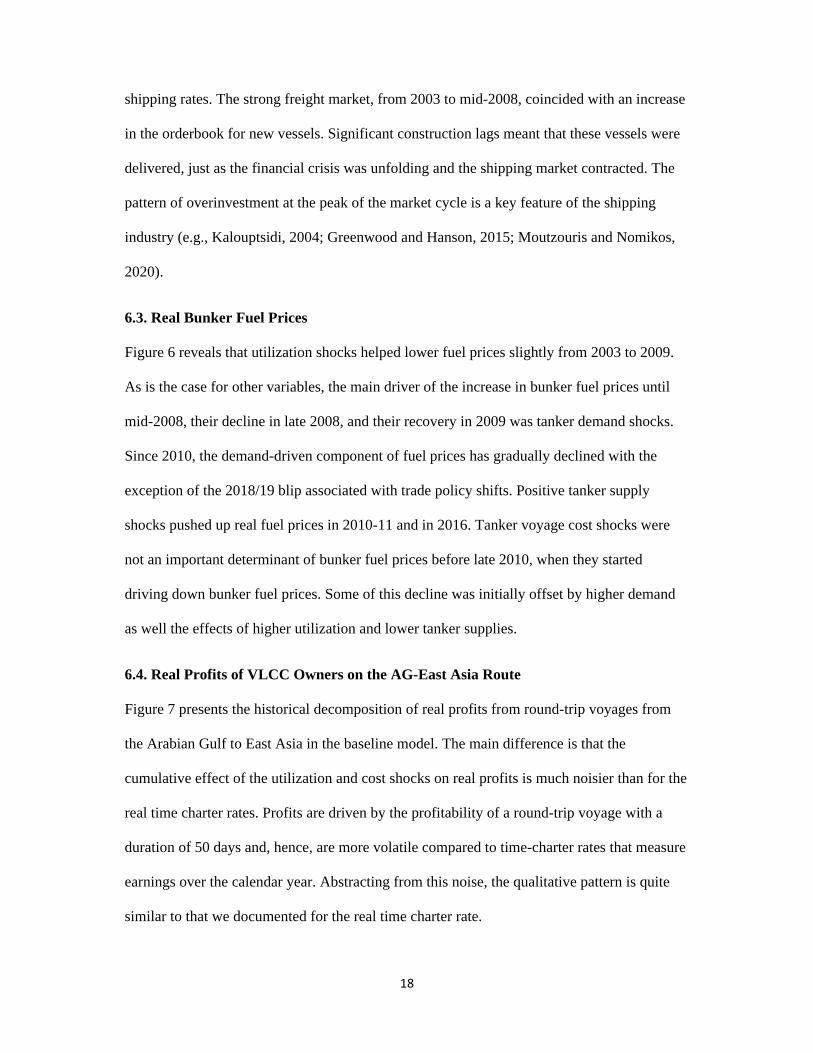
6.3. Real Bunker Fuel Prices
Figure 6 reveals that utilization shocks helped lower fuel prices slightly from 2003 to 2009.
As is the case for other variables, the main driver of the increase in bunker fuel prices until
mid-2008, their decline in late 2008, and their recovery in 2009 was tanker demand shocks.
Since 2010, the demand-driven component of fuel prices has gradually declined with the
exception of the 2018/19 blip associated with trade policy shifts. Positive tanker supply
shocks pushed up real fuel prices in 2010-11 and in 2016. Tanker voyage cost shocks were
not an important determinant of bunker fuel prices before late 2010, when they started
driving down bunker fuel prices. Some of this decline was initially offset by higher demand
as well the effects of higher utilization and lower tanker supplies.
6.4. Real Profits of VLCC Owners on the AG-East Asia Route
Figure 7 presents the historical decomposition of real profits from round-trip voyages from
the Arabian Gulf to East Asia in the baseline model. The main difference is that the
cumulative effect of the utilization and cost shocks on real profits is much noisier than for the
real time charter rates. Profits are driven by the profitability of a round-trip voyage with a
duration of 50 days and, hence, are more volatile compared to time-charter rates that measure
earnings over the calendar year. Abstracting from this noise, the qualitative pattern is quite
similar to that we documented for the real time charter rate.

19
6.5. Real VLCC Round-Trip Voyage Rates from AG to Asia
A broadly similar pattern is also found in Figure 8, which shows the historical decomposition
of the real round-trip voyage rate in the alternative model. The cumulative effect of tanker
demand and supply shocks follows a pattern reminiscent of that in oil exports, real profits and
the real time charter rate. The cumulative effects of the utilization shock and the tanker
supply shock are more muted than for real profits, however.
7. Conclusion
The market for oil tankers is an important component of the supply chain for crude oil, yet
this market has remained poorly understood, owing to the paucity of time series data and the
absence of an empirical framework for studying its determinants. Our work advanced this
literature in several ways. First, we constructed a new data set of key economic indicators for
the VLCC market from the Arabian Gulf to East Asia for January 1991 through October
2019. Second, we developed a structural vector autoregressive framework for this market that
allowed us to quantify the determinants of these indicators. Focusing on oil exported from the
Arabian Gulf to East Asia by VLCCs allows us to identify of shocks to tanker supply, tanker
utilization, tanker demand and the costs of oil shipping. This is a major advance in that
existing studies of oil tanker markets have focused on documenting lead-lag relationships and
reduced-form correlations without addressing the underlying identification problem. Third,
using state-of-the- art econometric methods, we studied in detail the causes of fluctuations in
round-trip voyage and time charter rates, oil export volumes, bunker fuel prices, and
shipowner profits. Our estimates are informative, economically intuitive, and relevant for
understanding today’s oil tanker market.
References
Ademuyiwa, I., and P.L. Siklos (2019), “The Global Interplay between Trade, Geopolitical
and Commodity Shocks” Centre for International Governance Innovation Discussion

20
Paper No. 229.
Adland, R., and F. Regli (2019), “Crude Oil Contango Arbitrage and the Floating Storage
Decision,” Transportation Research Part E: Logistics and Transportation Review,
122, 100-118.
Adland, R., Alger, H., Banyte, J., and J. Haiying (2017), “Does Fuel Efficiency Pay?
Empirical Evidence from the Dry Bulk Time Charter Market Revisited,”
Transportation Research Part A: Policy and Practice, 95, 1-12.
Agnolucci, P., Smith, T., and N. Rehmatullah (2014), “Energy Efficiency and Time Charter
Rates: Energy Efficiency Savings Recovered by Ship Owners in the Panamax
Market,” Transportation Research Part A: Policy and Practice, 66, 173-184.
Alexandridis, G., Kavussanos, M.G., Kim, C.Y., Tsouknidis, D.A., and I. Visvikis (2018), “A
Survey of Shipping Finance Research: Setting the Future Research Agenda,”
Transportation Research Part E: Logistics and Transportation Review, 115, 164-212.
Antolín-Díaz, J., and J.F. Rubio-Ramírez (2018), “Narrative Sign Restrictions”, American
Economic Review, 108, 2802-2829.
Arias, J.E., Rubio-Ramirez, J.J., and D.F. Waggoner (2018), “Inference Based on Structural
Vector Autoregressions Identified by Sign and Zero Restrictions: Theory and
Applications,” Econometrica, 86, 685-720.
Behrens, K., and P.M. Picard (2011), “Transportation, freight rates, and economic
geography,” Journal of International Economics, 85, 280-291.
Brancaccio, G., Kalouptsidi, M., and T. Papageorgiou (2020a), “Geography, Transportation,
and Endogenous Trade Costs,” Econometrica, 88, 657-691.
Brancaccio, G., Kalouptsidi, M., Papageorgiou, T., and N. Rosaia (2020b), “Frictions and
Efficiency in Decentralized Transport Markets,” manuscript, Cornell University.
Glen, D.R., and B.T. Martin (2005), “A Survey of the Modelling of Dry Bulk and Tanker

21
Markets,” Research in Transportation Economics, 12, 19-64.
Greenwood, R., and S.G. Hanson (2015), “Waves in Ship Prices and Investment,” Quarterly
Journal of Economics, 130, 55-109.
Inoue, A., and L. Kilian (2020), “Joint Bayesian Inference about Impulse Responses in VAR
Models,” manuscript, Federal Reserve Bank of Dallas.
Kalouptsidi, M. (2014), “Time to build and Fluctuations in Bulk Shipping,” American
Economic Review, 104, 564-608.
Kilian, L. and H. Lütkepohl (2017). Structural Vector Autoregressive Analysis, Cambridge
University Press: Cambridge.
Kilian, L., and X. Zhou (2018), “Modeling Fluctuations in the Global Demand for
Commodities,” Journal of International Money and Finance, 88, 54-78.
Moutzouris, I.C., and N. K. Nomikos (2020), “Asset Pricing with Mean Reversion: The Case
of Ships”, Journal of Banking & Finance, 111, forthcoming.
Nomikos, N.K. and F. Regli (2019), “The Eye in the Sky: Freight Rate Effects of Tanker
Supply,” Transportation Research Part E: Logistics and Transportation Review, 125,
404-424.
Parker, S. (2014), “Matching in the Oil Tanker Industry: Implications for Energy Efficiency,”
manuscript, UCL.
Stopford, M. (2009), Maritime Economics, 4th ed., Routledge: London.
Tamvakis, M.N., and H.A. Thanopoulou (2000), “Does Quality Pay? The case of the dry bulk
market,” Transportation Research: Part E, 36 (4), 297–307.
Rubio-Ramirez, J.F., Waggoner, D., and T. Zha (2010), “Structural Vector Autoregressions:
Theory of Identification and Algorithms for Inference,” Review of Economic Studies,
77, 665-696.
22
Table 1: Variance Decompositions in Percent for Baseline Model
Tanker utilization
shock
Tanker cost shock
Tanker supply shock
Tanker demand shock
Volume of Oil Exports from AG
12.9 [0.8, 78.0]
37.6 [1.6, 81.6]
7.1 [0.4, 75.8]
17.8 [2.9, 92.5]
Real Time Charter Rate for VLCCs
13.1 [0.8, 64.7]
2.9 [0.2, 38.5]
27.5 [1.7, 65.8]
56.5 [6.7, 87.5]
Real Profits of VLCC Tanker Owners on AG-East Asia Route
36.6 [6.7, 67.6]
11.2 [3.4, 42.8]
17.1 [1.2, 42.3]
35.1 [9.9, 66.0]
Real Price of Bunker Fuel
18.7 [1.0, 56.3]
12.0 [0.7, 81.1]
34.0 [1.5, 79.2]
35.3 [1.3, 83.6]
NOTES: The results shown are for the optimal model under absolute loss as shown in Figure 2 (with the minimum and maximum across the models in the 68% joint credible set shown in parentheses).
Table 2: Variance Decompositions in Percent for Alternative Model
Tanker utilization
shock
Tanker cost shock
Tanker supply shock
Tanker demand shock
Volume of Oil Exports from AG
27.0 [0.8, 58.1]
26.6 [2.5, 75.8]
18.7 [0.8, 69.5]
29.7 [2.9, 89.4]
Real Time Charter Rate for VLCCs
7.7 [0.6, 74.8]
12.9 [0.5, 30.0]
35.0 [4.0, 87.8]
44.3 [3.6, 81.4]
Real VLCC Round-Trip Voyage Rate from AG to East Asia
29.8 [3.6, 59.8]
22.8 [3.2, 35.2]
6.1 [2.0, 45.8]
41.3 [18.0, 68.7]
Real Price of Bunker Fuel
15.7 [0.5, 34.6]
23.4 [1.7, 70.6]
30.6 [5.1, 78.7]
30.3 [3.9, 76.8]
NOTES: The results shown are for the optimal model under absolute loss as shown in Figure 3 (with the minimum and maximum across the models in the 68% joint credible set shown in parentheses).

23
1995 2000 2005 2010 2015-0.5
0
0.5Volume of oil exports from AG
1995 2000 2005 2010 2015-2
0
2Real 1-year time charter rate for VLCCs in $/day
1995 2000 2005 2010 2015-2
0
2Real round-trip voyage rate for VLCCs from AG to Asia in $/mt
1995 2000 2005 2010 2015-4-2024
Real VLCC vessel owner profits on AG-Asia route in $/day
1995 2000 2005 2010 2015-2
0
2Real bunker fuel price in $/mt
Figure 1: Key Indicators of the Arabian Gulf-East Asia Oil Tanker Market NOTES: All data are expressed in log deviations from the mean or trend.
Figure 2: Impulse Responses Estimates and 68% Joint Credible Sets in the Baseline Model under Absolute Loss
NOTES: The responses for the optimal model under absolute loss are shown as dark lines and the responses of models in the 68% joint credible set are shown in a lighter shade.

24
Pe
rce
nt
Pe
rce
nt
Pe
rce
nt
Pe
rce
nt
Figure 3: Impulse Responses Estimates and 68% Joint Credible Sets in the Alternative Model under Absolute Loss
NOTES: The responses for the optimal model under absolute loss are shown as dark lines and the responses of models in the 68% joint credible set are shown in a lighter shade.
Figure 4: Historical Decomposition of Oil Export Volume in Baseline Model NOTES: The results shown are based on the optimal model under absolute loss.

25
Pe
rce
nt
Pe
rce
nt
Pe
rce
nt
Pe
rce
nt
Pe
rce
nt
Pe
rce
nt
Pe
rce
nt
Pe
rce
nt
Figure 5: Historical Decomposition of the Real Time Charter Rate for VLCCs in Baseline Model
NOTES: See Figure 4.
Figure 6: Historical Decomposition of Real Bunker Fuel Price in Baseline Model
NOTES: See Figure 4.

26
Pe
rce
nt
Pe
rce
nt
Pe
rce
nt
Pe
rce
nt
Pe
rce
nt
Pe
rce
nt
Pe
rce
nt
Pe
rce
nt
Figure 7: Historical Decomposition of Real Profits of VLCC Owners on Arabian Gulf-East Asia Route in Baseline Model
NOTES: See Figure 4.
Figure 8: Historical Decomposition of Real VLCC Round-Trip Voyage Rate from Arabian Gulf to East Asia in Alternative Model
NOTES: See Figure 4.

27
Data Appendix
The raw data are from the Clarksons Shipping Intelligence Network (SIN) which provides
freight rate and trade statistics across a number of sectors of the shipping industry. We use
the following series:
Ras-Tanura to Chiba Round-Trip Voyage rates: This is the all-inclusive rate for the
transportation of a VLCC cargo of near 2 million barrels of crude oil (or deadweight of about
265,000 metric tons) from Ras Tanura in the Arabian Gulf to Chiba in Japan. There are a
number of shipping routes serviced by VLCC vessels, but this particular route is considered a
key benchmark with consistent reporting and liquid trading activity. The rate reported by SIN
covers the round-trip voyage cost (a laden leg from Ras-Tanura to Chiba and a ballast leg
from Chiba to Ras-Tanura) and is expressed in Worldscale points, as is the convention in the
tanker market.15 We convert the reported round-trip tanker voyage rates from Worldscale
points into the equivalent US$/mt freight rate using the appropriate Worldscale flat rates.
This rate represents the all-inclusive cost for the transportation of a cargo of crude oil.
Using rates for a round-trip has a number of advantages. Combining freight rates for
both the laden and the ballast leg overcomes the problem that freight costs are largely
asymmetric between the front-haul (laden) and back-haul (ballast) routes and are subject to
significant search costs (e.g., Behrens and Picard, 2011; Brancaccio, Kalouptsidi and
Papageorgiou 2020; Brancaccio, Kalouptsidi, Papageorgiou and Rosaia 2020). In addition
15 The Worldscale Association calculates the cost of performing a round-trip tanker voyage between any two ports in the world. The freight cost is calculated for a standard 75,000 mt dwt “Aframax”-type tanker vessel after making certain assumptions regarding voyage costs (such as port charges, canal charges and bunker costs) that are applicable for each voyage. The resulting freight rate, quoted as U.S. $/mt, is effectively the break-even rate for the particular vessel and voyage and is known as Worldscale 100 or as the Worldscale Flat Rate. The Worldscale 100 reference rate for each voyage is usually updated once a year to reflect changes in the cost of performing a voyage. The actual negotiated rate for any trip is then quoted as a percentage of that rate. For example, if the flat rate is U.S.$ 14.9 $/mt and the negotiated rate for a voyage is Worldscale 50, then the agreed rate is 50% of 14.9, i.e., 7.45 U.S.$/mt. Worldscale provides a convenient way for trading cargoes of crude oil whilst in transit without the need to renegotiate the freight rate. For instance if the final destination of a cargo of crude oil changes (say, from Dalian in China to Incheon in South Korea) the negotiated Worldscale rate is applied to the flat rate of the new discharge location.

28
these rates represent the fair market assessment between a willing buyer and a willing seller
for a standard type ship and thus are not subject to differences in the quality or condition of
the vessel or in the creditworthiness of the counterparties, as discussed in Tamvakis and
Thanopoulou (2000).
Ras – Tanura to Chiba Profits: This is the net revenue, in US$/day, earned on the Ras-
Tanura-Chiba round-trip voyage after deducting voyage costs (fuel costs and port costs) and
broker’s commission from the total compensation earned by the shipowner and dividing by
the number of days of the voyage. These net earnings (or profits) of the vessel owner for this
particular route are calculated based on the following variables:16
Freight Income: Voyage Rate in $/mt cargo size.
Port Costs: Sum of loading and discharge costs for the specified route, cargo size and ship
type.
Bunker fuel prices: Average of bunker fuel prices at major bunkering hubs on this route. To
estimate the total fuel cost for the voyage the following speed and fuel oil consumption
profile for a VLCC vessel is used: Sailing speed of 13.5 knots at 80 mt fuel oil per day
(laden) and 12 knots at 55 mt fuel oil per day (ballasted).
Voyage Duration: Sea time, based on the sailing speeds above, plus 5% sea margin plus two
days for cargo loading and two days for cargo discharging. For the Ras-Tanura to Chiba route
the total voyage time is 50 days.
Commission: 2.5% commission is deducted from total freight revenue. This is the ship
broker’s commission and represents the search costs for the particular voyage.
It should be noted that our profit measure does not account for all costs borne by vessel
16 For further details the reader is referred to Sources and Methods for the Shipping Intelligence Weekly (available from www.clarksons.net).

29
owners. It does not adjust for fixed costs such as crew costs and maintenance costs. In
practice, owners will operate vessels if voyage earnings can cover voyage costs and part of
the fixed costs (see Stopford 1997).
VLCC One-year Time-Charter (TC) Rate: This is the rate, in US $/day, for chartering a
VLCC vessel for one year. Under a time-charter contract, the charterer (or lessee) agrees to
hire the vessel from the shipowner (or lessor), for a specified period of time, which may vary
from three months up to several years in general. One-year TC rates are the most commonly
used form of a period contract in the shipping industry. The charterer takes commercial
control of the vessel for the duration of the contract and is responsible for all voyage costs.
One key difference between earnings and voyage rates on the one hand and TC rates
on the other is that earnings are for a specific route while a TC contract allows a vessel to
operate globally. In addition, the duration of the contract is different. Earnings are for a
voyage of 50 days, whereas TC rates are typically quoted for a period of one year. As a
result, TC rates also reflect the expectations of future earnings beyond the duration of a given
voyage. A third difference is that TC rates do not include operating costs.
Crude Oil Exports: These are monthly seaborne crude oil exports from the Arabian Gulf
(AG) measured in million barrels per day. For 2019, VLCCs transported more than 70% of
total oil production out of Arabian Gulf, the majority of which was destined for East Asia.
Thus, aggregate crude oil exports are representative of the overall level of VLCC trade on the
AG–East Asia route. The volume of crude exports may be viewed as a proxy for the level of
economic activity in this market. For further discussion of related measures of economic
activity see Kilian and Zhou (2018).
Bunker Fuel Prices:
Bunker fuel or heavy fuel oil (HFO) is the main fuel that cargo vessels use for propulsion. It
is a residual fuel from the oil distillation process. A typical VLCC consumes about 80 mt of

30
fuel oil per day on a laden leg assuming an average speed of 13.5 knots. The total fuel
consumption for the Ras-Tanura to Chiba round-trip voyage is approximately 2874 mt of
HFO and cost about $939,000 at October 2019 prices. Bunker costs are the single most
important part of voyage costs. Depending on the price of bunker fuel, they can account for
up to 70% of the total voyage costs. In addition, they are the most volatile part of voyage
costs as all other voyage costs (such as port charges) tend to increase at the rate of inflation.
We use monthly prices, in $/mt, for HFO in Fujairah which is the major bunkering
hub in the Arabian Gulf. The benchmark fuel type is HFO with 380 centistokes (cst) viscosity
and sulphur content of 3.5%.17 It is worth noting that new International Maritime Association
(IMO) regulations that limit ships’ emissions came into effect in January 2020. As a result,
ships need to use more expensive low sulphur fuel oil with a sulphur content of 0.5% or,
invest in exhaust gas cleaning systems, known as scrubbers, so as to continue using high
sulphur fuel oil. However, this important change came into effect only after the end of our
estimation period.
17 Centistokes is the unit of measurement of fuel viscosity and also reflects its distillate content. HFO Grade 380cst has between 2 and 5% distillate content.