a publication of the north american lake management...
TRANSCRIPT

LakeLineA publication of the North American Lake Management Society
NORTH AMERICAN LAKEMANAGEMENT SOCIETY1315 E. Tenth StreetBloomington, IN 47405-1701
NONPROFIT ORG.US POSTAGE
PAIDBloomington, INPermit No. 171
HABs and USEPA
Volume 35, No. 2 • Summer 2015


2 Summer 2015 / NALMS • LAKELINE
Hosted by the New York State Federation of Lake Associations An Affiliate of NALMS
NALMS and the New York State Federation of Lake Associations invite you to join us for the 35th International Symposium of the North American Lake Management Society at the Saratoga City Center in Saratoga Springs, New York. NALMS 2015 offers an opportunity to explore historic Saratoga Springs including Saratoga Spa State Park, casino venues, and a thriving historic downtown. It is just a short trip to explore the Adirondack Park which was created in 1892 by the State of New York amid concerns for the water and timber resources of the region. We look forward to welcoming lake managers, regulators, educators, researchers, students and corporate partners from around the continent and the world to Upstate New York to share the results of research and management, to exchange ideas and information, and to learn about advancements in technology, management, and knowledge.
Saratoga Springs, New YorkNovember 17 – 20, 2015
35th International Symposium35th International SymposiumSaratoga Springs
2015
Tentative ScheduleNALMS Board Meeting
WorkshopsField TripNALMS New Member ReceptionPub Crawl
Opening Plenary SessionTechnical and Poster SessionsExhibits OpenNALMS Membership MeetingExhibitors’ Reception
Plenary SessionClean Lakes ClassicTechnical and Poster SessionsExhibits OpenAwards Reception and Banquet
Technical and Poster SessionsExhibits Open
Monday, November 16
Tuesday, November 17
Wednesday, November 18
Thursday, November 19
Friday, November 20

Summer 2015 / NALMS • LAKELINE 3
Technical ProgramThe NALMS 2015 Program Committee is planning a top-notch array of presentations on diverse aspects of lakes, ponds, reservoirs, their watersheds, and their many users and inhabitants. Below is a sample of key topics, but please check the symposium website regularly for up-to-date program information.
Proposed Sessions
• Harmful Algal Blooms – Research and Monitoring
• Citizen Science and Monitoring
• Shoreline Restoration
• Boat Launch Stewardship
• Management & Research: Lake Champlain, Lake George, Finger Lakes, Great Lakes (and other lakes)
• Hydrilla Management
• Invasive Species Control
• Role of Lake Associations in Lake Management
• Stormwater Management
• Lake Management Case Studies
• In-Lake Restoration and Management Techniques
• Internal Loading
• Dam Safety and Lake Management
• Reservoir Management
• International Perspectives on Lake Management
• Winter Road Maintenance and Water Quality
Workshops and Field TripWe will be offering a variety of full- and half-day workshops as well as a field trip on Tuesday of the conference. These workshops provide attendees the opportunity for a more in-depth focus on a topic of interest, and many will provide hands-on experience.
Workshops
• Collection, Identification, Ecology and Management of Freshwater Algae
• GIS Applications for Water Resources Professionals
• Lake & Pond Phosphorus Inactivation & Interception
• Lake Ecology Primer
• Real Time Test Systems for Cyanotoxins
• Zebra and Quagga Mussels – Key Elements of a Prevention, Early Detection, Rapid Response, and Management Plan
Field Trip
• Exploring Lake George and Beyond: History Meets Technology
Visit the NALMS website, www.nalms.org, for more information and pricing.
Symposium ThemeThe theme of NALMS’ 2015 International Symposium is tied to the historic location in Saratoga Springs, New York.
Lakes in this region, including Lake George and Lake Champlain, served as strategic locations in the French and Indian War, the American Revolution and the War of 1812. These waterways now play a major role in the economy of the
region, and lake management efforts are essential to preserving water quality.
#NALMS2015

4 Summer 2015 / NALMS • LAKELINE
Important Deadlines
September 4, 2015
Registration and payment from presenters of accepted abstracts due.
September 25, 2015
Early bird registration deadline.
October 16, 2015
Last day conference hotel rate available.
November 6, 2015
Regular registration deadline.
Contact Information
Local Host Committee Chair
Nancy Mueller | [email protected]
Program Chair
Dean Long | [email protected]
Sponsorship/Exhibitor Chair
Nancy Mueller | [email protected]
General Conference, Exhibitor & Sponsorship Information
NALMS Office | 608-233-2836 | www.nalms.org
Special Events
Paint Sip Fun ... Paint a Lake!
Tuesday, November 17
Come relax and paint a lakescape while enjoying a refreshing beverage. Take a break from the scientific aspects of lake management and indulge yourself in the aesthetic appeal of our love of lakes. No experience necessary, this is a step by step taught class so everyone leaves with a painting they created themselves! Proceeds will go to the Eberhardt Memorial Student Fund.
Welcome to Saratoga Springs Meet and Greet / Pub Crawl
Tuesday, November 17
This year, our traditional symposium-opening social gathering takes us a short walk from our meeting place at the Saratoga Hilton to several locations in and around the Broadway Historic District in downtown Saratoga Springs. Catch up with friends and colleagues new and old during this casual night on the town.
Exhibitor Reception
Wednesday, November 18
NALMS, the Local Host Committee and our exhibitors invite you to join us in kicking off the symposium and welcoming attendees to Saratoga Springs. Take time to relax, view the poster displays and visit with the exhibitors and fellow attendees.
Clean Lakes Classic 5k Run/Walk
Thursday, November 19
The annual Clean Lakes Classic starts at mid-day from High Rock Park across the street from the Saratoga Hilton. The 5 kilometer run or walk follows Excelsior Avenue before connecting with the wooded path of Spring Run Trail. You need not be a runner to participate! All pre-registered participants receive a t-shirt as part of the sign-up fee.
NALMS Awards Reception & Banquet
Thursday, November 19
NALMS’ Annual Awards Reception & Banquet is the climax of the Society’s year as members and friends of the society are honored for their work and achievements over the last year. Awards are presented for Technical Merit, Outstanding Corporation (Jim Flynn Award) and Friends of NALMS and are capped off with our most prestigious award, the “Secchi Disk Award,” which honors the NALMS member who has made the most significant contributions to the goals and objectives of the Society.
Visit www.nalms.org to register for NALMS 2015!
Hotel and TransportationNALMS and the symposium host committee welcome you to Saratoga Springs, New York! Located in the heart of downtown, the Saratoga Hilton, adjoins the Saratoga Springs City Center and will serve as the headquarters hotel for NALMS 2015. The Saratoga Hilton is just steps away from restaurants, shops, sidewalk cafes and nightlife. The Adirondacks and Lake George are just a short drive away.
Hotel Information
The Saratoga Hilton
534 Broadway Saratoga Springs, New York 518-584-4000 | saratogahilton.com
• Room rates are $125 for single occupancy plus tax (currently 13%).
• Government rate rooms are available.
• Complimentary parking and in-room internet are available.
• The conference rate is available until October 16, 2015
Transportation Information
Albany International Airport is located approximately 30 miles from Saratoga Springs and offers service by Delta Air Lines, Southwest Airlines, United Airlines and US Airways.
Saratoga Springs is also served by Amtrak’s Adirondack and Ethan Allen Express lines.
The Saratoga Hilton does not offer an airport shuttle service, but most cabs offer service between Albany International Airport and Saratoga Springs. Fares are approximately $50 one way.
Saratoga SpringsJoin us in
November 17 – 20, 2015
Photo Credits(each page top to bottom)
Page 1: Philip Forsberg, Skunkworks Photographic
Page 2: Eric J. Paparatto, Ken Wagner
Page 3: Ben Rea, Saratoga Convention & Tourism Bureau, Brough Turner
Page 4: Eric J. Paparatto, Saratoga Convention & Tourism Bureau, Matthew D. Britt, Saratoga Convention & Tourism Bureau

Summer 2015 / NALMS • LAKELINE 5
Visit www.nalms.org to register for NALMS 2015!
Hotel and TransportationNALMS and the symposium host committee welcome you to Saratoga Springs, New York! Located in the heart of downtown, the Saratoga Hilton, adjoins the Saratoga Springs City Center and will serve as the headquarters hotel for NALMS 2015. The Saratoga Hilton is just steps away from restaurants, shops, sidewalk cafes and nightlife. The Adirondacks and Lake George are just a short drive away.
Hotel Information
The Saratoga Hilton
534 Broadway Saratoga Springs, New York 518-584-4000 | saratogahilton.com
• Room rates are $125 for single occupancy plus tax (currently 13%).
• Government rate rooms are available.
• Complimentary parking and in-room internet are available.
• The conference rate is available until October 16, 2015
Transportation Information
Albany International Airport is located approximately 30 miles from Saratoga Springs and offers service by Delta Air Lines, Southwest Airlines, United Airlines and US Airways.
Saratoga Springs is also served by Amtrak’s Adirondack and Ethan Allen Express lines.
The Saratoga Hilton does not offer an airport shuttle service, but most cabs offer service between Albany International Airport and Saratoga Springs. Fares are approximately $50 one way.
Saratoga SpringsJoin us in
November 17 – 20, 2015
Photo Credits(each page top to bottom)
Page 1: Philip Forsberg, Skunkworks Photographic
Page 2: Eric J. Paparatto, Ken Wagner
Page 3: Ben Rea, Saratoga Convention & Tourism Bureau, Brough Turner
Page 4: Eric J. Paparatto, Saratoga Convention & Tourism Bureau, Matthew D. Britt, Saratoga Convention & Tourism Bureau


Summer 2015 / NALMS • LAKELINE 7
Published quarterly by the North American Lake Management Society (NALMS) as a medium for exchange and communication among all those interested in lake management. Points of view expressed and products advertised herein do not necessarily reflect the views or policies of NALMS or its Affiliates. Mention of trade names and commercial products shall not constitute an endorsement of their use. All rights reserved. Standard postage is paid at Bloomington, IN and additional mailing offices.
NALMS OfficersPresident
Reed GreenImmediate Past-President
Terry McNabbPresident-ElectJulie Chambers
SecretarySara PeelTreasurer
Michael Perry
NALMS Regional DirectorsRegion 1 Wendy GendronRegion 2 Chris MikolajczykRegion 3 Imad HannounRegion 4 Jason YarbroughRegion 5 Melissa ClarkRegion 6 Brad HufhinesRegion 7 George AntoniouRegion 8 Mike EytelRegion 9 Todd TietjenRegion 10 Frank WilhelmRegion 11 Anna DeSellasRegion 12 Ron ZurawellAt-Large Nicki BellezzaStudent At-Large Ted Harris
LakeLine StaffEditor: William W. Jones
Advertising Manager: Philip ForsbergProduction: Parchment Farm Productions
Printed by: Metropolitan Printing Service Inc.
ISSN 0734-7978 ©2015 North American
Lake Management Society4510 Regent Street
Suite 2BMadison, WI 53705
(All changes of address should go here.)Permission granted to reprint with credit.
Address all editorial inquiries to:William Jones
1305 East Richland DriveBloomington, IN 47408
Tel: 812/[email protected]
Address all advertising inquiries to:Philip Forsberg
NALMSPO Box 5443
Madison, WI 53705-0443Tel: 303/800-6680Fax: 608/233-3186
LakeLine
On the cover:Winner of the 2014 Algal Bloom Photo Contest, sponsored by the U.S. Environmental Protection Agency (EPA), the National Environmental Education Foundation (NEEF), and the North American Lake Management Society (NALMS). The photo was taken at Overbrook City Lake (Kansas) by photographer Diana L.
Advertisers Index
Aquarius Systems, Inc. 6Kasco Marine 6Medora Corporation 11Nufarm Americas BCPentair Aquatic Eco-Systems IBC PhycoTech 15Scientific Diving International 12SePRO IFCVertex Water Features 45YSI 1
Contents Volume 35, No. 2 / Spring 2016
8 From the Guest Editors 10 From the President
HABs and USEPA
12 Protecting America’s Water from Harmful Algal Blooms 13 Building Public Awareness about HABs and Nutrient Pollution 16 Photo Contest Engages Public with Harmful Algal Blooms 19 Cyanotoxins in Drinking Water: Filling the Data Gaps 21 Harmful Algal Blooms and Drinking Water Treatment Research 24 Computational Ecology & Open Science: Tools to Help Manage Cyanobacteria in Lakes 28 A Space Satellite Perspective to Monitor Water Quality Using Your Mobile Phone 32 Phytoplankton Monitoring Network: Using Mobile Technologies for Research & Education 36 The New England Region Cyanobacteria Monitoring Program: A Pilot Study 41 Innovation to Protect Our Water
42 Student Corner48 Literature Search

8 Summer 2015 / NALMS • LAKELINE
FromJennifer Grahamand Keith Loftin
the Editor
LakeLine encourages letters to the editor. Do you have a lake-related question? Or, have you read something in LakeLine that stimulates your interest? We’d love to hear from you via e-mail, telephone, or postal letter.
True to the NALMS biennial tradition for LakeLine, the theme of the summer 2015 issue is harmful algal
blooms (HABs). It is difficult to believe that our first HAB-themed issue, entitled Toxic Algae, was published in summer 2006. The amount of knowledge the scientific community has gained and passed on to the general public about HABs since that first issue is impressive. Harmful algal blooms are now a part of our national dialog. The Harmful Algal Bloom and Hypoxia Research and Control Amendments Act (HABHRCA) was reauthorized in 2014 (S.1254). With the reauthorization, inland freshwater harmful algal blooms have been recognized as an issue of national concern and importance alongside harmful algal blooms in the Great Lakes and marine environments. The United States Environmental Protection Agency (U.S. EPA) has been mandated by HABHRCA 2014 to:
“(1) research the ecology and impacts of freshwater harmful algal blooms; (2) forecast and monitor
event response to freshwater harmful algal blooms in lakes, rivers, estuaries, and reservoirs; and (3) ensure that activities carried under this Act focus on new approaches to addressing freshwater harmful algal blooms and are not duplicative of existing research and development programs authorized by this Act or any other law.” (https://www.congress.gov/bill/113th-congress/senate-bill/1254)
While many academic, local, state, and federal agencies have historically done a tremendous amount of research on and management of inland HAB issues including the U.S. EPA, the time seemed appropriate to see how the U.S. EPA is currently approaching the inland HAB issue and addressing HABHRCA 2014. This HAB-themed issue of LakeLine is focused on the wide-range of efforts the U.S. EPA has been involved in to facilitate understanding and ensure safe and reliable water resources well into the future.
We begin this issue with the Senior Policy Advisor for Water at the U.S. EPA, Ellen Gilinsky, who gives her perspectives on protecting our water resources from HABs. The second story, by Antonio Bravo, with the U.S. EPA Office of Water, describes its HAB Awareness Campaign, which kicked off in 2013 and has been an excellent mechanism for building partnerships. The 2014 HAB Photo Contest is one example of a successful partnership forged as part of the HAB Awareness Campaign. The U.S. EPA teamed up with the National Environmental Education Foundation (NEEF) and NALMS for the contest, discussed in the third story by Rebecca Long (U.S. EPA Office of Wetlands, Oceans, and Watersheds), Jennifer Graham (NALMS Region VII director at the time of the contest), and Sarah Blount (NEEF). The contest was a great success, and several NALMS Inland HAB Committee members served as judges. Hannah Holsinger, Office of Ground Water and Drinking Water, describes the U.S. EPA drinking water program’s risk management processes as well as the building blocks necessary to develop cyanotoxin regulations. Next, Darren Lytle and Nick Dugan, Office of Research and Development, discuss some of the U.S. EPA’s ongoing research about cyanotoxin removal during drinking water treatment processes, with a focus on Toledo, Ohio, which attracted National
From the Editor
This summer 2015 issue of LakeLine is chock full of information. We continue with our biennial summer tradition of presenting an issue devoted to the latest on harmful algae blooms (HABs). Our guest editors, Jennifer Graham and Keith Loftin, introduce the theme articles in their “From the Guest Editors” article that follows. NALMS is gearing up for its 35th Annual Symposium to be held November 17–20, 2015 in Saratoga Springs, NY. We include four pages of symposium information as well as calls for nominations for
the annual NALMS elections and awards. Don’t forget to capture your best and favorite lake images to submit to the annual NALMS Photo Contest, which is judged at the Symposium. Have a safe summer and see you in Saratoga!
~ Bill Jones

Summer 2015 / NALMS • LAKELINE 9
attention last summer when a toxic HAB resulted in a water advisory. In the article that follows, Betty Kreakie and her colleagues in the Office of Research and Development explain computational ecology and how it may help identify lakes and reservoirs that are at risk for HAB development. The next three articles in our themed issue focus on efforts to inform and involve citizens in HAB issues through the development of mobile applications and other innovative approaches. Lahne Mattas-Curry and her colleagues in the Office of Research and Development discuss an ongoing project to translate satellite imagery into data that can be used in a mobile application to inform managers and lake users about potential HAB risk. The Phytoplankton Monitoring Network, a National Oceanic and Atmospheric Administration (NOAA) effort supported by the U.S. EPA, relies on citizen scientists, web-based tools, and mobile applications to monitor HABs in coastal areas. Steven Morton (NOAA) and Shawn Gano (Gano Technologies) describe Network goals, technology, and plans to expand the Network to inland waters. Hilary Snook, working under the Office of Environmental Management and Evaluation, describes a regional, citizen-based HAB monitoring program in New England that is utilizing a combination of traditional water-quality sampling approaches and emerging techniques, such as microscope applications for
smartphones. These articles demonstrate just how much motivated citizens and innovative approaches can contribute to our understanding of HABs and protect the public from recreational exposure to cyanotoxins during HABs. The articles in this LakeLine issue clearly demonstrate the role partnerships and technology will play in future HAB research. Co-sponsored by numerous federal agencies and other groups, the nutrient sensor challenge is described by Denice Shaw, with the U.S. EPA Office of Research and Development. Nutrient pollution is one of many causes of HABs. As nutrient sensors become more reliable, we will be able to describe nutrient dynamics and the role they play in HAB development in unprecedented ways. Finally, our themed issue is rounded out by a Student Corner article by Mary Coyle, a Ph.D. student at the University of Idaho, about Didymosphenia geminata (D. geminata), commonly referred to as “Didymo” or “rock snot.” Many of us tend to associate freshwater HABs with high nutrient concentrations and cyanobacteria in lakes and reservoirs. Mary’s article on D. geminata, sends a very clear message that this is not always the case. Blooms of this diatom tend to occur in very nutrient poor streams, and phosphorus addition is being explored as a potential management tool. This article serves as a reminder that HABs are a complex issue in need of balanced and measured solutions. There are many HAB-forming organisms that
may affect aquatic ecosystem health and a solid understanding of the organisms and the causes of bloom formation are critical to developing effective mitigation and management strategies.
Jennifer Graham is a research hydrologist with the U.S. Geological Survey in Lawrence, Kansas. She has studied harmful algal blooms in the United States for the past 16 years. Jennifer serves as a co-chair of the NALMS Inland HAB Program, is an associate editor for Lake and Reservoir Management, and served as the Region 7 Director for NALMS from 2011–2014.
Keith Loftin is a research chemist and environment engineer with the U.S. Geological Survey’s Organic Geochemistry Research Laboratory in Lawrence, Kansas. He has investigated national occurrence, fate, transport, and effects of harmful algal blooms and associated toxins and developed supporting analytical methods over the past 11 years. Keith serves as the co-lead of the Inland HAB Discussion Group (http://www2.epa.gov/nutrient-policy-data/inland-hab-discussion-group) and an ex officio member representing the USGS on the National HAB committee (http://www.whoi.edu/page.do?pid=13935). c
What is NALMS membership about?Connection
Long-time members value the partnerships and friendships they’ve made through NALMS most. These connections range from information exchanges all the way to shared vacations. Whether you engage through our conference or social media, it’s clear that the connections you make in NALMS will be your most lasting member benefit.
Opportunity
NALMS offers resources to help you become a better professional, to learn about what works, and to boost your profile among your peers. LakeLine magazine and the LRM journal are rungs as you climb up the professional ladder. As you grow professionally membership also gives you the chance to move us closer to a world that better manages and protects its water resources.
Duty
When you join NALMS you commit to aiding our mission to foster the management and protection of lakes and reservoirs. Even if you can’t serve on the board, write a paper, or volunteer, your membership helps grow NALMS and expands the reach of our programs to your personal network.

10 Summer 2015 / NALMS • LAKELINE
FromReed Green the President
The NALMS 2015 year is about halfway over and there are a lot of exciting things happening, or soon
to be happening. The mid-term board meeting was held April 19 in Glencoe, Illinois (Chicago) at the Chicago Botanic Garden. Bob Kirschner graciously hosted the meeting,
took care of all the logistics, everything for the NALMS executive committee and board members during our stay in Highland Park/Glencoe. I can’t thank Bob enough for his efforts and sacrifice to make sure our stay and meeting
was productive and successful. We accomplished a lot during the meeting and there’s more work to be done. Below is a photo of everyone; even Ron Zurawell (Region 12 Director) who remotely linked into the meeting is in the picture. Can you find Ron in the picture? Bob’s out of the picture because he was at the camera. Bill Jones also attended the meeting, but not in the picture. It was a great meeting – hard work, good fellowship, lots accomplished – much more to do! As many of you may (or may not) know, NALMS is proud to announce the addition of the Secchi Dip-in to its roster of programs. In April, founder Dr. Robert Carlson agreed to transfer the Dip-in and its related copyrights, trademarks, and
website to the care of NALMS. In turn NALMS agreed to support the Dip-in and appoint a committee to manage it. In the past two months, the Secchi Dip-In website has been updated (www.secchidipin.org) and press releases (http://tinyurl.com/kf2ev5n) have been sent out. We’re in the process of contacting all the former Secchi Dip-In participants (at the time of this writing), and promoting it through social media and other resources to get others involved, as well. All of this is part of NALMS’ annual Lake Appreciation Month (http://tinyurl.com/ljwjyvj) this July. We’ve started a dialog with USEPA and GLEON to beta test GLEON’s Lake Observer mobile smart-phone app (http://gleon.org/research/

Summer 2015 / NALMS • LAKELINE 11
projects/lake-observer-mobile-app) for on-site recording and uploading of Secchi disk measurements, GPS position, and other metadata like textual comments and photographs of lake condition. NALMS submitted, back in the winter months, a couple of grant proposals to assist in the support the Secchi Dip-In. Unfortunately, neither of these applications were selected for funding. However, we continue to look for opportunities to bring in outside resources to help support the Secchi Dip-In. I encourage everyone in NALMS to take part and support the 2015 Secchi Dip-In. Preparations continue for the 35th International Symposium in Saratoga Springs New York, November 17–20 (NALMS35). Abstract submission will have closed by the time you read this; registration will open soon. It’s going to be a great conference! The local host committee, New York State Federation of Lake Associations, has been working hard, along with NALMS staff and conference advisory liaison Jeff Schloss to get all the logistics planned, workshops, programs and all. There’s going to be some new workshops at NALMS35 like GIS applications for water resources professionals, lake ecology primer, real-time test systems for cyanotoxins, and zebra and quagga mussel management. Sessions include history of Adirondack Park, acid rain reduction in the Adirondack Park, Great Lakes restoration initiative, harmful algal blooms, shoreline restoration, boat launch stewardship, citizen science, invasive species control, hydrilla management, lake management in the Finger Lakes, and Lake Champlain-Lake George research management. Events will include NALMS new member welcome and reception, Saratoga Springs pub crawl, the annual NALMS membership meeting, exhibitors’ reception and poster session, Clean Lakes Classic 5K run/walk, Certified Lake Manager/Professional Luncheon, and the NALMS award reception and banquet at the historic Canfield Casino. See www.NALMS.org for more information. Hope to see everyone there. This edition of LakeLine comes at the most opportune time. Inland harmful algal blooms (HABs) have to be dealt with; the 2015 HAB season is upon us.
The Harmful Algal Bloom and Hypoxia Research and Control Amendments Act (HABHRCA) was reauthorized in 2014, which is good news. And just recently, the U.S. Environmental Protection Agency issued health advisory values that states and utilities can use to protect us from elevated levels of algal toxins in drinking water (http://tinyurl.com/lk58gau). The American Water Works Association also recently released its publication, A Water Utility Manager’s Guide to Cyanotoxins
(http://tinyurl.com/kpbxvov). All of these are good reads and resources to have on hand as we approach the 2015 HAB season. Enjoy this edition of LakeLine.
Reed Green has worked for the USGS in Little Rock, Arkansas, for over 25 years monitoring, assessing, and modeling water quality in lakes and reservoirs. Prior to that, he worked in the USACE Aquatic Plant Control Research Program in Vicksburg, Mississippi. c
SolarBee put the sparkle back in our raw water reservoir
Medora Corporation • Dickinson, ND • 866-437-8076 • www.medoraco.com
Unsightly and unhealthy blue-green algae blooms in Hatcher Reservoir were costing Pagosa Springs Sanitation District a fortune in copper sulfate and activated carbon filters. The District installed SolarBee® SB10000 mixers and saw immediate improvement. The blooms disappeared, as did levels of source water TOCs. The District installed SolarBee mixers in the water tanks, too — where thorough mixing virtually eliminates temperature stratification and water stagnation. SolarBee mixers eliminate something else, too: Customer complaints about water taste and odor.
Put the sparkle back in your raw water reservoir.
Read our case studies: www.medoraco.com/rawwater
Brands of Medora Corporation
Art Holloman, Water SuperintendentPagosa Springs (Colorado) sanitation district
“Since SolarBee got a hold of the lake, the water quality improved dramatically. Our lakes are clear, our tanks are clean, our water is great!”
Medora Corp.’s proven mixing technology for lakes and ponds is now offered in GridBee® electric mixers.http://lakes.medoraco.com
12 Summer 2015 / NALMS • LAKELINE
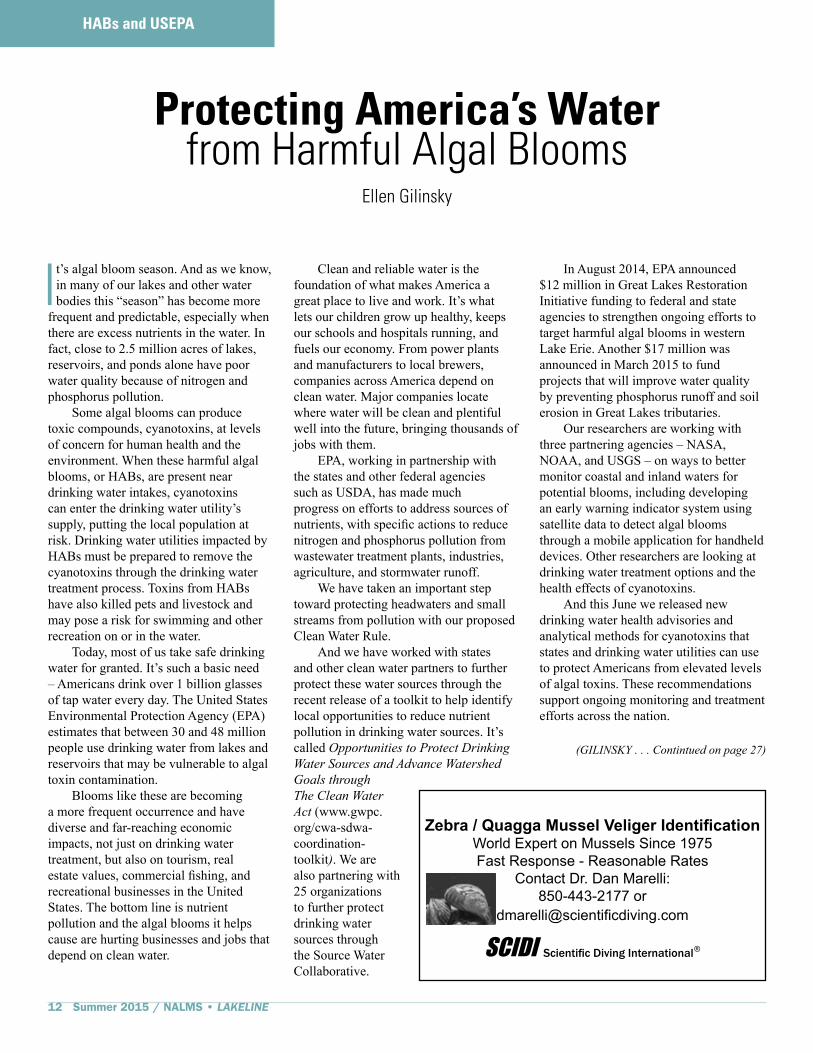
Protecting America’s Water from Harmful Algal Blooms
Ellen Gilinsky
HABs and USEPA
It’s algal bloom season. And as we know, in many of our lakes and other water bodies this “season” has become more
frequent and predictable, especially when there are excess nutrients in the water. In fact, close to 2.5 million acres of lakes, reservoirs, and ponds alone have poor water quality because of nitrogen and phosphorus pollution. Some algal blooms can produce toxic compounds, cyanotoxins, at levels of concern for human health and the environment. When these harmful algal blooms, or HABs, are present near drinking water intakes, cyanotoxins can enter the drinking water utility’s supply, putting the local population at risk. Drinking water utilities impacted by HABs must be prepared to remove the cyanotoxins through the drinking water treatment process. Toxins from HABs have also killed pets and livestock and may pose a risk for swimming and other recreation on or in the water. Today, most of us take safe drinking water for granted. It’s such a basic need – Americans drink over 1 billion glasses of tap water every day. The United States Environmental Protection Agency (EPA) estimates that between 30 and 48 million people use drinking water from lakes and reservoirs that may be vulnerable to algal toxin contamination. Blooms like these are becoming a more frequent occurrence and have diverse and far-reaching economic impacts, not just on drinking water treatment, but also on tourism, real estate values, commercial fishing, and recreational businesses in the United States. The bottom line is nutrient pollution and the algal blooms it helps cause are hurting businesses and jobs that depend on clean water.
Clean and reliable water is the foundation of what makes America a great place to live and work. It’s what lets our children grow up healthy, keeps our schools and hospitals running, and fuels our economy. From power plants and manufacturers to local brewers, companies across America depend on clean water. Major companies locate where water will be clean and plentiful well into the future, bringing thousands of jobs with them. EPA, working in partnership with the states and other federal agencies such as USDA, has made much progress on efforts to address sources of nutrients, with specific actions to reduce nitrogen and phosphorus pollution from wastewater treatment plants, industries, agriculture, and stormwater runoff. We have taken an important step toward protecting headwaters and small streams from pollution with our proposed Clean Water Rule. And we have worked with states and other clean water partners to further protect these water sources through the recent release of a toolkit to help identify local opportunities to reduce nutrient pollution in drinking water sources. It’s called Opportunities to Protect Drinking Water Sources and Advance Watershed Goals through The Clean Water Act (www.gwpc.org/cwa-sdwa-coordination-toolkit). We are also partnering with 25 organizations to further protect drinking water sources through the Source Water Collaborative.
In August 2014, EPA announced $12 million in Great Lakes Restoration Initiative funding to federal and state agencies to strengthen ongoing efforts to target harmful algal blooms in western Lake Erie. Another $17 million was announced in March 2015 to fund projects that will improve water quality by preventing phosphorus runoff and soil erosion in Great Lakes tributaries. Our researchers are working with three partnering agencies – NASA, NOAA, and USGS – on ways to better monitor coastal and inland waters for potential blooms, including developing an early warning indicator system using satellite data to detect algal blooms through a mobile application for handheld devices. Other researchers are looking at drinking water treatment options and the health effects of cyanotoxins. And this June we released new drinking water health advisories and analytical methods for cyanotoxins that states and drinking water utilities can use to protect Americans from elevated levels of algal toxins. These recommendations support ongoing monitoring and treatment efforts across the nation.
Zebra / Quagga Mussel Veliger IdentificationWorld Expert on Mussels Since 1975Fast Response - Reasonable Rates
Contact Dr. Dan Marelli:850-443-2177 or
Scientific Diving InternationalSCIDI ®
(GILINSKY . . . Contintued on page 27)

Summer 2015 / NALMS • LAKELINE 13
HABs and USEPA
Building Public Awareness About HABs and Nutrient Pollution
Antonio Bravo
Nutrient pollution is one of America’s most widespread, costly, and challenging
environmental problems. The United States Environmental Protection Agency (EPA) has made progress working with the states and other federal partners on efforts to address sources of nitrogen and phosphorus, and on tailoring specific actions to reduce nitrogen and phosphorus pollution from wastewater plants, industrial facilities, and agricultural and stormwater runoff. Clearly, much is being done on the technical side to reduce nutrient pollution, yet there is recognition that the general public may not fully understand the basic association between nutrient pollution and algal blooms, nor how nutrient pollution can impact their communities and livelihoods. The U.S. EPA is working to expand partnerships in the effort to further engage and educate the public about the effects of nutrient pollution and algal blooms (Figure 1). Partnerships play an important role in building public awareness about nutrient pollution and its association with algal blooms, the sometimes toxic and always unsightly muck that plagues our rivers and lakes. In 2013, the EPA’s Office of Wetlands, Oceans, and Watersheds brought together federal and state agencies, non-government organizations, and academic and research institutions working on various aspects of harmful algal blooms (HABs) to share technical information about research and monitoring efforts underway, and to explore approaches for enhancing general communication, outreach, and education efforts to the general public. These partners agreed to collaborate through EPA’s Harmful Algal Bloom Awareness Campaign. The partnership would include – among other things – developing a
Figure 1: Algal Bloom as seen from the air. Photo by Bill Yates.
This partnership has allowed organizations to share their expertise with audiences that they didn’t reach before. For example, the Humane Society of America and the American Kennel Club (AKC) facilitated communication between the EPA and pet owners about the risks of HABs to their dogs and cats. The EPA also worked with these groups to share and promote articles posted online and in magazines about HABs and pets, such as one in the AKC online magazine titled, “Summertime Algae Raise Concerns for Dog Lovers.” The EPA also produced a brief video titled “When in Doubt, Stay Out: Protect your Pooch from Harmful Algal Blooms” about a pet owner who heeds a warning sign and prevents his dog from jumping in a lake in his local park. In turn, EPA hosted and promoted a series of webcasts about the
social media campaign, HAB information clearinghouse, informational webinar series, public service announcements, and a public photo contest to raise awareness about algal blooms and their impact on communities.
HAB Awareness Campaign Partners include the Centers for Disease Control (CDC), North American Lake Management Society (NALMS), U.S. Geological Survey (USGS), the Association of State and Territorial Health Officials, Woods Hole Oceanographic Institution, Resource Media-Nitrogen News, World Resources Institute, the National Environmental Education Foundation, Maryland Department of Health, Kansas Department of Health, the American Kennel Club, and the Humane Society of America.

14 Summer 2015 / NALMS • LAKELINE
issue, letting researchers from institutions like the University of North Carolina, State partners like the Florida Department of Health, and federal partners like the USGS and NOAA, share their expert knowledge with the EPA’s network of water quality professionals. NALMS kicked-off its 2013 Lakes Awareness Month as part of the HAB Awareness Webinar series (Figure 2). This awareness campaign grows every year, with new opportunities and new ideas budding all the time. In 2014, the National Environmental Education Foundation (NEEF) and the North American Lake Management Society (NALMS) partnered with EPA on an Algal Bloom Photo Contest to bring attention to algal blooms and their association with nutrient pollution and impact on communities. Because algal blooms are a visible manifestation of nutrient pollution, they present an excellent opportunity for public education and outreach by EPA
Figure 2: Reflecting Pool, Washington, DC. Potomac River, Chesapeake Bay watershed. USEPA photo by Eric Vance.
Figure 3: Reflecting Pool, Washington, DC. Potomac River, Chesapeake Bay watershed. USEPA photo by Eric Vance,
and federal, state, and non-governmental organization partners. The more than 100 photos submitted by the public will comprise EPA’s photo library for algal blooms, be used to illustrate the prevalence and impacts of algal blooms in the country, and will almost certainly generate conversation that will lead individuals to protect water quality where they live (Figure 3). There are significant challenges that communities across the nation are facing related to HABs, algal toxins, and nutrient pollution in their waters. Helping communities’ deal with this public health issue is a priority for the Agency and building public awareness is a critical part in the fight against nutrient pollution and HABs. All of the partners involved in EPA’s HAB Awareness Campaigns will almost surely continue to be called upon to provide timely and factual information on HABs, their occurrence, and environmental and public health impacts,
and will continue to engage and educate the public to reduce these issues for future generations (Figure 4).
For more information on the EPA’s work to reduce nutrient pollution and to engage and educate the public about harmful algal blooms, please visit www2.epa.gov/nutrientpollution or http://www2.epa.gov/nutrientpollution/harmful-algal-blooms.
Antonio Bravo leads national education and outreach efforts to support programs to protect and restore America’s aquatic ecosystems. He has led national and international environmental outreach efforts for the past 26 years, and is currently building public awareness about nutrient pollution and coastal and wetlands protection in EPA’s Office of Water. c

Summer 2015 / NALMS • LAKELINE 15
Listing of 2013/2014 Webinars and Presenters:
2013 Webinar Series
1. Overview of Harmful Algal Blooms and their Impacts on Marine and Freshwater Ecosystems; Jennifer Graham/USGS-NALMS, Quay Dortch/NOAA
2. Perspectives on the Impact to Public Health of Harmful Algal Blooms; Lorrie Backer/CDC, Andy Reich/Florida Department of Health
3. Innovations on HAB Monitoring and Taxonomy and Citizen Science; Don Anderson/Woods Hole Oceanographic Institute, Steve Morton/NOAA
4. Linking Nutrient Pollution and HABs: State of the Science and EPA Actions; Hans Paerl/UNC-Chapel Hill, Ellen Gilinsky/EPA, Mario Sengco/EPA
2014 Webinar Series
5. The Role of Citizen Scientists in Harmful Algal Bloom Monitoring and Response; Steve Morton/NOAA, Tom Conry/Waco Water Utilities Services
6. Explaining and Reporting on Harmful Algal Blooms to the Public; Cat Lazaroff/Resource Media, and Kate Golden/WisconsinWatch.org
7. How to Protect Your Drinking Water from Harmful Algal Blooms; Karen Sklenar/The Cadmus Group, Tom Conry/Waco Water Utilities Services
8. When Green Goes Bad: An Interdisciplinary Approach to Better Understand Cyanobacteria, Nutrients, and Lakes; Jeff Hollister and Betty Kreakie from EPA’s Office of Research and Development, Atlantic Ecology Division at the Narragansett Laboratory in Rhode Island
Recordings for the final three are available online at: http://www.epa.gov/watershedwebcasts
Figure 4. The American Kennel Club (AKC) facilitated communication between the EPA and pet owners about the risks of HABs to their dogs and cats through articles published online and in their magazine.
16 Summer 2015 / NALMS • LAKELINE
HABs and USEPA
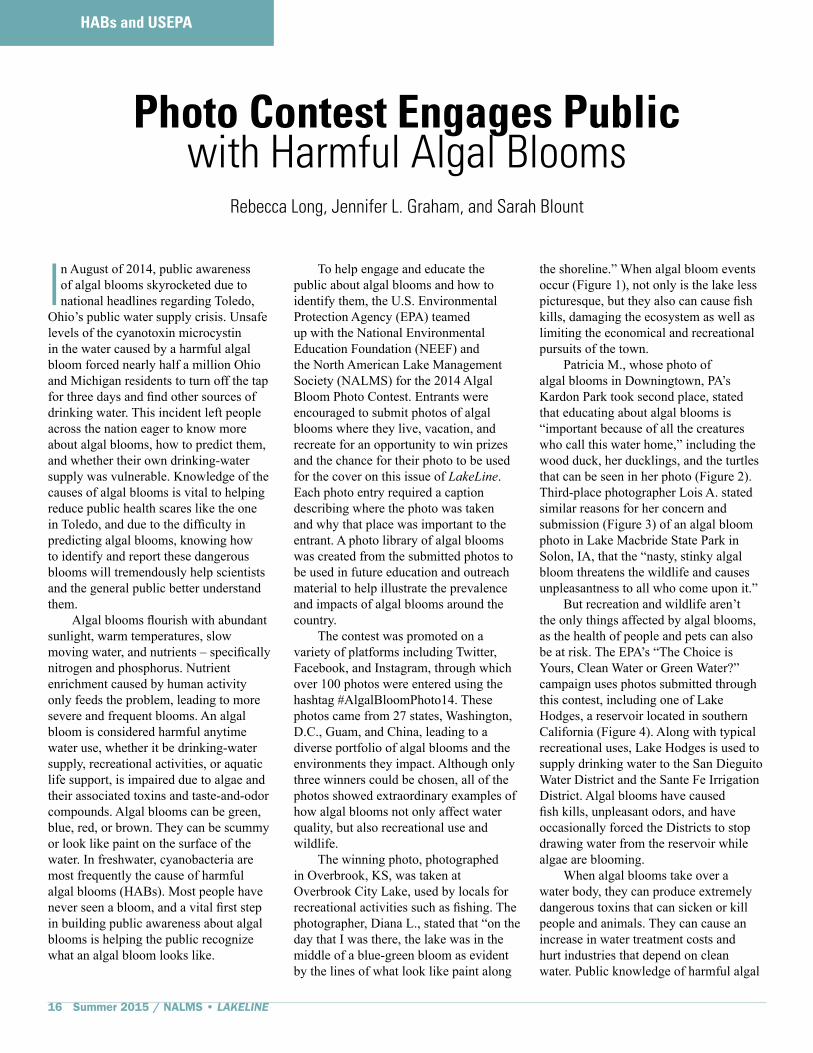
Photo Contest Engages Public with Harmful Algal Blooms
Rebecca Long, Jennifer L. Graham, and Sarah Blount
In August of 2014, public awareness of algal blooms skyrocketed due to national headlines regarding Toledo,
Ohio’s public water supply crisis. Unsafe levels of the cyanotoxin microcystin in the water caused by a harmful algal bloom forced nearly half a million Ohio and Michigan residents to turn off the tap for three days and find other sources of drinking water. This incident left people across the nation eager to know more about algal blooms, how to predict them, and whether their own drinking-water supply was vulnerable. Knowledge of the causes of algal blooms is vital to helping reduce public health scares like the one in Toledo, and due to the difficulty in predicting algal blooms, knowing how to identify and report these dangerous blooms will tremendously help scientists and the general public better understand them. Algal blooms flourish with abundant sunlight, warm temperatures, slow moving water, and nutrients – specifically nitrogen and phosphorus. Nutrient enrichment caused by human activity only feeds the problem, leading to more severe and frequent blooms. An algal bloom is considered harmful anytime water use, whether it be drinking-water supply, recreational activities, or aquatic life support, is impaired due to algae and their associated toxins and taste-and-odor compounds. Algal blooms can be green, blue, red, or brown. They can be scummy or look like paint on the surface of the water. In freshwater, cyanobacteria are most frequently the cause of harmful algal blooms (HABs). Most people have never seen a bloom, and a vital first step in building public awareness about algal blooms is helping the public recognize what an algal bloom looks like.
the shoreline.” When algal bloom events occur (Figure 1), not only is the lake less picturesque, but they also can cause fish kills, damaging the ecosystem as well as limiting the economical and recreational pursuits of the town. Patricia M., whose photo of algal blooms in Downingtown, PA’s Kardon Park took second place, stated that educating about algal blooms is “important because of all the creatures who call this water home,” including the wood duck, her ducklings, and the turtles that can be seen in her photo (Figure 2). Third-place photographer Lois A. stated similar reasons for her concern and submission (Figure 3) of an algal bloom photo in Lake Macbride State Park in Solon, IA, that the “nasty, stinky algal bloom threatens the wildlife and causes unpleasantness to all who come upon it.” But recreation and wildlife aren’t the only things affected by algal blooms, as the health of people and pets can also be at risk. The EPA’s “The Choice is Yours, Clean Water or Green Water?” campaign uses photos submitted through this contest, including one of Lake Hodges, a reservoir located in southern California (Figure 4). Along with typical recreational uses, Lake Hodges is used to supply drinking water to the San Dieguito Water District and the Sante Fe Irrigation District. Algal blooms have caused fish kills, unpleasant odors, and have occasionally forced the Districts to stop drawing water from the reservoir while algae are blooming. When algal blooms take over a water body, they can produce extremely dangerous toxins that can sicken or kill people and animals. They can cause an increase in water treatment costs and hurt industries that depend on clean water. Public knowledge of harmful algal
To help engage and educate the public about algal blooms and how to identify them, the U.S. Environmental Protection Agency (EPA) teamed up with the National Environmental Education Foundation (NEEF) and the North American Lake Management Society (NALMS) for the 2014 Algal Bloom Photo Contest. Entrants were encouraged to submit photos of algal blooms where they live, vacation, and recreate for an opportunity to win prizes and the chance for their photo to be used for the cover on this issue of LakeLine. Each photo entry required a caption describing where the photo was taken and why that place was important to the entrant. A photo library of algal blooms was created from the submitted photos to be used in future education and outreach material to help illustrate the prevalence and impacts of algal blooms around the country. The contest was promoted on a variety of platforms including Twitter, Facebook, and Instagram, through which over 100 photos were entered using the hashtag #AlgalBloomPhoto14. These photos came from 27 states, Washington, D.C., Guam, and China, leading to a diverse portfolio of algal blooms and the environments they impact. Although only three winners could be chosen, all of the photos showed extraordinary examples of how algal blooms not only affect water quality, but also recreational use and wildlife. The winning photo, photographed in Overbrook, KS, was taken at Overbrook City Lake, used by locals for recreational activities such as fishing. The photographer, Diana L., stated that “on the day that I was there, the lake was in the middle of a blue-green bloom as evident by the lines of what look like paint along

Summer 2015 / NALMS • LAKELINE 17
Figure 1. The winning photo in the 2014 HAB photo contest. Photo taken by Diana L. in Overbrook, KS.
Figure 2. The second-place photo in the 2014 HAB photo contest. Photo taken by Patricia M. in Downingtown, PA.
blooms, their causes, and their effects is needed to help alleviate the problem. The 2014 Algal Bloom photo contest engaged over 100 participants to identify and think about algal blooms and how the blooms impact their communities. The many photos submitted will be used by federal, state, and non-government organization partners to continue to engage the public through outreach efforts. Thank you to all who participated and for your creative contributions to this effort!
If you would like to view more of the photos submitted to the 2014 Algal Bloom Photo contest, please visit the National Environmental Education Foundation’s website at: http://neefusa.org/algalbloomcontest.
Selected ReferencesBacker, L.C. Manassaram-Baptiste,
D., LePrell, R. and Bolton, B. 2015. Cyanobacteria and algae blooms: review of health and environmental data form the harmful algal bloom-related

18 Summer 2015 / NALMS • LAKELINE
illness surveillance system (HABISS) 2007-2011: Toxins, 7: 1048-1064.
Chorus, I. and J. Bartram (Eds.). 1999. Toxic Cyanobacteria in Water. London: World Health Organization. 416 p.
Falconer, I.R. 2005. Cyanobacterial toxins of drinking water supplies –Cylindrospermopsins and microcystins. CRC Press, Boca Raton, Florida. 279 p.
Graham, J.L. 2006. Harmful algal blooms: U.S. Geological Survey Fact Sheet 2006-3147.
Hudnell, H.K. (Ed.). 2008. Cyanobacterial harmful algal blooms. Springer, New York. 949 p.
Huisman, J., H.C.P. Matthijs and P.M. Visser (Eds.). 2005. Harmful Cyanobacteria. Springer, the Netherlands. 241 p.
Rebecca Long is an Oak Ridge Institute for Science and Education (ORISE) research participant in the Policy, Communications, and Resource Management Staff branch in EPA’s Office of Wetlands, Oceans, and Watersheds. Rebecca is an environmental geologist from Virginia and currently works on communications and outreach issues.
Jennifer Graham is a research hydrologist with the U.S. Geological Survey in Lawrence, Kansas. She has studied harmful algal blooms in the United States for the past 16 years. Jennifer serves as a co-chair of the NALMS Inland HAB Program and served as the Region 7 Director for NALMS from 2011-2014.
Sarah Blount is a research associate for the Weather and Environment Program at the National Environmental Education Foundation, where she researches and writes about links between climate, weather and the natural world. c
Figure 3. The third-place photo in the 2014 HAB photo contest. Photo taken by Lois A. in Solon, IA.
Figure 4. The EPA’s “The Choice is Yours. Clean Water or Green Water?” campaign uses photos from the 2014 HAB photo contest, including the image of Lake Hodges Reservoir, CA, depicted here.
Cyanotoxins in Drinking Water:Filling the Data Gaps
Hannah Holsinger

Summer 2015 / NALMS • LAKELINE 19
HABs and USEPA
Cyanotoxins in Drinking Water:Filling the Data Gaps
Hannah Holsinger
The United States Environmental Protection Agency (EPA) and the Safe Drinking Water Act (SDWA)
play vital roles in protecting public health from contaminants that may occur in drinking water. The SDWA was passed by Congress in 1974 and amended in 1986 and 1996. The Act authorizes EPA to establish national primary drinking water regulations (NPDWRs) to protect public health. Currently, there are no NPDWRs for cyanotoxins (USEPA 2014a). In order for EPA to decide to develop a NPDWR for cyanotoxins, the agency would consider whether cyanotoxins are likely to cause an adverse effect on the health of persons, are known or
likely to occur in public water systems at a frequency and level of public health concern, and in the sole judgment of the EPA Administrator, a regulation presents a meaningful opportunity to reduce risk to persons served by public water systems, per SDWA Section 1412(b)(1)(A). Health effects information and drinking water monitoring data are key building blocks upon which a decision to develop or not develop a regulation for cyanotoxins would be dependent. This article points out areas where additional data could facilitate a decision as to whether to develop a cyanotoxin regulation. Figure 1 depicts the drinking water program’s risk management processes and
indicates steps throughout the processes where public input is requested. These processes guide EPA to take the necessary regulatory steps to address possible public health risks from unregulated contaminants, such as cyanotoxins, should it be necessary.
Contaminant Candidate List Cyanotoxins have the potential to occur in sources of drinking water and are associated with adverse human health risks (USEPA 2014a; WHO 1999). Cyanotoxins, including anatoxin-a, microcystin-LR, and cylindrospermopsin are on the most recent draft fourth Contaminant Candidate List (CCL
Figure 1. Drinking Water Program Risk Management Processes (adapted from USEPA, 2014b) .

20 Summer 2015 / NALMS • LAKELINE
4) (USEPA 2015a) and have been included on previous CCLs that were published in 1998, 2005, and 2009. EPA is required by SDWA to publish a CCL every five years. A CCL is a list of unregulated contaminants that are known or anticipated to occur in public water systems and may require regulation (USEPA 2015a). In establishing a CCL, EPA uses a screening and selection process to identify unregulated contaminants with the greatest potential to occur in public water systems and which may require regulation due to potential public health concerns.
Regulatory Determination Process EPA evaluates contaminants on the CCL to determine whether the agency should initiate a rulemaking for a specific contaminant or group of contaminants in a process called “Regulatory Determination.” When sufficient information and data are available, a decision to initiate regulatory development (positive) or not to regulate (negative) is made. If a positive determination for a contaminant is made, EPA prepares a proposed NPDWR (proposed rule) for public review and comment. A final rule is subsequently prepared considering new information and public comments received on the proposed rule. The lack of sufficient information upon which to make Regulatory Determinations, often results in EPA not making Regulatory Determinations on specific contaminants. EPA uses the CCL process to prioritize research and data collection efforts to acquire information that will facilitate Regulatory Determinations (USEPA 2013). For additional information on the CCL and Regulatory Determination processes, please see www2.epa.gov/ccl.
Routes to Obtain Additional Contaminant Information EPA uses the best available health effects and occurrence data when determining whether to regulate a contaminant. At this time, there is limited drinking water occurrence (frequency, location, and concentration) data for cyanotoxins. Inclusion of cyanotoxins on the CCL communicates to government agencies, the academic community, and other interested stakeholders the need
for more health effects and monitoring information. EPA’s Unregulated Contaminant Monitoring Regulation (UCMR) program considers the CCL when determining which contaminants to include in its drinking water monitoring program. While not all CCL contaminants are included in the UCMR program, the CCL helps inform the priorities of the UCMR program. The UCMR program collects nationwide monitoring data from public drinking water systems for no more than 30 unregulated contaminants every five years. If the EPA determines that additional cyanotoxin occurrence data would help inform future agency decision making, the agency would consider including cyanotoxins in the next UCMR monitoring program. Cyanotoxins were not monitored in previous UCMRs. They were removed from the selection process due to the need for analytical method improvements (USEPA 2012). EPA recently released new methods for cyanotoxins, including microcystins and nodularin (Method 544) and cylindrospermopsin and anatoxin-a (Method 545) (USEPA 2015b, c). For more information on the UCMR selection process, please see http://water.epa.gov/lawsregs/rulesregs/sdwa/ucmr/.
Health Advisories For unregulated contaminants, such as cyanotoxins, EPA may have enough information to publish drinking water health advisories (HAs). EPA develops HAs to provide information on contaminants that are known or anticipated to occur in drinking water and that can cause human health effects. HAs provide non-enforceable contaminant concentrations at which adverse human health effects are not anticipated to occur over a specified duration (e.g., one-day, ten-day, lifetime). They provide technical guidance to drinking water regulators and contain information on health effects, toxicokinetics, occurrence and exposure, analytical methods, and treatment technologies associated with specific drinking water contaminants (USEPA 2014c). EPA anticipates releasing HAs for microcystin and cylindrospermopsin in summer 2015. Information in the HAs is a step forward in summarizing health and exposure effects related to cyanotoxins.
Final Thoughts EPA and partner organizations are filling data gaps related to human health risks of cyanotoxins in drinking water. The publication of health advisories will fill some of these gaps while the acquisition of occurrence data, such as through the UCMR program, would provide information that will be key to determining if addressing cyanotoxin risk through a NPDWR is appropriate. In summary, EPA provides states and utilities with information in the short-term, while following an established process to develop science-based NPDWRs, when needed.
ReferencesUSEPA. 2012. Revisions to the
Unregulated Contaminant Monitoring Regulation (UCMR 3) for Public Water Systems. Federal Register. Vol. 77, No. 85. P 26072. May 2, 2012.
USEPA. 2013. Regulating Public Water Systems and Contaminants under the Safe Drinking Water Act. Available online at http://water.epa.gov/lawsregs/rulesregs/regulatingcontaminants/basicinformation.cfm. Accessed February 25, 2015.
USEPA. 2014a. Cyanobacteria and Cyanotoxins: Information for Drinking Water Systems. EPA 810-F-11-001. Available online at http://www2.epa.gov/sites/production/files/2014-08/documents/cyanobacteria_factsheet.pdf. Accessed February 25, 2015.
USEPA. 2014b. Protocol for the Regulatory Determination 3. EPA 815-R-14-005.
USEPA. 2014c. Drinking Water Science and Regulatory Support. Available online at http://water.epa.gov/drink/standards/hascience.cfm. Accessed February 25, 2015.
USEPA. 2015a. Drinking Water Contaminant Candidate List 4 – Draft. Federal Register. Vol. 80, No. 23. P. 6076. February 4, 2015.
USEPA. 2015b. Determination of Microcystins and Nodularin in Drinking Water by Solid Phase Extraction and Liquid Chromatography/Tandem Mass Spectrometry (LC/MS/MS). EPA 600-R-14-474.
USEPA. 2015c. Method 545: Determination of Cylindrospermopsin
(HOLSINGER . . . Contintued on page 45)

Summer 2015 / NALMS • LAKELINE 21
HABs and USEPA
Harmful Algal Blooms andDrinking Water Treatment Research
Darren Lytle and Nick Dugan
In August 2014, half a million people living in and around Toledo, Ohio were issued a water advisory alerting
them to avoid all contact with tap water. A cyanobacterial harmful algal bloom (cyanoHAB) in western Lake Erie, Toledo’s water source, had produced elevated levels of microcystin toxins from the freshwater cyanobacteria, Microcystis. These toxins, which are known to cause gastrointestinal issues, upper respiratory infections, skin irritations, and at high exposure levels, liver damage, had made their way through the water treatment facility (Figure 1). Toledo’s water treatment facility, like much of the water treatment infrastructure in the United States, was designed primarily and built with particulate and microbial contaminant removal in mind. Removal of dissolved organic contaminants, such as cyanobacterial toxins, requires either capital-intensive new construction, or the addition of chemicals or adsorbents such as powdered activated carbon (PAC), which can contribute significantly to the water utility’s maintenance and operations budget (Figure 2). The Toledo, OH, facility represents one example of a facility challenged by a cyanoHAB with high levels of cyanobacterial toxins. EPA has been conducting algal bloom research at multiple facilities around Lake Erie over the past few years to help communities confront the challenge of keeping cyanobacterial toxins from reaching consumers’ taps. The first goal of this research is to determine how drinking water providers can optimize their existing facilities to maximize their treatment capabilities for removing cyanobacteria and their toxins.
Figure 1. View from Perry’s Victory and International Peace Memorial, located near South Bass Island in Lake Erie’s western basin (note the water color).
During the 2013 and 2014 algal bloom seasons, EPA researchers collected monthly samples from seven drinking water treatment facilities distributed along the Ohio shoreline of Lake Erie (see Figure 3, sites not plotted in figure). The samples were collected from six to nine locations (from different parts of the treatment system) at each facility, from May through November. The source water qualities at the facilities ranged from mildly to highly impacted by cyanobacterial blooms. The majority of the observed cyanobacterial activity was confined to the shallow, western end of the lake. Cyanobacterial blooms tend to form
in shallow, stable bodies of water that are rich in nutrients, particularly as water warms with rising spring and summer temperatures. All of the samples were analyzed for microcystins, chlorophyll-a (which represents the concentration of suspended cyanobacteria), and other chemical markers commonly associated with cyanobacterial bloom events. One significant finding from these sampling efforts was that the majority of the toxin contamination entering the treatment facilities was contained within the individual cells of the cyanobacteria, Microcystis (see Figure 4). As long as the cells remained intact, they and their

22 Summer 2015 / NALMS • LAKELINE
Figure 2. Main filter gallery at a well-maintained Lake Erie drinking water treatment facility. Although some of the instrumentation panels are of modern design, the plant itself was constructed in 1940.
associated toxins could be removed using the conventional particulate removal processes already in place. As shown in Figure 5, cell removal efficiencies often exceeded four orders of magnitude through the treatment plant. Data collected during the sampling indicated that EPA could productively
Figure 3. Geographic extent of the EPA’s Lake Erie sampling campaign (note: color temperature corresponds to water depth; deeper waters correspond to colder colors (i.e., green to blue).
Figure 4. Individual cells of the freshwater cyanobacteria, Microcystis.
focus research efforts on the early stages of treatment processes, where potassium permanganate and PAC are added. The treatment chemical potassium permanganate controls zebra mussels and reduces dissolved organic compounds responsible for bad tastes and odors. Under certain
conditions, potassium permanganate also has the potential to stimulate the release of intracellular toxins from cyanobacteria, thus increasing potential downstream risks. EPA’s research will provide water utility managers with a better understanding of how treatment processes affect cyanobacterial cells and their toxins. The knowledge gained will help inform drinking water providers in making decisions to optimize the trade-offs between competing treatment goals, human health risk reduction, and costs. As follow-up for the 2015 bloom season, EPA is planning to provide technical support to the city of Toledo’s drinking water treatment facility. Preliminary investigations of cyanobacterial toxins in drinking water treatment plant influents in the western United States will also be performed. The EPA’s drinking water engineering research effort is complemented by the development of standard analytical methods to quantify cyanobacterial toxins in different types of water ranging from raw lake water to finished drinking water. All of this work is part of an EPA drinking water research effort that has been in place since the Agency’s inception in 1970.
Selected ReferencesEPA’s Harmful Algal Blooms Home Page
(accessed April 24, 2015: http://www2.epa.gov/nutrientpollution/harmful-algal-blooms).
EPA’s Harmful Algal Bloom Research Webpage (accessed April 24, 2015:

Summer 2015 / NALMS • LAKELINE 23
Figure 5. Removal of cyanobacterial cells, using chlorophyll a as a proxy, through treatment at a Lake Erie drinking water treatment facility. Profile data are from three different sampling events during the 2014 bloom season. Differences between circled points represent removal of cells through water treatment stages designed for particulate control.
http://www2.epa.gov/water-research/harmful-algal-blooms-cyanobacteria).
EPA Fact Sheet. 2014. Evaluation of Current Water Treatment and Distribution System Optimization to Provide Safe Drinking Water from Various Source Water Types and Conditions; http://nepis.epa.gov/Exe/ZyPURL.cgi?Dockey=P100KSNR.txt.
Newcombe, G., J. Dreyfus, Y. Monrolin, C. Pestana, P. Reeve, E. Sawade, L. Ho and C. Chow. 2015. Optimizing Conventional Treatment for the Removal of Cyanobacteria and Toxins. Final Report for Water Research Foundation, Denver, CO and Water Research Australia, Adelaide, South Australia.
Westrick, J.A., D.C. Szlag, B.J. Southwell and J. Sinclair. 2010. A review of cyanobacteria and cyanotoxins removal/Inactivation in drinking water treatment. Analytical and Bioanalytical Chemistry, 397, 1705-1714.
Darren Lytle is an environmental engineer who focuses his research on drinking water contaminants and treatment technologies. He investigates corrosion control and water quality; lead and copper corrosion control; and filtration with an emphasis on removal of microbial pathogens. You can reach Darren at [email protected].
Nick Dugan is an environmental engineer who investigates the removal of organic, inorganic and particulate contaminants through a variety of water treatment processes. Nick can be reached at [email protected]. c
Please take a moment to ensure
NALMS has your
correct email and mailing
address. Log into the member-
only area of www.nalms.org to
view the information
we currently have on file.
Send any corrections to

24 Summer 2015 / NALMS • LAKELINE
HABs and EPA
Computational Ecology & Open Science: Tools to Help Manage Cyanobacteria in Lakes
Betty J. Kreakie, Jeffrey W. Hollister, Farnaz Nojavan, W. Bryan Milstead, and Lahne Mattas-Curry
We are a small group of computational ecologists tucked away in the U.S. EPA’s Office
of Research and Development lab on the coast of Narragansett Bay, Rhode Island. Over the last several years, we have been using advanced computational ecology methods and the tenets of open science to attempt to predict the probability of cyanobacteria blooms and provide access to the tools and data we develop for others to build upon. While it may be clear to us, who spend several hours a day behind a computer screen thinking about computer code and calculating uncertainty, that this work is important, most people do not know what computational ecology is. In addition, they don’t understand how computational ecology can be used to establish an adequate understanding of the inherent ecosystem uncertainty that might help us better manage lakes to reduce cyanobacteria bloom risk. The purpose of this article is to introduce the concepts of computational ecology and open science and describe why we think they will advance our understanding of cyanobacteria blooms and help us make better predictions.
What is Computational Ecology? Computational ecology is an interdisciplinary field that takes advantage of modern computation abilities to expand our ecological understanding. As computational ecologists, we combine data sets and advanced statistical/mathematical computational methods to build models that often cover broad spatial extents. This field is also fully entrenched in an ethos of open science and scientific reproducibility. Computational ecologists must have diverse skills as we are required to
master data management and curation, coding, data analysis, and visualization, in addition to our ecological expertise. Essentially, we use big computers and big data to move ecological understanding forward. The computational ecologist’s toolbox works well for exploring the complexity of cyanobacteria-related questions. All areas of ecology are complex, but this complexity increases when dealing with the cyanobacteria phylum. This phylum has high species diversity and yet the individuals are small in physical size. If you want to study polar bears, it’s fairly straightforward; you count polar bears. If you want to study cyanobacteria, what do you count? How do you count? It’s not that these questions don’t have answers, it’s that most cyanobacteria experts answer the questions in different ways. This results in substantial data uncertainty. Each method used to measure cyanobacteria has its pros and cons. This, of course, means that the models from different data sources have to be interpreted according to the limitations of the cyanobacteria data. And we haven’t even talked about the complexity involved in measuring environmental response variables and if those variables are ecologically meaningful to cyanobacteria. Given the complexity and size of the data we must look outside traditional statistical methods to analyze our data. One of our favorite computational methods is “random forest,” which we use frequently to build classifier models. This method is a machine learning approach that allows us to make robust predictions from large amounts of data with multiple data types. The random forest algorithm partitions the data into training and test data sets. Then the data are hierarchically
partitioned into increasingly more homogenous groups based on a subset of the environmental variables. The test data set is then used to measure how well we did. This process is repeated multiple times to ensure that we have captured the true signal of the data. For our most recent work, we used the U.S. EPA’s National Lake Assessment (NLA) data from 2007 to build random forest models of lake trophic status. The NLA is a probabilistic sampling of 1,000+ lakes across all eco-regions in the continental US (Figure 1). Lake trophic status was used as a proxy for cyanobacteria abundance. We can do this because we know that cyanobacteria abundance and chlorophyll-a concentrations (which are used to classify lake trophic status) are positively correlated. In other words, the amount of cyanobacteria in a lake tends to increase as the amount of chlorophyll-a increases. There are several advantages to using lake trophic status as a proxy for cyanobacteria. By using chlorophyll-a concentration based trophic status, we are not constricted by one measure of cyanobacteria. While at the same time, we are using a unit that has real world meaning to lake managers. These broad trophic state classifications are good predictors of ecosystem health, which directly relates to ecosystem services/disservices (e.g., potential for recreation, good aesthetics, and fisheries). The gold standard for understanding cyanobacteria in lakes is direct measurements of water quality variables, such as levels of nutrients, chlorophyll-a, and pigments. This requires the ability to take on site (“in situ”) samples; something that cannot realistically be done for every lake in the country. Our modeling work

Summer 2015 / NALMS • LAKELINE 25
Figure 1: Map of the 2007 National Lake Assessment survey locations. Points are color-coded according to lake trophic status.
is focused on predicting cyanobacteria bloom risk for lakes that have not been directly sampled. Empirical data from lakes are combined with remote sensing and geographic information systems (GIS) data to model bloom risk; results from this work can then be extrapolated to all lakes in the continental United States. The work is starting to shed some light on landscape factors that may contribute to elevated bloom risk (Figure 2). For example, we know that different regions of the United States have different probabilities of bloom occurrences. We are also learning how lake morphometry, as well as the surrounding land use, impact lake trophic status. As our work progresses, we are increasing the complexity of our modeling efforts by developing a Bayesian multilevel model. This approach offers numerous exciting advancements for cyanobacteria predictions. First, we are moving from using lake trophic status as a proxy for cyanobacteria to directly modeling microcystin, a common cyanobacteria hepatotoxin. We used the results of random forest modeling to select variables for inclusion in a Bayesian multilevel model of microcystin concentrations (Figure 3). Bayesian statistical methods start with prior beliefs and combines these with new information from the experiment, represented by
Figure 2: Plot of ranked mean decreased Gini from the random forest model predicting three levels of lake trophic status. This model’s predictions were based solely on GIS-derived variables. Essentially, this figure illustrates the order of variable importance in development of the model. The most important variables are longitude and latitude, which would lead us to conclude that there is a spatial gradient across the U.S. We also can conclude that there is a gradient along elevations, because elevation is the third-most important variable.
Longitude
Latitude
Elevation
Estimated Mean Lake Depth
Percent Evergreen Forest
Estimated Maximum Lake Depth
Percent Cropland
Ecoregion
70 80 90 100 110Mean Decrease Gini
the likelihood function, to form the posterior beliefs for the model parameters (Hoff 2009). Model parameters under a multilevel modeling framework are eco-region specific, but they are also assumed to be exchangeable across eco-regions for broad continental scaling (Gelman and Hill 2006; Qian et al. 2010). The exchangeability assumption ensures that both the common patterns and eco-region specific features will be reflected in the model. Furthermore, the method incorporates appropriate uncertainty estimates. This modeling approach has the added benefit of allowing us to update our assumptions when we have new data. And since the NLA is repeated every five years, we will be able to improve our base knowledge once the newest NLA data are released publically.

26 Summer 2015 / NALMS • LAKELINE
What is Open Science? All of this modelling would be impossible without open access to modern computational methods and the data that support our models. Broadly speaking, this is often referred to as “open science.” This broad area has been defined as having several components. These components suggest that “open science”:
• is transparent (and, of course, open)
• includes all parts of research (data, code, etc.)
• allows others to repeat the work
• should be posted on an open and accessible website (while protecting personally identifiable information, etc.)
• occurs along a gradient (i.e., not just a binary open vs. not open)
At the EPA, we are learning how to make our research on cyanobacteria and human health meet these criteria. We are implementing open science in three ways: (1) making our work available via open access publishing; (2) providing access to the code used in our analysis; and (3) making our data publically available. The goal of these efforts is to increase the reproducibility of our work, reach broader audiences, and eventually have a greater impact on society’s understanding and management of harmful algal blooms (HABs). Specifically, we are using the following open science channels to benefit the management of harmful algal blooms:
Open access publications: Our traditional venue for sharing research is peer-
Figure 3: Structure of the Multilevel Model: The U.S. continental, highest level, is divided into nine eco-regions. The eco-regions are divided into individual lakes (1148), lowest level.
reviewed publications. A problem with many journals is that these articles are only accessible to those who have paid to gain access. An increasingly common option is to publish in open access journals or to pay additional fees to make sure a given article is open access. Researchers in our group consistently use open access venues for our research. By taking this step we are able to reach a much broader audience with our work.
Open source software: As computational ecologists we rely on scientific software to conduct our work. A very important part of using this software is to be able to check that the methods encoded in this software are valid. The only way to do this is to use software that is open source (i.e., the code is available to review, enhance, or modify). Not only do we use open source software such as the R Language for Statistical Computing (http://www.R-project.org/), we also contribute back to the open source community. Members of our group have developed software to support modelling of lakes (e.g., lakemorpho package [http://cran.r-project.org/web/packages/lakemorpho/index.html]) and we actively use the U.S. EPA’s organizational account on Github (https://github.com/USEPA) for collaborating on code development and sharing other aspects of our work. By providing open access to our computational methods we allow others to repeat the same analyses or build from it.
Open data: The last area where we are just now starting to work is providing access to our data. As mentioned, we
strive to publish our work as open access and along with those publications, we have, when possible, made the datasets that support that work available via supplemental materials. More recently we have released a first version of a national lake morphometry dataset. Those data are available, as GIS files, from https://edg.epa.gov/clipship/ under the heading, “National Lake Morphometry.” We plan to continue improving this dataset.
Going Forward We have been using computational ecology and open science in our HABs related research for several years now and have many plans going forward. First, we are expanding our modelling efforts to include new methods and endpoints. We hope to work with managers to identify what qualities of freshwater HABs are most important to predict. Second, new data are always becoming available that can inform our work. For instance, the 2012 National Lakes Assessment data (http://water.epa.gov/type/lakes/lakessurvey_index.cfm) should be available in the very near future, citizen science efforts such as those done by Rhode Island’s Watershed Watch program have a rich trove of data that can help us better model HABs, and new cyanobacteria monitoring programs are starting to come on-line (see “New England Region Cyanobacteria Monitoring Program” in this issue). All of these will provide a fresh look at the HAB problem. In addition to these data sets, we are planning the development of a national lake database. Our lake morphometry data are the first step but we

Summer 2015 / NALMS • LAKELINE 27
envision a database with multiple sources of water quality data, a mechanism for updating the data and access provided in a variety of ways for a variety of users. In short, understanding the dynamics of lake trophic status and cyanobacteria bloom risk is an increasing concern for lake resource managers. The computational approaches we describe here, as well as conducting research via the tenets of open science, will allow us to make significant advances in cyanobacteria ecology and other related fields.
Selected ReferencesBreiman, L. 2001. Random
forests. Machine learning 45, 5-32.Hoff, P.D. 2009. A First Course in
Bayesian Statistical Methods. Springer Science & Business Media. Springer.
Gelman, A. and J. Hill. 2006. Data Analysis Using Regression and Multilevel/hierarchical Models. Cambridge University Press, 2006.
Paerl, H.W. and T.G. Otten. 2013. Harmful cyanobacterial blooms: causes, consequences, and controls. Microbial ecology, 65(4): 995-1010.
Pascual, M. 2005. Computational ecology: from the complex to the simple and back. PLoS computational biology, 1(2): e18.
Qian, S.S., T.F. Cuffney, I. Alameddine, G. McMahon and K.H. Reckhow. 2010. On the application of multilevel modeling in environmental and ecological studies. Ecology, 91(2): 355-361.
Betty Kreakie, Ph.D., is a research ecologist for the U.S. EPA’s Office of Research and Development in Narragansett, RI. Her work focuses on the development of spatially explicit, landscape level models that predict how biological populations and communities will respond to anthropogenic influences such as nutrient and contaminant inputs, climate change, and habitat conversion. You can contact Betty at [email protected].
Jeffrey Hollister is a landscape ecologist with expertise in the spatial component of ecology and environmental sciences. Since May of 2006, he has worked as a research ecologist with the
U.S. EPA’s Atlantic Ecology Division in Narragansett, RI. His current research focus is on how nutrients drive risk of cyanobacterial blooms in lakes and ponds. A unifying theme to his research is using Open Science (Open Access, Open Source, and Open Data) to benefit environmental science.
Farnaz Nojavan is an ORISE Postdoctoral Fellow, at the U.S. EPA Atlantic Ecology Division. She is broadly interested in ecological modeling, aquatic ecosystems, Bayesian statistics, risk assessment, and environmental decision analysis. A central theme in her interdisciplinary research is the use of Bayesian statistics to improve inference and prediction. Her current research draws upon Bayesian multilevel modeling and datasets from disparate sources to investigate cyanobacteria distribution, microcystin risk, and changes in the algal community in lakes of the continental United States. You may reach Farnaz at: [email protected].
Bryan Milstead is a research ecologist with the U.S. EPA in Narragansett RI. Bryan has worked extensively throughout South and North America and the Caribbean on varied research projects involving a dazzling variety of habitats and organisms. The one theme that holds all his work together is a strong interest in quantitative analysis and data management. He uses the open source R programming environment for most of his work in modeling, statistics, data manipulation, GIS, and graphics.
Lahne Mattas-Curry is a public affairs specialist in EPA’s Office of Research and Development’s Office of Science Communications. She brings nearly two decades of public relations and strategic communications experience to EPA. You can contact Lahne at [email protected]. c
(GILINSKY . . . Contintued from page 12)
Providing clean and safe water for healthy, thriving communities will require new solutions. Shifting rain patterns and seasonal temperatures across the country, in combination with increasing nutrient pollution, can lead to increases in harmful algal blooms. The science on harmful algal blooms is evolving and so are our solutions. Continued monitoring and treatment, and investment in our nation’s water infrastructure, are necessary to prevent more blooms in the future. I am encouraged by all of the great efforts going on at EPA and with our federal and state partners. When we all work together, we can adapt to new circumstances and protect our most precious resource for our children and our communities.
Ellen Gilinsky has served, since 2011, as the Senior Policy Advisor for Water at the Environmental Protection Agency. In this position Dr. Gilinsky addresses policy and technical issues related to all EPA water programs, with an emphasis on science, water quality, and state programs. Prior to this appointment she served as director of the Water Division at the Virginia Department of Environmental Quality (DEQ), where she supervised a diverse array of water quality and quantity programs, and before that as manager of the Office of Wetlands and Water Protection, helping to craft Virginia’s non-tidal wetlands regulations and permitting program. c
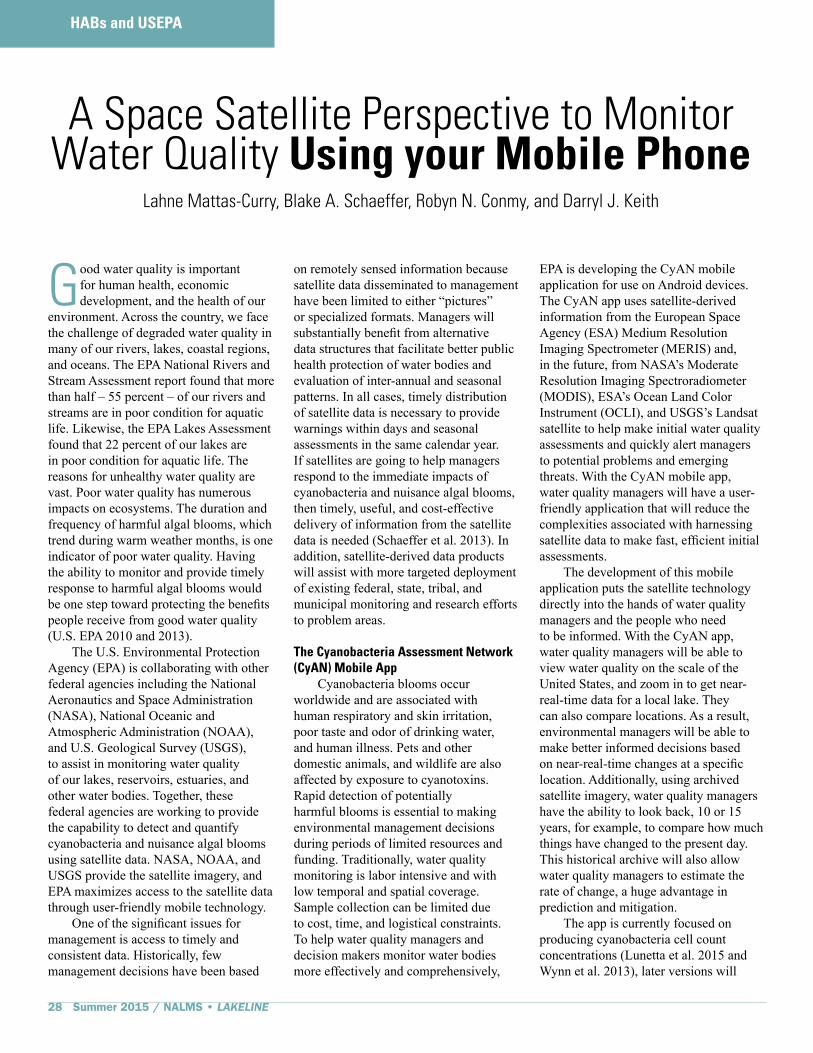
28 Summer 2015 / NALMS • LAKELINE
HABs and USEPA
A Space Satellite Perspective to Monitor Water Quality Using your Mobile Phone
Lahne Mattas-Curry, Blake A. Schaeffer, Robyn N. Conmy, and Darryl J. Keith
Good water quality is important for human health, economic development, and the health of our
environment. Across the country, we face the challenge of degraded water quality in many of our rivers, lakes, coastal regions, and oceans. The EPA National Rivers and Stream Assessment report found that more than half – 55 percent – of our rivers and streams are in poor condition for aquatic life. Likewise, the EPA Lakes Assessment found that 22 percent of our lakes are in poor condition for aquatic life. The reasons for unhealthy water quality are vast. Poor water quality has numerous impacts on ecosystems. The duration and frequency of harmful algal blooms, which trend during warm weather months, is one indicator of poor water quality. Having the ability to monitor and provide timely response to harmful algal blooms would be one step toward protecting the benefits people receive from good water quality (U.S. EPA 2010 and 2013). The U.S. Environmental Protection Agency (EPA) is collaborating with other federal agencies including the National Aeronautics and Space Administration (NASA), National Oceanic and Atmospheric Administration (NOAA), and U.S. Geological Survey (USGS), to assist in monitoring water quality of our lakes, reservoirs, estuaries, and other water bodies. Together, these federal agencies are working to provide the capability to detect and quantify cyanobacteria and nuisance algal blooms using satellite data. NASA, NOAA, and USGS provide the satellite imagery, and EPA maximizes access to the satellite data through user-friendly mobile technology. One of the significant issues for management is access to timely and consistent data. Historically, few management decisions have been based
on remotely sensed information because satellite data disseminated to management have been limited to either “pictures” or specialized formats. Managers will substantially benefit from alternative data structures that facilitate better public health protection of water bodies and evaluation of inter-annual and seasonal patterns. In all cases, timely distribution of satellite data is necessary to provide warnings within days and seasonal assessments in the same calendar year. If satellites are going to help managers respond to the immediate impacts of cyanobacteria and nuisance algal blooms, then timely, useful, and cost-effective delivery of information from the satellite data is needed (Schaeffer et al. 2013). In addition, satellite-derived data products will assist with more targeted deployment of existing federal, state, tribal, and municipal monitoring and research efforts to problem areas.
The Cyanobacteria Assessment Network (CyAN) Mobile App Cyanobacteria blooms occur worldwide and are associated with human respiratory and skin irritation, poor taste and odor of drinking water, and human illness. Pets and other domestic animals, and wildlife are also affected by exposure to cyanotoxins. Rapid detection of potentially harmful blooms is essential to making environmental management decisions during periods of limited resources and funding. Traditionally, water quality monitoring is labor intensive and with low temporal and spatial coverage. Sample collection can be limited due to cost, time, and logistical constraints. To help water quality managers and decision makers monitor water bodies more effectively and comprehensively,
EPA is developing the CyAN mobile application for use on Android devices. The CyAN app uses satellite-derived information from the European Space Agency (ESA) Medium Resolution Imaging Spectrometer (MERIS) and, in the future, from NASA’s Moderate Resolution Imaging Spectroradiometer (MODIS), ESA’s Ocean Land Color Instrument (OCLI), and USGS’s Landsat satellite to help make initial water quality assessments and quickly alert managers to potential problems and emerging threats. With the CyAN mobile app, water quality managers will have a user-friendly application that will reduce the complexities associated with harnessing satellite data to make fast, efficient initial assessments. The development of this mobile application puts the satellite technology directly into the hands of water quality managers and the people who need to be informed. With the CyAN app, water quality managers will be able to view water quality on the scale of the United States, and zoom in to get near-real-time data for a local lake. They can also compare locations. As a result, environmental managers will be able to make better informed decisions based on near-real-time changes at a specific location. Additionally, using archived satellite imagery, water quality managers have the ability to look back, 10 or 15 years, for example, to compare how much things have changed to the present day. This historical archive will also allow water quality managers to estimate the rate of change, a huge advantage in prediction and mitigation. The app is currently focused on producing cyanobacteria cell count concentrations (Lunetta et al. 2015 and Wynn et al. 2013), later versions will

Summer 2015 / NALMS • LAKELINE 29
include measures of chlorophyll-a, turbidity, and water temperature. During 2015, the app is being developed for the Android operating system and is transitioning from alpha testing to beta testing. Initial testing will include the states of Florida and Ohio. After 2016, there are plans for the mobile application to expand the continental United States. Using satellite data technologies, and specifically, this application, to monitor and report blooms throughout a region or state would help manage events that may involve significant risk to the public.
Monitoring Cyanobacteria Concentrations Using the CyAN App – An Example A lake manager could use the CyAN app on a weekly basis to monitor water bodies throughout a region. Cyanobacteria thresholds would be set for locations to be monitored using location pins set within the app (Figures 1 and 2). When satellite-derived levels of cell counts reach these thresholds, the location pins would change colors. Location pins change colors like a stop-light. Green pins indicate the lowest threshold, yellow and orange pins indicate
moderate levels, and red indicate high concentrations (Figure 2). At a quick glance of a cell phone, tablet, or laptop, environmental managers could identify a potential problem that would then allow them to better focus their energy and resources to achieve an outcome. An outcome might include manually collecting water samples from that water body for more information or even issuing a public advisory to close local beaches to recreation, if necessary.
Figure 1. An example of how a water quality manager can drop location pins in their water bodies of interest and the pins change colors depending on user settings (see Figure 2).
Figure 2. Users can set their own thresholds for cyanobacteria cell counts since states and localities address these harmful algal blooms differently.

30 Summer 2015 / NALMS • LAKELINE
The development of this mobile application puts the satellite imagery and data directly into the hands of water quality managers and the people who need to be informed (Figure 3). The mobile app uses a default view of Google Earth or Google Maps. The user will be able to adjust the date on the map to view data collected on different days (Figure 4).
Frequently Asked Questions
Question: How does a satellite measure water quality?Answer: Your eyes help you distinguish the color of water from blue, green, brown, and colors in between based on changes in the color spectrum. Satellites essentially perform the same function as your eyes by looking at the visible spectrum of light. Mathematical equations, typically referred to as atmospheric corrections and algorithms, allow scientists to quantify different water quality variables that can change the color of water.
Question: What satellites are used to monitor water quality?Answer: In the past scientist have used satellites like the European Space Agency’s Envisat MEdium Resolution Imaging Spectrometer (MERIS) or NASA’s SeaStar Sea-Viewing Wide Field-of-View Sensor (SeaWiFS). Today, the NASA Aqua satellite Moderate Resolution Imaging Spectroradiometer (MODIS) is probably the most commonly used. The USGS Landsat series has also been used to monitor water quality. In the near future the European Space Agency will launch Sentinel-3 with the Ocean and Land Colour Instrument (OLCI) and further into the future NASA is developing the Pre-aerosol, clouds, and ocean ecosystem (PACE) mission.
Question: What water quality parameters can satellites measure?Water quality parameters that can be derived from satellite are those that cause a change to water color. Other parameters may be estimated by making use of additional information through appropriate biogeophysical assumptions, ancillary data, and mechanistic models. Typically, robust and reliable
Figure 3. Example satellite imagery for Florida that can be displayed within the mobile application. These geotiff files can also be downloaded so additional analysis can be conducted on computers. Note the color scale on the satellite imagery is not the same as the location pins. Satellite imagery color scale represents quantitative values of cyanobacteria cell count where blue color is low concentrations and red is high concentrations, much the same way someone reads a temperature map in a newspaper.
parameters include quantitative measures of water clarity (similar to Secchi depth), chlorophyll concentration, sediment, colored dissolved organic matter, trophic status, and temperature.
Question: What are the spatial and temporal resolutions of satellites?Answer: The satellite sensor pixel spatial resolution ranges from 1 km to 30 meters. Temporal resolution, or the amount of time that passes between measuring the same location repeatedly, ranges between every day and every 16 days. The 30-meter sensors have the longest time between site revisits and the 1 km sensors pass over a location once every day. Cloud cover will also impact the temporal coverage, because these satellite sensors cannot measure through clouds.
Question: Is it true satellites will eliminate the need for traditional monitoring?Answer: No. There are still many limitations when monitoring water quality from satellite. Satellite data should be viewed as a complement to other field and modeling data sets to help provide solutions to problems. The satellite data provide water quality managers a guide to deploy traditional monitoring resources in a targeted, more efficient manner in order to confirm the satellite data.
Question: What about the mobile application? How do I access it?
Answer: Since this mobile application is brand new software there will likely be a number of “bugs” in the system. We are working with a limited number of external partners to beta test the software. If you are interested in potentially testing the software please contact one of the co-authors. We will do our best to work with you and provide more details. Once our beta tests are complete the mobile application will be made available

Summer 2015 / NALMS • LAKELINE 31
Figure 4. Example of how the mobile application displays changes in concentration for different location pins over time.
through the Google Play Store for free. At this time we are only focused on the Android operating system and at some point in the future we may develop the application for iOS.
Acknowledgements The mobile application has been funded by the U.S. EPA’s Office of Research and Development Pathfinder Innovation Project II (PIP2) grant and by the NASA Ocean Biology and Biogeochemistry Program under NNH15AZ42I.
ReferencesLunetta, R.S., et al. 2015. Evaluation
of cyanobacteria cell count detection derived from MERIS imagery across the eastern USA. Remote Sensing of Environment, 157:24-34.
Schaeffer, B.A., et al. 2013. Barriers to adopting satellite remote sensing for water quality management. International Journal of Remote Sensing, 34 (21): 7534-7544.
U.S. EPA. 2010. National Lakes Assessment. EPA 841-F-09-007.
U.S. EPA. 2013. National Rivers and Streams Assessment 2008-2009: A Collaborative Survey – DRAFT. EPA 841-D-13-001.
Wynne, T.T., et al. 2013. Evolution of a cyanobacterial bloom forecast system in western Lake Erie: Development and initial evaluation. Journal of Great Lakes Research, 39: 90-99.
Lahne Mattas-Curry is a public affairs specialist in EPA’s Office of Research and Development’s Office of Science Communications. She brings nearly two decades of public relations and strategic communications experience to EPA. You can contact Lahne at [email protected].
Blake A. Schaeffer is a physical scientist at the Environmental Protection Agency in Durham, NC. His research focus is on the use of remote sensing technology to monitor water quality in coasts,
estuaries, and lakes using Landsat, MODIS, MERIS, Sentinel-3, PACE, VIIRS, and HICO. His interests generally include integrating remote sensing technologies into water quality management frameworks. You can contact Blake at [email protected].
Robyn N. Conmy is a research ecologist at the Environmental Protection Agency in Cincinnati, OH. Her research is dedicated to characterizing optical properties of organic matter in water bodies and discerning their impact to water quality conditions. Her research interests include carbon biogeochemical cycling, optical tracking tools (in-situ and satellite remote sensing), landscape-watershed interactions, crude oil fate
and transport, light attenuation in water and surface-groundwater interactions. You can contact Robyn at [email protected].
Darryl J. Keith is a research oceanographer at the Environmental Protection Agency in Narragansett, RI. His research focus is also on the use of remote sensing technology to monitor water quality in coasts, estuaries, and lakes using aircraft and Landsat, MERIS, Sentinel-3, PACE, VIIRS, and HICO. His interests generally include image processing, algorithm development, and integrating remote sensing technologies into water quality monitoring programs. You can contact Darryl at [email protected]. c

32 Summer 2015 / NALMS • LAKELINE
HABS and USEPA
Phytoplankton Monitoring Network: Using Mobile Technologies for Research & Education
Steve Morton, Ph.D. and Shawn Gano, Ph.D.
The Phytoplankton Monitoring Network (PMN) is committed to researching Harmful Alga Blooms
(HABs) and educating others about them. One way the group has done this is through a mobile application called Phyto. This summer the second version of the app will be released with many more features for both PMN volunteers and anyone else interested in learning more about phytoplankton and their identification. This article includes background information about the PMN, a summary of key features and benefits of the mobile app, and an app development process outline for individuals or organizations interested in utilizing this technology.
The Phytoplankton Monitoring Network The Phytoplankton Monitoring Network (PMN) is a collaborative “citizen science” program. It allows volunteers across the country to work with NOAA scientists in the study and identification of potentially harmful phytoplankton. The network area includes coastal Atlantic, Gulf, and Pacific waters as well as freshwater environments in the Great Lakes regions. Volunteers participate in hands-on research by collecting water samples, identifying species of interest, and entering data on a weekly or bi-weekly basis. The data are then confirmed and further analyzed by NOAA scientists and have been used to alert state managers to potential toxic bloom events (Trainer et al. 2014). For example, data generated by volunteers have been used to determine the extent of the toxic diatom Pseudo-nitzschia in the southeast United State (Shuler et al. 2012), which was linked to Pygmy Sperm Whale mortality events (Fire et al. 2011). All data collected by PMN volunteers are publically available
and can be viewed using an on-line map tool located at http://www.ncddc.noaa.gov/website/PMN/viewer.htm. The PMN currently has over 150 sampling sites covering marine, estuarine, and freshwater environments. Volunteers monitoring these sites represent public and private schools, colleges, and universities, Native American tribes, state and national parks, aquariums, 4-H centers, civic groups, and other non-governmental organizations. The specific goals of the PMN program include:
• to create a comprehensive list of marine and freshwater phytoplankton and potentially harmful algal species;
• to monitor and maintain an extended survey area year-round;
• to isolate areas prone to harmful algal blooms (HABs) for further study by researchers;
• to identify general trends, such as time and area, where HABs are more likely to occur;
• to increase public awareness of phytoplankton and HABs through education and outreach;
• to increase public awareness of research conducted by federal, state, and private researchers;
• to support communication and interaction between researchers and the public via volunteers.
Volunteers are instructed on algae identification and sample on a weekly or biweekly basis, reporting their data to researchers at the Marine Biotoxins Program. Students and volunteers receive specific training in sampling methods, plankton taxonomy and ecology, microscopy, and phytoplankton
identification of 26 different species. Each volunteer group is supplied with a plankton net, thermometer, salt refractometer, and other project support supplies. After microscopic analysis, volunteers submit basic data about the sampling site (e.g., water temp and salinity) and if any of a predefined list of phytoplankton are present in the sample or if there is an elevated number of that species. The list of species is unique to each area based on historical information, species dispersion, and research interest. However, if a species is observed in high abundance that is not on this list, the volunteers are trained to preserve and send the sample to the Marine Biotoxins Program for positive identification.
The Phyto Mobile Application The PMN was able to grow into a national monitoring program by use of various web-based tools such as an interactive website and a geographic information system (GIS) tool for data visualization. Volunteer training sessions and workshops are given by NOAA scientists using internet teleconference capabilities. A smart phone application, Phyto, was developed to assist in helping volunteers learn to identify phytoplankton and as a reference guide to use when analyzing a sample. Phyto was initially developed on the iOS platform, then subsequently developed for the Android platform, and is available for free. The iOS version of the app has been downloaded approximately 6,700 times and the Android version about 3,200 times. Both applications (app) have been downloaded globally. Figure 1 shows the breakdown of the number of downloads from each app per country. The Android app has a wider distribution outside of the United States.

Summer 2015 / NALMS • LAKELINE 33
Phytoplankton Monitoring Network: Using Mobile Technologies for Research & Education
Steve Morton, Ph.D. and Shawn Gano, Ph.D.
Figure 1: Phyto app download global distribution.
The second version of Phyto will be released in Summer 2015 for both iOS and Android and with many new features. The app has updated the index of common species to 46, up from the original 28 species, including those typically associated with coastal HABs as well as freshwater species. The index includes a detailed listing of each species with multiple photos and a pronunciation sound clip; see Figure 2 for two screenshots of the index. To help make learning to identify the species more fun, the app includes a flashcard game; the updated iOS version also includes a second variation of the flashcard game that allows you to compete with friends and other players from around the world. The app also includes a guide, as shown in the left side of Figure 3. The guide was designed to help aid in identification of difference species by shape and other visually observable characteristics. The new samples feature will mainly benefit PMN volunteers, allowing them to directly load sample data and submit it through the app to the NOAA experts for further analysis. The last new major feature is a news tab that displays current topics of interest to the community.
Figure 2. Screenshots of the species index (iOS version of the app).
An Overview of the Mobile App Development Process Creating your own app can be a great tool in educating others about your area of study or your organization. Deploying a good app requires a defined plan as
well as a team that has the right mix of graphical design and technical skills. While there are many details that go into creating and designing an app here are a few things we learned and thought might be useful if you are considering creating your own!

34 Summer 2015 / NALMS • LAKELINE
Planning Phase1. Focus on one thing and doing it
well. Figure out what the most important thing you want your app to do or accomplish and don’t try to add a lot of features initially. You can always update the app in the future with more features. If you keep adding a lot of ideas during development, called scope creep, you run the potential of never finishing the app or creating an app that is hard to use.
2. iOS or Android or both? Determining which mobile platform you are targeting up front can be very useful as you build up your team. This is mainly due to the large differences in development skills needed for each operating system. If you have experience programming in multiple languages and/or have a large budget, you could set out to build an app for multiple platforms from the start. Otherwise it might be wise to start with the one you know the best and, if successful, then expand to others.
3. Building the team. At least two skills are needed when developing an app besides creating the idea and the content of the app: graphics and programming. Determine how much of the app development you (or your organization) can do internally and how much of the effort will need to be outsourced.
4. Cost. Estimating the cost is not straightforward and depends how much you plan to do yourself. If you can do most of the work yourself the main cost will be time. If you are contracting the work they should give you a reasonable estimate. App development costs vary greatly depending on the complexity. If you plan to hire someone to create the graphics and do the programming, even a simple app will cost around $10,000 for a single platform. If you have a database, server side data, or social media hooks the cost can rise quickly.
Figure 3. Screenshots of the species guide and sample submission form.
5. Future updates. If you are outsourcing the development of your app, thinking about future updates is particularly important. Mobile operating systems and devices change a lot each year; so keeping your app compatible with the latest software versions and screen sizes will take some effort.
Specifics for iOS Development1. You have to have a Macintosh
computing platform
2. Apple registration and yearly fee are required
2. Apple’s App Store Review Guidelines are specific and they are strict
3. Developer Tools: Xcode (free)
4. Language – now there are two: Objective-C and the new Swift language
5. Testing – the Apple-provided simulator is good but you will want to test on as many different devices as possible. If you are planning on a universal app – test on both iPhones and iPads.
Specifics for Android Development1. Any computer will do
2. Registration and app submission is free
3. Developer tools (free)
4. Language – Java
5. Testing – use the Android simulator and devices. Extra testing will be needed because of the larger number of potential device screen dimensions as well as android operating system versions.
Outline of the App Development Process 1. Sketch out basic functionality and
overall design
2. Code Development – Making the App Work
3. Overall Design and Graphics Development
4. Testing
5. Releasing the App
ReferencesFire, S.E., Z. Wang, M. Byrd, H.R.
Whitehead, J. Paternoster and S.L. Morton. 2011. Co-occurrence of three

Summer 2015 / NALMS • LAKELINE 35
classes of harmful algal toxins in bottlenose dolphins (Tursiops truncates) stranding during an unusual mortality event. Harmful Algae, 10: 330-336.
Shuler, A.J., J. Paternoster, M. Brim, K. Nowocin, T. Tisdale, K. Neller, J.A. Cahill, T.A. Leighfield, S. Fire, Z. Wang and S.L. Morton. 2012. Spatial and temporal trends of the toxic diatom Pseudo-nitzschia in the Southeastern Atlantic United States: The use of volunteers to monitor HABs. Harmful Algae, 17: 6-13.
Trainer, V.L., K. Sullivan, B-T Eberhart, A. Shuler, E. Hignutt, J. Kiser, G.L. Eckert, S.E. Shumway and S.L. Morton. 2014. Enhancing shellfish safety in Alaska through monitoring of Harmful Algae and their toxins. Journal of Shellfish Research, 33(2) 531-539.
Selective ReferencesPhytoplankton Monitoring Website: http://products.coastalscience.noaa.gov/pmn/Phyto version 1: http://www.gano.name/shawn/phyto/
General information of Harmful Algal Blooms: http://oceanservice.noaa.gov/hazards/hab/
Steve L. Morton is a research oceanographer for NOAA and is the primary investigator of the Phytoplankton Monitoring Network.
Shawn Gano is an aerospace engineer by day and an app developer by night. He is also a Phytoplankton Monitoring network volunteer from the Texas gulf coast region. He created the first version of the Phyto app because he was struggling to learn how to pronounce all the different species names! c
Next Issue – Fall 2015 LakeLine
In the fall issue of LakeLine,
we will focus on
“Climate Change” –
how it affects lake processes
and cyanobacteria;
considerations for managing
watersheds and wetlands in a
changing climate; and how to
better communicate
climate change.
c

36 Summer 2015 / NALMS • LAKELINE
HABs and USEPA
The New England Region Cyanobacteria Monitoring Program: A Pilot Study
Hilary Snook
New England lakes, like many across the country, are experiencing an increase in cyanobacteria blooms.
As a result, several communities have seen cyanobacteria-related warnings and advisories in recent years (Figure 1). Adding to the problem, financial resources for monitoring and forecasting bloom occurrences are limited, yet states are still facing increased pressure to develop monitoring programs to help understand and manage blooms and associated risks to the general public. Thus, coordinated efforts are needed between grassroots organizations, resource management agencies, and research institutions to regularly monitor for cyanobacteria and the nutrients that contribute to blooms. In 2013, state agencies asked the EPA New England Regional Laboratory for better approaches to manage and monitor cyanobacteria and harmful algal blooms. By the middle of that year, the EPA New England Regional Laboratory began hosting cyanobacteria workshops. The workshops were well-attended and quickly evolved into a regional workgroup focused on developing consistent monitoring and sampling protocols across the region. The New England cyanobacteria workgroup represents a diverse community, including state water quality monitoring folks, researchers from EPA’s Office of Research and Development, interstate NGOs, public water suppliers, lake and pond association members, public boards of health, watershed associations, the U.S. Geological Survey, academia, university
Program Participants: Linda Bacon, Joanie Beskenis, Shane Bradt, Sonya Carlson, Elisabeth Cianciola, James Coles, Charles Culbertson, Roger Fryemire, Linda Green, James Haney, Elizabeth Herron, Guy Hoffman, Jeffrey Hollister, Hillary Kenyon, Betty Kreakie, Kitty Lane, Daniel Leonard, Tracy Lizotte, Bryan Milstead, Amanda Murby, David Neils, Dan Peckham, Angela Shambaugh, Toby Stover, Paul Susca, Urena Vuarnelle, George Zoto
Figure 1. Map of New England lakes identified by state agencies as having cyanobacteria problems from 2009-2012.

Summer 2015 / NALMS • LAKELINE 37
extension services, and individual citizen scientists wanting to learn more and participate in the program.
Sampling Approach and Methods The workgroup’s initial responsibility was to develop a sampling strategy that provided regionally consistent and useful data while fostering local citizen participation. The collected information would contain useful data for the prediction, identification, and management of algal blooms, while providing a mechanism for the tracking of bloom occurrences and cyanobacteria levels in regional waterbodies. Additionally, an organizing principle for the monitoring effort was to accommodate all levels of participation, while maintaining consistent data collection practices. The workgroup also understood that it was important to provide mechanisms for educating the public, the principal users of the resources, and provide data that would be useful to public health agencies and water resource officials. Thus, the effort will include data from both citizen scientists, whose only available monitoring tool might be a smartphone, as well as data from large municipal water suppliers with sophisticated sampling and monitoring equipment. This would allow both types of groups and all gradations in between to make contributions to a regional database for sharing and displaying information on regional harmful cyanobacteria bloom (cyanoHABs) occurrences and ambient cyanobacteria concentrations. To monitor for blooms, field crews used hand-held, field fluorometers as the principal monitoring tool to quantify overall phytoplankton (chlorophyll) and cyanobacteria concentrations (phycocyanin). All blooms are not necessarily toxic, nor are they always cyanobacteria and it is rare to be able to distinguish this visually (Figure 2). The fluorometers allow one to discriminate between ambient phytoplankton, and the presence of cyanobacteria blooms or ambient water column concentrations that have the potential to be toxic. To collect lake water for analysis, the sampling equipment was made up of varying lengths of inexpensive tubing, which allowed for integrated sampling down through the water column. Regional
Figure 2. The non-toxic golden algae Botryococcus overlying the potentially toxic cyanobacteria Woronichinia. Image credit: J. Haney.
Figure 3. A New England lake profile showing the distinct stratification of the cyanobacteria Oscillatoria (light blue) and a green algae (green line) in relation to the lake temperature (black line). Image credit: J. Haney.
concerns are focused on tracking the onset of CyanoHABs in the water column and the potential effects these may have to human and animal health in near shore areas and swimming beaches. For these reasons, samples were collected at both offshore and near-shore locations. For the offshore sites, integrated samples were taken to a depth of three meters to
capture the principal area where light can penetrate and induce photosynthesis, which is the area where cyanobacteria are the most likely to reside during the summer months. Sampling throughout this entire zone is critical, as cyanobacteria, as well as algae, may reside in discrete layers at specific depths depending on conditions (Figure 3). In addition, integrated samples

38 Summer 2015 / NALMS • LAKELINE
were collected at a minimum of three offshore locations around the water body in order to provide insights to the horizontal phytoplankton heterogeneity. One-meter integrated samples were collected in the near-shore areas where recreational swimmers and pets are the most likely to spend their time in the water. This is also where local and state boards of health routinely collect their samples. Once samples are collected from a lake, they are then analyzed using the hand-held fluorometers, which provide immediate results on phycocyanin and chlorophyll pigment concentrations. These fluorometers are relatively inexpensive and designed for in-field use, making them ideal for small or large budget monitoring efforts with easy portability. This simple approach provides the capability for tracking cyanobacteria concentrations and impending bloom conditions on a daily or more frequent basis.
Data Collection In the summer of 2014, a pilot project began with all workgroup member associations participating, and resulted in more than 100 water bodies being sampled over the three-month period. A minimum sampling frequency per water body was established at twice per month, but no upper limit was set. This enabled those that wanted to track phytoplankton concentrations or bloom forming conditions more closely the oppor,tunity to do so. By the end of the pilot summer, over 5,000 data points were collected across the six New England states from the northernmost points of Maine to the urban waters of Connecticut. Most of the data were collected by volunteer monitoring citizen scientists. Datasets were subsequently sent to EPA’s Atlantic Ecology Division for compilation into a single database. Core sampling measurements included phycocyanin, chlorophyll, sampling locations, and sample date(s). In addition to these core measurements, the database includes additional information from sampling events that will allow more detailed questions to be answered in the future as more data are collected. These additional data include local weather observations, lake surface conditions,
GPS sampling locations, sampling depths, and the freezing of samples for later analysis.
Preliminary Results After aggregating the pilot year data, the next step was conducting some preliminary analysis. Post- calibration checks were made on all the instruments utilizing secondary standards that validated the accuracy of the chlorophyll and phycocyanin values from the fluorometers. The second goal was determining baseline conditions seen across the region. Although data are still being processed for Maine and Connecticut, the other four New England states median sensor-measured chlorophyll was 1.07 µg/L and median sensor-measured phycocyanin was 0.55 µg/L with mean values of 1.6 µg/L and 19.6 µg/L for chlorophyll and phycocyanin, respectively. There was variation across the region with only a few lakes at significantly higher concentrations of both chlorophyll and phycocyanin (Figure 4). As future sampling takes place, a much clearer picture will begin to emerge for cyanobacteria levels within individual waterbodies, as well as regional trends across New England.
Lessons Learned Through the course of the workgroup meetings, planning, sampling, data collection, and analysis, many lessons
were learned that will provide returns as we continue building our monitoring efforts. One of the most important realizations of our pilot study is that the benefits of more intensive and focused sampling efforts are great. Unlike larger national efforts, regional monitoring allows us to make repeated samples in the same lake throughout the summer months and beyond. Collection of multiple data points within lakes and across lakes allows one to make assessments on lake condition and trends, and helps us begin to understand the temporal and spatial dynamics of cyanobacteria across the region and across waterbodies. The pilot demonstrated that there is a tremendous amount of interest and enthusiasm in learning and becoming more involved in the issue of cyanobacteria within the region. The educational component that is intentionally tied into the effort reinforces monitoring and continues to build capacity in the region. When combined with affordable and easy to use monitoring equipment, the door is wide open for almost anyone to learn and participate in the program, providing valuable data to support a better understanding of the problem. The regularly scheduled workgroup meetings proved to be a critical component to making certain that appropriate training on methods, protocols, and instruments took place, and assisted in providing regional
Figure 4. Median phycocyanin and chlorophyll in New England states for summer of 2014.

Summer 2015 / NALMS • LAKELINE 39
consistency in data collection efforts and data integrity. With the diversity of the workgroup displaying many levels of expertise and experience, it was essential not only to ingrain the details of the sampling and analysis protocols, but also to convey why the data were being collected in the way they were. This type of discourse at workgroup meetings provided deeper understandings of cyanobacteria and how they interact and behave in the environment. The pilot year was essential for working out the kinks, and the end result will be a more robust program where sampling will be more streamlined, data collection easier, and the resultant data of increasingly exceptional quality. Without the pilot year implementation, this would have been a significant challenge.
Project Developments As the project matures in 2015 and beyond, the program will be expanding with increasing participation and inclusion of an ever-increasing number of waterbodies selected for sampling. A key part of this successful expansion is the program’s flexibility, allowing participants to provide data at the most basic level (i.e., just core measurements) or to expand their efforts and provide more extensive data, such as toxin concentrations and phytoplankton species identifications, whichever budgets and time allow. The database architecture is nearing final completion, and the program will continue to evolve as the workgroup continues to work with new participants who will add additional information on an ad-hoc program basis. To take advantage of the lessons learned over the first year, scheduling training sessions will take place prior to the “sampling season” every year. Training ensures that instruments are uniformly calibrated, that groups are well trained in sample collection techniques, and that any new tools are fully understood, vetted, and demonstrated. New tools in development that will be usable for the summer of 2015 include a smart phone application for ease of data collection and transmission. These electronic phone app data entry forms will feed a back-end database from either a smartphone application or a web interface. Another component in development for
use in 2015 is the addition of a citizen science component (aka “Bloom Watch”) that will allow users to send images of possible blooms taken from a smart phone directly to a database accompanied by locational information. In addition, some of our collaborating partners with the University of New Hampshire Center for Freshwater Biology have developed a “Dirty Dozen” image based cyanobacteria key (Figure 5) to be used as a quick reference with the program. Our current efforts will link to the “Dirty Dozen” key through optics adapters for smartphones to serve as a field “microscope” (Figure 6). High-resolution images will be able to be taken from the field, sent to the database, allow for algae identifications, and relay potential species related toxin information back to the user.
Summary Starting in 2013, the efforts of many people (see page 36 for participant list) have resulted in a fledgling New England Regional Cyanobacteria Monitoring program. As a result, the program has
Figure 5. The home page for the University of New Hampshire Center for Freshwater Biology depicting the top “Dirty Dozen” cyanobacteria groupings in New England. This is an image based key with accompanying ecological notes. Image credit: A. Murby.
Figure 6. A field microscope and smartphone in use with the optics adapter, capturing a microscopic image. Direct transfer to the regional database is in development.

40 Summer 2015 / NALMS • LAKELINE
seen the development of a fast-growing community focused on cyanobacteria education and monitoring, developed a sampling protocol, planned and executed a field sampling program, collected data, begun initial analysis, and made plans for the growth and sustainability of the program. This is a noteworthy accomplishment, and one that suggests that the program will continue to move forward. Without these kinds of diverse collaborative efforts and the resulting data that they collect, it will prove very difficult to understand the full extent of the problem or to manage our resources appropriately. This is imperative if we desire to mitigate the potential health and economic impacts of cyanobacteria. A willingness to share knowledge, experience and expertise, and provide the time and effort to investigate a looming environmental issue through regional collaboration is a testament unto itself as to the success of this project. We look forward to learning more about cyanobacteria so that we can move closer to appropriately managing our precious water resources.
Hilary Snook is a scientist for USEPA’s New England Regional Laboratory. His work involves the coordination and management of water quality and aquatic biological monitoring surveys for the region, and provides a supporting role for national aquatic resource surveys presently being initiated by the EPA. He has implemented ecological assessments of condition for wadeable streams, large rivers, lakes and ponds, and near coastal waters for the past 20 years with a focus on development of biological indicators for assessing aquatic resource condition, emerging contaminants, and the transport of contaminants through food webs and the environment. He has spent the past 25 years working on water quality and other hydrologic issues and problems. c
Innovation to Protect Our Water Denice Shaw
YOU could be the winner of the 2015 NALMS Annual Photo Contest.
This year, two winning images will be selected, a Member’s Choice winner selected by Symposium attendees and an Editors’ Choice winner selected by the editor and production editor for the entry that will make the best LakeLine cover. We have secured sponsorship for the Photo Contest so a $250 gift card will be awarded to each winner.
Your favorite lake or reservoir photo could grace a cover of LakeLine!
Entries will be judged during the 2015 NALMS Symposium . . . in historic Saratoga Springs, New York!
Only electronic submissions will be accepted. You must be a NALMS member to submit an entry.Photos should be of sufficient resolution to print from (approximately 300 dpi at 8.5” x 11”).
Maximum of one submission per person.
Entries must be received by October 15, 2015.
Send your entry to:Bill Jones, Editor, [email protected]
Go ahead...take your best shot!

Summer 2015 / NALMS • LAKELINE 41
HABs and USEPA
Innovation to Protect Our Water Denice Shaw
Green water is not clean water. By the time the slimy mats of algae develop, it’s too late to help the
lake or river in the near-term. Time becomes the most essential ingredient. The long-term problem starts much earlier, when too much nitrogen and phosphorus enter the water. These nutrients are essential at normal levels. Excesses, though, can harm human health, ecosystems, and the economy. A prime example of the damaging impacts of nutrient runoff comes from Toledo, Ohio. Harmful algal blooms developed near the city’s Lake Erie shoreline in August 2014 and left about 500,000 people without safe drinking water. That kind of widespread ecological event also takes a toll on recreation and the local economy, and similar financial detriments add up quickly across the country. A 2015 analysis found that health and environmental damages from excess nitrogen alone totals more than $200 billion each year in the United States (Sobota et al. 2015). This critical environmental issue requires innovative strategies. Sensors are one tool that could help identify the presence of excess nutrients in our waterways. Unfortunately, today’s methods for measuring nutrient loads are complex and costly, which means more data are needed to inform decisions about nutrient reductions and improve the ability to track the progress of reductions. Under the directive of the White House Office of Science and Technology Policy, the Challenging Nutrients Coalition is coordinating innovative approaches to develop a suite of affordable, reliable sensors. The group consists of federal agencies, universities, and non-profit organizations.
In December, the group launched the Nutrient Sensor Challenge, a two-year prize competition to accelerate the development and deployment of affordable nutrient sensors for use in aquatic environments. Sensors developed through this competition will cost less than $5,000 to purchase, be deployable for three months without maintenance, and be ready for the commercial market by 2017. Technologies with these capabilities will improve the basic scientific understanding of how excess nutrients affect our health and environment, and they will help expand monitoring and forecasting of nutrient levels and harmful algal blooms in lakes, rivers, and coastal waterways. No-cost sensor beta testing for participants begins in August 2015, but the other key part of the Nutrient Sensor Challenge is the quantification of the market for those sensors. To minimize investment risk, technology producers are eager to understand the commercial market potential for nutrient sensors. Groups interested in providing their input for the numbers and types of sensors they might buy can visit the website: www.nutrients-challenge.org. The Challenging Nutrients Coalition includes the Environmental Protection
Agency (EPA), National Oceanic and Atmospheric Administration (NOAA), National Institute of Standards and Technology (NIST), United States Geological Survey (USGS), Department of Agriculture (USDA), the Everglades Foundation, the Partnership on Technology Innovation and the Environment, and Tulane University.
ReferencesSobota, D.J., Compton, J., McCrackin,
M.L. and Singh, S. 2015. Cost of reactive nitrogen release from human activities to the environment in the United States. Environmental Research Letters. 10: 025006. doi:10.1088/1748-9326/10.025006.
Denice Shaw is a senior innovation advisor for the Innovation Team in the U.S. Environmental Protection Agency, Office of Research and Development. Dr. Shaw serves as EPA’s lead for implementing challenges and prize competitions at EPA. She has managed national programs supporting environmental measurement, monitoring, and enabling technologies, including the ongoing Nutrient Sensor Challenge. c

42 Summer 2015 / NALMS • LAKELINE
Mary Coyle Student CornerYour Ugly Algae Neighbor: Rock Snot, A Native Nuisance
Appearing in rivers like an alien invader, Didymosphenia geminata has garnered universal disgust,
frustration and the worst nickname of all algal species, “rock snot.” This stalked diatom is notorious for unsightly, grayish-brown mats that form along the bottom of oligotrophic rivers and streams (Figure 1).These mats range from small tufts along the apical surface of substrate to mats that cover the entire stream or river bottom to depths exceeding 20 cm. Due to the physical structure of the stalks, D. geminata mats have a significant impact on the aesthetic and biological characteristics of river systems. Beyond its unsightly appearance, D. geminata nuisance mats snag fishing gear and alter macroinvertebrate community structure and near-substrate hydrology. Sections of rivers that have heavy mat coverage have decreased densities of taxa of large-bodied macroinvertebrates of Ephemeroptera (mayflies), Plecoptera (stone flies), and Trichoptera (caddis flies), known as EPT taxa, while the density of small-bodied taxa such as Chironomidae (midges) increased. This could alter the composition of local fisheries by reducing prey abundance for those species that key in on large EPT taxa. However, while the appearance of these infuriating mats may mimic an invasion, this diatom may, in fact, be a red flag of changes in the environment at a global scale.
Background Counter to the typical occurrence of nuisance algae in systems with high nutrients, D. geminata forms nuisance mats in winter in cold rivers with low nutrient concentrations (especially phosphorus – P), high light availability, and stable bedrock. These habitat
Figure 1. Didymosphenia geminata on stream bottom rock (A) and nuisance mat (B) in the Kootenai River, Libby, MT.
conditions are commonly found below dams, leading to a high prevalence of nuisance mats in the tailwaters of impounded systems. While predominantly a lotic (flowing water) issue, nuisance mats have been known to occur at lake outlets and along shorelines that have significant wave action. Historically, the occurrence of D. geminata mats has been observed throughout Europe since the mid-19th century. However, these mats generally persisted for a short period of time resulting in little public attention. The current D. geminata mats that are receiving attention throughout the United States and other parts of the world are of a different nature. These “nuisance mats” are defined as those that extend >1km that persist for several months of the year (Spaulding and Elwell 2007). The Kootenai River in northwest Montana, USA has mat coverage over 70 percent of the river bed that extends at least 32 river
kilometers downstream of Libby Dam, while patchy mat coverage continues for another 49 km downstream and persists for 10 months out of the year (Figure 2). Impounded by Libby Dam, the tailwaters of the Kootenai River, where mat coverage is greatest, has an average soluble reactive phosphorus (SRP) concentration below detection (0.5 µg/L) and nitrate + nitrite concentrations >200 µg/L. Nitrogen concentrations in the Kootenai River have steadily increased over the past nine years and are predicted to continue to rise as a result of upstream anthropogenic activities in the watershed.
Native Nuisance vs. Invasive Status As a microscopic member of the aquatic community, a shift to a highly noticeable macroscopic state is noteworthy. However, without a historical reference of D. geminata as part of the periphyton, the occurrence of mats results in a public perception that an

Summer 2015 / NALMS • LAKELINE 43
Figure 2. Photograph of the Kootenai River bottom with >80% Didymosphenia geminata, nuisance coverage (A). Close up of nuisance mat,“rock snot”(B).
invasion is underway. Unfortunately, this misconception has led to the widespread belief that the species is an invasive in the United States. Historically, D. geminata was described as a rare diatom located only at northern latitudes and it was not considered an invasive until extensive nuisance mats were recorded from New York to Montana in the 1990s and 2000s. In 1989, persistent, nuisance mats were first recorded throughout central Vancouver Island, Canada, in pristine river systems and an association was made between the presence of mats to popular fishing locations (Bothwell et al. 2009). Further tests showed that D. geminata cells could remain viable in damp felt-soled waders for 50 days (Kilroy et al. 2007), confirming the plausibility that anglers and other recreationists were moving this diatom among rivers. However, as mats have continued to appear and research has matured, patterns have begun to emerge and the concept of this species being an invasive in the northern hemisphere is being refuted, especially given historical recorded dating to 1866 confirming its presence in Montana. Rather, changes in water quality conditions are being linked to the presence of nuisance mats. To investigate this hypothesis throughout a D. geminata mat affected region, I
examined the commonality of this diatom and its prevalence for nuisance mats throughout the intermountain northwest.
Regional Distribution Algal scrapings were collected from sites across Montana and Idaho with an emphasis on areas with records of visual sightings of mats. To increase the area sampled, I enlisted the assistance of federal (USFS, EPA, USGS) and state agencies (Montana Fish, Wildlife and Parks and Idaho Department of Fish and Game), private individuals (e.g., fly fishers or interested citizens), and personnel from non-governmental organizations (NGOs) such as Trout Unlimited (TU), Kelly Creek Fly Casters (KFC), and the Federation of Fly Fishers (FFF). PowerPoint presentations were given to several of the larger organizations (TU Libby, KFC, and IDFG) to disseminate information about the ecology of D. geminata, methods to collect samples, and how to identify D. geminata mats. Volunteers were asked to collect a scraping of algae from various depths and rocks at one location to provide a diverse sample. The sample was placed in a 15 ml centrifuge tube at least ¼ to ½ full, labeled with the name of the river, date, and location. Other information such as
the presence of a mat, amount of shade and size of the water body were also recorded on data sheets accompanying each tube. Tubes with samples preserved with Lugol’s iodine and the data sheet were then mailed to me at the University of Idaho for analysis. To analyze the samples, I examined multiple subsamples from each sample by placing approximately 5–8 mL onto a glass microscope slide, covering it with a cover slip and examining them with the aid of a compound microscope at 120×. If 5 or more cells of D. geminata were found, a positive detection was recorded. A digital photograph (Figure 3) was taken of the cell and the remaining algae scraping was dried on an index card to create a voucher for that sample. Photograph number, stream characteristics, and coordinates were all recorded on the envelope that held the algae scraping. Characteristics viewed in the subsample such as presence of stalk material from the D. geminata cells were also recorded. All data were then entered into a Microsoft Access database that will be available online to researchers or interested parties within the next year. D. geminata detections from this study and Tait (2010) were plotted on a GIS map with ArcMap v. 10.2.2. This map provides a reference of D.geminata

44 Summer 2015 / NALMS • LAKELINE
Figure 3. Didymosphenia geminata cells in an algae scraping from Cedar Creek in northwest Montana 2014.
presence throughout the U.S. in 2014. From the algae scrapings and sequential mapping of D. geminata cells, the commonality of this algal species in the region has been clarified (Figure 4). Of the 127 creeks and rivers surveyed in Idaho and Montana, 52 percent had D. geminata as part of the algal community. Of those with D. geminata, only 32 percent had visible mats, while 68
percent of the rivers had D. geminata as a normal member of the periphyton community (Figure 4). This survey clearly demonstrated that D. geminata is common throughout the region and usually occurs in a “well-behaved,” non-nuisance/non-mat phase. Data collection and synthesis will continue throughout 2015 to increase our understanding of the species throughout the United States.
A Native Nuisance As this study has shown, D. geminata is common throughout the intermountain northwest. Supporting the historical records of D. geminata as native species in Idaho and Montana, the question remains, what shifts in the environment, including possible changes in water quality, causes D. geminata to move into a nuisance mat-forming phase from a well-behaved member of the periphyton community? What threshold is the trigger? And finally, what, if anything, can be done to reverse this trend across the landscape?
Limiting Nutrients Phosphorus limitation (< 2 µ/L) has been strongly linked to nuisance mat growth (Kilroy and Bothwell 2012). Given phosphorus concentrations have remained relatively stable in the Kootenai River, a potential mechanism increasing
Figure 4. Didymosphenia geminata distribution throughout Idaho and western Montana collected by authors and volunteers. Yellow dots are confirmed presence of D. geminata cells with no mat presence. Red dots are confirmed presence of cells and mats of D. geminata and blue dots are algal scrapings that were negative for D. geminata.
P limitation may be increases in nitrogen from atmospheric and terrestrial sources. Globally, nitrogen production for agriculture, from the consumption of fossil fuels, and from other human activities has reached all-time highs within the last decade (Gu et al. 2013). This massive shift has had wide-reaching effects on the nitrogen cycle, including increased wet and dry nitrogen deposition. This increase of nitrogen within lentic and lotic systems has the potential to affect the N:P ratio, resulting in phosphorus limitation. To evaluate this hypothesis, I conducted mesocosm studies near Libby Dam, Montana, investigating phosphorus enrichment as a management strategy study in March to September, 2013 and January to May, 2014. Results from these studies clearly showed that P enrichment suppressed the stalk growth of D. geminata at all concentrations (0.5, 1.5, 2, 3, 5 and 8 µg/L) of P added, and that algal diversity and biomass increased significantly. To provide a complete story, a mesocosm study investigating the response of mats to changes in the nitrogen to phosphorus ratio is currently underway. This study will help determine if increasing nitrogen in an already phosphorus limited system will continue to lead to increasing nuisance mats or if

Summer 2015 / NALMS • LAKELINE 45
the threshold has already been reached. At the conclusion of these studies, my goal is to be able to make recommendations for the management of D. geminata mats in the Kootenai River.
Conclusion D. geminata is an unsightly nuisance that many wish would just wash away. However, this diatom may be an indicator of a much larger environmental issue. Understanding the driving mechanism behind the dramatic shift of the microscopic native diatom to the ugly macroscopic nuisance is essential to identify viable management strategies and understand ecosystem health. While the Kootenai River has an extensive water quality dataset, for most river systems with significant D. geminata nuisance mats, long-term water quality data are patchy or non-existent, making it difficult to detect consistent and widespread regional trends. To further understand this complex issue, efforts to compile mat (nuisance or otherwise) locations, cell locations, and related water quality data are imperative. Understanding global environmental health trends is an enormous undertaking but by working to understand this perplexing diatom, I aim to gain valuable insights. If you are interested in providing algae scrapings for D. geminata detections and the Didymo Database, please contact Mary Coyle at [email protected].
ReferencesBothwell, M.L., D. Lynch, H. Wright
and J. Denisger. 2009. On the boots of fishermen: The history of didymo blooms on Vancouver Island, British Columbia. Fisheries, 34: 282-388
Gu, B., J Chang, Y. Min, Y. Ge, Q. Zhu, J.N. Galloway and C. Peng. 2013. The role of industrial nitrogen in the global nitrogen biogeochemical cycle. Scientific Reports, 3:2579
Kilroy, C., A. Lagerstedt, A. Davey and K. Robinson. 2007. Studies on the survivability of the invasive diatom Didymosphenia geminata under a range of environmental and chemical conditions. Natl. Inst. Of Water and Atmos. Res., Christchurch, N.Z.
Kilroy, C. and M.L. Bothwell. 2012. Didymosphenia geminata growth
rates and bloom formation in relation to ambient dissolved phosphorus concentration. Freshwater Biology, 57: 641-653.
Spaulding, S. and Elwell, L. 2007. Increase in nuisance blooms and geographic expansion of the freshwater diatom Didymosphenia geminata. U.S Geological Survey Open File Report 2007.
Tait, C. 2010. Aquatic invasive species database. United States Forest Service. http://www.fs.usda.gov/Internet/FSE_DOCUMENTS/stelprdb5182307.pdf
(HOLSINGER . . . Contintued from page 20)
and Anatoxin-a in Drinking Water by Liquid Chromatography Electrospray Ionization Tandem Mass Spectrometry (LC/ESI-MS/MS). EPA 815-R-009.
World Health Organization (WHO). 1999. Toxic Cyanobacteria in Water: A guide to their public health consequences, monitoring and management. Bartram, J. and Chorus, I. (Eds). CRC Press, London.
DISCLAIMER The views expressed in this article are those of the individual author and do not necessarily reflect the views and policies of the U.S. Environmental Protection Agency.
Hannah Holsinger is an environmental scientist in EPA’s Office of Ground Water and Drinking Water. She is based in Washington, DC, where she serves as the drinking water program’s cyanotoxin team lead. c
800-432-4302www.vertexwaterfeatures.com
Large Lake Aeration Design & Consultation
Mary Coyle is a Ph.D. student of natural resources at the University of Idaho. A native of McCall, Idaho, and a fly fishing enthusiast, she is passionate about restoring and protecting water resources throughout the Pacific Northwest. Her graduate research is focused on developing management strategies for Didymo nuisance mats in the Kootenai River of Libby, MT. c

46 Summer 2015 / NALMS • LAKELINE
North American Lake Management SocietyCall for Awards NominationsEach year NALMS recognizes individuals, organizations and programs, corporations, and projects that have contributed to the Society and to the science of lake and watershed management. Presented at the annual NALMS international symposium banquet, these awards were established to encourage the advancement of NALMS’ goals by recognizing outstanding efforts of our colleagues and encouraging similar activities.
NALMS Awards will be presented this year at the Society’s 35th Annual Meeting in Saratoga Springs, New York. Nominations should be sent to NALMS Awards Liaison from these categories:
Leadership and Service AwardsIn addition to recognizing outgoing board members, officers, and editors, NALMS recognizes other areas of leadership and service.
Volunteers – Awards may be given to individuals or groups for significant volunteer efforts devoted to lake management. Professionals (i.e., anyone paid to work on the project) are ineligible. Selection criteria include the level of local involvement, creative use of methods or materials, and demonstrable lake-related improvements.
Education and Outreach – Awards may be given to individuals or groups for the design, facilitation, or performance of exceptional education and outreach activity that furthers the understanding of and appreciation for lake management science. Selection criteria include innovativeness, creativity, impact, and dedication.
Other – Leadership and service may be recognized for additional categories. The nomination should detail how the individuals or group demonstrated leadership and service to NALMS or to the profession and practice of lake management.
Special Appreciation Awards• Secchi Disk Award – for the individual member considered to have contributed the most to the achievement of NALMS’ goals. Recipient
must be a NALMS member.
• Jim Flynn Award – for the organizational member considered to have contributed the most to NALMS’s goal. Recipient must be a NALMS Corporate member.
• Friends of NALMS Award – awarded to individuals or corporations making major contributions to NALMS. Recipients do not have to be NALMS members, and “contributions” extend beyond monetary donations.
• Lake Management Success Stories – Individuals or organizations who have accomplished successful lake management efforts. Nominees must show demonstrable improvements in lake condition through lake or watershed management. Projects are evaluated with respect to demonstrable success in achieving lasting improvements in water quality or recreational utility in a cost-effective manner. The nominator is invited and encouraged to make the presentation at the Awards Banquet.
• Advancements in Lake Management Technologies – Individuals or organizations who have refined, developed or discovered new, innovative or improved methods, technologies or processes for achieving lake or watershed management outcomes in manners that are safer, cheaper or more effective. Awards may be given to individuals or groups for the performance of research projects, which contribute to the science of lake management. Nominations should be accompanied by appropriate documentation, such as journal papers. Selection criteria are relevance, approach, and applicability.
The Award Liaison appreciates the assistance of nominators in ensuring that recipients are present at the Annual Banquet to receive their awards. The Awards Liaison may also request photographs or other graphic materials be made available for the Award Presentation.
EligibilityCurrent NALMS board members and members of the NALMS Awards Committee are not eligible for nomination.
NominationsAny individual or organization may make nominations for these awards. To submit a nomination, please provide the following information:
1. Your name, title, mailing address, telephone number, and email.2. Full name of the nominee (or project), present position, organization or affiliation, mailing address, telephone number, and email.3. A brief and complete description of the achievement to be recognized and statement of how the efforts of the individual or organization
meet the award criteria.4. Electronic transmission of the nomination form and supporting materials in preferred.
Deadline for Nominations – August 15, 2015We know that there are many individuals, organizations, programs and corporations working hard each day to protect and enhance our lakes, ponds and reservoirs. Be sure that they receive the recognition that they so justly deserve by sending a nomination, with supporting documentation, to:
Awards Liaison, Dick Osgood; Email: [email protected]. Please contact Dick with questions.

Summer 2015 / NALMS • LAKELINE 47
A Call to ActionNominations for 2015 Election are being accepted at this time!NALMS is seeking candidates that will add diversity and breadth to the Board and its committees.You could become a nominee for a position on the NALMS Board of Directors, to take a more active role in steering the direction of activities that relate to these precious resources. Experience or training in lake management is not required for a board position, and we encourage candidates with expertise in nonprofit management, leadership development, marketing, fundraising, legal issues and membership growth and development to consider running for a Board position.Nominations are being accepted for the following Board positions:
• President-Elect• Treasurer• Region2Director – New Jersey, New York, Puerto Rico• Region6Director – Arkansas, Louisiana, New Mexico, Oklahoma, Texas and all non-US / non-Canada members• Region10Director – Alaska, Idaho, Oregon, Washington• Region12Director – Alberta, British Columbia, Manitoba, Northwest Territories, Nunavut, Saskatchewan, Yukon• StudentAt-largeDirector – North America and beyond
The President-Elect serves a three-year term including one year as President and one year as Immediate Past-President. The Treasurer serves a two-year term. RegionalDirectors serve three-year terms and act and vote in the interests of the Society as a whole, while bringing regional concerns to the attention of the Board. The StudentAt-largeDirector serves a one-year term and acts and votes in the interests of the Society as a whole, while bringing student concerns to the attention of the Board.
Nomination Process
Any member may submit nominations. Candidates must be nominated by at least two members to be eligible and self-nomination is encouraged if supported by two other NALMS members.Nominations are due no later than August18,2015 and must be made in writing and include an address, email address and phone number for the nominee.The Nominations Committee will screen nominees to ensure active membership and conformity with criteria for office, including, but not limited to:
• Demonstrated interest and participation in the Society;• Leadership ability and other qualifications listed in the position requirements; and• Willingness to accept the duties of office as outlined in the position requirements, including commitment to attend
semi-annual board meetings.Submit nominations or questions about Board position requirements to Philip Forsberg via email: [email protected]
™

48 Summer 2015 / NALMS • LAKELINE
Bill Jones Literature Search
Archiv für HydrobiologieJeziorski, A., B. Keller, D.R. Dyer, M.A. Paterson and J.P. Smol. 2015. Differences among modern-day and historical cladoceran communities from the “Ring of Fire” lake region of northern Ontario: Identifying responses to climate warming. Arch für Hydrobiol, 186(3): 203-216.
Ostendorp, W. and J. Ostendorp. 2015. Assessing BMP Effectiveness and Guiding BMP Planning Using Process-Based Modeling. Arch für Hydrobiol, 186(4): 333-352.
CLEAN – Soil, Air, WaterZhang, J., Z. Xie, X. Jiang and Z. Wang. 2015. Control of cyanobacterial blooms via synergistic effects of pulmonates and submerged plants. CLEAN - Soil, Air, Water, 43(3): 330-335.
Critical Review of Environmental Science and TechnologyChang, Ni-Bin, S. Imen and B. Vannah. 2015. Remote sensing for monitoring surface water quality status and ecosystem state in relation to the nutrient cycle: A 40-year perspective. Crit Rev Environ Sci Technol, 45(2): 101-166.
Desalination Water TreatmentAlfonso, Lady S.K., K.J. Madarang, M.Y. Lee, D.H. Lee, M. Paule, A. Cristina, C-H Lee and J-H Kang. 2015. Wet weather discharge characteristics of phosphorus and management implications in a mixed land-use watershed. Desalination Water Treat, 53(11): 3054-3065.
Ecology LettersTaranu, Z.E., I. Gregory-Eaves, P.R. Leavitt, L. Bunting, T. Buchaca, J. Catalan, I. Domaizon, P. Guilizzoni, A. Lami, S. McGowan, H. Moorhouse, G. Morabito, F.R. Pick, M.A. Stevenson, P.L. Thompson and R.D. Vinebrooke. 2015. Acceleration of cyanobacterial dominance in north temperate-subarctic lakes during the Anthropocene. Ecol Letters, 18(4): 375-384.
FisheriesPegg, M.A., K.L. Pope, L.A. Powell, K.C. Turek, J.J. Spurgeon, N.T. Stewart, N.P. Hogberg and M.T. Porath. 2015. Reservoir rehabilitations: seeking the fountain of youth. Fisheries, 40(4): 177-181.
Freshwater BiologyUrrutia-Cordero, P., M.K. Ekvall and L-A Hansson. 2015. Responses of cyanobacteria to herbivorous zooplankton across predator regimes: who mows the bloom? Fresh Biol, 60(5): 960-972.
Journal of the American Water Resources AssociationRittenburg, R.A. A.L. Squires, J. Boll, E.S. Brooks, Z.M. Easton and T.S. Steenhuis. 2015. Agricultural BMP effectiveness and dominant hydrological flow paths: concepts and a review. J Am Water Resour Assoc, 51(2): 305-329.
Brooks, E.S., S.M. Saia, J. Boll, L. Wetzel, Z.M. Easton and T.S. Steenhuis. 2015. Assessing BMP effectiveness and guiding BMP planning using process-based modeling. J Am Water Resour Assoc, 51(2): 343-358.
Kurkalova, L.A. 2015. Cost-effective placement of best management practices in a watershed: lessons learned from conservation effects assessment project. J Am Water Resour Assoc, 51(2): 359-372.
VanLandeghem, M.M., M. Farooqi, G.M. Southard and R. Patiño. 2015. Associations between water physicochemistry and Prymnesium parvum presence, abundance, and toxicity in West Texas reservoirs. J Am Water Resour Assoc, 51(2): 471-486.
VanLandeghem, M.M., M. Farooqi, G.M. Southard and R. Patiño. 2015. Spatiotemporal associations of reservoir nutrient characteristics and the invasive, harmful alga Prymnesium parvum in West Texas. J Am Water Resour Assoc, 51(2): 487-501.
Beardmore, B. 2015. Boater perceptions of environmental issues affecting lakes in northern Wisconsin. J Am Water Resour Assoc, 51(2): 537-549.
Journal of Applied EcologyStewart-Koster, B., J.D. Olden and T.J. Johnson. 2015. Integrating landscape connectivity and habitat suitability to guide offensive and defensive invasive species management. J Applied Ecol, 52(2): 366-378.
Transactions of the American Fisheries SocietyTrebitz, A.S. and J.C. Hoffman. 2015. Coastal wetland support of Great Lakes fisheries: progress from concept to quantification. Trans Am Fish Soc, 144(2): 352-372.
William (Bill) Jones, is LakeLine’s editor and a former NALMS president, and clinical professor (retired) from Indiana University’s School of Public and Environmental Affairs. He can be reached at: 1305 East Richland Drive, Bloomington, IN 47408; e-mail: [email protected]. c

LEARN MORE:PentairAES.com/MAID+1 407.886.3939
ENGINEERING & SYSTEMS DESIGN, CONSULTING, SALES & TECH SUPPORT, SEMINARS, CATALOG
FILTRATIONWATER MOVEMENT
STORAGEWATER QUALITY
FEEDING
© 2015 Pentair Aquatic Eco-Systems, Inc. All Rights Reserved.
STORM-WATER TREATMENT
GO FROM START TO COMPLIANCE
IN AS LITTLE AS SIX WEEKSINTRODUCING
MAID®MOBILE ALUM INJECTION DEVICE
The rapid, simple, affordable answer.• All-in-one unit monitors, treats and reports on
storm-water quality
• Removes up to 95% of phosphorus from your storm water
• No new construction needed
• Avoid noncompliance fines
• You may even qualify for grant assistance
20-foot module with (2) 1,100-gallon tanks and single or dual dosing platforms.
System control and monitoring from home or office.
KEY FEATURES• Alum treatment – the most costeffective method for phosphorus reduction
• Modular design lowers costs and enables modification
• Remote operation – connect by hard wire or cellular
• Flexible dosing options
• Redundant safety features, including email notification
• Highly secure – operator login and tamper-resistant Lake Apopka, Restoration Area

Tough. Fast. Gone.
It’s tough. It’s fast. It’s gone.
nufarm.com/us
©2015 Nufarm. Important: Always read and follow label instructions. Clipper is a registered trademark of Valent U.S.A. Corporation. AM71211.04
When it comes to aquatic plant control, nothing works better than the new contact chemistry of Clipper® Aquatic Herbicide. Clipper delivers a new mode of action for fast and selective control of tough invasive and nuisance plants like cabomba, watermeal, Eurasian watermilfoil, water lettuce, duckweed, giant salvinia and more. Plus, Clipper dissipates quickly from the water column and does not accumulate in sediment. And reduced PPE and the 51% WDG formulation mean easier application and handling. Find out more at nufarm.com/USTO.