a psychoacoustic evaluation of noise signatures … · 1 american institute of aeronautics and...
TRANSCRIPT
1 American Institute of Aeronautics and Astronautics
A Psychoacoustic Evaluation of Noise Signatures from Advanced Civil Transport Aircraft
Stephen A. Rizzi1 and Andrew Christian2 NASA Langley Research Center, Hampton, VA 23681, USA
The NASA Environmentally Responsible Aviation project has been successful in developing and demonstrating technologies for integrated aircraft systems that can simultaneously meet aggressive goals for fuel burn, noise and emissions. Some of the resulting systems substantially differ from the familiar tube and wing designs constituting the current civil transport fleet. This study attempts to explore whether or not the effective perceived noise level metric used in the NASA noise goal accurately reflects human subject response across the range of vehicles considered. Further, it seeks to determine, in a quantitative manner, if the sounds associated with the advanced aircraft are more or less preferable to the reference vehicles beyond any differences revealed by the metric. These explorations are made through psychoacoustic tests in a controlled laboratory environment using simulated stimuli developed from auralizations of selected vehicles based on systems noise assessments.
Nomenclature d = time interval between t1 and t2 (s) PNLT = tone-corrected perceived noise level (PNdB) t1 = earliest time at which PNLT crosses PNLTmax - 10, positive slope (s) t2 = latest time at which PNLT crosses PNLTmax - 10, negative slope (s) tmax = time at PNLTmax (s) Δt = PNLT time increment (s)
I. Introduction HE NASA Environmentally Responsible Aviation (ERA) project has focused on developing and demonstrating technologies for integrated aircraft systems that could simultaneously meet aggressive goals for fuel burn, noise,
and emissions.1 The fuel burn goal is for a reduction of 50% relative to a best-in-class aircraft in 2005; the noise goal is 42 EPNdB cumulative below the Stage 4 requirement;2,3 and the emissions goal is for a reduction of 75% in NOx below the International Civil Aviation Organization (ICAO) Committee on Aviation Environmental Protection (CAEP) 6 standard. The target date is 2020 for key technologies to be at a technology readiness level (TRL) of 4-6 (system or sub-system prototype demonstrated in a relevant environment). This timeline corresponds to a projected aircraft entry into service of 2025. These goals with the timeframe are defined by NASA with the term N+2.
The approach taken to achieve these goals has focused on development of advanced multidiscipline-based concepts and technologies, and highly integrated engine/airframe configurations. Recent noise assessments demonstrated the noise goal is achievable for certain configurations using a combination of ERA technologies in the “N+2” vehicle plus additional Integrated Technology Demonstration (ITD) noise reduction technologies.4 In many cases, the resulting configurations and advanced aircraft technologies substantially differ from the familiar tube and wing designs constituting the current fleet. A companion work focused on the auralization of selected N+2 and reference vehicle concepts based on those assessments, where it was shown that the N+2 aircraft noise can differ from the reference vehicles not only in level, but also in their spectral content.5
This paper attempts to explore whether or not the effective perceived noise level (EPNL) metric used for the NASA noise goal accurately reflects human subject response across the range of vehicles considered. Further, it seeks to determine, in a quantitative manner, if the sounds associated with N+2 aircraft are more or less preferable to the reference vehicles beyond any differences revealed by the metric. These objectives are investigated through psychoacoustic testing in the Exterior Effects Room (EER)6 at the NASA Langley Research Center using the auralized sounds from the companion work as test stimuli. More specifically, the research questions to be addressed are:
1 Senior Researcher for Aeroacoustics, Aeroacoustics Branch, MS 463, Associate Fellow AIAA 2 Research Engineer, Structural Acoustics Branch, MS 463, Member AIAA
T
https://ntrs.nasa.gov/search.jsp?R=20160009096 2018-07-29T22:26:59+00:00Z
2 American Institute of Aeronautics and Astronautics
1. Are there significant differences in annoyance ratings of sounds taken from similar points in the flyover of different vehicles when presented at the same PNLT level? In other words, is there a significant component of annoyance present in the auralizations that is not captured by PNLT?
2. If so, is there a way to quantify these differences? 3. Can differences in PNLT be used to estimate a change in EPNL between the standard metric value
and perceived value?
In this paper, the N+2 and reference vehicle concepts studied are first presented. The process for auralization of system noise assessments is then briefly reviewed. Next, psychoacoustic test and data processing methods specific to each research question are introduced. Finally, comparisons of results for the concepts within two vehicle classes (single-aisle and large twin-aisle) having different airframe and engine configurations are made.
II. N+2 Aircraft Concepts Auralizations were generated for seven concepts selected from a greater number considered under the ERA final
noise assessments.4 These are the five N+2 concepts
• a single-aisle (SA), 160 passenger class tube and wing aircraft (T+W160) with two small geared turbofan (GTF) engines,
• a large twin-aisle (LTA), 301 passenger class tube and wing aircraft (T+W301) with two large direct drive (DD) engines,
• an LTA T+W301 aircraft with two large GTF engines, • an LTA hybrid wing body aircraft (HWB301) with two large GTF engines, • an LTA mid-fuselage nacelle aircraft (MFN301) with two large GTF engines,
and two reference vehicles
• a Boeing 737-800-like aircraft with two CFM56-like direct drive engines (reference vehicle for the T+W160 vehicle in the SA class), and
• a Boeing 777-200LR-like aircraft with two GE90-110B-like direct drive engines (reference vehicle for the T+W301, HWB301 and MFN301 in the LTA class).
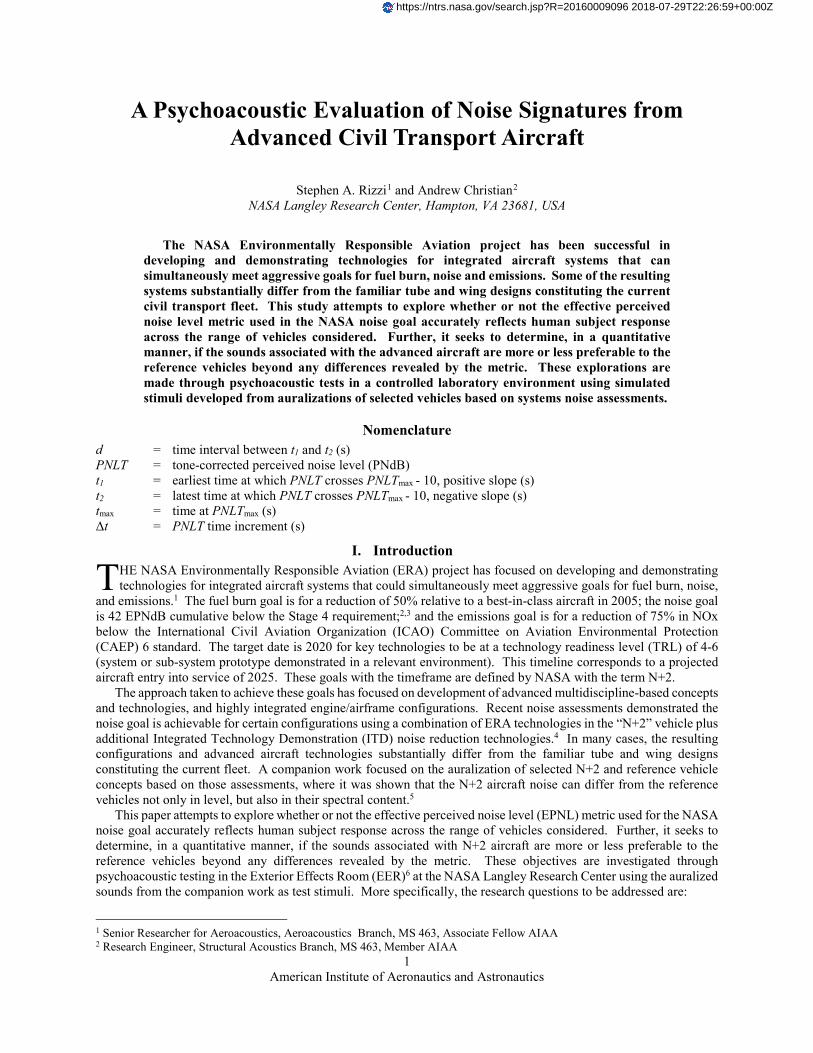
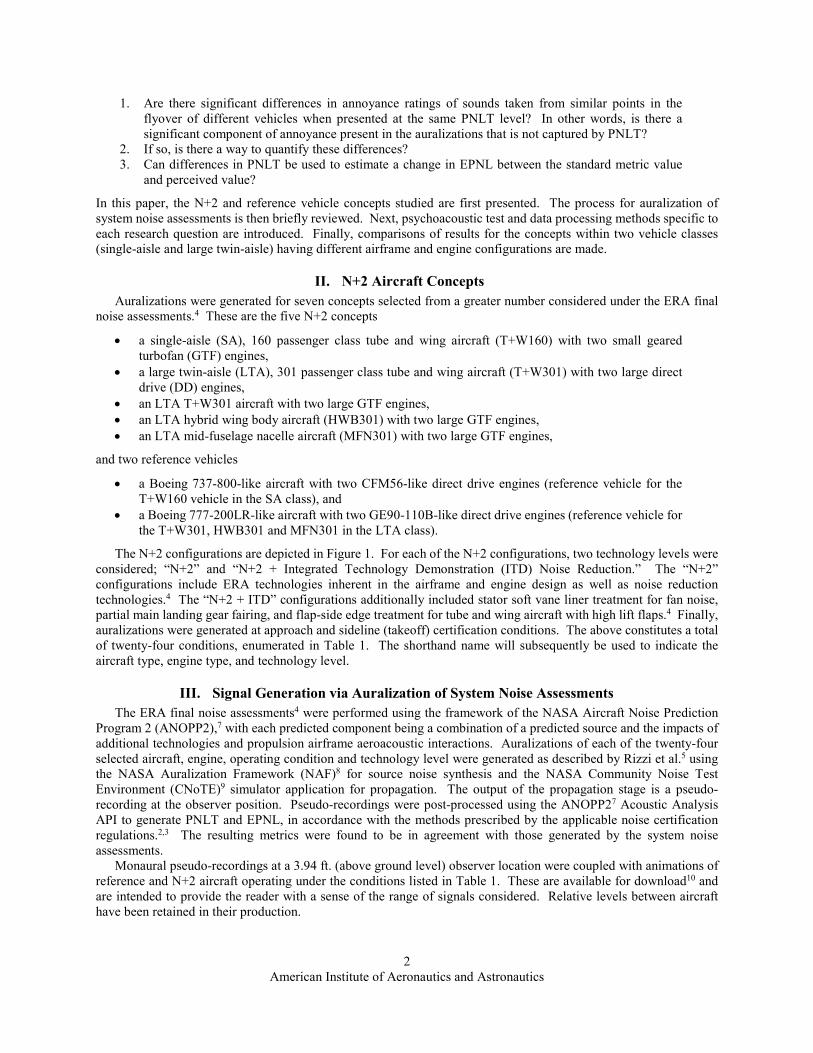
The N+2 configurations are depicted in Figure 1. For each of the N+2 configurations, two technology levels were considered; “N+2” and “N+2 + Integrated Technology Demonstration (ITD) Noise Reduction.” The “N+2” configurations include ERA technologies inherent in the airframe and engine design as well as noise reduction technologies.4 The “N+2 + ITD” configurations additionally included stator soft vane liner treatment for fan noise, partial main landing gear fairing, and flap-side edge treatment for tube and wing aircraft with high lift flaps.4 Finally, auralizations were generated at approach and sideline (takeoff) certification conditions. The above constitutes a total of twenty-four conditions, enumerated in Table 1. The shorthand name will subsequently be used to indicate the aircraft type, engine type, and technology level.
III. Signal Generation via Auralization of System Noise Assessments The ERA final noise assessments4 were performed using the framework of the NASA Aircraft Noise Prediction
Program 2 (ANOPP2),7 with each predicted component being a combination of a predicted source and the impacts of additional technologies and propulsion airframe aeroacoustic interactions. Auralizations of each of the twenty-four selected aircraft, engine, operating condition and technology level were generated as described by Rizzi et al.5 using the NASA Auralization Framework (NAF)8 for source noise synthesis and the NASA Community Noise Test Environment (CNoTE)9 simulator application for propagation. The output of the propagation stage is a pseudo-recording at the observer position. Pseudo-recordings were post-processed using the ANOPP27 Acoustic Analysis API to generate PNLT and EPNL, in accordance with the methods prescribed by the applicable noise certification regulations.2,3 The resulting metrics were found to be in agreement with those generated by the system noise assessments.
Monaural pseudo-recordings at a 3.94 ft. (above ground level) observer location were coupled with animations of reference and N+2 aircraft operating under the conditions listed in Table 1. These are available for download10 and are intended to provide the reader with a sense of the range of signals considered. Relative levels between aircraft have been retained in their production.
3 American Institute of Aeronautics and Astronautics
T+W160
T+W301
HWB301
MFN301
Figure 1: N+2 aircraft configurations under investigation.
Table 1: Summary of aircraft auralizations.
ID Aircraft Engine Condition Technology Level Shorthand Name 1
777-GE90-110B-like DD Approach
Reference LTA-Ref 2 Sideline 3
737-CFM56-like DD Approach
Reference SA-Ref 4 Sideline 5
T+W301 GTF Approach N+2 T+W301-GTF
6 N+2 + ITD T+W301-GTF-ITD 7
Sideline N+2 T+W301-GTF 8 N+2 + ITD T+W301-GTF-ITD 9
T+W301 DD Approach N+2 T+W301-DD
10 N+2 + ITD T+W301-DD-ITD 11
Sideline N+2 T+W301-DD 12 N+2 + ITD T+W301-DD-ITD 13
MFN301 GTF Approach N+2 MFN301-GTF
14 N+2 + ITD MFN301-GTF-ITD 15
Sideline N+2 MFN301-GTF 16 N+2 + ITD MFN301-GTF-ITD 17
T+W160 GTF Approach N+2 T+W160-GTF
18 N+2 + ITD T+W160-GTF-ITD 19
Sideline N+2 T+W160-GTF 20 N+2 + ITD T+W160-GTF-ITD 21
HWB301 GTF Approach N+2 HWB301-GTF
22 N+2 + ITD HWB301-GTF-ITD 23
Sideline N+2 HWB301-GTF 24 N+2 + ITD HWB301-GTF-ITD
4 American Institute of Aeronautics and Astronautics
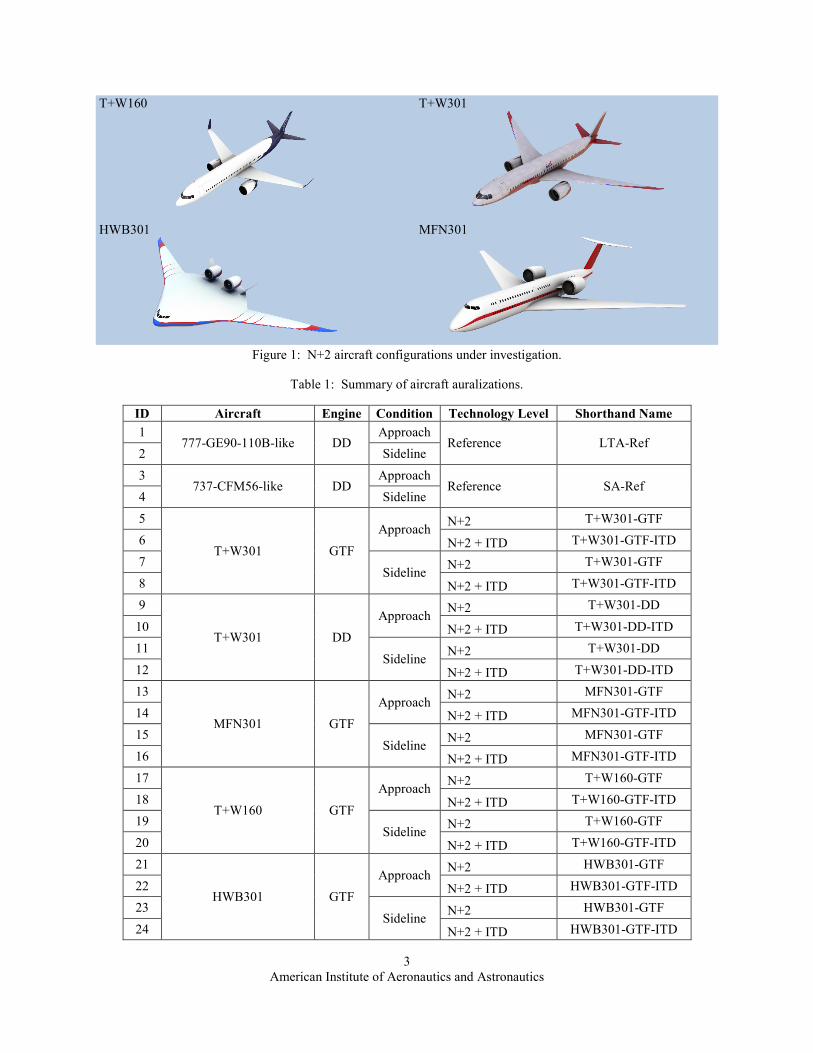
The auralization results used in this study were exclusively associated with an observer flush with the ground. This location produces smoother PNLT time histories than those generated at the 3.94 ft. certification microphone location, where the superposition of direct and ground reflected sound makes the traces more irregular. Smooth PNLT time histories are desirable in the subsequent analyses. Example PNLT time histories for the SA reference aircraft on sideline and the HWB301-GTF-ITD aircraft on approach, shown in Figure 2, are provided to demonstrate how traces can differ in character between cases.
Effective perceived noise level for an aircraft flight event is calculated as the logarithmic sum of PNLT levels over the noise duration, that is,
( )( )/
1010
0
110 log 10
PNLT kd t
k
EPNL tT
∆
=
= ∆
∑ (1)
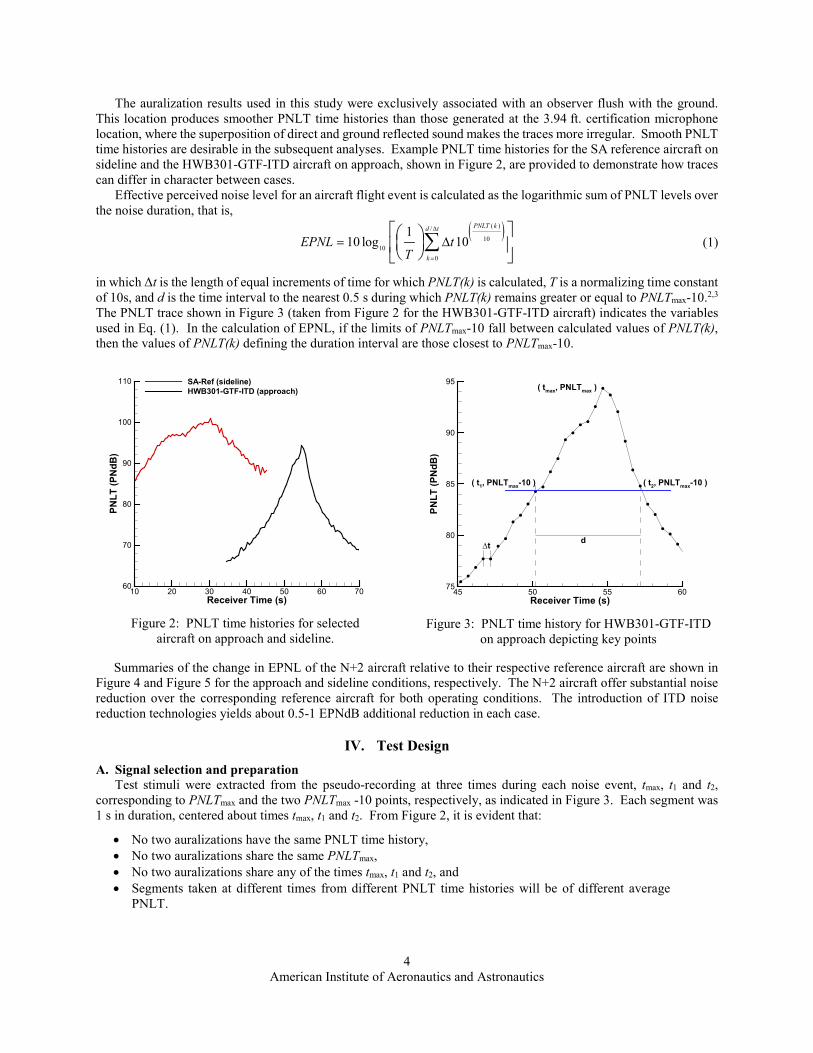
in which Δt is the length of equal increments of time for which PNLT(k) is calculated, T is a normalizing time constant of 10s, and d is the time interval to the nearest 0.5 s during which PNLT(k) remains greater or equal to PNLTmax-10.2,3 The PNLT trace shown in Figure 3 (taken from Figure 2 for the HWB301-GTF-ITD aircraft) indicates the variables used in Eq. (1). In the calculation of EPNL, if the limits of PNLTmax-10 fall between calculated values of PNLT(k), then the values of PNLT(k) defining the duration interval are those closest to PNLTmax-10.
Figure 2: PNLT time histories for selected
aircraft on approach and sideline.
Figure 3: PNLT time history for HWB301-GTF-ITD
on approach depicting key points
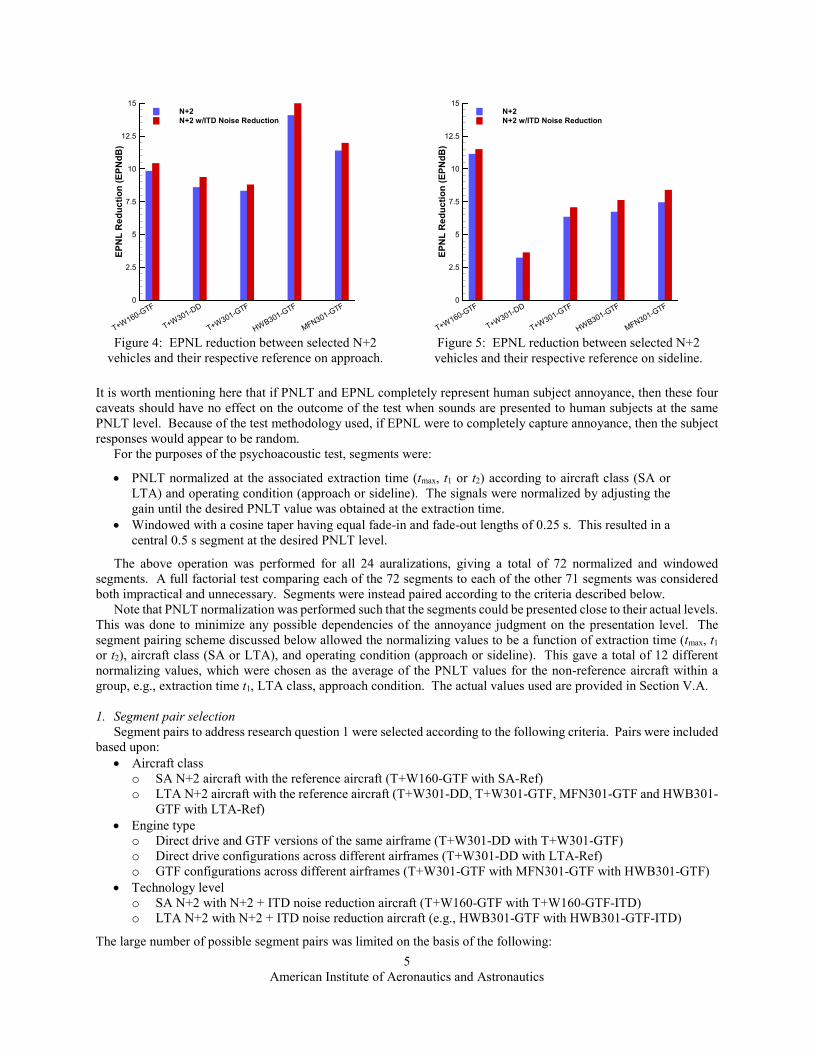
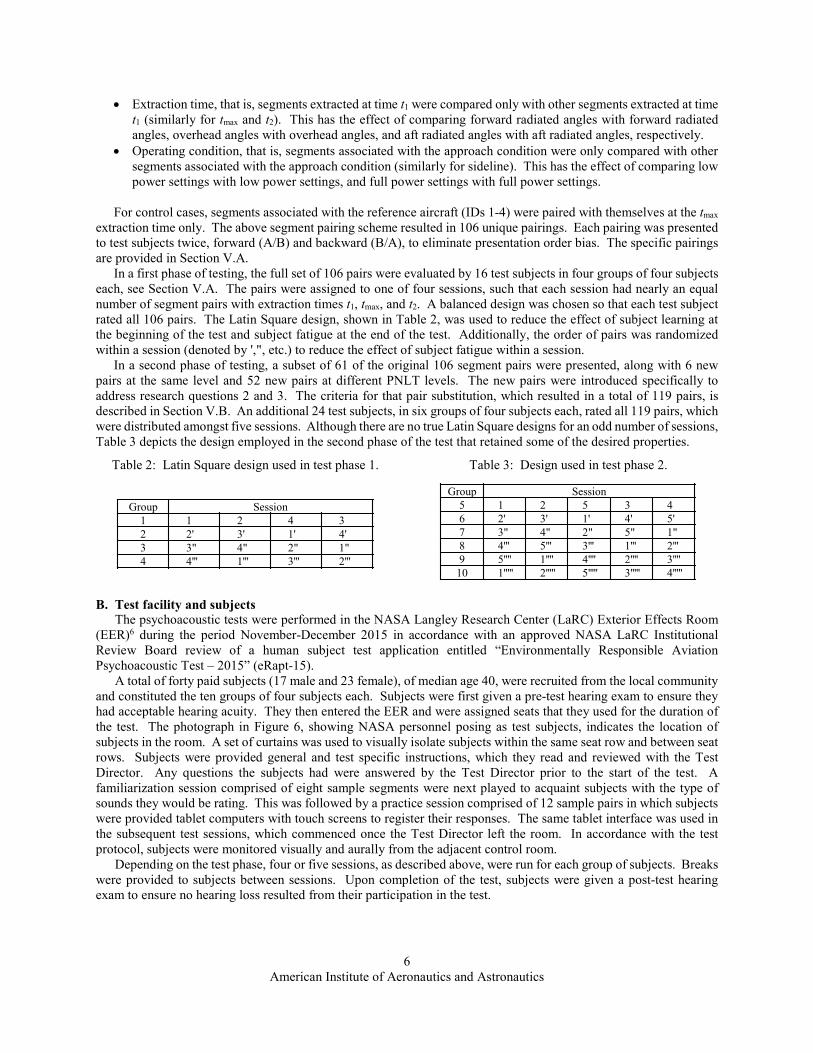
Summaries of the change in EPNL of the N+2 aircraft relative to their respective reference aircraft are shown in Figure 4 and Figure 5 for the approach and sideline conditions, respectively. The N+2 aircraft offer substantial noise reduction over the corresponding reference aircraft for both operating conditions. The introduction of ITD noise reduction technologies yields about 0.5-1 EPNdB additional reduction in each case.
IV. Test Design A. Signal selection and preparation
Test stimuli were extracted from the pseudo-recording at three times during each noise event, tmax, t1 and t2, corresponding to PNLTmax and the two PNLTmax -10 points, respectively, as indicated in Figure 3. Each segment was 1 s in duration, centered about times tmax, t1 and t2. From Figure 2, it is evident that:
• No two auralizations have the same PNLT time history, • No two auralizations share the same PNLTmax, • No two auralizations share any of the times tmax, t1 and t2, and • Segments taken at different times from different PNLT time histories will be of different average
PNLT.
Receiver Time (s)
PNLT
(PN
dB)
10 20 30 40 50 60 7060
70
80
90
100
110 SA-Ref (sideline)HWB301-GTF-ITD (approach)
Receiver Time (s)
PNLT
(PN
dB)
45 50 55 6075
80
85
90
95( tmax, PNLTmax )
∆t d
( t1, PNLTmax-10 ) ( t2, PNLTmax-10 )
5 American Institute of Aeronautics and Astronautics
Figure 4: EPNL reduction between selected N+2
vehicles and their respective reference on approach.
Figure 5: EPNL reduction between selected N+2 vehicles and their respective reference on sideline.
It is worth mentioning here that if PNLT and EPNL completely represent human subject annoyance, then these four caveats should have no effect on the outcome of the test when sounds are presented to human subjects at the same PNLT level. Because of the test methodology used, if EPNL were to completely capture annoyance, then the subject responses would appear to be random.
For the purposes of the psychoacoustic test, segments were:
• PNLT normalized at the associated extraction time (tmax, t1 or t2) according to aircraft class (SA or LTA) and operating condition (approach or sideline). The signals were normalized by adjusting the gain until the desired PNLT value was obtained at the extraction time.
• Windowed with a cosine taper having equal fade-in and fade-out lengths of 0.25 s. This resulted in a central 0.5 s segment at the desired PNLT level.
The above operation was performed for all 24 auralizations, giving a total of 72 normalized and windowed segments. A full factorial test comparing each of the 72 segments to each of the other 71 segments was considered both impractical and unnecessary. Segments were instead paired according to the criteria described below.
Note that PNLT normalization was performed such that the segments could be presented close to their actual levels. This was done to minimize any possible dependencies of the annoyance judgment on the presentation level. The segment pairing scheme discussed below allowed the normalizing values to be a function of extraction time (tmax, t1 or t2), aircraft class (SA or LTA), and operating condition (approach or sideline). This gave a total of 12 different normalizing values, which were chosen as the average of the PNLT values for the non-reference aircraft within a group, e.g., extraction time t1, LTA class, approach condition. The actual values used are provided in Section V.A.
1. Segment pair selection
Segment pairs to address research question 1 were selected according to the following criteria. Pairs were included based upon:
• Aircraft class o SA N+2 aircraft with the reference aircraft (T+W160-GTF with SA-Ref) o LTA N+2 aircraft with the reference aircraft (T+W301-DD, T+W301-GTF, MFN301-GTF and HWB301-
GTF with LTA-Ref) • Engine type
o Direct drive and GTF versions of the same airframe (T+W301-DD with T+W301-GTF) o Direct drive configurations across different airframes (T+W301-DD with LTA-Ref) o GTF configurations across different airframes (T+W301-GTF with MFN301-GTF with HWB301-GTF)
• Technology level o SA N+2 with N+2 + ITD noise reduction aircraft (T+W160-GTF with T+W160-GTF-ITD) o LTA N+2 with N+2 + ITD noise reduction aircraft (e.g., HWB301-GTF with HWB301-GTF-ITD)
The large number of possible segment pairs was limited on the basis of the following:
EPN
LR
educ
tion
(EPN
dB)
T+W160-GTF
T+W301-DD
T+W301-GTF
HWB301-GTF
MFN301-GTF0
2.5
5
7.5
10
12.5
15N+2N+2 w/ITD Noise Reduction
EPN
LR
educ
tion
(EPN
dB)
T+W160-GTF
T+W301-DD
T+W301-GTF
HWB301-GTF
MFN301-GTF0
2.5
5
7.5
10
12.5
15N+2N+2 w/ITD Noise Reduction
6 American Institute of Aeronautics and Astronautics
• Extraction time, that is, segments extracted at time t1 were compared only with other segments extracted at time t1 (similarly for tmax and t2). This has the effect of comparing forward radiated angles with forward radiated angles, overhead angles with overhead angles, and aft radiated angles with aft radiated angles, respectively.
• Operating condition, that is, segments associated with the approach condition were only compared with other segments associated with the approach condition (similarly for sideline). This has the effect of comparing low power settings with low power settings, and full power settings with full power settings.
For control cases, segments associated with the reference aircraft (IDs 1-4) were paired with themselves at the tmax
extraction time only. The above segment pairing scheme resulted in 106 unique pairings. Each pairing was presented to test subjects twice, forward (A/B) and backward (B/A), to eliminate presentation order bias. The specific pairings are provided in Section V.A.
In a first phase of testing, the full set of 106 pairs were evaluated by 16 test subjects in four groups of four subjects each, see Section V.A. The pairs were assigned to one of four sessions, such that each session had nearly an equal number of segment pairs with extraction times t1, tmax, and t2. A balanced design was chosen so that each test subject rated all 106 pairs. The Latin Square design, shown in Table 2, was used to reduce the effect of subject learning at the beginning of the test and subject fatigue at the end of the test. Additionally, the order of pairs was randomized within a session (denoted by ',", etc.) to reduce the effect of subject fatigue within a session.
In a second phase of testing, a subset of 61 of the original 106 segment pairs were presented, along with 6 new pairs at the same level and 52 new pairs at different PNLT levels. The new pairs were introduced specifically to address research questions 2 and 3. The criteria for that pair substitution, which resulted in a total of 119 pairs, is described in Section V.B. An additional 24 test subjects, in six groups of four subjects each, rated all 119 pairs, which were distributed amongst five sessions. Although there are no true Latin Square designs for an odd number of sessions, Table 3 depicts the design employed in the second phase of the test that retained some of the desired properties.
Table 2: Latin Square design used in test phase 1.
Table 3: Design used in test phase 2.
B. Test facility and subjects The psychoacoustic tests were performed in the NASA Langley Research Center (LaRC) Exterior Effects Room
(EER)6 during the period November-December 2015 in accordance with an approved NASA LaRC Institutional Review Board review of a human subject test application entitled “Environmentally Responsible Aviation Psychoacoustic Test – 2015” (eRapt-15).
A total of forty paid subjects (17 male and 23 female), of median age 40, were recruited from the local community and constituted the ten groups of four subjects each. Subjects were first given a pre-test hearing exam to ensure they had acceptable hearing acuity. They then entered the EER and were assigned seats that they used for the duration of the test. The photograph in Figure 6, showing NASA personnel posing as test subjects, indicates the location of subjects in the room. A set of curtains was used to visually isolate subjects within the same seat row and between seat rows. Subjects were provided general and test specific instructions, which they read and reviewed with the Test Director. Any questions the subjects had were answered by the Test Director prior to the start of the test. A familiarization session comprised of eight sample segments were next played to acquaint subjects with the type of sounds they would be rating. This was followed by a practice session comprised of 12 sample pairs in which subjects were provided tablet computers with touch screens to register their responses. The same tablet interface was used in the subsequent test sessions, which commenced once the Test Director left the room. In accordance with the test protocol, subjects were monitored visually and aurally from the adjacent control room.
Depending on the test phase, four or five sessions, as described above, were run for each group of subjects. Breaks were provided to subjects between sessions. Upon completion of the test, subjects were given a post-test hearing exam to ensure no hearing loss resulted from their participation in the test.
Group Session1 1 2 4 32 2' 3' 1' 4'3 3" 4" 2" 1"4 4''' 1''' 3''' 2'''
Group Session5 1 2 5 3 46 2' 3' 1' 4' 5'7 3" 4" 2" 5" 1"8 4''' 5''' 3''' 1''' 2'''9 5'''' 1'''' 4'''' 2'''' 3''''
10 1''''' 2''''' 5''''' 3''''' 4'''''
7 American Institute of Aeronautics and Astronautics
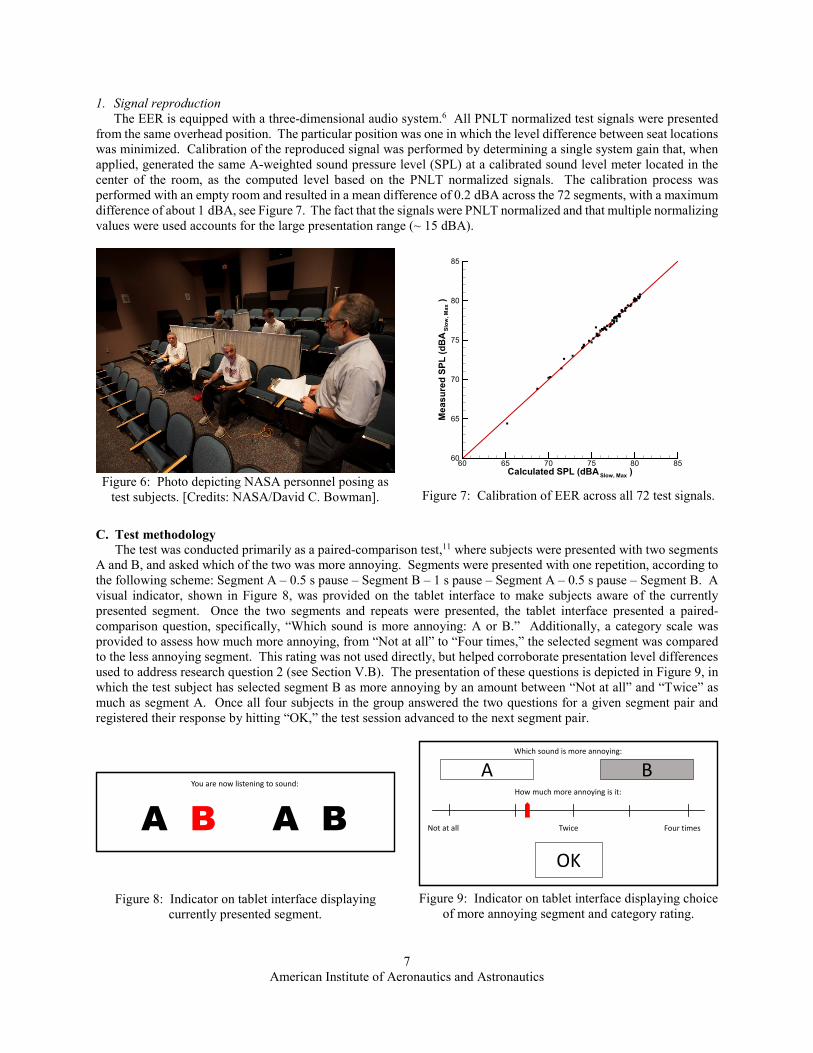
1. Signal reproduction The EER is equipped with a three-dimensional audio system.6 All PNLT normalized test signals were presented
from the same overhead position. The particular position was one in which the level difference between seat locations was minimized. Calibration of the reproduced signal was performed by determining a single system gain that, when applied, generated the same A-weighted sound pressure level (SPL) at a calibrated sound level meter located in the center of the room, as the computed level based on the PNLT normalized signals. The calibration process was performed with an empty room and resulted in a mean difference of 0.2 dBA across the 72 segments, with a maximum difference of about 1 dBA, see Figure 7. The fact that the signals were PNLT normalized and that multiple normalizing values were used accounts for the large presentation range (~ 15 dBA).
Figure 6: Photo depicting NASA personnel posing as
test subjects. [Credits: NASA/David C. Bowman].
Figure 7: Calibration of EER across all 72 test signals.
C. Test methodology The test was conducted primarily as a paired-comparison test,11 where subjects were presented with two segments
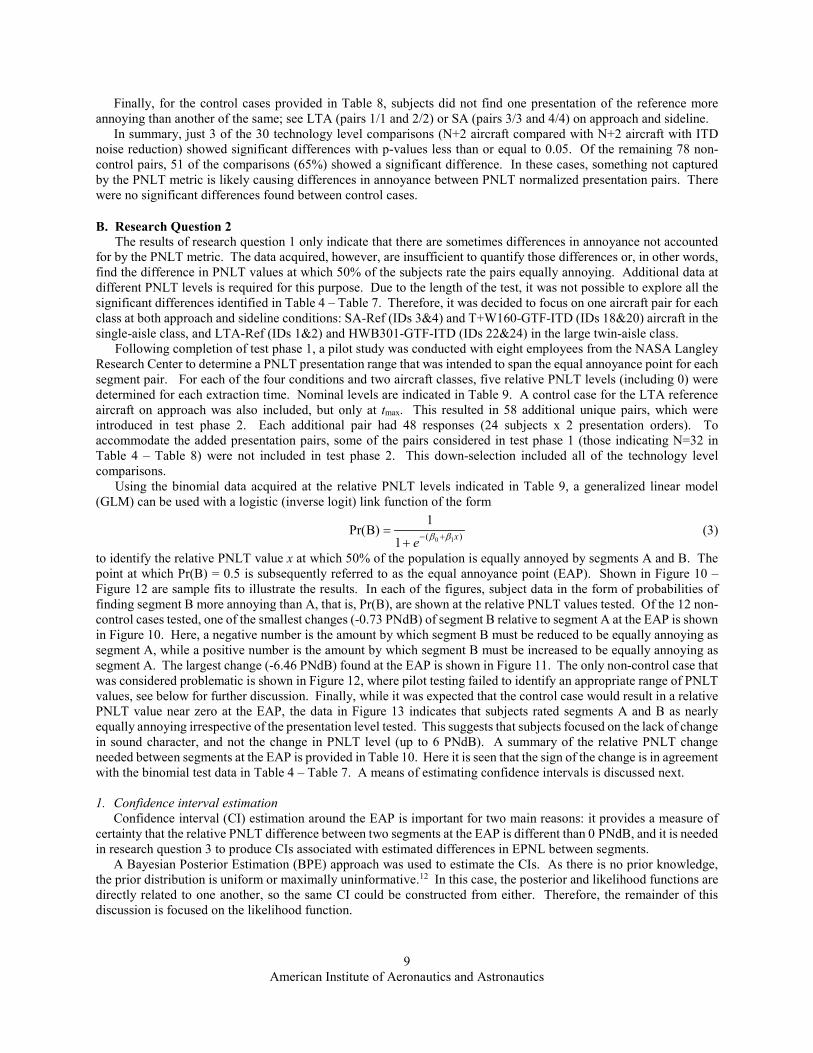
A and B, and asked which of the two was more annoying. Segments were presented with one repetition, according to the following scheme: Segment A – 0.5 s pause – Segment B – 1 s pause – Segment A – 0.5 s pause – Segment B. A visual indicator, shown in Figure 8, was provided on the tablet interface to make subjects aware of the currently presented segment. Once the two segments and repeats were presented, the tablet interface presented a paired-comparison question, specifically, “Which sound is more annoying: A or B.” Additionally, a category scale was provided to assess how much more annoying, from “Not at all” to “Four times,” the selected segment was compared to the less annoying segment. This rating was not used directly, but helped corroborate presentation level differences used to address research question 2 (see Section V.B). The presentation of these questions is depicted in Figure 9, in which the test subject has selected segment B as more annoying by an amount between “Not at all” and “Twice” as much as segment A. Once all four subjects in the group answered the two questions for a given segment pair and registered their response by hitting “OK,” the test session advanced to the next segment pair.
Figure 8: Indicator on tablet interface displaying currently presented segment.
Figure 9: Indicator on tablet interface displaying choice
of more annoying segment and category rating.
Calculated SPL (dBA Slow, Max )
Mea
sure
dSP
L(d
BA
Slow
,Max
)
60 65 70 75 80 8560
65
70
75
80
85
A B A BYou are now listening to sound:
Which sound is more annoying:
A B
OK
How much more annoying is it:
Twice Four timesNot at all

8 American Institute of Aeronautics and Astronautics
V. Data Analysis and Results
A. Research Question 1 Recall research question 1 asks “is there a significant component of annoyance present in the auralizations that is
not captured by PNLT?” This research question can be addressed using a binomial test with the null hypothesis H0 0 : Pr(A) Pr(B) 0.5H = = (2)
in which Pr(A) is the probability that segment A is more annoying than B, and Pr(B) is the probability that segment B is more annoying than A. A p-value ≤ 0.05 is an indicator, but not proof, that the null hypothesis should be rejected. In other words, when p ≤ 0.05, it indicates that subjects are not likely to choose segment A and B with equal probability. In these cases, since segments A and B are PNLT normalized, it indicates that something not captured by PNLT is likely causing differences in annoyance. It is important to note that the results presented herein indicate nothing about the relative annoyance of A versus B when presented at their actual levels.
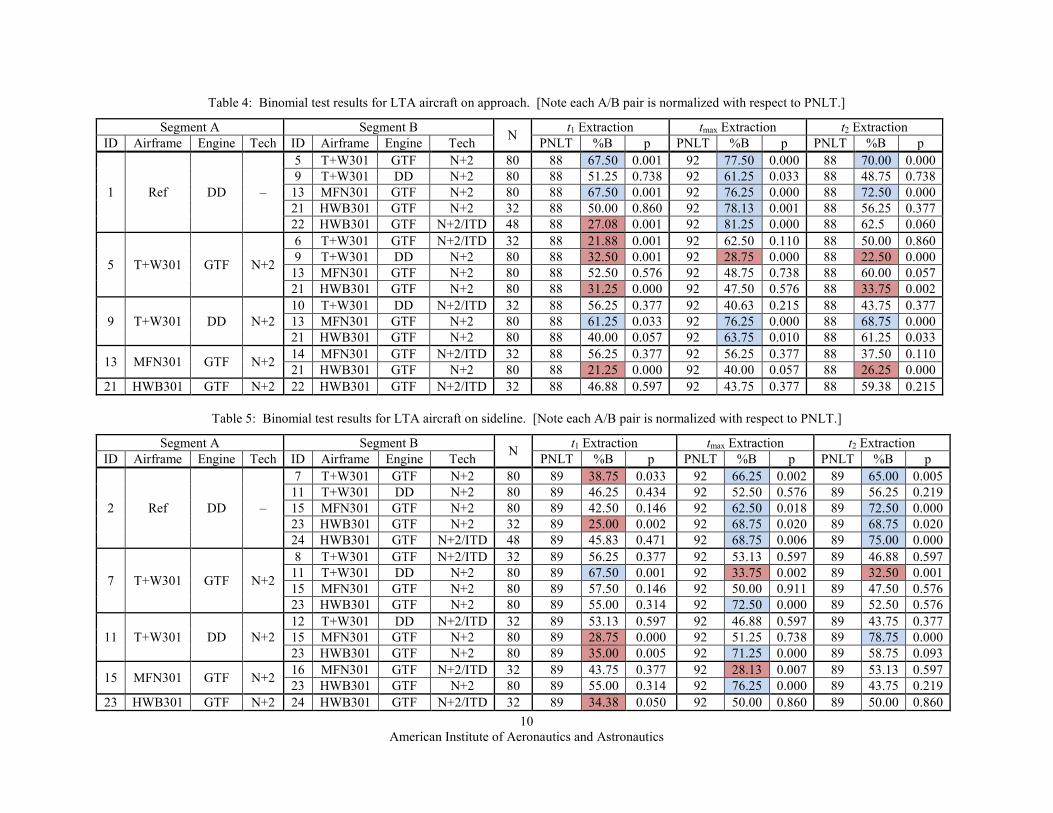
Binomial test results for the LTA aircraft on approach, LTA aircraft on sideline, SA aircraft on approach, SA aircraft on sideline, and reference aircraft at tmax, are provided in Table 4 – Table 8, respectively. Each table provides the source of segments A and B, the number of subject responses N, the PNLT normalization level (PNdB), the percent of respondents choosing segment B more annoying than segment A, and the p-value. Note that as a result of splitting the test into two phases, 61 of the original 106 pairs received N=80 subject responses (16+24 subjects x 2 presentation orders), 45 of the original 106 pairs received N=32 subject responses (16 subjects x 2 presentation orders), and 6 additional pairs added to address research question 2 received N=48 subject responses (24 subjects x 2 presentation orders). In the tables, cells filled in blue indicate subjects find segment B more annoying than segment A when p ≤ 0.05, while cells filled in pink indicate subjects find segment A more annoying than segment B when p ≤ 0.05.
Regarding the LTA aircraft on approach, consider Table 4 and the segment pairing criteria in Section IV.A.1. In the comparison between the LTA reference and N+2 aircraft (pairs 1/5, 1/9, 1/13 and 1/21), subjects find the T+W301-GTF (ID 5) and MFN301-GTF (ID 13) more annoying than the reference (ID 1) at all three extraction times, and find the HWB301-GTF (ID 21) more annoying than the reference (ID 1), but only at tmax. For the comparison of direct drive and GTF versions of the same airframe (pair 5/9), subjects find the T+W301-GTF (ID 5) more annoying than the T+W301-DD (ID 9) at all three extraction times. In the comparison of configurations with direct drive engines across different airframes (pair 1/9), subjects were more annoyed at the T+W301-DD (ID 9) than the reference (ID 1), but only at tmax. In the comparison of configurations with GTF engines across different airframes (pairs 5/13, 5/21 and 13/21) , subjects did not find either T+W301-GTF (ID 5) or MFN301-GTF (ID 13) more annoying than the other at any extraction times, but found T+W301-GTF (ID 5) more annoying than the HWB301-GTF (ID 21) at t1 and t2. In contrast, subjects found the MFN301-GTF (ID 13) more annoying than the HWB301-GTF (ID 21) at those times. Finally, there was only one case in which subjects found an N+2 aircraft more annoying than its counterpart with ITD noise reduction aircraft (pairs 5/6, 9/10, 13/14 and 21/22); that was for the T+W301-GTF (ID 5) which subjects found more annoying than the T+W301-GTF-ITD (ID 6) at t1.
With respect to the LTA aircraft on sideline, Table 5 tells a different story. In the comparison between the reference and N+2 aircraft (pairs 2/7, 2/11, 2/15 and 2/23), subjects found the T+W301-GTF (ID 7) and HWB301-GTF (ID 23) less annoying than the LTA reference (ID 2) at t1, but more annoying at tmax and t2. The MFN301-GTF (ID 15) was also found more annoying than the LTA reference (ID 2) at tmax and t2. In the comparison of direct drive and GTF versions of the same airframe on approach, subjects consistently found the T+W301-GTF (ID 5) more annoying than the T+W301-DD aircraft (ID 9). On sideline (pair 7/11) however, the T+W301-DD (ID 11) was more annoying at t1 while the other two times were similar to the approach condition. Comparing configurations with GTF engines across different airframes (pairs 5/15, 7/23, and 15/23), as on approach, subjects did not find either T+W301-GTF (ID 7) or MFN301-GTF (ID 15) more annoying than the other at any time, but found the HWB301-GTF (ID 23) more annoying than the T+W301-GTF (ID 7), but only at tmax. Similarly, subjects found the HWB301-GTF (ID 23) more annoying than the MDN301-GTF (ID 15), but only at tmax. There were two cases in which subjects found aircraft with N+2 technology more annoying than N+2 with ITD noise reduction (pairs 7/8, 11/12, 15/16, and 23/24); one case was between the MFN301-GTF (ID15) and MFN301-GTF-ITD (ID 16) at tmax; the other was between the HWB301-GTF (ID 23) and HWB301-ITD (ID 24) at t1.
Table 6 indicates that the T+W160-GTF (ID 17) and T+W160-GTF-ITD (ID 18) are both more annoying than the SA reference (ID 3) on approach at tmax and t2. The T+W160-GTF (ID 17) was also found less annoying than the SA reference (ID 3) at t1. Table 7 shows that the T+W160-GTF (ID 19) and T+W160-GTF-ITD (ID 20) are more annoying than the SA reference (ID 4) on sideline at all extraction times. At no time did subjects favor one technology level over the other, on either approach or sideline.
9 American Institute of Aeronautics and Astronautics
Finally, for the control cases provided in Table 8, subjects did not find one presentation of the reference more annoying than another of the same; see LTA (pairs 1/1 and 2/2) or SA (pairs 3/3 and 4/4) on approach and sideline.
In summary, just 3 of the 30 technology level comparisons (N+2 aircraft compared with N+2 aircraft with ITD noise reduction) showed significant differences with p-values less than or equal to 0.05. Of the remaining 78 non-control pairs, 51 of the comparisons (65%) showed a significant difference. In these cases, something not captured by the PNLT metric is likely causing differences in annoyance between PNLT normalized presentation pairs. There were no significant differences found between control cases.
B. Research Question 2 The results of research question 1 only indicate that there are sometimes differences in annoyance not accounted
for by the PNLT metric. The data acquired, however, are insufficient to quantify those differences or, in other words, find the difference in PNLT values at which 50% of the subjects rate the pairs equally annoying. Additional data at different PNLT levels is required for this purpose. Due to the length of the test, it was not possible to explore all the significant differences identified in Table 4 – Table 7. Therefore, it was decided to focus on one aircraft pair for each class at both approach and sideline conditions: SA-Ref (IDs 3&4) and T+W160-GTF-ITD (IDs 18&20) aircraft in the single-aisle class, and LTA-Ref (IDs 1&2) and HWB301-GTF-ITD (IDs 22&24) in the large twin-aisle class.
Following completion of test phase 1, a pilot study was conducted with eight employees from the NASA Langley Research Center to determine a PNLT presentation range that was intended to span the equal annoyance point for each segment pair. For each of the four conditions and two aircraft classes, five relative PNLT levels (including 0) were determined for each extraction time. Nominal levels are indicated in Table 9. A control case for the LTA reference aircraft on approach was also included, but only at tmax. This resulted in 58 additional unique pairs, which were introduced in test phase 2. Each additional pair had 48 responses (24 subjects x 2 presentation orders). To accommodate the added presentation pairs, some of the pairs considered in test phase 1 (those indicating N=32 in Table 4 – Table 8) were not included in test phase 2. This down-selection included all of the technology level comparisons.
Using the binomial data acquired at the relative PNLT levels indicated in Table 9, a generalized linear model (GLM) can be used with a logistic (inverse logit) link function of the form
0 1( )
1Pr(B)
1 xe β β− +=+
(3)
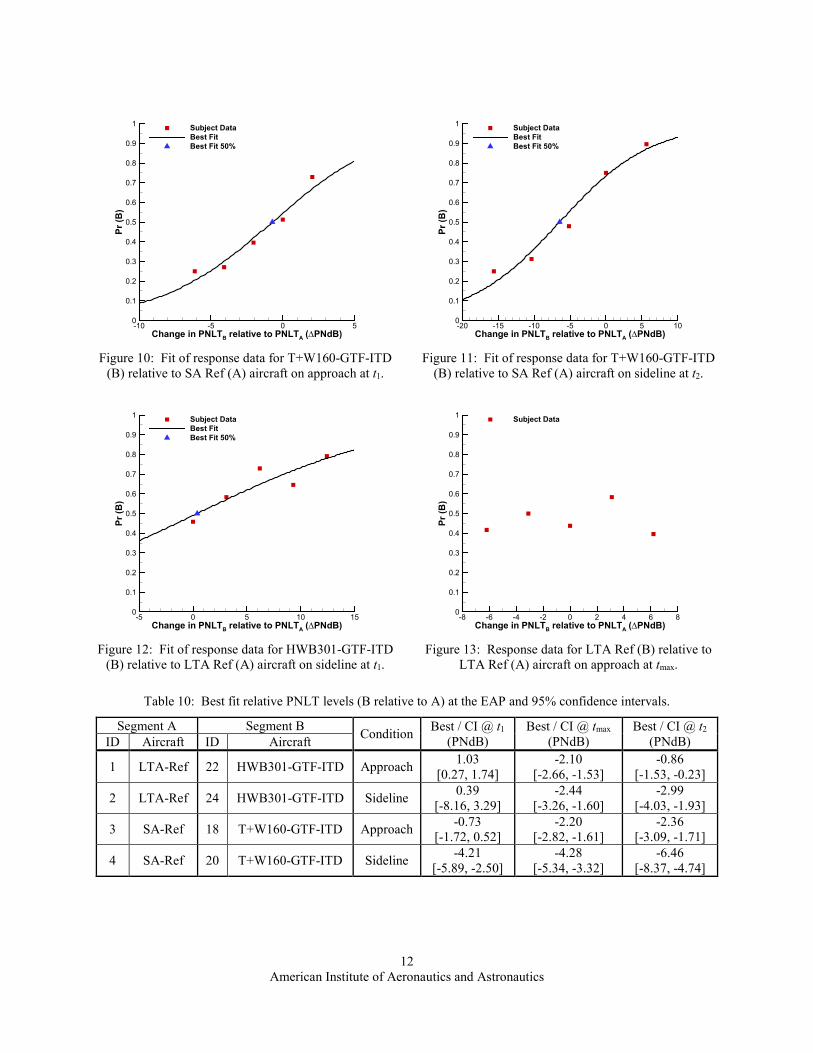
to identify the relative PNLT value x at which 50% of the population is equally annoyed by segments A and B. The point at which Pr(B) = 0.5 is subsequently referred to as the equal annoyance point (EAP). Shown in Figure 10 – Figure 12 are sample fits to illustrate the results. In each of the figures, subject data in the form of probabilities of finding segment B more annoying than A, that is, Pr(B), are shown at the relative PNLT values tested. Of the 12 non-control cases tested, one of the smallest changes (-0.73 PNdB) of segment B relative to segment A at the EAP is shown in Figure 10. Here, a negative number is the amount by which segment B must be reduced to be equally annoying as segment A, while a positive number is the amount by which segment B must be increased to be equally annoying as segment A. The largest change (-6.46 PNdB) found at the EAP is shown in Figure 11. The only non-control case that was considered problematic is shown in Figure 12, where pilot testing failed to identify an appropriate range of PNLT values, see below for further discussion. Finally, while it was expected that the control case would result in a relative PNLT value near zero at the EAP, the data in Figure 13 indicates that subjects rated segments A and B as nearly equally annoying irrespective of the presentation level tested. This suggests that subjects focused on the lack of change in sound character, and not the change in PNLT level (up to 6 PNdB). A summary of the relative PNLT change needed between segments at the EAP is provided in Table 10. Here it is seen that the sign of the change is in agreement with the binomial test data in Table 4 – Table 7. A means of estimating confidence intervals is discussed next. 1. Confidence interval estimation
Confidence interval (CI) estimation around the EAP is important for two main reasons: it provides a measure of certainty that the relative PNLT difference between two segments at the EAP is different than 0 PNdB, and it is needed in research question 3 to produce CIs associated with estimated differences in EPNL between segments.
A Bayesian Posterior Estimation (BPE) approach was used to estimate the CIs. As there is no prior knowledge, the prior distribution is uniform or maximally uninformative.12 In this case, the posterior and likelihood functions are directly related to one another, so the same CI could be constructed from either. Therefore, the remainder of this discussion is focused on the likelihood function.
10 American Institute of Aeronautics and Astronautics
Table 4: Binomial test results for LTA aircraft on approach. [Note each A/B pair is normalized with respect to PNLT.]
Segment A Segment B N t1 Extraction tmax Extraction t2 Extraction ID Airframe Engine Tech ID Airframe Engine Tech PNLT %B p PNLT %B p PNLT %B p
1 Ref DD –
5 T+W301 GTF N+2 80 88 67.50 0.001 92 77.50 0.000 88 70.00 0.000 9 T+W301 DD N+2 80 88 51.25 0.738 92 61.25 0.033 88 48.75 0.738
13 MFN301 GTF N+2 80 88 67.50 0.001 92 76.25 0.000 88 72.50 0.000 21 HWB301 GTF N+2 32 88 50.00 0.860 92 78.13 0.001 88 56.25 0.377 22 HWB301 GTF N+2/ITD 48 88 27.08 0.001 92 81.25 0.000 88 62.5 0.060
5 T+W301 GTF N+2
6 T+W301 GTF N+2/ITD 32 88 21.88 0.001 92 62.50 0.110 88 50.00 0.860 9 T+W301 DD N+2 80 88 32.50 0.001 92 28.75 0.000 88 22.50 0.000
13 MFN301 GTF N+2 80 88 52.50 0.576 92 48.75 0.738 88 60.00 0.057 21 HWB301 GTF N+2 80 88 31.25 0.000 92 47.50 0.576 88 33.75 0.002
9 T+W301 DD N+2 10 T+W301 DD N+2/ITD 32 88 56.25 0.377 92 40.63 0.215 88 43.75 0.377 13 MFN301 GTF N+2 80 88 61.25 0.033 92 76.25 0.000 88 68.75 0.000 21 HWB301 GTF N+2 80 88 40.00 0.057 92 63.75 0.010 88 61.25 0.033
13 MFN301 GTF N+2 14 MFN301 GTF N+2/ITD 32 88 56.25 0.377 92 56.25 0.377 88 37.50 0.110 21 HWB301 GTF N+2 80 88 21.25 0.000 92 40.00 0.057 88 26.25 0.000
21 HWB301 GTF N+2 22 HWB301 GTF N+2/ITD 32 88 46.88 0.597 92 43.75 0.377 88 59.38 0.215
Table 5: Binomial test results for LTA aircraft on sideline. [Note each A/B pair is normalized with respect to PNLT.]
Segment A Segment B N t1 Extraction tmax Extraction t2 Extraction ID Airframe Engine Tech ID Airframe Engine Tech PNLT %B p PNLT %B p PNLT %B p
2 Ref DD –
7 T+W301 GTF N+2 80 89 38.75 0.033 92 66.25 0.002 89 65.00 0.005 11 T+W301 DD N+2 80 89 46.25 0.434 92 52.50 0.576 89 56.25 0.219 15 MFN301 GTF N+2 80 89 42.50 0.146 92 62.50 0.018 89 72.50 0.000 23 HWB301 GTF N+2 32 89 25.00 0.002 92 68.75 0.020 89 68.75 0.020 24 HWB301 GTF N+2/ITD 48 89 45.83 0.471 92 68.75 0.006 89 75.00 0.000
7 T+W301 GTF N+2
8 T+W301 GTF N+2/ITD 32 89 56.25 0.377 92 53.13 0.597 89 46.88 0.597 11 T+W301 DD N+2 80 89 67.50 0.001 92 33.75 0.002 89 32.50 0.001 15 MFN301 GTF N+2 80 89 57.50 0.146 92 50.00 0.911 89 47.50 0.576 23 HWB301 GTF N+2 80 89 55.00 0.314 92 72.50 0.000 89 52.50 0.576
11 T+W301 DD N+2 12 T+W301 DD N+2/ITD 32 89 53.13 0.597 92 46.88 0.597 89 43.75 0.377 15 MFN301 GTF N+2 80 89 28.75 0.000 92 51.25 0.738 89 78.75 0.000 23 HWB301 GTF N+2 80 89 35.00 0.005 92 71.25 0.000 89 58.75 0.093
15 MFN301 GTF N+2 16 MFN301 GTF N+2/ITD 32 89 43.75 0.377 92 28.13 0.007 89 53.13 0.597 23 HWB301 GTF N+2 80 89 55.00 0.314 92 76.25 0.000 89 43.75 0.219
23 HWB301 GTF N+2 24 HWB301 GTF N+2/ITD 32 89 34.38 0.050 92 50.00 0.860 89 50.00 0.860

11 American Institute of Aeronautics and Astronautics
Table 6: Binomial test results for SA aircraft on approach. [Note each A/B pair is normalized with respect to PNLT.]
Segment A Segment B N t1 Extraction tmax Extraction t2 Extraction ID Airframe Engine Tech ID Airframe Engine Tech PNLT %B p PNLT %B p PNLT %B p
3 Ref DD – 17 T+W160 GTF N+2 32 86 31.25 0.020 92 68.75 0.020 87 78.13 0.001 18 T+W160 GTF N+2/ITD 80 86 51.25 0.738 92 71.25 0.000 87 71.25 0.000
17 T+W160 GTF N+2 18 T+W160 GTF N+2/ITD 32 86 50.00 0.860 92 46.88 0.597 87 34.38 0.050
Table 7: Binomial test results for SA aircraft on sideline. [Note each A/B pair is normalized with respect to PNLT.]
Segment A Segment B N t1 Extraction tmax Extraction t2 Extraction ID Airframe Engine Tech ID Airframe Engine Tech PNLT %B p PNLT %B p PNLT %B p
4 Ref DD – 19 T+W160 GTF N+2 32 83 81.25 0.000 92 78.13 0.001 83 90.63 0.000 20 T+W160 GTF N+2/ITD 80 83 65.00 0.005 92 80.00 0.000 83 75.00 0.000
19 T+W160 GTF N+2 20 T+W160 GTF N+2/ITD 32 83 53.13 0.597 92 40.63 0.215 83 40.63 0.215
Table 8: Binomial test results for reference aircraft at tmax extraction. [Note each condition has normalized with respect to PNLT for comparison with N+2 and N+2 with ITD noise reduction aircraft.]
Segment A Segment B Condition N PNLT %B p ID Class ID Class 1 LTA 1 LTA Approach 80 92 43.75 0.219 2 LTA 2 LTA Sideline 32 92 40.63 0.215 3 SA 3 SA Approach 32 92 53.13 0.597 4 SA 4 SA Sideline 32 92 53.13 0.597
Table 9: Nominal relative PNLT levels (B relative to A) used in psychoacoustic test phase 2.
Segment A Segment B Condition Rel. PNLT @ t1 (PNdB)
Rel. PNLT @ tmax (PNdB)
Rel. PNLT @ t2 (PNdB) ID Airframe Engine ID Airframe Engine Tech
1 LTA-Ref DD 22 HWB301 GTF N+2/ITD Approach -2 / 0 / +2 / +4 / +6 -6 / -4 / -2 / 0 / +2 -4 / -2 / 0 / +2 / +4 2 LTA-Ref DD 24 HWB301 GTF N+2/ITD Sideline 0 / +3 / +6 / +9 / +12 -9 / -6 / -3 / 0 / +3 -9 / -6 / -3 / 0 / +3 3 SA-Ref DD 18 T+W160 GTF N+2/ITD Approach -6 / -4 / -2 / +0 / +2 -6 / -4 / -2 / +0 / +2 -6 / -4 / -2 / +0 / +2 4 SA-Ref DD 20 T+W160 GTF N+2/ITD Sideline -18 / -12 / +6 / 0 / +6 -9 / -6 / -3 / 0 / +3 -15 / -10 / -5 / 0 / +5 1 LTA-Ref DD 1 LTA-Ref DD – Approach – -6 / -3 / 0 / +3 / +6 –
12 American Institute of Aeronautics and Astronautics
Figure 10: Fit of response data for T+W160-GTF-ITD
(B) relative to SA Ref (A) aircraft on approach at t1.
Figure 11: Fit of response data for T+W160-GTF-ITD
(B) relative to SA Ref (A) aircraft on sideline at t2.
Figure 12: Fit of response data for HWB301-GTF-ITD
(B) relative to LTA Ref (A) aircraft on sideline at t1.
Figure 13: Response data for LTA Ref (B) relative to
LTA Ref (A) aircraft on approach at tmax.
Table 10: Best fit relative PNLT levels (B relative to A) at the EAP and 95% confidence intervals.
Segment A Segment B Condition Best / CI @ t1 (PNdB)
Best / CI @ tmax (PNdB)
Best / CI @ t2 (PNdB) ID Aircraft ID Aircraft
1 LTA-Ref 22 HWB301-GTF-ITD Approach 1.03 [0.27, 1.74]
-2.10 [-2.66, -1.53]
-0.86 [-1.53, -0.23]
2 LTA-Ref 24 HWB301-GTF-ITD Sideline 0.39 [-8.16, 3.29]
-2.44 [-3.26, -1.60]
-2.99 [-4.03, -1.93]
3 SA-Ref 18 T+W160-GTF-ITD Approach -0.73 [-1.72, 0.52]
-2.20 [-2.82, -1.61]
-2.36 [-3.09, -1.71]
4 SA-Ref 20 T+W160-GTF-ITD Sideline -4.21 [-5.89, -2.50]
-4.28 [-5.34, -3.32]
-6.46 [-8.37, -4.74]
Change in PNLTB relative to PNLTA (∆PNdB)
Pr(B
)
-10 -5 0 50
0.1
0.2
0.3
0.4
0.5
0.6
0.7
0.8
0.9
1 Subject DataBest FitBest Fit 50%
Change in PNLTB relative to PNLTA (∆PNdB)
Pr(B
)
-20 -15 -10 -5 0 5 100
0.1
0.2
0.3
0.4
0.5
0.6
0.7
0.8
0.9
1 Subject DataBest FitBest Fit 50%
Change in PNLTB relative to PNLTA (∆PNdB)
Pr(B
)
-5 0 5 10 150
0.1
0.2
0.3
0.4
0.5
0.6
0.7
0.8
0.9
1 Subject DataBest FitBest Fit 50%
Change in PNLTB relative to PNLTA (∆PNdB)
Pr(B
)
-8 -6 -4 -2 0 2 4 6 80
0.1
0.2
0.3
0.4
0.5
0.6
0.7
0.8
0.9
1 Subject Data
13 American Institute of Aeronautics and Astronautics
The BPE approach is used to generate a function of the model parameters 𝛽𝛽0 and 𝛽𝛽1 in Eq. (3) that represents the ‘likelihood’ that those parameters fit the collected data. This function is typically expressed as 𝐿𝐿(𝛽𝛽0𝛽𝛽1|Data), or ‘the likelihood of 𝛽𝛽0 and 𝛽𝛽1 given the data.’ The pair of 𝛽𝛽𝛽𝛽, i.e., 𝛽𝛽0 and 𝛽𝛽1, associated with the best fit logistic function represent the ‘maximum likelihood’ (ML) solution. If the entire likelihood function is known, it can be used to find a CI around its maximal point. For example, the 95% CI is defined as the interval between 2.5% and 97.5% of the integral of L. The likelihood function generally cannot be expressed in analytic form, so the integral of L must be determined via numerical methods. For BPE applications, the techniques most commonly used are called Markov Chain Monte Carlo (MCMC) methods. In this work, the Metropolis-Hastings (MH) algorithm is used – a method first developed for early numerical chemical applications13 and later generalized for many kinds of MCMC applications.14 For an introduction to this algorithm, see the tutorial by Kruschke.15 In short, the MH algorithm is an MCMC method to take a random walk around the likelihood function in such a way that, ultimately, the integral of L is evaluated. Some details are given next.
The MH algorithm takes random steps in the 𝛽𝛽 domain. Let 𝛽𝛽𝑖𝑖 be the value of the 𝛽𝛽𝛽𝛽 for the ith step, and Li be the likelihood of 𝛽𝛽𝑖𝑖 given the data. For the next step, 𝛽𝛽𝑖𝑖 is perturbed slightly by the addition of a random component, creating a new value, 𝛽𝛽𝑛𝑛. The likelihood of 𝛽𝛽𝑛𝑛 given the data at this new location is Ln. The reader is referred to Westfall and Henning,16 who provide instructions and a spreadsheet example for evaluating the likelihood of the 𝛽𝛽𝛽𝛽 for the type of binomial test data collected in this work. The probability that the location 𝛽𝛽𝑛𝑛will be kept as the starting point for the next step is determined by the ratio of the two likelihoods (Ln / Li). In this study, the random component added at each step was based on a multivariate normal distribution centered on the current 𝛽𝛽𝛽𝛽 and used the observed covariance of the GLM fit scaled by a factor to make the acceptance rate of the MH steps approximately equal to 50% (an optimal operating condition for an MCMC method with two variables17). By using the ratio of likelihoods as an acceptance criterion, it is more probable for the walk to move toward a region of higher likelihood than away from it. After a large number of steps, the likelihood of arbitrarily selected points 𝛽𝛽𝛽𝛽 (on the likelihood function) is proportional to the density of steps taken in the neighborhood of those points. This property allows for the construction of a CI by taking the central 95-percentile of the steps. In this work, the first 1000 steps are thrown away to help lessen the influence of the starting point. After that, it was found that taking 100k steps resulted in CIs that converged to within 1% between runs.
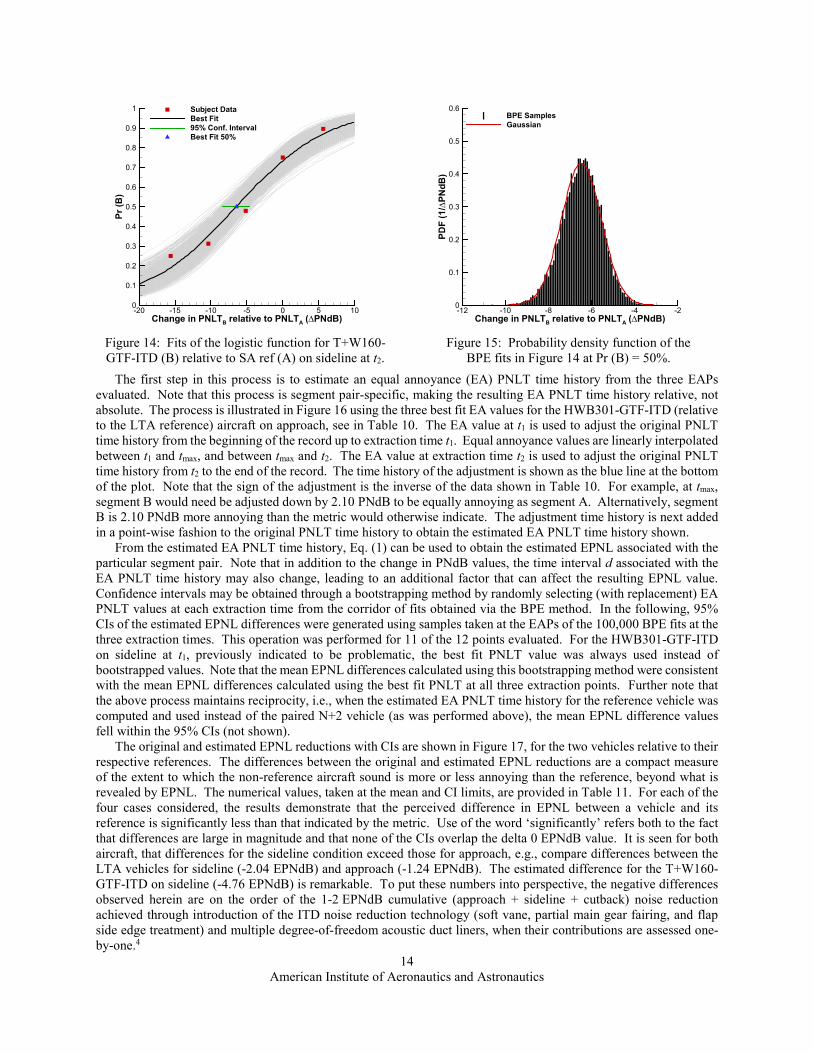
Figure 14 shows the best fit ML curve within a ‘corridor’ of grey curves that represent steps on the random walk. There are fewer grey curves along the edges of this corridor as the MH algorithm is less likely to take steps in these more extreme regions. The extreme curves do a poorer job of fitting the data points than do the ML curve or curves in the middle of the corridor, and hence their corresponding likelihood value is smaller. This leads to a reduced chance that they will be included in the walk.
The EAP for a given pair of 𝛽𝛽𝛽𝛽 is given by -𝛽𝛽0 𝛽𝛽1⁄ . Using this formula, it is possible to collapse the two-dimensional random walk history into one dimension, where every point on the walk represents the EAP at that step. An example probability density function (PDF) of these EAPs is shown in Figure 15. This is analogous to taking a slice of Figure 14 at Pr(B) = 0.5. (In fact, CIs can be constructed for any desired value of Pr(B) in this way.) It is seen that the PDF is largely normally distributed. That fact, however, is not due to any assumptions made during the data analysis process, but is based on the data itself. Certainly, there are data where the likelihood function is not normal, e.g., see Gelman et al.18 The CI of the best fit EAP is constructed by taking the central 95-percentile of the data in Figure 15. Relative PNLT levels at the EAPs and the associated 95% CIs are given in Table 10.
It is worth revisiting the case shown in Figure 12 where it was observed that the range of relative PNLT values tested did not adequately span the range of responses. Due to this fact, there can be many combinations of 𝛽𝛽𝛽𝛽 that fit the overall data because the curve is not constrained by data on the left side. The resulting CI, although consistent with the data acquired, extends asymmetrically to the left (-8.16 PNdB) and less to the right (3.29 PNdB) from a best fit of 0.39 at the EAP. This CI does not rule out the possibility that the true relative difference between segments A and B is simply not a PNLT value of 0 PNdB. This is corroborated by the insignificant p-value of 0.471, see Table 5. As it stands, the best fit value of 0.39 is the lowest among the 12 considered. The approach for dealing with this in the context of the EPNL estimation is discussed below.
C. Research Question 3 In the above, it has been shown that paired-comparison psychoacoustic test data can be used to quantify equal
annoyance PNLT levels and CIs between two signal segments. This information, when applied at the three extraction points (t1, tmax, and t2), can be used to estimate a perceived value of a relative EPNL metric and associated CIs.
14 American Institute of Aeronautics and Astronautics
Figure 14: Fits of the logistic function for T+W160-GTF-ITD (B) relative to SA ref (A) on sideline at t2.
Figure 15: Probability density function of the
BPE fits in Figure 14 at Pr (B) = 50%.
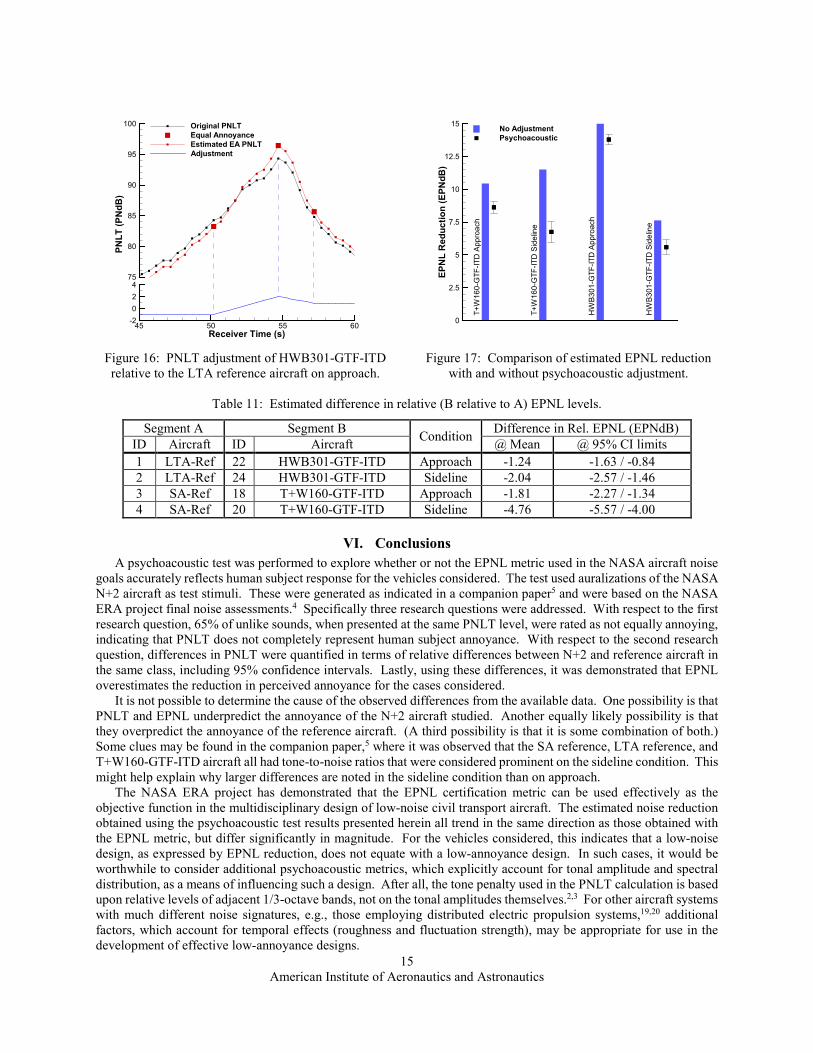
The first step in this process is to estimate an equal annoyance (EA) PNLT time history from the three EAPs evaluated. Note that this process is segment pair-specific, making the resulting EA PNLT time history relative, not absolute. The process is illustrated in Figure 16 using the three best fit EA values for the HWB301-GTF-ITD (relative to the LTA reference) aircraft on approach, see in Table 10. The EA value at t1 is used to adjust the original PNLT time history from the beginning of the record up to extraction time t1. Equal annoyance values are linearly interpolated between t1 and tmax, and between tmax and t2. The EA value at extraction time t2 is used to adjust the original PNLT time history from t2 to the end of the record. The time history of the adjustment is shown as the blue line at the bottom of the plot. Note that the sign of the adjustment is the inverse of the data shown in Table 10. For example, at tmax, segment B would need be adjusted down by 2.10 PNdB to be equally annoying as segment A. Alternatively, segment B is 2.10 PNdB more annoying than the metric would otherwise indicate. The adjustment time history is next added in a point-wise fashion to the original PNLT time history to obtain the estimated EA PNLT time history shown.
From the estimated EA PNLT time history, Eq. (1) can be used to obtain the estimated EPNL associated with the particular segment pair. Note that in addition to the change in PNdB values, the time interval d associated with the EA PNLT time history may also change, leading to an additional factor that can affect the resulting EPNL value. Confidence intervals may be obtained through a bootstrapping method by randomly selecting (with replacement) EA PNLT values at each extraction time from the corridor of fits obtained via the BPE method. In the following, 95% CIs of the estimated EPNL differences were generated using samples taken at the EAPs of the 100,000 BPE fits at the three extraction times. This operation was performed for 11 of the 12 points evaluated. For the HWB301-GTF-ITD on sideline at t1, previously indicated to be problematic, the best fit PNLT value was always used instead of bootstrapped values. Note that the mean EPNL differences calculated using this bootstrapping method were consistent with the mean EPNL differences calculated using the best fit PNLT at all three extraction points. Further note that the above process maintains reciprocity, i.e., when the estimated EA PNLT time history for the reference vehicle was computed and used instead of the paired N+2 vehicle (as was performed above), the mean EPNL difference values fell within the 95% CIs (not shown).
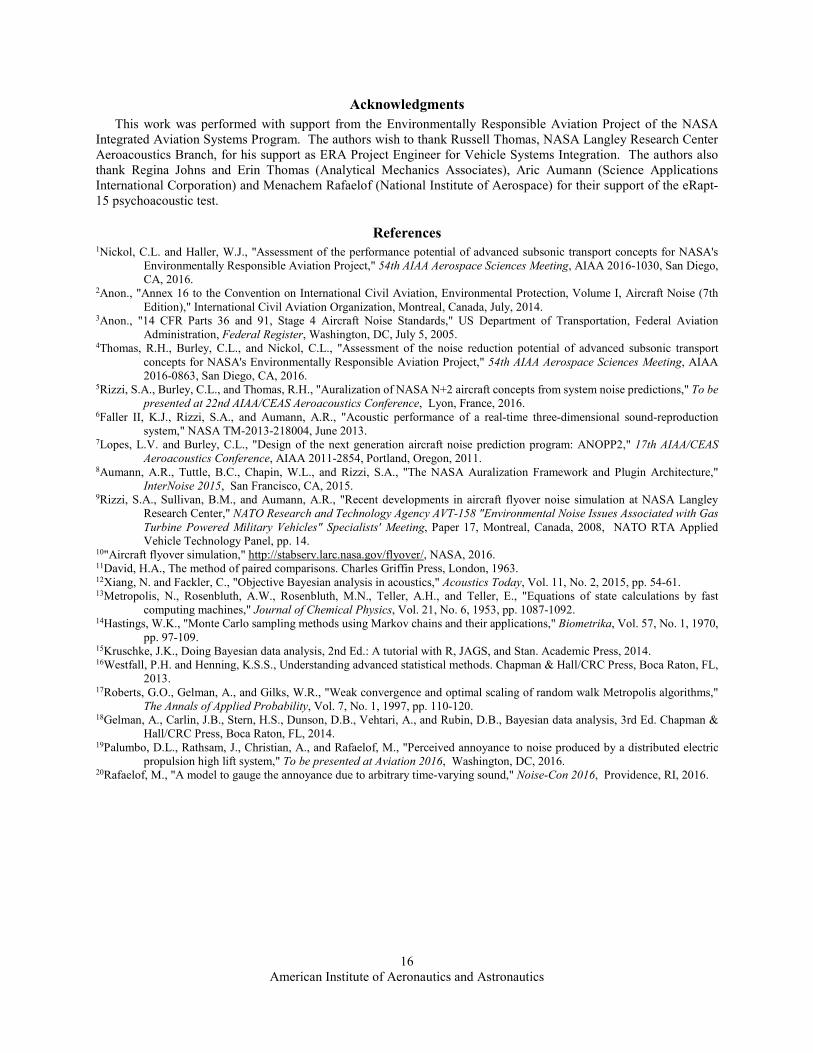
The original and estimated EPNL reductions with CIs are shown in Figure 17, for the two vehicles relative to their respective references. The differences between the original and estimated EPNL reductions are a compact measure of the extent to which the non-reference aircraft sound is more or less annoying than the reference, beyond what is revealed by EPNL. The numerical values, taken at the mean and CI limits, are provided in Table 11. For each of the four cases considered, the results demonstrate that the perceived difference in EPNL between a vehicle and its reference is significantly less than that indicated by the metric. Use of the word ‘significantly’ refers both to the fact that differences are large in magnitude and that none of the CIs overlap the delta 0 EPNdB value. It is seen for both aircraft, that differences for the sideline condition exceed those for approach, e.g., compare differences between the LTA vehicles for sideline (-2.04 EPNdB) and approach (-1.24 EPNdB). The estimated difference for the T+W160-GTF-ITD on sideline (-4.76 EPNdB) is remarkable. To put these numbers into perspective, the negative differences observed herein are on the order of the 1-2 EPNdB cumulative (approach + sideline + cutback) noise reduction achieved through introduction of the ITD noise reduction technology (soft vane, partial main gear fairing, and flap side edge treatment) and multiple degree-of-freedom acoustic duct liners, when their contributions are assessed one-by-one.4
Change in PNLTB relative to PNLTA (∆PNdB)
Pr(B
)
-20 -15 -10 -5 0 5 100
0.1
0.2
0.3
0.4
0.5
0.6
0.7
0.8
0.9
1 Subject DataBest Fit95% Conf. IntervalBest Fit 50%
Change in PNLTB relative to PNLTA (∆PNdB)
(1/∆
PNdB
)
-12 -10 -8 -6 -4 -20
0.1
0.2
0.3
0.4
0.5
0.6BPE SamplesGaussian
15 American Institute of Aeronautics and Astronautics
Figure 16: PNLT adjustment of HWB301-GTF-ITD relative to the LTA reference aircraft on approach.
Figure 17: Comparison of estimated EPNL reduction
with and without psychoacoustic adjustment.
Table 11: Estimated difference in relative (B relative to A) EPNL levels.
Segment A Segment B Condition Difference in Rel. EPNL (EPNdB) ID Aircraft ID Aircraft @ Mean @ 95% CI limits 1 LTA-Ref 22 HWB301-GTF-ITD Approach -1.24 -1.63 / -0.84 2 LTA-Ref 24 HWB301-GTF-ITD Sideline -2.04 -2.57 / -1.46 3 SA-Ref 18 T+W160-GTF-ITD Approach -1.81 -2.27 / -1.34 4 SA-Ref 20 T+W160-GTF-ITD Sideline -4.76 -5.57 / -4.00
VI. Conclusions A psychoacoustic test was performed to explore whether or not the EPNL metric used in the NASA aircraft noise
goals accurately reflects human subject response for the vehicles considered. The test used auralizations of the NASA N+2 aircraft as test stimuli. These were generated as indicated in a companion paper5 and were based on the NASA ERA project final noise assessments.4 Specifically three research questions were addressed. With respect to the first research question, 65% of unlike sounds, when presented at the same PNLT level, were rated as not equally annoying, indicating that PNLT does not completely represent human subject annoyance. With respect to the second research question, differences in PNLT were quantified in terms of relative differences between N+2 and reference aircraft in the same class, including 95% confidence intervals. Lastly, using these differences, it was demonstrated that EPNL overestimates the reduction in perceived annoyance for the cases considered.
It is not possible to determine the cause of the observed differences from the available data. One possibility is that PNLT and EPNL underpredict the annoyance of the N+2 aircraft studied. Another equally likely possibility is that they overpredict the annoyance of the reference aircraft. (A third possibility is that it is some combination of both.) Some clues may be found in the companion paper,5 where it was observed that the SA reference, LTA reference, and T+W160-GTF-ITD aircraft all had tone-to-noise ratios that were considered prominent on the sideline condition. This might help explain why larger differences are noted in the sideline condition than on approach.
The NASA ERA project has demonstrated that the EPNL certification metric can be used effectively as the objective function in the multidisciplinary design of low-noise civil transport aircraft. The estimated noise reduction obtained using the psychoacoustic test results presented herein all trend in the same direction as those obtained with the EPNL metric, but differ significantly in magnitude. For the vehicles considered, this indicates that a low-noise design, as expressed by EPNL reduction, does not equate with a low-annoyance design. In such cases, it would be worthwhile to consider additional psychoacoustic metrics, which explicitly account for tonal amplitude and spectral distribution, as a means of influencing such a design. After all, the tone penalty used in the PNLT calculation is based upon relative levels of adjacent 1/3-octave bands, not on the tonal amplitudes themselves.2,3 For other aircraft systems with much different noise signatures, e.g., those employing distributed electric propulsion systems,19,20 additional factors, which account for temporal effects (roughness and fluctuation strength), may be appropriate for use in the development of effective low-annoyance designs.
Receiver Time (s)45 50 55 60
-2024
Adjustment
PNLT
(PN
dB)
75
80
85
90
95
100 Original PNLTEqual AnnoyanceEstimated EA PNLT
EPN
LR
educ
tion
(EPN
dB)
T+W
160-
GTF
-ITD
App
roac
h
T+W
160-
GTF
-ITD
Sid
elin
e
HW
B30
1-G
TF-IT
DA
ppro
ach
HW
B30
1-G
TF-IT
DS
idel
ine
0
2.5
5
7.5
10
12.5
15 No AdjustmentPsychoacoustic
16 American Institute of Aeronautics and Astronautics
Acknowledgments This work was performed with support from the Environmentally Responsible Aviation Project of the NASA
Integrated Aviation Systems Program. The authors wish to thank Russell Thomas, NASA Langley Research Center Aeroacoustics Branch, for his support as ERA Project Engineer for Vehicle Systems Integration. The authors also thank Regina Johns and Erin Thomas (Analytical Mechanics Associates), Aric Aumann (Science Applications International Corporation) and Menachem Rafaelof (National Institute of Aerospace) for their support of the eRapt-15 psychoacoustic test.
References 1Nickol, C.L. and Haller, W.J., "Assessment of the performance potential of advanced subsonic transport concepts for NASA's
Environmentally Responsible Aviation Project," 54th AIAA Aerospace Sciences Meeting, AIAA 2016-1030, San Diego, CA, 2016.
2Anon., "Annex 16 to the Convention on International Civil Aviation, Environmental Protection, Volume I, Aircraft Noise (7th Edition)," International Civil Aviation Organization, Montreal, Canada, July, 2014.
3Anon., "14 CFR Parts 36 and 91, Stage 4 Aircraft Noise Standards," US Department of Transportation, Federal Aviation Administration, Federal Register, Washington, DC, July 5, 2005.
4Thomas, R.H., Burley, C.L., and Nickol, C.L., "Assessment of the noise reduction potential of advanced subsonic transport concepts for NASA's Environmentally Responsible Aviation Project," 54th AIAA Aerospace Sciences Meeting, AIAA 2016-0863, San Diego, CA, 2016.
5Rizzi, S.A., Burley, C.L., and Thomas, R.H., "Auralization of NASA N+2 aircraft concepts from system noise predictions," To be presented at 22nd AIAA/CEAS Aeroacoustics Conference, Lyon, France, 2016.
6Faller II, K.J., Rizzi, S.A., and Aumann, A.R., "Acoustic performance of a real-time three-dimensional sound-reproduction system," NASA TM-2013-218004, June 2013.
7Lopes, L.V. and Burley, C.L., "Design of the next generation aircraft noise prediction program: ANOPP2," 17th AIAA/CEAS Aeroacoustics Conference, AIAA 2011-2854, Portland, Oregon, 2011.
8Aumann, A.R., Tuttle, B.C., Chapin, W.L., and Rizzi, S.A., "The NASA Auralization Framework and Plugin Architecture," InterNoise 2015, San Francisco, CA, 2015.
9Rizzi, S.A., Sullivan, B.M., and Aumann, A.R., "Recent developments in aircraft flyover noise simulation at NASA Langley Research Center," NATO Research and Technology Agency AVT-158 "Environmental Noise Issues Associated with Gas Turbine Powered Military Vehicles" Specialists' Meeting, Paper 17, Montreal, Canada, 2008, NATO RTA Applied Vehicle Technology Panel, pp. 14.
10"Aircraft flyover simulation," http://stabserv.larc.nasa.gov/flyover/, NASA, 2016. 11David, H.A., The method of paired comparisons. Charles Griffin Press, London, 1963. 12Xiang, N. and Fackler, C., "Objective Bayesian analysis in acoustics," Acoustics Today, Vol. 11, No. 2, 2015, pp. 54-61. 13Metropolis, N., Rosenbluth, A.W., Rosenbluth, M.N., Teller, A.H., and Teller, E., "Equations of state calculations by fast
computing machines," Journal of Chemical Physics, Vol. 21, No. 6, 1953, pp. 1087-1092. 14Hastings, W.K., "Monte Carlo sampling methods using Markov chains and their applications," Biometrika, Vol. 57, No. 1, 1970,
pp. 97-109. 15Kruschke, J.K., Doing Bayesian data analysis, 2nd Ed.: A tutorial with R, JAGS, and Stan. Academic Press, 2014. 16Westfall, P.H. and Henning, K.S.S., Understanding advanced statistical methods. Chapman & Hall/CRC Press, Boca Raton, FL,
2013. 17Roberts, G.O., Gelman, A., and Gilks, W.R., "Weak convergence and optimal scaling of random walk Metropolis algorithms,"
The Annals of Applied Probability, Vol. 7, No. 1, 1997, pp. 110-120. 18Gelman, A., Carlin, J.B., Stern, H.S., Dunson, D.B., Vehtari, A., and Rubin, D.B., Bayesian data analysis, 3rd Ed. Chapman &
Hall/CRC Press, Boca Raton, FL, 2014. 19Palumbo, D.L., Rathsam, J., Christian, A., and Rafaelof, M., "Perceived annoyance to noise produced by a distributed electric
propulsion high lift system," To be presented at Aviation 2016, Washington, DC, 2016. 20Rafaelof, M., "A model to gauge the annoyance due to arbitrary time-varying sound," Noise-Con 2016, Providence, RI, 2016.