a proteomics and transcriptomics approach to identify leukemia stem cell (lsc) markers
TRANSCRIPT
A Proteomics and Transcriptomics
Approach to Identify Leukemia Stem
Cell (LSC) Markers
Presented by:
Somayeh Haji Kazem Nili, Kalyani Rajalingham,
Nataliia Samus
Bonardi et al., (2013) MCP 12(3): 626-637
Summary
PM proteins mediate hematopoietic stem cells interaction
with their niche
Changes in these interactions may cause Acute Myeloid
Leukemia (AML)
Aims:
• Characterization of Plasma Membrane (PM) composition in AML
• Identifying markers within PM to recognize and target AML
Creator/Presenter: Somayeh Haji Kazem Nili
Background
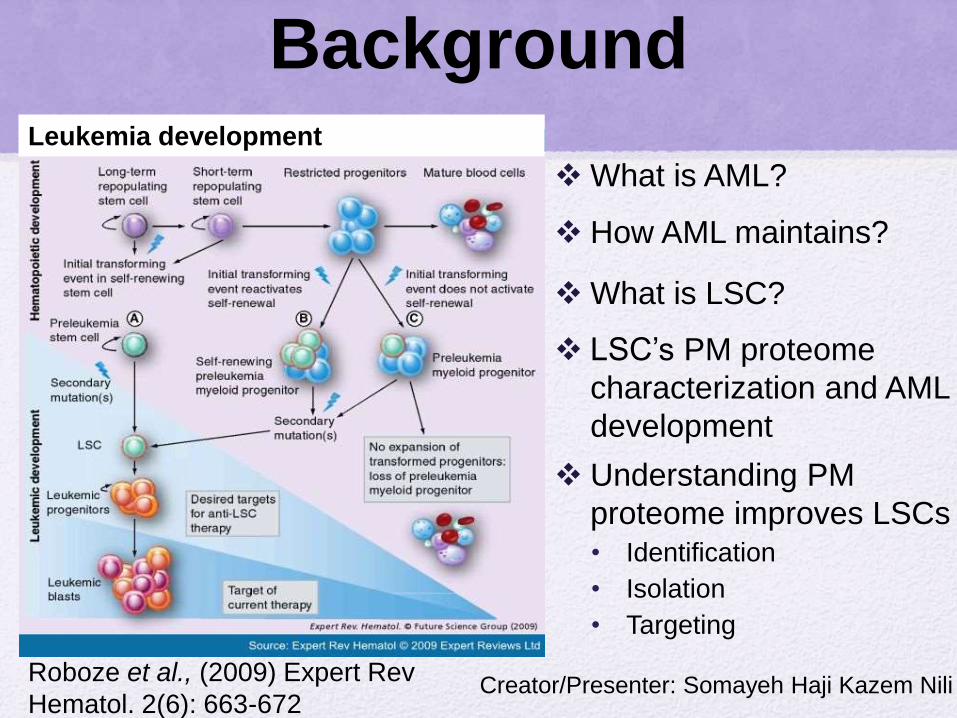
What is AML?
How AML maintains?
What is LSC?
LSC’s PM proteome
characterization and AML
development
Understanding PM
proteome improves LSCs• Identification
• Isolation
• Targeting
Creator/Presenter: Somayeh Haji Kazem NiliRoboze et al., (2009) Expert Rev
Hematol. 2(6): 663-672
Leukemia development
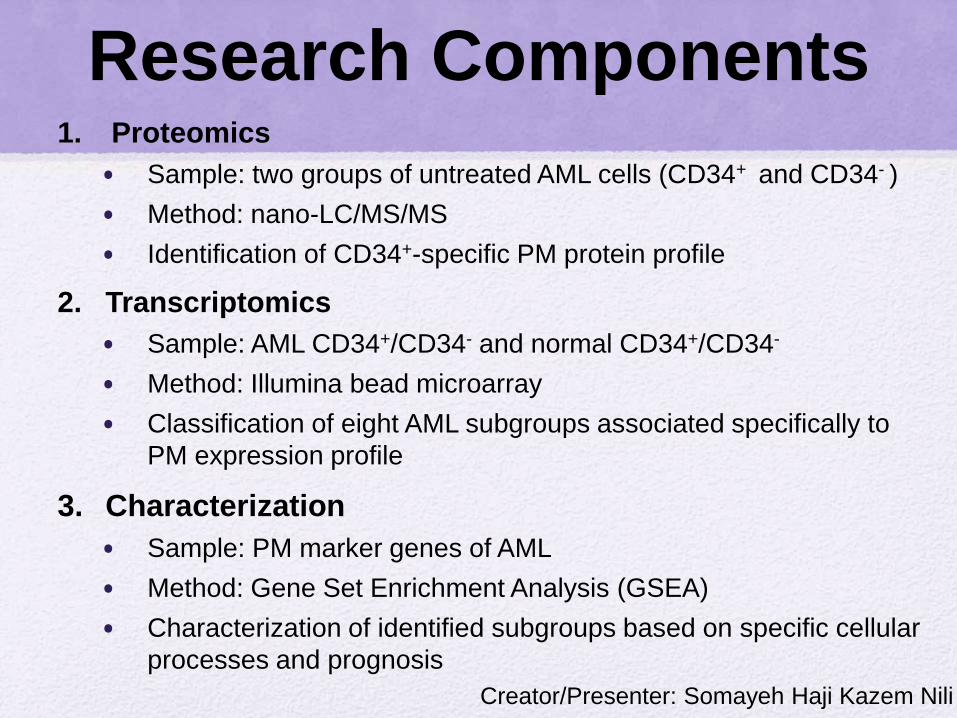
Research Components1. Proteomics
• Sample: two groups of untreated AML cells (CD34+ and CD34- )
• Method: nano-LC/MS/MS
• Identification of CD34+-specific PM protein profile
2. Transcriptomics
• Sample: AML CD34+/CD34- and normal CD34+/CD34-
• Method: Illumina bead microarray
• Classification of eight AML subgroups associated specifically to
PM expression profile
3. Characterization
• Sample: PM marker genes of AML
• Method: Gene Set Enrichment Analysis (GSEA)
• Characterization of identified subgroups based on specific cellular
processes and prognosis
Creator/Presenter: Somayeh Haji Kazem Nili

Proteomics Experimental procedure
1. Select cells from two patients :
• AML1: a poor risk AML patient
• AML2: myeloid blast crisis patient
2. Sample sorting by MoFLo-XDP
3. Membrane purification by simplify purification procedure
4. Complexity reduction by MuDPIT combined with nano-
LC/MS/MS
5. Protein digestion by trypsin
6. Peptides separation by a SCX chromatography and RP
chromatography column coupled with an LTQ-OrbiTrap MS
7. The MS/MS result has been searched against ipi-Human
database using Mascot, Sequest, and X!Tandem
Creator/Presenter: Somayeh Haji Kazem NiliBonardi et al., 2013
Proteomics workflow

ProteomicsPM proteins identified in CD34+
Bonardi et al., 2013Creator/Presenter: Somayeh Haji Kazem Nili
Novel
proteins
Described proteins
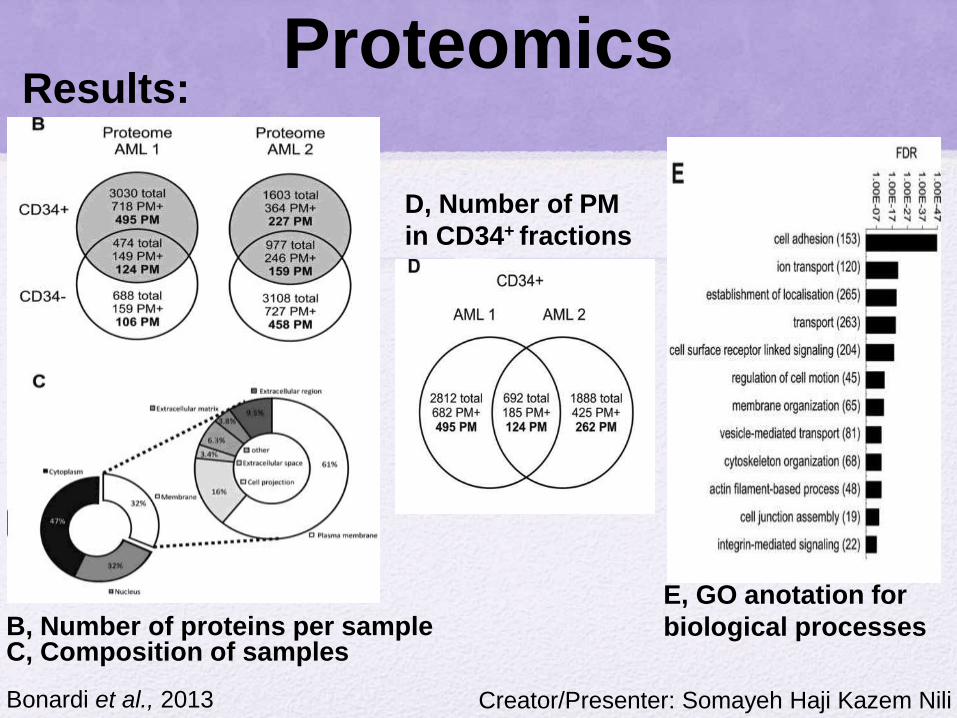
Proteomics
B, Number of proteins per sampleC, Composition of samples
Results:
Creator/Presenter: Somayeh Haji Kazem NiliBonardi et al., 2013
D, Number of PM
in CD34+ fractions
E, GO anotation for
biological processes

DiscussionConclusion
• 619 unique PM proteins in CD34+ from AML1
• 386 unique PM proteins in CD34+ from AML2
• novel markers;
CD82, CD97,CD99, PTH2R, ESAM, MET, ITGA6
• Previously described markers;
CD44, CD47, CD135, CD96, ITGA5
Objections
• Low amount of material limits quantification of less
abundant PM proteins
• Only two patients
• Proteome approach did not allow quantitative evaluation
• Combining proteomics with transcriptomics approaches
Creator/Presenter: Somayeh Haji Kazem Nili

Transcriptomics
1- Control:
NBM – Normal Bone Marrow
Treatment:
AML CD34+, AML CD34-
2- Illumina Bead Array:
Microarray
3- Select significant genes using
statistical test
4- 238 AML CD34+ up-
regulated genes
Creator/Presenter: Kalyani RajalinghamBonardi et al., (2013) MCP 12(3): 626-637
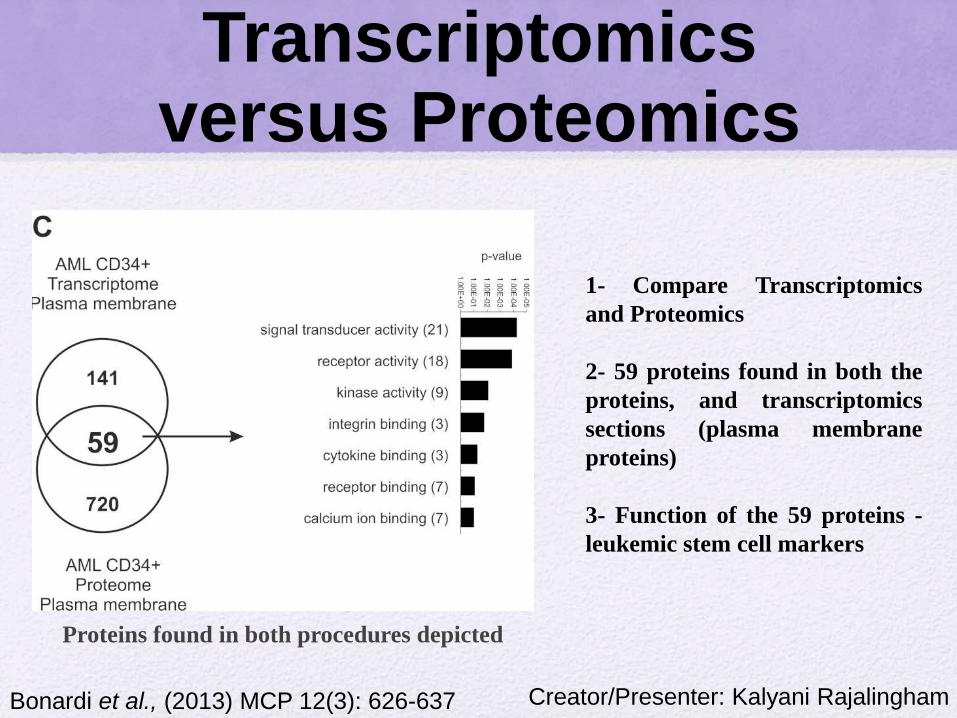
Transcriptomics versus Proteomics
1- Compare Transcriptomics
and Proteomics
2- 59 proteins found in both the
proteins, and transcriptomics
sections (plasma membrane
proteins)
3- Function of the 59 proteins -
leukemic stem cell markers
Creator/Presenter: Kalyani RajalinghamBonardi et al., (2013) MCP 12(3): 626-637
Proteins found in both procedures depicted
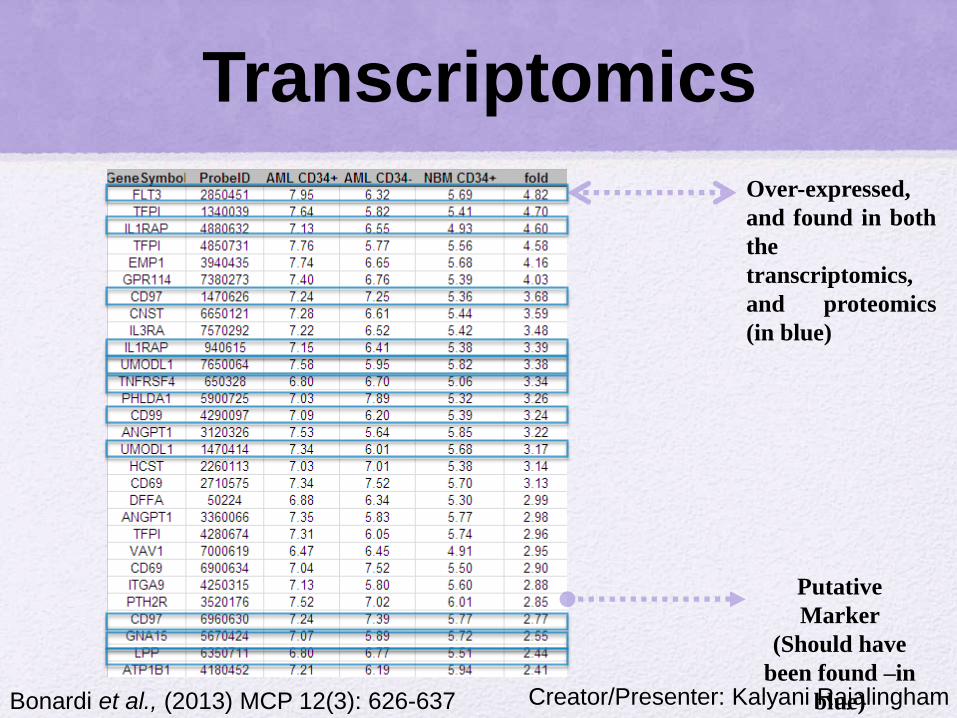
Transcriptomics
Creator/Presenter: Kalyani RajalinghamBonardi et al., (2013) MCP 12(3): 626-637
Over-expressed,
and found in both
the
transcriptomics,
and proteomics
(in blue)
Putative
Marker
(Should have
been found –in
blue)

Transcriptomics
Creator/Presenter: Kalyani RajalinghamBonardi et al., (2013) MCP 12(3): 626-637
On the
protein, and
transcript
list, some
known
markers
were not
present (eg:
CD135).
Verification,
and
validation of
putative
markers
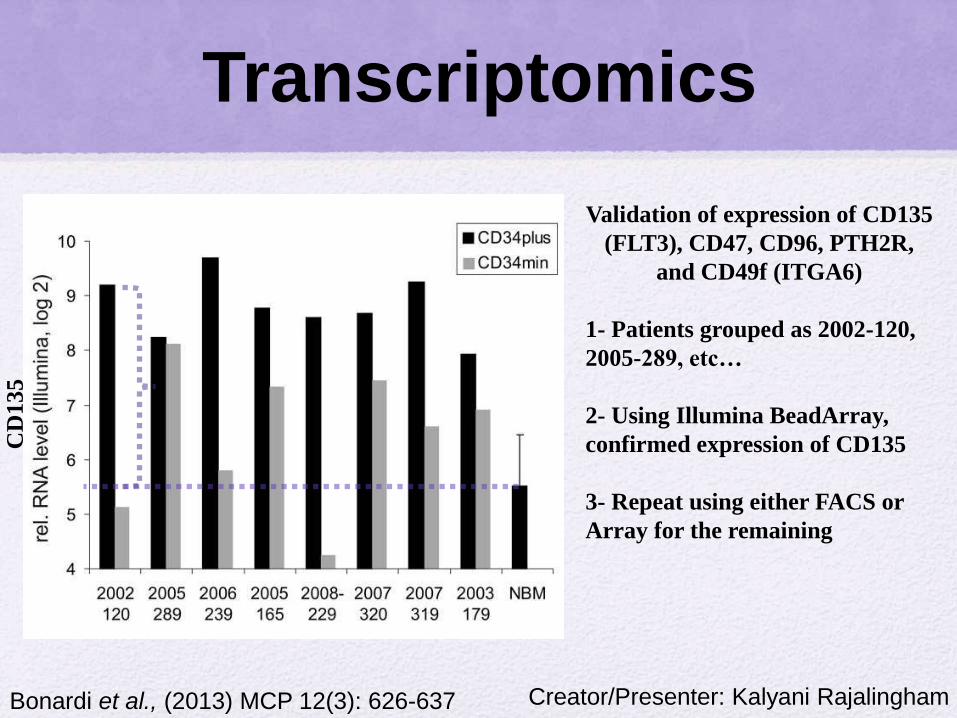
Transcriptomics
Validation of expression of CD135
(FLT3), CD47, CD96, PTH2R,
and CD49f (ITGA6)
1- Patients grouped as 2002-120,
2005-289, etc…
2- Using Illumina BeadArray,
confirmed expression of CD135
3- Repeat using either FACS or
Array for the remaining
Creator/Presenter: Kalyani RajalinghamBonardi et al., (2013) MCP 12(3): 626-637
CD
135

Transcriptomics
Validation of expression of CD135
(FLT3), CD47, CD96, PTH2R,
and CD49f (ITGA6)
They found that:
CD135 (FLT3)
CD47
ITGA6
CD96
PTH2R
Showed “enhanced expression”
Creator/Presenter: Kalyani RajalinghamBonardi et al., (2013) MCP 12(3): 626-637
CD
135

Discussion
Creator/Presenter: Kalyani RajalinghamBonardi et al., (2013) MCP 12(3): 626-637
Conclusion
• Transcriptomics show that 238 genes were found to be upregulated, of
which 200 were associated with the PM
• Of the 200 genes, 59 were also detected in the proteomics section
• Validation of CD135, CD47, ITGA6, CD96, and PTH2R shows that they
are over-expressed in AML CD34+
• CD135(FLT3) – strongest marker, overexpressed, found in both
proteomics/transcriptomics
• New markers: CD82, PTH2R, ESAM, MET, and ITGA6
Discussion
Creator/Presenter: Kalyani RajalinghamBonardi et al., (2013) MCP 12(3): 626-637
Objections
• 141 transcripts were not detected via proteomics
• Putative markers NOT detected in initial study

Characterization
Creator/Presenter: Nataliia Samus
8 types of acute myeloid leukemia:
The Leukemia & Lymphoma Society
http://www.lls.org/#/somedayistoday
Characterization
Creator/Presenter: Nataliia SamusBonardi et al., (2013) MCP 12(3): 626-637
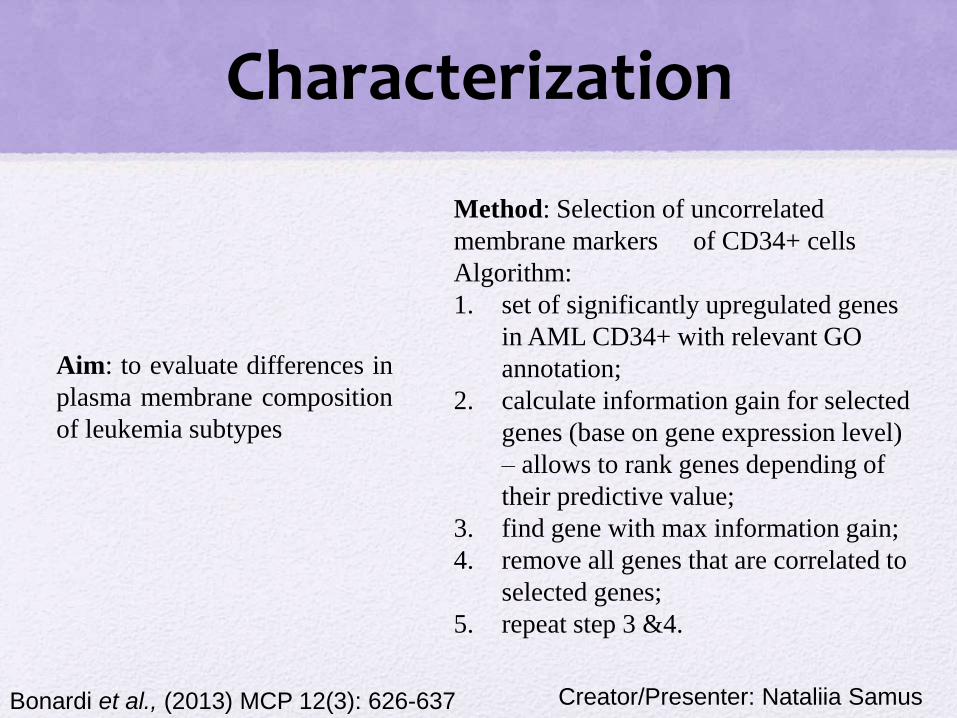
Aim: to evaluate differences in
plasma membrane composition
of leukemia subtypes
Method: Selection of uncorrelated
membrane markers of CD34+ cells
Algorithm:
1. set of significantly upregulated genes
in AML CD34+ with relevant GO
annotation;
2. calculate information gain for selected
genes (base on gene expression level)
– allows to rank genes depending of
their predictive value;
3. find gene with max information gain;
4. remove all genes that are correlated to
selected genes;
5. repeat step 3 &4.

Characterization
Creator/Presenter: Nataliia SamusBonardi et al., (2013) MCP 12(3): 626-637
Results: 8 membrane markers were identified.
Fig.4 A Supervised cluster analysis of expression of the 8 proteins
Conclusion: AML CD34+ samples can be separated from NBM CD34+
samples on the basis of the expression of the 8 markers.
Characterization
Creator/Presenter: Nataliia SamusBonardi et al., (2013) MCP 12(3): 626-637
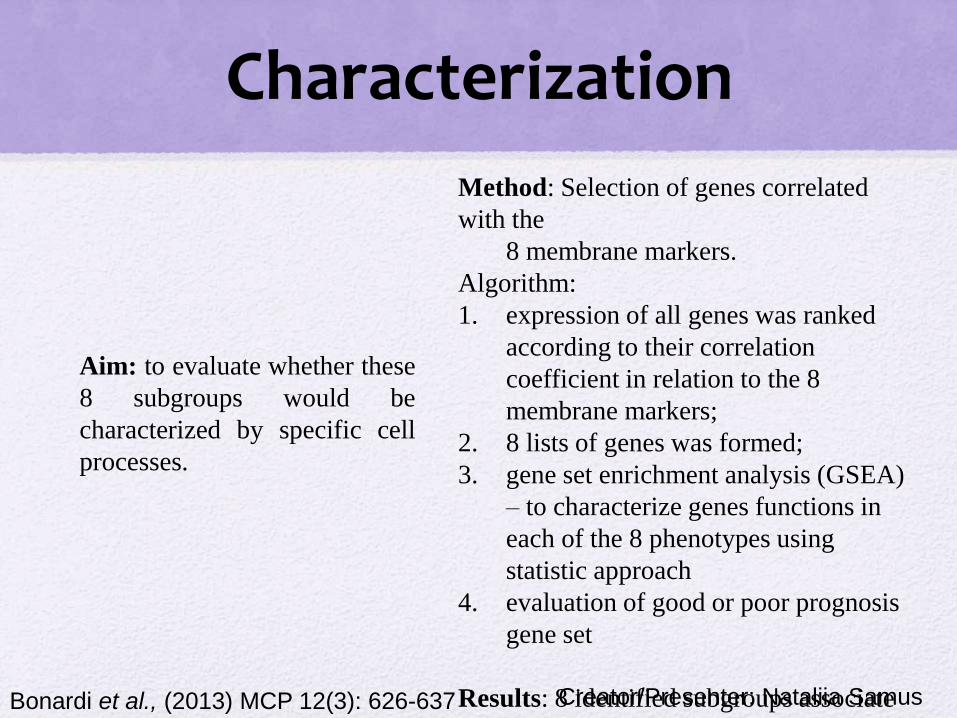
Aim: to evaluate whether these
8 subgroups would be
characterized by specific cell
processes.
Method: Selection of genes correlated
with the
8 membrane markers.
Algorithm:
1. expression of all genes was ranked
according to their correlation
coefficient in relation to the 8
membrane markers;
2. 8 lists of genes was formed;
3. gene set enrichment analysis (GSEA)
– to characterize genes functions in
each of the 8 phenotypes using
statistic approach
4. evaluation of good or poor prognosis
gene set
Results: 8 identified subgroups associate
with specific gene signatures.
Characterization
Creator/Presenter: Nataliia SamusBonardi et al., (2013) MCP 12(3): 626-637
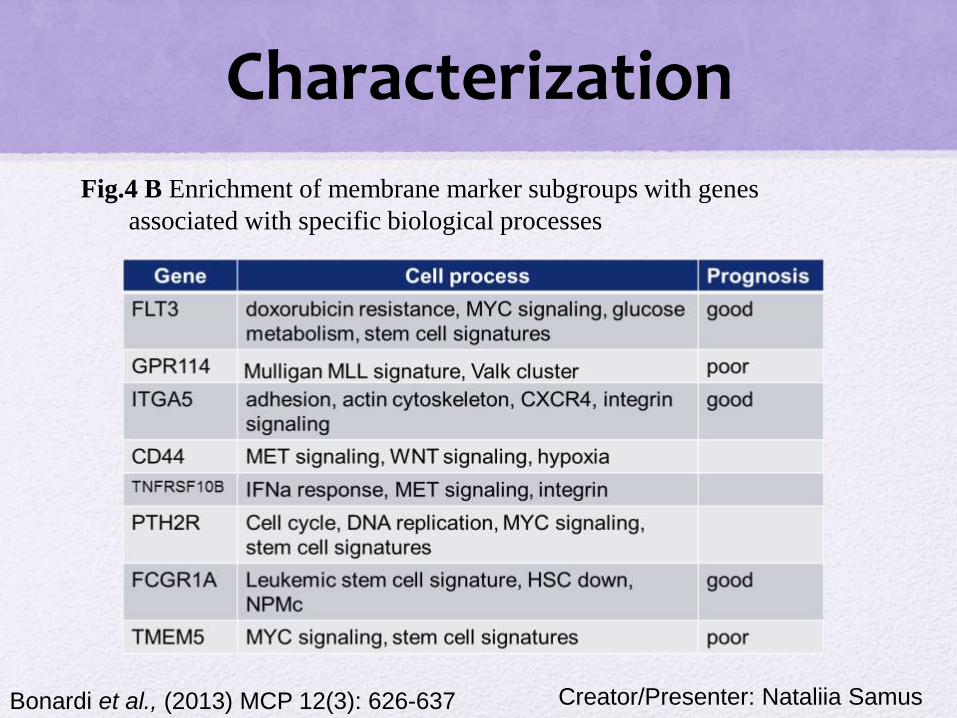
Fig.4 B Enrichment of membrane marker subgroups with genes
associated with specific biological processes
Characterization
Creator/Presenter: Nataliia SamusBonardi et al., (2013) MCP 12(3): 626-637
Conclusion
1. Eight plasma membrane markers were identified that were
uncorrelated within cohort of 60 AML samples.
2. GSEA analyses indicates that these subgroups are characterized by
specific cellular processes (mostly associated with cancer
development).
3. Strong positive correlation with good or poor prognosis signature
was found (not yet supported by clinical data).
4. Further functionally validation studies are required.

Creator/Presenter: Nataliia SamusBonardi et al., (2013) MCP 12(3): 626-637
Thank you!
Any questions?