a proof-of-concept investigation of cpp- modified attempts
TRANSCRIPT

A Proof-of-Concept Investigation of CPP-
Modified ATTEMPTS for Enhanced Toxin-
Based Colorectal Cancer Therapy
by
Meong Cheol Shin
A dissertation submitted in partial fulfillment
of the requirements for the degree of
Doctor of Philosophy
(Pharmaceutical Sciences)
in the University of Michigan
2013
Doctoral Committee:
Professor Victor C. Yang, Chair
Professor George A. Garcia
Professor Kyung-Dall Lee
Professor David E. Smith

© Meong Cheol Shin
2013

ii
Dedication
To my family and friends
With my love and respect

iii
Acknowledgements
I would like to express my sincere gratitude to Dr. Victor C. Yang for his support
and insightful guidance throughout my Ph.D. training years. He taught me the attitude to
keep up my confidence and bravely work out my experiments. I deeply respect his
perseverance and enthusiasm in his research as a scientist. I also would like to thank my
committee members, Dr. Kyung-Dall Lee, Dr. David E. Smith, and Dr. George A. Garcia
for their suggestions and guidance in my project.
I am also grateful to the Department of Pharmaceutical Sciences and the Rackham
Graduate School for supporting me during my Ph.D. I thank all my wonderful friends.
They were always there for me to make this long journey for a Ph.D. possible; my
classmates, Bei Yang, Kefeng Sun, Deanna Mudie, Maria M. Posada, and Lilly Roy for
their friendship and good memories through all the years; my previous lab members, Dr.
Yongzhuo Huang, Dr. Allan E. David, Dr. Cheol Moon, Dr. Hee Sun Chung, Dr. Adam J.
Cole, Dr. Tien-Yi Lee, Lindsay White, Dr. Yoon Shin Park, Dr. Joon-Beom Park, Dr.
Faquan Yu, Dr. Huining He, Dr. Beata Chertok, Dr. Lei Zhang and Dr. Jie Zhou for their
valuable advice and support; and my present lab members, Dr. Jian Zhang, Dr. Kyuri Lee,
Dr. Mei Wang and Jingwen Zhao for their help and friendship. I would like to dedicate
my work to my parents who supported me with love and belief throughout my life. Lastly,
I greatly thank my wife, Kyoung Ah and my two sons, Min Seok and Michael, for their
love and support.

iv
Table of Contents
Dedication ...................................................................................................... ii
Acknowledgements ...................................................................................... iii
List of Tables ............................................................................................... vii
List of Figures ............................................................................................ viii
Abstract........................................................................................................ xii
Chapter 1 Introduction ............................................................................. 1
1.1 Colorectal Cancer and Limitations of Current Chemotherapeutics ..................... 1
1.2 Gelonin Toxin ...................................................................................................... 2
1.3 Cell Penetrating Peptides (CPPs) ......................................................................... 2
1.4 CPP-modified ATTEMPTS (Antibody Targeted Triggered Electrically Modified
Prodrug-Type Strategy) ........................................................................................ 4
1.5 Specific Aims ....................................................................................................... 5
1.6 Figures .................................................................................................................. 6
1.7 References ............................................................................................................ 6
Chapter 2 Chemically and Biologically Synthesized CPP-Modified
Gelonin for Enhanced Anti-Tumor Activity ............................................... 9
2.1 Abstract ................................................................................................................ 9
2.2 Introduction ........................................................................................................ 10
2.3 Materials and Methods ....................................................................................... 13
2.4 Results ................................................................................................................ 22
2.5 Discussion .......................................................................................................... 27
2.6 Conclusions ........................................................................................................ 33
2.7 Tables ................................................................................................................. 35

v
2.8 Figures ................................................................................................................ 36
2.9 References .......................................................................................................... 45
Chapter 3 Heparin/Protamine-Mediated Effective Regulation on Cell
Transduction of CPP-Modified Gelonin ...................................................48
3.1 Abstract .............................................................................................................. 48
3.2 Introduction ........................................................................................................ 49
3.3 Materials and Methods ....................................................................................... 50
3.4 Results ................................................................................................................ 59
3.5 Discussion .......................................................................................................... 62
3.6 Conclusions ........................................................................................................ 65
3.7 Tables ................................................................................................................. 66
3.8 Figures ................................................................................................................ 67
3.9 References .......................................................................................................... 74
Chapter 4 Heparin Functionalized Monoclonal Antibody Mediated
Tumor Targeted Delivery of CPP-Modified Gelonin ..............................75
4.1 Abstract .............................................................................................................. 75
4.2 Introduction ........................................................................................................ 76
4.3 Materials and Methods ....................................................................................... 77
4.4 Results ................................................................................................................ 86
4.5 Discussion .......................................................................................................... 89
4.6 Conclusions ........................................................................................................ 93
4.7 Tables ................................................................................................................. 94
4.8 Figures ................................................................................................................ 95
4.9 References ........................................................................................................ 104
Chapter 5 Application of CPP-Modified ATTEMPTS for Enhanced
Toxin-Based Colorectal Cancer Therapy: Proof-of-Concept
Investigation ...............................................................................................107
5.1 Abstract ............................................................................................................ 107
5.2 Introduction ...................................................................................................... 108
5.3 Materials and Methods ..................................................................................... 109
5.4 Results .............................................................................................................. 115
5.5 Discussion ........................................................................................................ 119

vi
5.6 Conclusions ...................................................................................................... 122
5.7 Tables ............................................................................................................... 124
5.8 Figures .............................................................................................................. 126
5.9 References ........................................................................................................ 131
Chapter 6 Conclusions ...........................................................................132
6.1 Summary .......................................................................................................... 132
6.2 Future Studies ................................................................................................... 133

vii
List of Tables
Table 2-1. Summary of the IC50 values of nGel, rGel, cG-L and rG-L for inhibition of
protein translation in cell-free translational system .......................................................... 35
Table 2-2. Cytotoxicity levels (IC50) of rGel, cG-L and rG-L in various cancer cell lines
(CT 26, LS174T, 9L and PC-3) ........................................................................................ 35
Table 3-1. Summary of PCR primers for preparation of pET-TAT-Gel vector .............. 66
Table 3-2. Summary for the cytotoxicity study results (IC50) of gelonin and TAT-Gel .. 66
Table 4-1. Summary for the ELISA assay results of T84.66 and T84.66-Hep ................ 94
Table 5-1. Summary for the cytotoxicity study results (IC50) after TAT-Gel, T84.66-
Hep/TAT-Gel or T84.66-Hep/TAT-Gel+Pro treatment ................................................. 124
Table 5-2. Summary for PK profiles of T84.66, T84.66-Hep and T84.66-Hep as a
complex with TAT-Gel ................................................................................................... 124
Table 5-3. Summary for PK profiles of rGel, TAT-Gel and TAT-Gel as complex with
T84.66-Hep ..................................................................................................................... 125
viii
List of Figures
Figure 1-1. Illustration of CPP-modified ATTEMPTS. .................................................... 6
Figure 2-1. Scheme of gelonin-LMWP chemical conjugation via a disulfide bond using
heterobifunctional PEG as the cross-linker. (rGel: recombinant gelonin, cG-L: chemically
modified gelonin-LMWP). ............................................................................................... 36
Figure 2-2. Schematic design of (A) pET-Gel-LMWP vector, and (B) image of rGel,
TRX-Gel-LMWP and rG-L. ............................................................................................. 37
Figure 2-3. SDS-PAGE results of cG-L purified by a heparin column. .......................... 38
Figure 2-4. SDS-PAGE results of the Ni-NTA column purification of rG-L.................. 39
Figure 2-5. Purification of the recombinant gelonin-LMWP (rG-L) conjugate by a
heparin column.................................................................................................................. 40
Figure 2-6. Inhibition of protein translation by native (commercial) Gel (nGel; circle),
recombinant gelonin (rGel; square), chemical gelonin-LMWP (cG-L; cross) conjugate, or
recombinant gelonin-LMWP (rG-L; triangle) conjugate using a cell-free translational
system and luciferase as the marker.................................................................................. 41
Figure 2-7. LMWP-mediated cellular uptake by tumor cells of: (A) recombinant gelonin
(rGel), (B) chemical gelonin-LMWP (cG-L) conjugate, and (C) recombinant gelonin-
LMWP (rG-L) conjugate. ................................................................................................. 42

ix
Figure 2-8. Cytotoxic effect of recombinant gelonin (rGel), chemical gelonin-LMWP
(cG-L) conjugate, and recombinant gelonin-LMWP (rG-L) conjugate against (A) CT26,
(B) LS174T, (C) 9L and (D) PC-3 cell lines. ................................................................... 43
Figure 2-9. Inhibition of tumor growth by tumoral injection of PBS solution (control;
diamond), recombinant gelonin (rGel; cross) and 2 µg (triangle), 4 µg (square), or 20 µg
(circle) of recombinant gelonin-LMWP (rG-L) conjugate in a CT26 s.c. xenograft tumor
mouse model (N=5). ......................................................................................................... 44
Figure 3-1. Schematic designs of (A) pET-TAT-Gel vector, (B) rGel, TRX-TAT-Gel and
TAT-Gel. ........................................................................................................................... 67
Figure 3-2. Expression and purification of TAT-Gel. (A) SDS-PAGE results of Ni-NTA
column purification of TRX-TAT-Gel. ............................................................................ 68
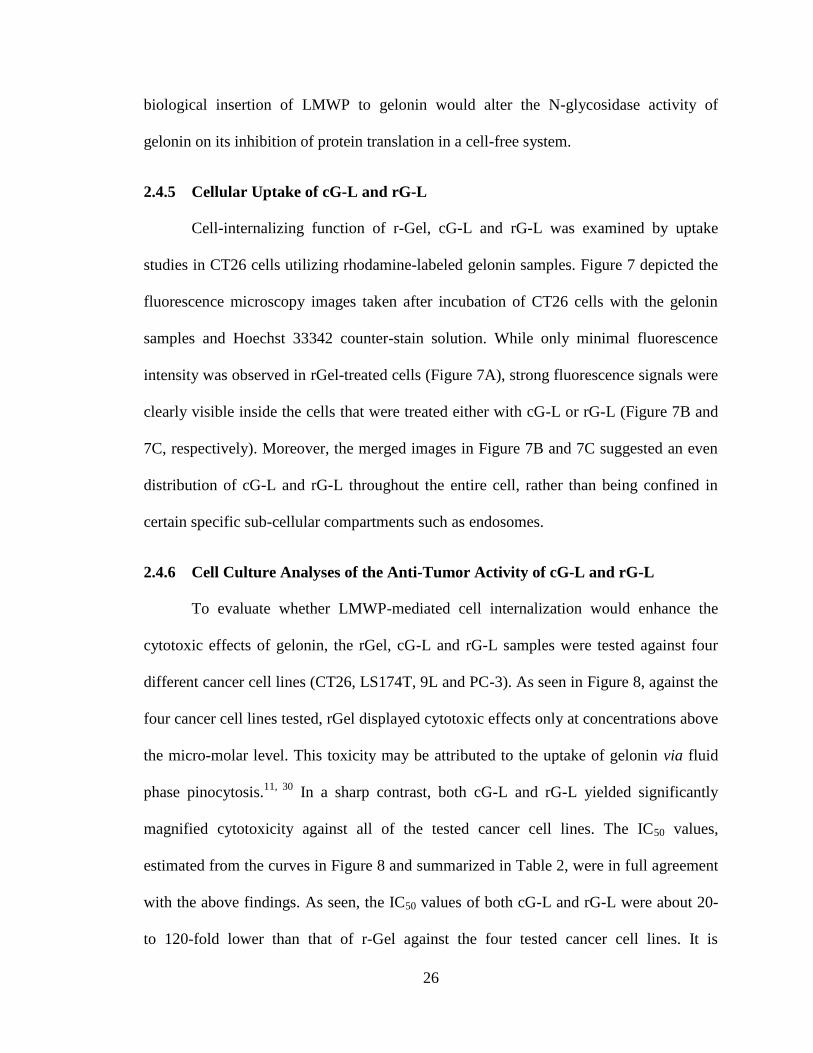
Figure 3-3. N-glycosidase activity of TAT-Gel determined by rabbit reticulocyte lysate
assay. ................................................................................................................................. 69
Figure 3-4. Confocal microscopic images of LS174T human adenocarcinoma cells
incubated with rhodamine-labeled (A) TAT-Gel or (B) rGel. .......................................... 70
Figure 3-5. Anti-cancer activity of TAT-Gel. .................................................................. 71
Figure 3-6. In vitro plasma stability of TAT-Gel/Hep and protamine-induced release of
TAT-Gel. ........................................................................................................................... 71
Figure 3-7. Heparin/protamine-mediated regulation on TAT-Gel cell internalization
evaluated by cell entry and cytotoxicity studies. .............................................................. 72
Figure 3-8. In vivo evaluation of heparin/protamine-mediated regulation on TAT-Gel
tumoricidal efficacy in a LS174T s.c. xenograft tumor mice model. ............................... 73
Figure 4-1. Schematic illustration of T84.66-Hep chemical conjugation. ....................... 95

x
Figure 4-2. Purification of T84.66-Hep. .......................................................................... 96
Figure 4-3. Confocal microscopic images of (A) HCT116 and (B) LS174T cells
incubated with rhodamine-labeled T84.66-Hep, and (C) LS174T cells incubated with 10-
fold molar excess of T84.66 followed by rhodamine-labeled T84.66-Hep. ..................... 97
Figure 4-4. ELISA assay results of T84.66 and T84.66-Hep tested against recombinant
carcinoembryonic antigen (rCEA, R&D SYSTEMS). ..................................................... 98
Figure 4-5. In vitro plasma stability of T84.66-Hep binding with cationic protamine
immobilized beads (Protamine-Agarose, Sigma-Aldrich).. .............................................. 99
Figure 4-6. Images of C5 and B4 under investigation of interference or quenching. .... 100
Figure 4-7. Fluorescence images of athymic nude mice bearing LS174T xenograft tumor
after i.v. injection of (A) T84.66-Hep-C5/TAT-Gel-B4; (B) PBS, C5 or nonspecific
murine IgG-C5. ............................................................................................................... 101
Figure 4-8. Fluorescence images of athymic nude mice bearing LS174T xenograft tumor
after i.v. injection of (A) TAT-Gel-B4; (B) non-specific IgG-Hep-C5/TAT-Gel-B4; or
(C) T84.66-Hep-C5/TAT-Gel-B4. .................................................................................. 102
Figure 4-9. Intra-tumor accumulation of TAT-Gel-B4. ................................................. 103
Figure 5-1. In vitro evaluation of CPP-modified ATTEMPTS on LS174T cells by XTT
assay. ............................................................................................................................... 126
Figure 5-2. Plasma clearance of T84.66, T84.66-Hep, rGel, TAT-Gel and T84.66-
Hep/TAT-Gel in mice. .................................................................................................... 127
Figure 5-3. Tissue distribution of TAT-Gel in athymic nude mice bearing LS174T
xenograft tumor. .............................................................................................................. 128
xi
Figure 5-4. Tissue distribution of T84.66-Hep (A) and TAT-Gel (B) in athymic nude
mice bearing LS174T xenograft tumor after administration of T84.66-Hep-C5/TAT-Gel-
B4. ................................................................................................................................... 129
Figure 5-5. In vivo efficacy study results in an LS174T s.c. xenograft tumor mice model.
......................................................................................................................................... 130

xii
Abstract
One of the major hurdles to cure cancer lies in the low potency of currently
available drugs, which could eventually be solved by using more potent therapeutic
macromolecules. However, although these macromolecules possess greater potency
inside the cancer cells, the barely permeable cell membrane remains a formidable barrier
in reducing their efficacy. For instance, gelonin, a typical ribosome inactivating protein
(RIP) possesses exceptionally high N-glycosidase activity, but the anti-cancer effects of
gelonin are rather negligible, due to its inability to enter tumor cells. To overcome the
cell membrane barrier, we modified gelonin with two model cell penetrating peptides
(CPPs), TAT peptide and low molecular weight protamine (LMWP), via both chemical
conjugation and genetic recombination methods. Through in vitro and in vivo studies,
these CPP-modified gelonins (i.e. gelonin-LMWP chemical conjugate (cG-L),
recombinant gelonin-LMWP chimera (rG-L) and TAT-gelonin chimera (TAT-Gel))
displayed markedly improved cell uptake efficiency and, thereby, significantly enhanced
tumoricidal activity, compared with unmodified recombinant gelonin (rGel). On the other
hand, this CPP-modification aggravated the potential toxicity concerns of gelonin as the
non-specific fashion of CPP-mediated cell uptake led to internalization of the CPP-
modified gelonins into any type of cells. Thus, to curb the cell penetration activity of CPP
and expose it only to the tumor cells, a modified version of ATTEMPTS (Antibody
Targeted Triggered Electrically Modified Prodrug Type Strategy), a heparin/protamine-

xiii
based drug delivery system (DDS), featured by ‘antibody-mediated tumor targeting’ and
‘prodrug strategy’ was explored. For targeting, a heparin functionalized monoclonal
antibody (mAb) was developed with T84.66 (i.e. T84.66-Hep), an anti-CEA mAb, via
chemical conjugation. When T84.66-Hep and TAT-Gel was mixed together, they
automatically formed a tight complex via electrostatic interaction between anionic
heparin and cationic TAT. Systemic administration of this T84.66-Hep/TAT-Gel
complex enabled much higher accumulation of TAT-Gel (58-fold higher tumor exposure)
in LS174T xenograft tumor, compared with injection of TAT-Gel alone. Furthermore,
heparin/protamine-based prodrug feature of the DDS provided significantly enhanced
tumoricidal efficacy with yet reduced toxicity, compared with administration of TAT-Gel
alone. Overall, this study provides a general rationale to enhance the therapeutic efficacy
of potent but cell-impermeable macromolecules and, further, safely deliver to their target
site.

1
Chapter 1
Introduction
1.1 Colorectal Cancer and Limitations of Current Chemotherapeutics
In the United States, colorectal cancer is the third most commonly diagnosed
cancer (estimate of 140,000 new cases in 2013) and the second leading cause of cancer
related deaths (estimate of 50,000 deaths in 2013).1 Despite certain successes in
improving the survival rate of the patients by early cancer detection and appropriate
surgical intervention (average 67%), a cure is yet elusive specifically for metastasized
cancers which are unable to be removed by surgery (survival rate: 6 %).1-3
The difficulty
to treat those metastasized cancers with current approved small anticancer drugs lies in
their low therapeutic efficacy and toxicity issues caused by non-selective mode of the
drug action.4, 5
For example, 5-FU (or fluorouracil) is a pyrimidine analogue drug
prescribed for colorectal cancer therapy over 40 years.6 Although 5-FU still remains the
primary choice for treatment, its therapeutic effect is strictly limited (10 – 15% response
rate and at most 6 – 8 months extension of life-span).4 Thus, 5-FU has often been used in
combination with 1 or 2 other drugs. Although this combination therapy has been, indeed,
more effective than treatment by 5-FU alone, its therapeutic outcome (20 month of

2
extension of life span) is yet far from achieving cure and, what is worse, frequently
induces severe toxicity.7
1.2 Gelonin Toxin
To overcome the limitations of current small molecule-based anti-cancer drug
therapy, dramatically rising interest has been directed to macromolecules with
exceptional therapeutic potency. Specifically, the ribosome-inactivating proteins (RIPs),
a family of N-glycosidases, represent promising drug candidates for treatment of cancer.8
For example, gelonin, originally derived from the seeds of Gelonium multiflorum, is a
typical RIP that has been clinically studied for its anti-cancer application.9, 10
This gelonin
exerts extreme potency in inhibiting protein synthesis via the cleavage of a single adenine
residue (A4324) in the 28S ribosomal RNA.9 Even a single gelonin molecule, assuming its
effectiveness of access to the target ribosomes, can kill one tumor cell due to its
exceptional catalytic activity, while there requires 104–10
5 molecules of its
chemotherapeutics counterparts for the same job.11
However, in spite of the potency,
gelonin is not able to cross the cell membrane.11
Therefore, it is imperative to overcome
the membrane barrier to utilize gelonin for tumor treatment.
1.3 Cell Penetrating Peptides (CPPs)
The discovery of the potent cell-penetrating activity of CPPs such as TAT (an
arginine-rich, 11-amino acid peptide derived from the human immunodeficiency virus
(HIV) protein) or low molecular weight protamine (LMWP; an arginine rich 14-amino
acid peptide derived from protamine protein) has shed light of finally solving the

3
membrane barrier problem.12-15
Both cell culture and animal studies showed that by
covalently linking those CPPs to almost any type of drugs including hydrophilic
compounds and large proteins, the CPPs were able to translocate the attached species into
cells of all organ types including the brain.16
Although the mechanism of CPP-mediated
cell transduction remains unclear, this event appeared to require a surface adsorption step
(likely via the binding of the cationic CPP to the anionic heparan sulfate on the cell
surface); because the CPP-mediated cell translocation was completely inhibited by the
presence of heparin.17
Unprecedentedly, this CPP-mediated cell entry was so effective
and overwhelming that it could not be matched by any existing cell entry method
including receptor-mediated endocytosis. Indeed, in their investigation of cell targeting
by a CPP-linked antibody, Niesner et al reported that the cell-entering activity of CPP
was so potent that it actually overrode the targeting function of the antibody.18
As a
consequence, a whole body distribution of the CPP-antibody conjugates, similar to the
profile of CPP alone, was observed before the antibody could ever exert its targeting
activity. To this regard, although the unparalleled potency of CPP to transduce all types
of compounds (small, large, hydrophobic or hydrophilic) across all types of cell
membranes renders it an ideal means to overcome the membrane barrier, the lack of
selectivity of CPP on mediated cell internalization unfortunately makes this method an
unacceptable practice due to concerns of causing drug-associated toxic effects.

4
1.4 CPP-Modified ATTEMPTS (Antibody Targeted Triggered Electrically
Modified Prodrug-Type Strategy)
The CPP-modified ATTEMPTS system is assembled with a unique architecture
that comprises all of the desirable features of a drug delivery system (DDS) including: (1)
targeting, (2) prodrug, and (3) the potent CPP-mediated cellular drug uptake.19
A
schematic illustration of this delivery approach is shown in Figure 1. In brief, this system
consists of a complex body made of two (i.e. targeting and drug) components. The
targeting component consists of a specific targeting moiety (which could be an antibody
(Ab) or a peptide ligand) coupled with a heparin (Hep) molecule. The drug component
consists of the delivered drug covalently linked with a CPP. These two components can
attach to each other automatically by a charge-charge interaction between the anionic
heparin (on the targeting component) and the cationic CPP (on the drug component).
Binding of heparin to CPP would produce three critical functions: (1) it would inhibit the
trans-membrane activity of CPP thereby prohibiting the CPP-Drug/Ab-Hep complex
from entering normal cells; (2) it would protect CPP from degradation by plasma trypsin-
like proteases; and (3) it would preserve the targeting function of the antibody since the
trans-membrane function of CPP is completely masked by heparin. Following i.v.
administration, the antibody-guided, prodrug-behaved complexes will spare interaction
with normal cells during their targeting to the tumor. After reaching the target, protamine
sulfate, a clinical heparin antidote that binds heparin stronger than CPP, will be
administered as a competing agent to dissociate the CPP-Drug part from its Ab-Hep
counterpart. Once relieved from heparin binding, CPP will resume its potent trans-

5
membrane activity, ferrying the CPP-Drug conjugates into the targeted tumor cells. The
drug will then induce apoptosis of the tumor cells.
1.5 Specific Aims
The research objective of this dissertation is to develop a potent CPP-modified
gelonin toxin, and investigate the feasibility to apply a modified ATTEMPTS for
enhanced CPP-modified toxin-based colorectal cancer therapy. On this basis, the
following specific aims will be addressed:
1) To develop CPP-modified gelonin and characterize the anti-cancer activity and
applicability for CPP-modified ATTEMPTS.
2) To develop a mAb-Hep and evaluate its ability to selectively deliver a CPP-
modified gelonin to the tumor via complex formation.
3) To evaluate the feasibility of applying CPP-modified ATTEMPTS for enhanced
toxin-based colorectal cancer therapy.

6
1.6 Figures
Figure 1-1. Illustration of CPP-modified ATTEMPTS.
1.7 References
1. Siegel R, Naishadham D, Jemal A. Cancer statistics, 2013. CA Cancer J Clin
2013;63:11-30.
2. Rex DK, Johnson DA, Anderson JC, Schoenfeld PS, Burke CA, Inadomi JM,
American College of G. American College of Gastroenterology guidelines for
colorectal cancer screening 2009 [corrected]. Am J Gastroenterol 2009;104:739-
50.
3. Edwards BK, Ward E, Kohler BA, Eheman C, Zauber AG, Anderson RN, Jemal
A, Schymura MJ, Lansdorp-Vogelaar I, Seeff LC, van Ballegooijen M, Goede

7
SL, Ries LA. Annual report to the nation on the status of cancer, 1975-2006,
featuring colorectal cancer trends and impact of interventions (risk factors,
screening, and treatment) to reduce future rates. Cancer 2010;116:544-73.
4. Zhang DQ, Guo Q, Zhu JH, Chen WC. Increase of cyclooxygenase-2 inhibition
with celecoxib combined with 5-FU enhances tumor cell apoptosis and
antitumor efficacy in a subcutaneous implantation tumor model of human colon
cancer. World J Surg Oncol 2013;11:16.
5. Tzeng CW, Aloia TA. Colorectal liver metastases. J Gastrointest Surg
2013;17:195-201; quiz p -2.
6. Heidelberger C, Chaudhuri NK, Danneberg P, Mooren D, Griesbach L,
Duschinsky R, Schnitzer RJ, Pleven E, Scheiner J. Fluorinated pyrimidines, a
new class of tumour-inhibitory compounds. Nature 1957;179:663-6.
7. Kelly H, Goldberg RM. Systemic therapy for metastatic colorectal cancer:
current options, current evidence. J Clin Oncol 2005;23:4553-60.
8. Barbieri L, Battelli MG, Stirpe F. Ribosome-inactivating proteins from plants.
Biochim Biophys Acta 1993;1154:237-82.
9. Stirpe F, Olsnes S, Pihl A. Gelonin, a new inhibitor of protein synthesis,
nontoxic to intact cells. Isolation, characterization, and preparation of cytotoxic
complexes with concanavalin A. J Biol Chem 1980;255:6947-53.
10. Hertler AA, Frankel AE. Immunotoxins: a clinical review of their use in the
treatment of malignancies. J Clin Oncol 1989;7:1932-42.
11. Atkinson SF, Bettinger T, Seymour LW, Behr JP, Ward CM. Conjugation of
folate via gelonin carbohydrate residues retains ribosomal-inactivating
properties of the toxin and permits targeting to folate receptor positive cells. J
Biol Chem 2001;276:27930-5.
12. Torchilin VP. Tat peptide-mediated intracellular delivery of pharmaceutical
nanocarriers. Adv Drug Deliv Rev 2008;60:548-58.
13. Frankel AD, Pabo CO. Cellular uptake of the tat protein from human
immunodeficiency virus. Cell 1988;55:1189-93.
14. Heitz F, Morris MC, Divita G. Twenty years of cell-penetrating peptides: from
molecular mechanisms to therapeutics. Br J Pharmacol 2009;157:195-206.
15. Park YJ, Chang LC, Liang JF, Moon C, Chung CP, Yang VC. Nontoxic
membrane translocation peptide from protamine, low molecular weight
protamine (LMWP), for enhanced intracellular protein delivery: in vitro and in
vivo study. FASEB J 2005;19:1555-7.
16. Schwarze SR, Ho A, Vocero-Akbani A, Dowdy SF. In vivo protein
transduction: delivery of a biologically active protein into the mouse. Science
1999;285:1569-72.
17. Derossi D, Calvet S, Trembleau A, Brunissen A, Chassaing G, Prochiantz A.
Cell internalization of the third helix of the Antennapedia homeodomain is
receptor-independent. J Biol Chem 1996;271:18188-93.
18. Niesner U, Halin C, Lozzi L, Gunthert M, Neri P, Wunderli-Allenspach H, Zardi
L, Neri D. Quantitation of the tumor-targeting properties of antibody fragments
conjugated to cell-permeating HIV-1 TAT peptides. Bioconjug Chem
2002;13:729-36.

8
19. Kwon YM, Li YT, Liang JF, Park YJ, Chang LC, Yang VC. PTD-modified
ATTEMPTS system for enhanced asparaginase therapy: a proof-of-concept
investigation. J Control Release 2008;130:252-8.

9
Chapter 2
Chemically and Biologically Synthesized CPP-Modified
Gelonin for Enhanced Anti-Tumor Activity
2.1 Abstract
The ineffectiveness of small molecule drugs against cancer has generated
significant interest in more potent macromolecular agents. Gelonin, a plant-derived toxin
with unparalleled N-glycosidase activity to inhibit protein translation, has attracted much
attention in this regard. Due to its inability to internalize into cells, however, gelonin only
exerts limited tumoricidal effect. To overcome this cell membrane barrier, we modified
gelonin with the low molecular weight protamine (LMWP) peptide, a cell penetrating
peptide (CPP) which was shown to efficiently ferry various cargos into cells, via both
chemical conjugation and genetic recombination methods. Results confirmed that while
chemically-modified and genetically-modified gelonin-LMWP conjugates (abbreviated
as cG-L and rG-L, respectively) possessed equivalent N-glycosidase activity to that of
unmodified recombinant gelonin (rGel), they both were able to internalize into tumor
cells, unlike rGel. Cytotoxicity studies further demonstrated that both cG-L and rG-L
exhibited significantly improved tumoricidal effects, with IC50 values reaching 120-fold
lower than that of rGel. Moreover, when tested against a CT26 s.c. xenograft tumor

10
mouse model, significant inhibition of tumor growth was observed, with rG-L doses
being as low as 2 µg/tumor, when comparing with rGel which yielded no detectable
therapeutic effects even at doses 10-fold higher. Overall, this study shed light on the
potential of utilizing CPP-modified gelonin as a highly potent anticancer drug to
overcome limitations of currently existing chemotherapeutic agents.
2.2 Introduction
Anti-cancer drug therapies at the present time are primarily focused on small
molecule agents. While some have shown to be efficacious, most of these small molecule
drugs have suffered from a poor therapeutic index – a ratio of the concentration required
for efficacy versus that for toxicity.1 This issue becomes most apparent in the treatment
of cancers, where side-effects often limit the amount of drug dosing which, subsequently
result in an accumulation of sub-optimal drug concentrations at the tumor target. With
unmatched potency and selectivity, macromolecules have drawn significant interest over
the past few decades for their potential to overcome the limitations of small molecule
drugs.2-4
Clinical translation of macromolecular drugs, however, has largely been
prohibited, due to the low bioavailability, instability in physiological environment and, in
many cases, poor intracellular transport of these agents.2, 3, 5, 6
A typical example is the
plant-derived ribosome-inactivating protein (RIP) toxins. Since the initial discovery of
ricin from castor oil plants,7 more than 50 different RIPs have now been identified.
8, 9
RIPs are extremely potent inhibitors of protein synthesis, and thus have drawn
considerable interest for potential use as anticancer drugs10
Gelonin, for instance, belongs
to this RIP family. It is a 30-kDa single chain glycoprotein extracted from seeds of

11
Gelonium multiflorum, and inactivates ribosomes by the cleavage of a single adenine
residue (A4324) in the 28S ribosomal RNA11
Because of the high substrate specificity,
non-stoichiometric mode of action, and repetitive reaction mechanism, the therapeutic
efficacy of gelonin cannot be matched by any of the existing anti-tumor agents.11
It has
even been postulated that a single molecule of the gelonin toxin is sufficient enough to
completely kill one cancer cell,12, 13
if the drug can reach the ribosome. Yet, this
unparallel therapeutic potency has not been realized clinically, primarily due to the
inability of gelonin to cross the cell membrane barrier for effective uptake.8, 11
A means
to deliver gelonin into the intracellular compartment therefore becomes an essential
element to utilize this extremely potent N-glycosidase activity for cancer treatment.
The 1988 discovery by Frankel and Pabo that TAT (transactivator of
transcription) protein derived from HIV-1 virus could internalize cells14
led to the
identification of a class of peptides with unique and unprecedented cell-penetrating
activity15-17
. Later studies demonstrated that these peptides, so-called “cell penetrating
peptides (CPPs)”, were also able to efficiently translocate the attached cargos such as
protein molecules or nano-scale drug carriers into cells.15-17
Although the mechanism of
cell entry remains unclear and not unified, it now appears that the interaction of the
cationic CPP with negatively charged glycosaminoglycans on cell surface is an essential
prerequisite, because addition of extracellular heparin, heparan or dextran sulfate would
completely abolish the cell-internalizing functions of these CPPs.18, 19
Low molecular weight protamine (LMWP) is a 14-mer peptide
(VSRRRRRRGGRRRR), previously developed by Yang and coworkers that exhibits
CPP-like cell-penetrating behavior.20
Both in vitro and in vivo studies demonstrated that

12
LMWP could transduce proteins, genes and even nano-scale drug carriers like liposomes
into living cells.20-24
Aside from this cell penetrating ability, LMWP also possessed a
number of other significant advantages over currently existing CPPs including: 1) the
capability for mass production; 2) a thoroughly investigated toxicological and
immunological profile; and 3) the in vivo safe application as an antidote for heparin
reversal.20, 25-27
Based on these findings, we hypothesized that modification of gelonin
with LMWP could effectively and safely deliver gelonin into tumor cells, thereby
dramatically enhancing gelonin’s cytotoxic effects against tumors.
In this chapter, we present in vitro findings of both chemically and biologically
modified gelonin. For chemical modification, LMWP was covalently attached to gelonin
using a heterobifunctional polyethylene glycol (PEG) cross-linker. For recombinant
modification, gene encoding LMWP was inserted at the C-terminus of the gelonin gene,
and the resulting fusion protein was expressed in Escherichia coli (E.coli). The inhibitory
activity on protein translation by both chemically synthesized and recombinant gelonin-
LMWP conjugates, abbreviated as cG-L and rG-L respectively, was assessed using a cell-
free translational system. In addition, the cell-penetrating ability and potency against
tumor cells were examined in a variety of cancer cell lines. Furthermore, preliminary in
vivo investigation of the inhibition on tumor growth was conducted in a CT26 xenograft
tumor mice model.
13
2.3 Materials and Methods
2.3.1 Materials
The pET28a-gelonin vector (pET-Gel) was used for overexpression of
recombinant gelonin (rGel). Competent E.coli cells (TOP10, BL21star (DE3) and BL21-
CodonPlus), pEXP-5-NT/TOPO TA expression kit, AcTEVTM
protease, LB broth, fetal
bovine serum albumin (FBS), PBS (pH 7.4), Dulbecco's Modified Eagle Medium
(DMEM), RPMI1640 and Hoechst 33342 trihydrochloride, trihydrate were purchased
from Invitrogen (Carlsbad, CA). Carbenicillin, kanamycin, and isopropyl-β-
thiogalactopyranoside (IPTG) were purchased from Fisher Scientific (Pittsburg, PA).
Heparin sulfate, rhodamine B isothiocyanate, Traut’s reagent (2-iminothiolane; 2-IT) and
DTNB (5, 5'-dithiobis-(2-nitrobenzoic acid)) were purchased from Sigma-Aldrich (St.
Louis, MO). DNA primers were purchased from Integrated DNA Technologies Inc.
(Coralville, IA). DNA restriction endonucleases (NdeI, NheI-HF, EcoRI-HF and XhoI)
and T4 DNA ligase were purchased from New England Biolabs (Ipswich, MA). BCA
protein assay kit was purchased from Bio-Rad Laboratories (Hercules, CA). Rabbit
reticulocyte lysate system, luciferase assay system and recombinant RNasin®
ribonuclease inhibitor were purchased from Promega Corporation (Madison, WI). Cell
proliferation kit II (XTT) was purchased from Roche Applied Science (Indianapolis, IN).
Native gelonin (nGel) was purchased by Enzo Life Sciences Inc. (Farmingdale, NY).
LMWP was obtained from ISTN (Lancaster, PA) and heterobifunctional PEG (NHS-
PEG-PDP; 2 kDa) was purchased from JenKem Technology USA Inc. (Allen, TX).

14
2.3.2 Expression and Purification of Recombinant Gelonin (rGel)
The pET-Gel vector was transformed into E.coli strain (BL21 (DE3)), and rGel
was produced following the method described by Hossann et al.28
Briefly, a single colony
of pET-Gel transformed BL21 (DE3), grown on LB agar plate with 80 µg/mL
kanamycin, was picked and inoculated into 200 mL of LB medium. This starter culture
was incubated overnight at 37°C with shaking at 250 rpm and then used to inoculate 5 L
of fresh LB medium, which was incubated at 37°C with shaking at 250 rpm. When the
optical density at 600 nm reached 1, IPTG inducer was added to a final concentration of
0.5 mM. The culture was further incubated under the same conditions for 6 hr. Cells were
then harvested by centrifugation at 4000 rpm for 20 min at 4°C. The pellet was
suspended in 30 mL of 20 mM phosphate buffer saline (PBS, 300 mM NaCl, pH 7) and
the cells were lysed by sonication (4 × 30 sec, with 50% output in ice bath). The cell
lysate was centrifuged at 20,000 rpm for 30 minutes and the supernatant was loaded onto
HisPure® Ni-NTA resin (Bio-Rad Laboratories, Hercules, CA) pre-equilibrated with 20
mM PBS (300 mM NaCl, pH 7). The impurities were washed with 200 mL of PBS and
then rGel was eluted with 20 mM PBS containing imidazole (300 mM NaCl, 400 mM
imidazole, pH 7). For further purification, the eluent from the Ni-NTA resin was loaded
onto a cation exchange column (HiTrap Sepharose CM-FF, GE Healthcare Bio-Sciences,
Pittsburgh, PA) connected to a HPLC (Alltech 526 HPLC pump, Deerfield, IL) and rGel
was purified by elution with a salt gradient (0 to 2 M NaCl at a rate of 0.02M/min, flow
rate: 1 mL/min).

15
2.3.3 Preparation and Purification of Chemically-Conjugated Gelonin-LMWP
(cG-L)
Chemical conjugation of rGel with LMWP was accomplished using Traut’s
reagent and a heterobifunctional PEG (NHS-PEG-PDP, 2 kDa) as the cross-linker. The
NHS group on one side of the PEG chain was amine reactive while the PDP group at the
other end was thiol reactive. The conjugation scheme is shown in Figure 1. Briefly, thiol
groups were first introduced to rGel (5 mg/mL in 2 mL of 10 mM PBS, 50 mM
triethanolamine, 2 mM EDTA, pH 8) by incubation with 10 molar excess of Traut’s
reagent for 1 hr at room temperature. Unreacted Traut’s reagent was removed by
ultrafiltration using a centrifugal filtration device (molecular weight cut-off: 10 kDa,
Amicon® Centricon® Centrifugal Filter Devices, Millipore Corporation, Billerica, MA)
and the generated thiol groups on rGel were quantified by Ellman’s assay.
Next, the amine group on the LMWP peptide (10 mg/mL in 20 mM PBS with
0.15 M NaCl, pH 7.4) was reacted with 3-fold molar excess of NHS-PEG-PDP for 4 hr at
room temperature with shaking to introduce LMWP with the thiol-reactive PDP group.
Unreacted PEG was removed by loading the reaction mixture onto a heparin column
(HiTrap Heparin HP, GE Healthcare Bio-Sciences, Pittsburgh, PA) and washing with 50
mM phosphate buffer (pH 7.4). Purified LMWP-PEG-PDP was then eluted with 2 M
NaCl (50 mM PBS, 2 M NaCl, pH 7.4) at a flow rate of 1 mL/min. LMWP-bound PDP
groups were quantified by the pyridine-2-thione (P2T) assay. Following the preparation
of both thiolated-rGel (rGel-SH) and LMWP-PEG-PDP, they were mixed together at a
molar ratio of 1:5 (rGel-SH:LMWP-PEG-PDP) and incubated overnight at 4°C. The final
cG-L product was purified from unreacted rGel by using a heparin column and elution

16
with a salt gradient (0 to 2 M NaCl at a rate of 0.02M/min, flow rate: 1 mL/min). Any
unreacted LMWP and LMWP-PEG-PDP which might be present in the cG-L peak
fraction was further removed by centrifugal filtration (Eppendorf Centrifuge 5702R),
using membranes with a 10 kDa molecular weight cut-off pore size. The purified cG-L
was stored at 4°C until further use.
2.3.4 Preparation and Purification of the Recombinant Gelonin and LMWP
Chimera (rG-L)
Construction of Gelonin-LMWP Genes
The gelonin-LMWP gene was constructed by inserting a PCR fragment encoding
the LMWP gene into the pET-Gel vector (pET28a-Gel). Briefly, double stranded DNA
fragments containing partial C-terminal gelonin and LMWP encoding codons (646 bp)
were prepared by PCR using pET-Gel vector as a template. The primers used for the PCR
reaction were as follows: 1) the forward primer was 5’-AAA GCT CGA ATT CTT ATT
ACC TTC TCC TTC TAC CTC CCC TTC TCC TTC TCC TTC TTG ATA CAC CTT
TCG GAT CTT TGT CG-3’ and 2) the backward primer was 5’-AAC GAT AAC GGC
CAG CTA GCG GAA ATT GC-3’. The PCR product was purified by 1% agarose gel
electrophoresis and inserted into a pEXP-5-NT/TOPO vector using the vendor’s protocol
(Invitrogen, Carlsbad, CA). Both the pET-Gel vector and the pEXP-5-NT/TOPO vector
encompassing the partial gelonin and LMWP genes were then double digested with NheI
& EcoRI-HF. The open digested pET-Gel vector and the DNA insert were purified by
1% agarose gel electrophoresis, ligated by T4 ligase reaction and then transformed into
TOP10 competent cells. The prepared pET28a-Gel-LMWP vectors were submitted for
DNA sequencing analysis.
17
For expression of rG-L with N-terminal thioredoxin-6x His tag (TRX-Gel-
LMWP), the pET-Gel-LMWP vector (pET22b-TRX-Gel-LMWP) was prepared utilizing
the pET28a-Gel-LMWP vector. The full length gelonin-LMWP gene was digested from
pET28a-Gel-LMWP vector by NdeI & XhoI restriction enzymes and, after purification
by 1% agarose gel electrophoresis, it was inserted into the pET22b-TRX vector which
contains the gene encoding for thioredoxin-6xHis tag and TEV protease cleavable
peptide. The prepared pET-Gel-LMWP vector was submitted for DNA sequencing
analysis. The schematic design of the pET-Gel-LMWP vector is depicted in Figure 2A
and schematic images of rGel, TRX-Gel-LMWP and rG-L are shown in Figure 2B.
Expression and Purification of rG-L
Prior to large scale (5L) production, the expression of rG-L was tested in a small
culture (6 mL) under various conditions, including different media (LB, 2xYT and TB),
temperatures (37°C, 25°C and 16°C) and final IPTG concentrations (0.1, 0.5 and 1 mM),
using both pET28a-Gel-LMWP and pET-Gel-LMWP vectors. To express the rG-L
protein chimera, vectors were separately transformed into BL21star (DE3) E.coli strains.
For the pET28a-Gel-LMWP vector, a different E.coli strain (BL21-CodonPlus) was also
used to test the expression. Similar procedures used for expression of rGel were
employed for expression of rG-L. After expression and cell lysis, both the supernatant
and the pellet of the cell lysate were investigated for rG-L expression via SDS-PAGE
analysis. The insoluble pellet fraction of rG-L expression was solubilized in 1% SDS
solution with boiling and sonication, before separation with SDS-PAGE. Separate
batches with no IPTG induction served as controls. The success of the expression was

18
determined by the presence of the expected rG-L or TRX-Gel-LMWP band in the SDS-
PAGE results.
Based on the expression study results, the pET-Gel-LMWP vector was adopted
for large scale production of rG-L. The expression and Ni-NTA resin purification
procedures applied for production of rGel were identical to those used for TRX-Gel-
LMWP and thus would not be reiterated here. After expression and purification, TRX-
Gel-LMWP was incubated with TEV protease to remove the thioredoxin-6xHis tag
following the vendor’s protocol (AcTEV™ protease, Invitrogen, Carlsbad CA). The
cleaved product was loaded onto a heparin column, and the final rG-L protein chimera
was acquired by salt gradient elution (0 to 1.4 M NaCl at a rate of 0.02 M/min, flow rate:
1 mL/min).
2.3.5 Protein Assays
The products of rGel, cG-L and rG-L were monitored by SDS-PAGE on 10%
Tris-HCl gel. Purity of the proteins was assessed by performing densitometry analysis
(ImageJ software, National Institutes of Health, Bethesda, MD) on the gels. Protein
concentration was determined by the BCA protein assay using native gelonin (nGel;
(Enzo Life Sciences Inc) as the standard.
2.3.6 Assessment of the Inhibition of Protein Translation by cG-L and rG-L
The ability of nGel, rGel, cG-L and rG-L to inhibit protein translation was
evaluated in a cell-free translational system using rabbit reticulocyte lysate and luciferase
mRNA. Briefly, in separate eppendorf tubes, 5 µL of either nGel, rGel, cG-L or rG-L of
different concentrations (10-12
- 10-7
M) were mixed with 35 µL of rabbit reticulocyte
lysate, 1 µL of amino acid without methionine, 1 µL of amino acid without leucine, 1.4

19
µL of potassium chloride, 1 µL of luciferase control mRNA, 1 µL of RNasin®
ribonuclease inhibitor and 4.6 µL of ultrapure water (total reaction volume: 50 µL). The
reaction mixture was incubated at 30°C for 90 min, and the amount of translated
luciferase was then measured by the luciferase assay system (Promega Corp., Madison,
WI). Briefly, 2.5 µL of the reaction mixture was added to 50 µL of luciferase substrate
and the luminescence intensity was measured by a plate reader (BioTEK® Synergy™
BioTEK, Co., Winooski, VT) following the vendor’s protocol. Luminescence intensities
were plotted against gelonin concentrations, and the concentration required to inhibit
50% luciferase translation (IC50) was calculated by nonlinear regression using Prism
software (Prism version 5.0, GraphPad, San Diego, CA).
2.3.7 Cell Culture
CT26 murine adenocarcinoma cells, LS174T human adenocarcinoma cells, 9L
human glioma cells and PC-3 human prostate cancer cells were obtained from American
Type Culture Collection (ATCC) (Manassas, VA). The cells were cultured in 75 cm2
flasks at 37°C in a 95% air/5% CO2 containing humidified incubator. CT26 cells were
maintained in RPMI1640 medium with 1% (v/v) penicillin-streptomycin, and 10% FBS.
Both LS174T and 9L cells were cultured in Dulbecco’s Modified Eagle Medium
(DMEM) with 2 mM L-glutamine, high glucose, 1% (v/v) penicillin-streptomycin, and
10% FBS. PC-3 cells were cultured in 50% RPMI1640 and 50% DMEM with 1% (v/v)
penicillin-streptomycin, and 10% FBS. Culture media in the flask was changed every
other day. After reaching confluency, cells were transferred into new culture flasks by
detaching with 0.25% Trypsin-EDTA and reseeding at a 1:3 split ratio for the continuous
cultures.

20
2.3.8 Evaluation of LMWP-mediated Cellular Uptake of cG-L and rG-L
The rGel, cG-L and rG-L proteins were each labeled with rhodamine dye by
mixing the sample (2 mg/mL in 0.1 M sodium bicarbonate buffer, pH 9.3) with
rhodamine B isothiocyanate at a molar ratio of 1:5, and then incubated at room
temperature for 4 hr. After incubation, unreacted excess rhodamine dye was removed by
applying the reaction solution to dye removal resin following the vendor’s protocol (Bio-
Rad Laboratories, Hercules CA). The protein to dye ratio was determined by measuring
the optical density at 280 nm and 520 nm for protein and the dye, respectively.
Prior to the cell uptake study, CT26 cells were seeded onto a 24 well plate with
5x10⁴ cells/well and incubated for 24 hr in complete RPMI1640 medium with 10% FBS.
When cell confluency reached approximately 50%, rhodamine-labeled rGel, cG-L and
rG-L were added to the cells (~ 5 µM final concentrations with identical fluorescent
intensities among the samples) and incubated for 3 hr at 37°C in a humidified CO2
incubator. The cells were washed three times with heparin/PBS (10 mg/mL heparin in 50
mM phosphate buffer, 0.15 M NaCl, pH 7.4), followed by the addition of the Hoechst
33342 solution (1:1000 dilution of 16.2 mM stock solution) to counter-stain the nucleus
of these cells. After 30 min incubation with Hoechst 33342, cells were washed three
times with PBS. Images of the live cells were then taken using a Nikon TE2000S
epifluorescence microscope equipped with a standard mercury bulb, a charge-coupled
device camera (Roper Scientific, Tucson, AZ), a 20 objective ((Nikon Plan Fluor ELWD
20) and a triple-pass DAPI/FITC/TRITC filter set (Chroma Technology Corp.,
Brattleboro,VT). Cell images were acquired and analyzed by Metamorph software
(Molecular Devices Corporation, Sunnyvale, CA).

21
2.3.9 Anti-cancer Activity of cG-L and rG-L
The anti-cancer activities of rGel, cG-L and rG-L were determined in various
cancer cell lines (e.g. CT26, LS174T, 9L and PC-3 cells) by XTT assay. Briefly, cells
were detached using trypsin, re-suspended in complete medium and then dispensed into
96-well plates at a density of 104
cells per well. After incubation for 24 hr, gelonin
samples were added to the wells at varying final concentrations (10-10
- 10-5
M) and
incubated for 48 hr. Relative cell proliferation was measured by XTT assay following the
vendor’s protocol (Roche Applied Science, Indianapolis IN).
2.3.10 In Vivo Evaluation of Inhibition on Tumor Growth by rG-L
Six-week-old male athymic nude mice with an average weight ranging from 22 -
25 g were purchased from Charles River Laboratories (Raleigh, NC). These mice were
housed in animal facilities and fed with standard chow diet. Three days after arrival, mice
were randomly divided into 5 groups and treated, separately, with: 1) PBS; 2) rGel
(injected dose: 20 µg); 3) rG-L (2 µg); 4) rG-L (4 µg); and 5) rG-L (20 µg). Animal
experiments were conducted according to protocols approved by the University of
Michigan Committee on Use and Care of Animals (UCUCA; protocol No. 08945).
Briefly, at day 0 (3 days after arrival of animals), CT26 cells were harvested and
implanted to the left hind region of the mice leg (5×10⁶
cells in 50 µL). Test samples
were administered by intra-tumor injection on day 7, when the tumor size reached about
100 mm3, and also on day 10. Tumor size was measured daily with a vernier caliper and
the tumor volume (mm3) was calculated as V = (a
2 x b)/2, where a is the width and b is
the length of the tumor 29
.

22
2.3.11 Statistical Analysis
All data were presented as mean ± standard deviation. Statistically significant
differences among groups were determined using the one-way ANOVA and Tukey’s
multiple comparison test as post-hoc test (Prism version 5.0, GraphPad, San Diego, CA).
Results that yielded p-values less than 0.05 were considered to be statistically significant.
2.4 Results
2.4.1 Expression and Purification of Recombinant Gelonin (rGel)
The rGel protein with N-terminal 6x His tag was successfully over-expressed as a
soluble protein from E.coli and purified using a Ni-NTA metal affinity column. rGel,
which selectively bound to the resin via the 6x His tag, was eluted with 400 mM
imidazole. When the eluent was further loaded onto a cation exchange column (CM-FF
HP column), rGel was found being retained in the column, presumably due to its basic
nature (pI = 9.1), and was later eluted as a single peak using 0.4 M NaCl. According to
the results (data not shown) from densitometry analysis of the SDS-PAGE gels, the
average purity of rGel was > 95%. The total amount of expressed rGel in a 5-L culture, as
determined by the BCA protein assay, was estimated to be approximately 5 mg (i.e. ~1
mg/L culture).
2.4.2 Synthesis and Purification of Chemically-Conjugated Gelonin-LMWP (cG-
L)
The cG-L was successfully synthesized by coupling rGel with LMWP via a
disulfide bond. Results from the Ellman’s assay indicated that an average of 6 active thiol

23
groups was introduced to each rGel molecule activated by the Traut’s reagent. On the
other hand, one thiol-active PDP group was introduced to each LMWP molecule through
conjugation with NHS-PEG-PDP. Since PEG itself did not have a strong affinity for
heparin, unreacted PEG could be readily removed by passing the reaction mixture
through a heparin column. Results from the P2T assay showed that approximately 40% of
the LMWP eluent from the heparin column contained PEG. Although non-reacted
LMWP could also be present in this LMWP fraction, no further purification was deemed
necessary, simply because these LMWP molecules lacked the reactive PDP groups and
thus would not interact with the above activated rGel. After activation of both rGel and
LMWP, disulfide bonds were allowed to form between the thiol groups on rGel and the
PDP group on LMWP, yielding the ultimate cG-L chemical conjugates.
After synthesis, the cG-L conjugate was purified using a heparin column. An
initial major peak correlating to the elution of rGel was found to come out at 0.4 M NaCl,
with a retention time of 5 min (data not shown). A second major peak representing the
cG-L conjugate was eluted at above 1 M NaCl and a significantly extended retention time
(~ 70 min), presumably due to presence of the heparin-binding LMWP moiety in the
conjugate.
Successful synthesis and purification of cG-L was further confirmed by SDS-
PAGE. As seen in Figure 3, whereas the unreacted rGel was visible as a single band at
the position corresponding to the molecular weight of gelonin (~ 31 kDa; Lane 1), the
cG-L conjugate produced multiple bands with molecular weights slightly higher than that
of gelonin under non-reducing condition (Lane 2). Assessment from the molecular weight
distribution of these bands suggested the presence of a heterogeneous mixture in the final

24
cG-L product containing 2 to 5 LMWP peptides per gelonin molecule. The disulfide
linkage between LMWP and rGel in the cG-L conjugate was also confirmed by
comparison of the gel results under reducing (Lane 2R) and non-reducing conditions
(Lane 2NR). In the presence of reducing agent, DTT, the disulfide bond between rGel
and LMWP was detached and, as a consequence, a single band corresponding to the size
of gelonin (31 kDa) was again observed. The yield of the final cG-L product prepared by
chemical synthesis was about 35% (3.5 mg cG-L from initially 10 mg rGel).
2.4.3 Expression and Purification of the Recombinant Gelonin-LMWP Chimera
(rG-L)
Successful preparation of pET28a-Gel-LMWP and pET-Gel-LMWP (pET22b-
TRX-Gel-LMWP) vectors containing the gelonin-LMWP gene was confirmed by DNA
sequencing analysis. Test expression of rG-L using the pET28a-Gel-LMWP vector in a
small culture displayed very low levels of rG-L, with no soluble protein being observed.
In contrast, the pET-Gel-LMWP vector produced obvious expression of rG-L, with a
significant portion being identified as soluble proteins (data not shown). The pET-Gel-
LMWP vector was therefore selected for the subsequent large scale expression of rG-L.
The gelonin-LMWP fusion protein containing N-terminal thioredoxin-6x His tag
(TRX-Gel-LMWP) was produced as soluble protein from E.coli in a 5 L culture, and was
purified using a Ni-NTA column and eluted with imidazole (400 mM). As shown in the
SDS-PAGE (Figure 4), the TRX-Gel-LMWP recombinant protein was clearly identified
by the presence of an intense band at 44 kDa (Lane E). Following incubation with the
TEV protease, the thioredoxin-6xHis tag was clearly removed, as displayed by the
appearance of the 31-kDa band in Lane T of Figure 4.

25
The rG-L protein chimera was further purified using a heparin column, and the
elution profile was presented in Figure 5A. As seen, three major peaks were observed.
Anionic (Fraction 1) and slightly cationic (Fraction 2) endogenous bacterial proteins that
bound nonspecifically to the Ni-NTA resins and came out with TRX-Gel-LMWP were
eluted at 0 and 0.1 M NaCl, respectively. The rG-L product was eluted as a single peak
(Fraction 3) at 0.9 M NaCl and with the longest retention time (47 min), presumably due
to the presence of the heparin-binding LMWP moiety in the conjugate. Results from
SDS-PAGE on these elution fractions were consistent with the above findings (Figure
5B). As shown, Fraction 1 and 2 in Figure 5A displayed multiple bands representing
various sizes of bacterial endogenous proteins, while the Fraction 3 in Figure 5A yielded
a single band with a MW of 31 kDa. According to densitometry analysis of the gel bands,
the purity of rG-L was above 95%. The total yield of rG-L from a 5 L cell culture was
about 1.5 mg.
2.4.4 Inhibition of Protein Translation by cG-L and rG-L
The potency of nGel (Enzo Life Sciences Inc), rGel, cG-L and rG-L on the
inhibition of protein translation were examined in a cell-free translational system. In the
absence of actual cells, all of the four gelonin samples displayed almost identical
inhibition profiles of protein translation (Figure 6). The IC50 values calculated from these
inhibition profiles were summarized in Table 1. Again, no statistically significant
differences among the four gelonin samples were observed. It should be noted the IC50
value of rGel determined from our experiments was in good accordance to that reported
by Hossann et al.28
These results demonstrated that neither chemical conjugation nor
26
biological insertion of LMWP to gelonin would alter the N-glycosidase activity of
gelonin on its inhibition of protein translation in a cell-free system.
2.4.5 Cellular Uptake of cG-L and rG-L
Cell-internalizing function of r-Gel, cG-L and rG-L was examined by uptake
studies in CT26 cells utilizing rhodamine-labeled gelonin samples. Figure 7 depicted the
fluorescence microscopy images taken after incubation of CT26 cells with the gelonin
samples and Hoechst 33342 counter-stain solution. While only minimal fluorescence
intensity was observed in rGel-treated cells (Figure 7A), strong fluorescence signals were
clearly visible inside the cells that were treated either with cG-L or rG-L (Figure 7B and
7C, respectively). Moreover, the merged images in Figure 7B and 7C suggested an even
distribution of cG-L and rG-L throughout the entire cell, rather than being confined in
certain specific sub-cellular compartments such as endosomes.
2.4.6 Cell Culture Analyses of the Anti-Tumor Activity of cG-L and rG-L
To evaluate whether LMWP-mediated cell internalization would enhance the
cytotoxic effects of gelonin, the rGel, cG-L and rG-L samples were tested against four
different cancer cell lines (CT26, LS174T, 9L and PC-3). As seen in Figure 8, against the
four cancer cell lines tested, rGel displayed cytotoxic effects only at concentrations above
the micro-molar level. This toxicity may be attributed to the uptake of gelonin via fluid
phase pinocytosis.11, 30
In a sharp contrast, both cG-L and rG-L yielded significantly
magnified cytotoxicity against all of the tested cancer cell lines. The IC50 values,
estimated from the curves in Figure 8 and summarized in Table 2, were in full agreement
with the above findings. As seen, the IC50 values of both cG-L and rG-L were about 20-
to 120-fold lower than that of r-Gel against the four tested cancer cell lines. It is

27
interesting to note that there was basically no significant difference in cytotoxicity
between cG-L and rG-L across all of the tested cancer cell lines.
2.4.7 In Vivo Evaluation of the Inhibition on Tumor Growth by rG-L
Preliminary animal studies using the CT26 s.c. xenograft tumor model were
conducted to assess the in vivo cytotoxic effects of the rG-L protein chimera. To limit
other pharmacokinetic factors, intra-tumor injection was selected for drug administration.
As illustrated in Figure 9, mice treated with 20 µg rGel displayed a slight (14%)
reduction in the measured tumor size at day 17, when comparing with the control of PBS-
treated animals. As described earlier, this minor cytotoxic effect by the cell-impermeable
rGel was probably attributed to gelonin’s uptake via the fluid phase pinocytosis
mechanism.11, 30
In sharp contrast, animals treated with 2, 4 or 20 µg of rG-L, exhibited
significant, dose-dependent inhibition on tumor growth, with the measured tumor size
being reduced considerably by 58, 80 and 86%, respectively. These finding provided a
“proof-of-concept” to our hypothesis that incorporation of the cell-penetrating LMWP
would significantly augment the anti-tumor effects of gelonin.
2.5 Discussion
While macromolecular drugs have drawn significant recognition as the next
generation of anticancer agents due to their unmatched reaction efficiency and the
repetitive mode of action, their inability to cross the membrane barrier of tumor cells
remains as a bottleneck challenge to potential clinical applications, as most of the
machineries for tumor cytotoxicity are present in the cell cytosol. In this study, we made
a rational hypothesis that modification of the macromolecular drug, such as the protein

28
toxin gelonin, with the non-toxic cell-penetrating peptide LMWP would enable the
transduction of gelonin into tumor cells, thereby drastically augmenting its anti-tumor
efficacy in vivo. To prove this concept, gelonin-LMWP conjugates were synthesized via
both chemical conjugation and recombinant methods (the products were termed as cG-L
and rG-L, respectively). Although both conjugation methods proved feasible, they both
possessed several advantages and pitfalls. For chemical conjugation, one of the benefits
was that LMWP and gelonin were linked with a disulfide bond that would be
automatically cleaved once entering the cells, due to the presence of a reducing condition
in the cytosol by the elevated concentrations of glutathione and reductase.31
Detachment
of LMWP from gelonin would allow the delivered gelonin to be entrapped in the cytosol,
eliminating the possibility of trafficking into the nucleus, which was reported to be the
destiny of many CPPs.32-34
The other benefit was that, although remained unproven,
many investigators were speculating that the CPP-mediated protein translocation was a
reversible process, implicating the probability that the ferried protein cargos could be
fluxed back from the cells. The use of a cytosol-cleavable disulfide bond would alleviate
this concern.
The primary drawback from chemical conjugation was that the final cG-L product
was a mixture of gelonin conjugates containing various numbers of LMWPs per gelonin
molecule; as demonstrated by our SDS-PAGE results in Figure 3. Although many studies
reported that a single CPP was sufficient to transduce a large protein into cells,35, 36
it was
nevertheless postulated that extra CPP chains on the protein cargo might increase the
extent of cell transduction. Hence, the heterogeneous nature of the chemically
synthesized cG-L conjugates would not only affect the batch-to-batch reproducibility of

29
the product, but also the uptake results of these conjugates. In addition, chemical
synthesis practically was not really suitable for mass production of the conjugates,
therefore hindering its potential for clinical applications.
On the contrary, the benefits and shortcomings of the recombinant approach were
exactly the opposite to those of the chemical conjugation method. Recombinant
engineering would allow synthesis of a homogeneous 1:1 gelonin-LMWP protein
chimera, and also expression of rG-L from E.coli was one of the most efficient and
economic means for recombinant production of heterologous proteins, thereby being
suitable for mass-scale production; both were the pitfalls of the chemical method.
However, recombinant engineering lacked the ability to create a protein chimera through
the disulfide linkage, thereby being unable to enjoy the afore-mentioned benefits of the
chemical method resulting from formation of the cytosol-cleavable –S-S- bond between
gelonin and LMWP.
For chemical synthesis of the gelonin-LMWP conjugate, two criteria must be met
concerning the selection of a cross-linking method: 1) preservation of gelonin activity
after conjugation, and 2) external-exposure of LMWP on the conjugate thereby fully
retaining it cell-penetrating activity. Herein we selected the Traut’s reagent to achieve
thiol-activation of the gelonin molecule because, when comparing with other
conventional activating agents to produce a reactive –SH group, such as N-succinimidyl
3-(2-pyridyldithio)-propionate) (SPDP), N-succinimidyl iodoacetate, or 4-
(iodoacetamido)-l-cyclohexenyl-1,2-dicarboxylic acid anhydride), etc., the Traut’s
reagent was reported to not impair gelonin’s biological activity.37, 38
In addition, the good
aqueous solubility and slow hydrolysis rate (half-life: 1 hour in 50mM triethanolamine

30
buffer at pH 8) of the Traut’s reagent rendered it a more favorable choice.39
As shown
from our results in Section 3.2., thiol groups were successfully introduced to gelonin
using the Traut’s reagent, as confirmed by the Ellman’s assay.40
Alternatively, to ensure
an external exposure of LMWP, a short PEG chain containing heterobifunctional
activated groups on both ends was employed as the cross-linker to produce the cG-L
conjugate. Our results on the binding of cG-L to the heparin column (Section 3.2) indeed
confirmed the exposure of LMWP on cG-L after chemical conjugation. Most
importantly, SDS-PAGE findings in Figure 3 clearly demonstrated the formation of a
disulfide linkage between gelonin and LMWP.
Regarding recombinant synthesis, LMWP gene was initially inserted to the C-
terminus of the gelonin-encoding gene (pET-Gel vector) to produce the pET28a-Gel-
LMWP vector. Despite that rGel was successfully expressed using this vector, there was
almost no expression of the rG-L conjugate under tested conditions. This poor expression
of rG-L was likely due to inefficient translation of the LMWP gene caused by codon
usage bias, a finding previously reported by Lee and other investigators.33, 41
Indeed,
LMWP was known to consist of abundant arginine residues that was translated by the
rarest codons in E.coli,33
hence severely limiting its expression level. To this regard, the
poor translation of LMWP appeared to significantly impair the overall expression of the
ultimate rG-L chimera. On the other hand, the use of the BL21-CodonPlus E.coli strain,
which contained extra copies of genes encoding the tRNAs for rare amino acids, also did
not provide any enhancement on rG-L expression.
Aside from the low expression, the low solubility of rG-L also presented a
concern. When eukaryotic proteins were expressed by prokaryotic E.coli cells, improper

31
folding of proteins often occurred, resulting in insoluble aggregates called inclusion
bodies.42, 43
This seemed to be the major hurdle that must be overcome in order to
succeed in the production of rG-L, since the total expression level of rG-L was already
very low. A strategy often used to improve the expression of so-called “difficult-to-
produce” proteins was by inclusion and co-expression of a highly expressible fusion
partner. Thioredoxin (TRX), for instance, was a small 12-kDa redox protein known for its
extraordinary high level of expression (up to 40% of total cellular proteins) and high
solubility could thus be conferred to fused proteins.42
Based on this principle, we inserted
the full length gelonin-LMWP gene into the pET-TRX vector to create the pET-Gel-
LMWP vector (PET22b-TRX-Gel-LMWP) that also contained the TRX gene (Figure 2).
Results from Figure 3 clearly demonstrated the plausibility of this strategy, as the
thioredoxin-6xHis tag-gelonin-LMWP fusion protein (TRX-Gel-LMWP) was
successfully over-expressed and produced in large quantities as a soluble protein in
E.coli.
Maintenance of the functions of both cG-L and rG-L to inhibit protein translation
was a major initial concern, since it was demonstrated in the literature that even a slight
conformational change of the 3-D structure could result in a significant alteration on the
biological activities of proteins.44, 45
Notably, data obtained using a cell-free translational
system confirmed that all of the rGel, cG-L and rG-L products possessed activities
equivalent to that of the commercial native gelonin (nGel), displaying no significant
difference in the measured IC50 values. Although the rGel results were somewhat
expected, it was a little surprising to notice that there was virtually no loss in activity for
both the cG-L and rG-L chimeras. Nevertheless, gelonin was known to be extremely

32
stable due to its specific structure,46-48
which consequently could contribute to the
retention of its activity even after modification with LMWP.
While the results showing retention of the biological activity of both cG-L and
rG-L was truly encouraging, intracellular transport of gelonin was also required to enable
it access to the ribosomes of cancer cells. With the incorporation of the cell-penetrating
LMWP peptide, fluorescence microscopy data in Figure 7 clearly demonstrated that both
cG-L and rG-L were able to internalize cells, while little, if any, of the impermeable rGel
was found inside the cytosol of the test tumor cells. More importantly, the transduced cG-
L and rG-L appeared to be evenly distributed within the cytosol, enabling them to
maximize their cytotoxic effects. Comparison of the IC50 values of both cG-L (32 - 113.4
nM) and rG-L (55.4 - 95.4 nM) with that of rGel (1630 - 5870 nM) summarized in Table
1 yielded a solid support to our initial crucial hypothesis that modification of gelonin with
LMWP would lead to a much improved anti-tumor activity. Also of significance was that
this greatly enhanced cytotoxic activity of gelonin appeared to be indiscriminative to
cancer types, as all of the four tested cancer cell lines yielded similar responses. This
phenomenon may be accounted for in terms of the universal cell transduction mechanism
of most CPPs, which, in principal and practice, suggests that all cell types including brain
cells and erythrocytes are tranducible.19, 23, 49
Also noteworthy was that both cG-L and
rG-L yielded almost identical cytotoxic activities toward cancer cells. This was somewhat
unexpected, considering the fact that the two major factors affecting tumor-killing
capability of the LMWP-gelonin conjugates lied in the enzymatic activity and cell-
penetrating ability. Although the intrinsic activities to inhibit protein translation were
shown to be identical for cG-L and rG-L (Table 1), the cG-L conjugate actually

33
possessed a higher ratio of the CPP moieties (2-5 LMWP chains per gelonin molecule)
comparing to that (1 LMWP chain per gelonin molecule) of rG-L. This result seemed to
suggest that one well-exposed LMWP would be sufficient to effectively facilitate the cell
entry of gelonin; consistent with findings reported by other investigators.20, 23, 33
Albeit that cG-L and rG-L exhibited equivalent IC50 values and equally promising
in vitro cell culture cytotoxicity, rG-L was nevertheless selected for subsequent
preliminary animal studies, simply because of its homogeneity, batch-to-batch
manufacturing consistency, and, most critically, the possibility for mass production to
satisfy the need of large quantities for animal investigation. In a CT26 xenograft tumor
mice model, the rG-L product displayed a significantly enhanced tumoricidal activity of
over controls administered with either PBS solution or non-modified gelonin (i.e. rGel).
A dose-dependent reduction on tumor growth was observed for rG-L, with a total gelonin
dose being as low as only 2 µg. On the contrary, non-modified rGel displayed virtually
no effect on tumor growth, even at a total gelonin dose of 20 µg. Previously, Park et al.
reported, by using the same animal tumor model, that intra-tumoral administration of
gelonin at a dose as high as 100 µg did not yield visible reduction on tumor size.20
Overall, both in vitro and in vivo findings provided strong evidence to support our
hypothesis, i.e. modification of gelonin with the cell-penetrating LMWP would
drastically enhance gelonin’s clinical potential for cancer treatment.
2.6 Conclusions
Despite decades of efforts, a cure to the vast majority of cancers remains elusive.
Highly potent and specific macromolecular drugs have shown promise to overcome the

34
limitations of traditional small molecule drugs. Effective intracellular delivery of these
large drugs, however, continues to be the main hurdle to clinical realization of these
drugs. Recent discovery of the cell-penetrating peptides offers hope to finally solve this
intracellular delivery problem. In this study, we reported the “first” synthesis, via both
chemical conjugation and genetic engineering methods, of gelonin modified with a potent
yet non-toxic cell-penetrating peptide, LMWP. A novel coupling method based on the
use of the Traut’s reagent and a heterobifunctional PEG cross-linker was developed to
synthesize the chemical gelonin-LMWP conjugate (cG-L), whereas an innovative
strategy based on the incorporation co-expression of a highly expressible fusion partner,
thioredoxin (TRX), was adopted to produce the recombinant gelonin-LMWP (rG-L)
protein chimera containing the “difficult-to-produce” LMWP sequence with abundant
arginine residues, the rarest codons in E. coli. In vitro cell culture studies revealed that
cG-L and rG-L not only retained the protein translation-inhibiting activity and cell-
penetrating capability, but also yielded 20- to 120-fold lower IC50 values than that of the
unmodified recombinant gelonin (r-Gel). Preliminary in vivo studies using a xenograft
tumor mouse model showed that while intra-tumor injection of the cell-impermeable r-
Gel resulted in virtually no inhibition on tumor growth, both of the LMWP- modified
gelonin conjugates exhibited significantly enhanced anti-tumor cytotoxic effects. Overall,
our investigation shed light on the possibility to realize clinical application of the potent
protein toxin drugs for cancer treatment.

35
2.7 Tables
Table 2-1. Summary of the IC50 values of nGel, rGel, cG-L and rG-L for inhibition of
protein translation in cell-free translational system
Samples IC50 a
nGel 15.0 ± 3.4 (-1.6)
rGel 14.4 ± 3.6 (-1.8)
cG-L 13.5 ± 4.9 (-1.7)
rG-L 12.9 ± 3.1 (-1.5)
aConcentration for half inhibition of luciferase translation (IC50), calculated by applying
nonlinear regression model using Prism software (GraphPad), are displayed as pM. The
Hill slope is shown in the parenthesis behind the IC50. For all experiments, N=3. (nGel:
native gelonin, rGel: recombinant gelonin, cG-L: chemically modified gelonin-LMWP,
rG-L: genetically modified gelonin-LMWP)
Table 2-2. Cytotoxicity levels (IC50) of rGel, cG-L and rG-L in various cancer cell lines
(CT 26, LS174T, 9L and PC-3)
Samples CT 26 a LS174T
a 9L
a PC-3
a
RGel 1630 ± 500 5870 ± 1000 3100 ± 400 3400 ± 1000
cG-L 37.3 ± 15.7***
123 ± 27***
106 ± 23***
57.8 ± 23.4**
rG-L 79.1 ± 21.4***
67.8 ± 13.7***
61.3 ± 12.2***
83.6 ± 28.3**
aIC50 values are displayed as nM. **P< 0.001, ***P < 0.0001. For all experiments, N=3.
(rGel: recombinant gelonin, cG-L:chemically modified gelonin-LMWP, rG-L:
genetically modified gelonin-LMWP)

36
2.8 Figures
Figure 2-1. Scheme of gelonin-LMWP chemical conjugation via a disulfide bond using
heterobifunctional PEG as the cross-linker. (rGel: recombinant gelonin, cG-L: chemically
modified gelonin-LMWP).

37
Figure 2-2. Schematic design of (A) pET-Gel-LMWP vector, and (B) image of rGel,
TRX-Gel-LMWP and rG-L.
The pET-Gel-LMWP vector was constructed by inserting the full sequence of gelonin-
LMWP gene into the pET-22b vector containing thioredoxin-6xHis tag and TEVp gene.
(rGel: recombinant gelonin, TRX-Gel-LMWP: thioredoxin-6xHis tagged gelonin-LMWP,
rG-L: genetically modified gelonin-LMWP, TEVp: TEV protease cleavable peptide).

38
Figure 2-3. SDS-PAGE results of cG-L purified by a heparin column.
Lane 1: 1st elution peak fraction, Lane M: markers of the protein molecular weight
standard (Invitrogen), Lane 2: 2nd
elution peak fraction (NR: non-reducing condition, R:
reducing condition). Recombinant gelonin migrated at its expected molecular weight of
31 kDa whereas cG-L migrated at higher molecular weight under non-reducing (NR)
conditions; suggesting approximately 2 - 5 LMWP molecules were conjugated to each
recombinant gelonin. Disulfide bond formation between recombinant gelonin and
LMWP-PEG-PDP was confirmed by the size reduction of cG-L to gelonin size under
reducing (R) conditions. (rGel: recombinant gelonin, cG-L: chemically modified gelonin-
LMWP).

39
Figure 2-4. SDS-PAGE results of the Ni-NTA column purification of rG-L.
Lane M: markers of the protein molecular weight standard (Invitrogen), Lane L:
supernatant fraction of the cell lysate. Lane FT: flow through fraction. Lane W: wash
fraction. Lane E: elution fraction representing TRX-Gel-LMWP. Lane T: elution fraction
after incubation with TEV protease. TRX-Gel-LMWP overexpression was confirmed
from the intense band (MW: 44 kDa) in Lane E, and TEV protease cleavage of TRX was
observed by appearance of the band (MW 31 kDa) in Lane T. (rG-L: genetically
modified gelonin-LMWP, TRX-Gel-LMWP: thioredoxin-6xHis tagged gelonin-LMWP).

40
Figure 2-5. Purification of the recombinant gelonin-LMWP (rG-L) conjugate by a
heparin column.
The cell monolayer without Eluent from the Ni-NTA column containing TRX-Gel-
LMWP was incubated with TEV protease to cleave the thioredoxin-6xHis tag and then
loaded onto a heparin column. (A). Elution profile from the heparin column using a NaCl

41
salt gradient from 0 to 1.4 M (red line). Three major fractions labeled as Peak 1 - 3 eluted
at 0, 0.1 and 0.9 M NaCl (with retention time of 2, 15 and 47 min, respectively) were
observed; (B) SDS-PAGE analysis of the fractions from the heparin column. Lane M:
markers of the protein molecular weight standard (Invitrogen). Lane 1, 2, and 3
represented results from the three peak fractions (1, 2, and 3, respectively) in (A). Results
showed that rG-L was eluted from the 3rd
peak at 0.9 M NaCl.
Figure 2-6. Inhibition of protein translation by native (commercial) Gel (nGel; circle),
recombinant gelonin (rGel; square), chemical gelonin-LMWP (cG-L; cross) conjugate, or
recombinant gelonin-LMWP (rG-L; triangle) conjugate using a cell-free translational
system and luciferase as the marker.
The quantity of the translated luciferase was measured by the chemiluminescent assay
(Promega) (N=3). The curves were fitted by applying the nonlinear regression model to
the plots using Prism software (GraphPad).

42
Figure 2-7. LMWP-mediated cellular uptake by tumor cells of: (A) recombinant gelonin
(rGel), (B) chemical gelonin-LMWP (cG-L) conjugate, and (C) recombinant gelonin-
LMWP (rG-L) conjugate.
CT26 cells were treated with rhodamine-labeled gelonin samples for 3 hrs at 37°C in 5%
CO2 humidified incubator. After stringent wash with 10 mg/mL heparin/PBS solution,
nuclei were counter-stained with Hoechst 33342. Images of the cells were captured by
different channels (brightfield (gray), Hoechst 33342 (blue) and rhodamine (gold)) by
Nikon epifluorescence microscope. Merged images were obtained by overlapping images
taken with Hoechst 33342 and rhodamine channels.

43
Figure 2-8. Cytotoxic effect of recombinant gelonin (rGel), chemical gelonin-LMWP
(cG-L) conjugate, and recombinant gelonin-LMWP (rG-L) conjugate against (A) CT26,
(B) LS174T, (C) 9L and (D) PC-3 cell lines.
Cells were plated onto 96 well plates (104 cells/well) and cytotoxicity was measured
using the XTT assay (N=3). Both cG-L and rG-L displayed significantly higher
cytotoxicity against all of the tested cancer cell lines than that of rGel, confirming the
event of LMWP-mediated uptake in tumor cells.

44
Figure 2-9. Inhibition of tumor growth by intra-tumor injection of PBS solution (control;
diamond), recombinant gelonin (rGel; cross) and 2 µg (triangle), 4 µg (square), or 20 µg
(circle) of recombinant gelonin-LMWP (rG-L) conjugate in a CT26 s.c. xenograft tumor
mouse model (N=5).
Treatment was carried out at Day 7 and 10 after tumor implantation. Tumor size was
measured daily using a vernier caliper right after tumor inoculation (Day 0). Tumor
volume (mm3) was calculated by using the following equation: V = (a
2xb)/2, where a
represented the width and b represented the length of the tumor.

45
2.9 References
1. Blagosklonny MV. The power of chemotherapeutic engineering: arresting cell
cycle and suppressing senescence to protect from mitotic inhibitors. Cell Cycle
2011;10:2295-8.
2. Kreitman RJ. Immunotoxins. Expert Opin Pharmacother 2000;1:1117-29.
3. Devi GR. siRNA-based approaches in cancer therapy. Cancer Gene Ther
2006;13:819-29.
4. Adams GP, Weiner LM. Monoclonal antibody therapy of cancer. Nat
Biotechnol 2005;23:1147-57.
5. Foged C, Nielsen HM. Cell-penetrating peptides for drug delivery across
membrane barriers. Expert Opin Drug Deliv 2008;5:105-17.
6. Snyder EL, Dowdy SF. Cell penetrating peptides in drug delivery. Pharm Res
2004;21:389-93.
7. Stirpe F. On the action of ribosome-inactivating proteins: are plant ribosomes
species-specific? Biochem J 1982;202:279-80.
8. Puri M, Kaur I, Perugini MA, Gupta RC. Ribosome-inactivating proteins:
current status and biomedical applications. Drug Discov Today 2012;17:774-83.
9. Stirpe F. Ribosome-inactivating proteins. Toxicon 2004;44:371-83.
10. Tumer NE, Li XP. Interaction of ricin and Shiga toxins with ribosomes. Curr
Top Microbiol Immunol 2012;357:1-18.
11. Stirpe F, Olsnes S, Pihl A. Gelonin, a new inhibitor of protein synthesis,
nontoxic to intact cells. Isolation, characterization, and preparation of cytotoxic
complexes with concanavalin A. J Biol Chem 1980;255:6947-53.
12. Atkinson SF, Bettinger T, Seymour LW, Behr JP, Ward CM. Conjugation of
folate via gelonin carbohydrate residues retains ribosomal-inactivating
properties of the toxin and permits targeting to folate receptor positive cells. J
Biol Chem 2001;276:27930-5.
13. Yamaizumi M, Mekada E, Uchida T, Okada Y. One molecule of diphtheria
toxin fragment A introduced into a cell can kill the cell. Cell 1978;15:245-50.
14. Frankel AD, Pabo CO. Cellular uptake of the tat protein from human
immunodeficiency virus. Cell 1988;55:1189-93.
15. Heitz F, Morris MC, Divita G. Twenty years of cell-penetrating peptides: from
molecular mechanisms to therapeutics. Br J Pharmacol 2009;157:195-206.
16. Koren E, Torchilin VP. Cell-penetrating peptides: breaking through to the other
side. Trends Mol Med 2012;18:385-93.
17. Magzoub M, Graslund A. Cell-penetrating peptides: [corrected] from inception
to application. Q Rev Biophys 2004;37:147-95.
18. Derossi D, Calvet S, Trembleau A, Brunissen A, Chassaing G, Prochiantz A.
Cell internalization of the third helix of the Antennapedia homeodomain is
receptor-independent. J Biol Chem 1996;271:18188-93.
19. Kwon YM, Li YT, Liang JF, Park YJ, Chang LC, Yang VC. PTD-modified
ATTEMPTS system for enhanced asparaginase therapy: a proof-of-concept
investigation. J Control Release 2008;130:252-8.

46
20. Park YJ, Chang LC, Liang JF, Moon C, Chung CP, Yang VC. Nontoxic
membrane translocation peptide from protamine, low molecular weight
protamine (LMWP), for enhanced intracellular protein delivery: in vitro and in
vivo study. FASEB J 2005;19:1555-7.
21. Choi JK, Jang JH, Jang WH, Kim J, Bae IH, Bae J, Park YH, Kim BJ, Lim KM,
Park JW. The effect of epidermal growth factor (EGF) conjugated with low-
molecular-weight protamine (LMWP) on wound healing of the skin.
Biomaterials 2012;33:8579-90.
22. Xia H, Gao X, Gu G, Liu Z, Zeng N, Hu Q, Song Q, Yao L, Pang Z, Jiang X,
Chen J, Chen H. Low molecular weight protamine-functionalized nanoparticles
for drug delivery to the brain after intranasal administration. Biomaterials
2011;32:9888-98.
23. Kwon YM, Chung HS, Moon C, Yockman J, Park YJ, Gitlin SD, David AE,
Yang VC. L-Asparaginase encapsulated intact erythrocytes for treatment of
acute lymphoblastic leukemia (ALL). J Control Release 2009;139:182-9.
24. Park YS, Huang Y, Park YJ, David AE, White L, He H, Chung HS, Yang VC.
Specific down regulation of 3T3-L1 adipocyte differentiation by cell-permeable
antisense HIF1alpha-oligonucleotide. J Control Release 2010;144:82-90.
25. Chang LC, Lee HF, Yang Z, Yang VC. Low molecular weight protamine
(LMWP) as nontoxic heparin/low molecular weight heparin antidote (I):
preparation and characterization. AAPS PharmSci 2001;3:E17.
26. Chang LC, Liang JF, Lee HF, Lee LM, Yang VC. Low molecular weight
protamine (LMWP) as nontoxic heparin/low molecular weight heparin antidote
(II): in vitro evaluation of efficacy and toxicity. AAPS PharmSci 2001;3:E18.
27. Lee LM, Chang LC, Wrobleski S, Wakefield TW, Yang VC. Low molecular
weight protamine as nontoxic heparin/low molecular weight heparin antidote
(III): preliminary in vivo evaluation of efficacy and toxicity using a canine
model. AAPS PharmSci 2001;3:E19.
28. Hossann M, Li Z, Shi Y, Kreilinger U, Buttner J, Vogel PD, Yuan J, Wise JG,
Trommer WE. Novel immunotoxin: a fusion protein consisting of gelonin and
an acetylcholine receptor fragment as a potential immunotherapeutic agent for
the treatment of Myasthenia gravis. Protein Expr Purif 2006;46:73-84.
29. Urva SR, Yang VC, Balthasar JP. Physiologically based pharmacokinetic model
for T84.66: a monoclonal anti-CEA antibody. J Pharm Sci 2010;99:1582-600.
30. Madan S, Ghosh PC. Interaction of gelonin with macrophages: effect of
lysosomotropic amines. Exp Cell Res 1992;198:52-8.
31. Saito G, Swanson JA, Lee KD. Drug delivery strategy utilizing conjugation via
reversible disulfide linkages: role and site of cellular reducing activities. Adv
Drug Deliv Rev 2003;55:199-215.
32. Joliot A, Prochiantz A. Transduction peptides: from technology to physiology.
Nat Cell Biol 2004;6:189-96.
33. Lee TY, Park YS, Garcia GA, Sunahara RK, Woods JH, Yang VC. Cell
permeable cocaine esterases constructed by chemical conjugation and genetic
recombination. Mol Pharm 2012;9:1361-73.

47
34. Vives E, Brodin P, Lebleu B. A truncated HIV-1 Tat protein basic domain
rapidly translocates through the plasma membrane and accumulates in the cell
nucleus. J Biol Chem 1997;272:16010-7.
35. van den Berg A, Dowdy SF. Protein transduction domain delivery of therapeutic
macromolecules. Curr Opin Biotechnol 2011;22:888-93.
36. Mae M, Langel U. Cell-penetrating peptides as vectors for peptide, protein and
oligonucleotide delivery. Curr Opin Pharmacol 2006;6:509-14.
37. Lambert JM, Senter PD, Yau-Young A, Blattler WA, Goldmacher VS. Purified
immunotoxins that are reactive with human lymphoid cells. Monoclonal
antibodies conjugated to the ribosome-inactivating proteins gelonin and the
pokeweed antiviral proteins. J Biol Chem 1985;260:12035-41.
38. McIntyre GD, Scott CF, Jr., Ritz J, Blattler WA, Lambert JM. Preparation and
characterization of interleukin-2-gelonin conjugates made using different cross-
linking reagents. Bioconjug Chem 1994;5:88-97.
39. Traut RR, Bollen A, Sun TT, Hershey JW, Sundberg J, Pierce LR. Methyl 4-
mercaptobutyrimidate as a cleavable cross-linking reagent and its application to
the Escherichia coli 30S ribosome. Biochemistry 1973;12:3266-73.
40. Ellman GL. Tissue sulfhydryl groups. Arch Biochem Biophys 1959;82:70-7.
41. Kane JF. Effects of rare codon clusters on high-level expression of heterologous
proteins in Escherichia coli. Curr Opin Biotechnol 1995;6:494-500.
42. LaVallie ER, DiBlasio-Smith EA, Collins-Racie LA, Lu Z, McCoy JM.
Thioredoxin and related proteins as multifunctional fusion tags for soluble
expression in E. coli. Methods Mol Biol 2003;205:119-40.
43. Singh SM, Panda AK. Solubilization and refolding of bacterial inclusion body
proteins. J Biosci Bioeng 2005;99:303-10.
44. Ebert RF, Spryn LA. Immunotoxin construction with a ribosome-inactivating
protein from barley. Bioconjug Chem 1990;1:331-6.
45. Battelli MG, Barbieri L, Stirpe F. Toxicity of, and histological lesions caused by,
ribosome-inactivating proteins, their IgG-conjugates, and their homopolymers.
APMIS 1990;98:585-93.
46. Hosur MV, Nair B, Satyamurthy P, Misquith S, Surolia A, Kannan KK. X-ray
structure of gelonin at 1.8 A resolution. J Mol Biol 1995;250:368-80.
47. Mujoo K, Cheung L, Murray JL, Rosenblum MG. Pharmacokinetics, tissue
distribution, and in vivo antitumor effects of the antimelanoma immunotoxin
ZME-gelonin. Cancer Immunol Immunother 1995;40:339-45.
48. Li Z, Qu Y, Li H, Yuan J. Truncations of gelonin lead to a reduction in its
cytotoxicity. Toxicology 2007;231:129-36.
49. Goncalves E, Kitas E, Seelig J. Binding of oligoarginine to membrane lipids and
heparan sulfate: structural and thermodynamic characterization of a cell-
penetrating peptide. Biochemistry 2005;44:2692-702.

48
Chapter 3
Heparin/Protamine-Mediated Regulation on Cell Transduction
of CPP-Modified Gelonin
3.1 Abstract
Therapeutically relevant macromolecules, such as gelonin toxin, are highly
desirable anti-cancer drugs due to their unparalleled reaction efficiency and substrate
specificity. Nevertheless, there are two key hurdles to be overcome for their successful
use in cancer therapy. The first is the membrane barrier that only allows the permeation
of small molecules into cells. The other is the lack of tumor-selective drug actions, which
leads to toxic side effects. The recent discovery of cell-penetrating peptides (CPP) that
possess potent transmembrane activity provides an effective strategy to solve the first
problem, but it aggravates the second problem of unwanted toxicity due to the increased
yet nonspecific cell penetration ability. Herein we developed a CPP-modified
ATTEMPTS system to solve both problems. First, TAT-gelonin fusion protein (TAT-
Gel) was engineered via genetic recombination method and its anti-cancer activity was
characterized in vitro. This TAT-Gel exhibited significantly greater cytotoxic effects with
average half maximal inhibitory concentration (IC50) of 22.6 nM, showing 2 to 3 orders
of magnitude lower than rGel (avg. IC50: 4633 nM). Next, the TAT-Gel was incorporated

49
into the modified ATTEMPTS, a heparin/protamine based-DDS, for tumor-selective
delivery. TAT-mediated translocation was curbed due to the heparin-TAT interaction,
and restored by addition of protamine. Our in vitro findings validate the applicability of
heparin/protamine-based regulation of cell internalization of TAT-Gel. Moreover, the
feasibility of this strategy is demonstrated using an LS174T xenograft tumor mouse
model.
3.2 Introduction
CPP-mediated intracellular delivery has emerged as a prominent strategy for
protein drugs in the recent decade. As a case in point, TAT, through cellular and animal
studies, has been well demonstrated of its ability to translocate various cargos (e.g.,
peptides, proteins, genes or nanoparticles) into different types of cells in our lab as well
as other groups.1, 2
To this regard, the TAT is considered a highly desirable carrier for
gelonin delivery into tumor cells. However, the other side of the coin is the non-
selectivity of TAT-mediated cell penetration, causing unwanted drug exposure to normal
tissues and cells. The worse is that the TAT-mediated penetration appears to be too
violent to be site-specifically directed, as evidenced by the findings that an antibody with
conjugation of TAT lost its targeting ability but follow the non-selective penetration
pattern of the TAT.3 Therefore, to achieve tumor cell-specific penetration for protein
delivery is still a formidable challenge.4
To address the paradox of potent yet nonselective penetration feature of CPP and
its related potential toxicity, the CPP-modified ATTEMPTS (Antibody Targeted
Triggered Electrically Modified Prodrug-Type Strategy), a heparin/protamine-based drug

50
delivery system (DDS), has been recently developed by our laboratory.5, 6
Herein, we
engineered TAT-Gel via genetic recombination method and evaluated its potentials for
use as an anti-cancer drug. The applicability of the CPP-modified ATTEMPTS for TAT-
Gel delivery was then investigated both in vitro and in vivo utilizing heparin and
protamine.
3.3 Materials and Methods
3.3.1 Materials
The pET28a-Gel plasmid vector for the expression of rGel was a generous gift
from Dr. Wolfgang E. Trommer (University of Kaiserslautern, Germany).7 Kanamycin,
carbenicillin and isopropyl-β-thiogalactopyranoside (IPTG) were purchased from Fisher
Scientific (Pittsburg, PA). Heparin sulfate, protamine sulfate, rhodamine B isothiocyanate
and fluorescein isothiocyanate (FITC) were purchased from Sigma-Aldrich (St. Louis,
MO). Competent Escherichia coli (E.coli) strains (TOP10 and BL21star (DE3)), pEXP-
5-NT/TOPO TA expression kit, AcTEV™ protease, PBS (pH 7.4), Dulbecco's Modified
Eagle Medium (DMEM), fetal bovine serum albumin (FBS) and Hoechst 33342 were
purchased from Invitrogen (Carlsbad, CA). BCA protein assay kit was purchased from
Bio-Rad Laboratories (Hercules, CA). DNA primers were purchased from Integrated
DNA Technologies Inc. (Coralville, IA). DNA restriction enzymes (BamHI and XhoI)
and T4 DNA ligase were purchased from New England Biolabs (Ipswich, MA). Rabbit
reticulocyte lysate assay system, Luciferase assay system and recombinant RNasin®
ribonuclease inhibitor were purchased from Promega Corporation (Madison, WI). Cell
proliferation kit II (XTT) was purchased from Roche Applied Science (Indianapolis, IN).

51
3.3.2 Construction of the TAT-Gel Genes
For the expression of TAT-Gel with an N-terminal thioredoxin-6xHis tag (TRX-
TAT-Gel), the pET-TAT-Gel vector (pET21a-TRX-TAT-Gel) was prepared in two steps.
In the first step, the double-stranded DNA encompassing the full length of the TAT-Gel
encoding gene was constructed by PCR using the pET-Gel vector as a template. The
primers used for the PCR (TG-forward and TG-backward) are shown in Table 1. The
PCR product was purified by 1% agarose gel electrophoresis and inserted into the pEXP-
5-NT/TOPO TA vector following the vendor’s protocol (Invitrogen, Carlsbad, CA). The
TOPO-TA vector containing the TAT-Gel gene was then transformed into TOP10 E.coli
cells, and the prepared vector was submitted for DNA sequencing analysis. Next, the
pET-TAT-Gel vector was prepared by insertion of the TAT-Gel gene into the pET21a-
TRX vector (ProMab Biotechnologies, Inc., Richmond, CA) containing the thioredoxin
(TRX) gene. Prior to TAT-Gel gene insertion, genes encoding the TEV protease
cleavable peptide (TEVp), 6xHis and the BamHI restriction enzyme site were engineered
at the N-terminal of the TAT-Gel gene. Also, the XhoI restriction enzyme site was
generated at the C-terminal via PCR reactions. The PCR primers (pTG-forward-1 ~ 3 and
pTG-backward) are summarized in Table 1. The final PCR product for TAT-Gel was
double digested by restriction enzymes (BamHI and XhoI) and then inserted into the
pET21a-TRX vector. The prepared pET-TAT-Gel vector was submitted for DNA
sequencing analysis. The schematic design of the pET-TAT-Gel plasmid vector and the
schematic images of TRX-TAT-Gel, TAT-Gel and rGel are depicted in Figure 1.

52
3.3.3 Expression and Purification of TAT-Gel
For the expression of TRX-TAT-Gel, pET-TAT-Gel vector was transformed into
an E.coli strain. A single colony was picked from the pET-TAT-Gel vector transformed
BL21 (DE3), grown on an LB agar plate containing 50 µg/mL carbenicillin, and
inoculated into 200 mL LB medium (50 µg/mL carbenicillin). The starter culture was
incubated overnight at 37°C with shaking at 250 rpm and then diluted into 5 L fresh LB
medium. The large culture (5 L) was incubated under the same conditions and, when the
optical density at 600 nm reached 1, TRX-TAT-Gel expression was induced by the
addition of IPTG to a final concentration of 0.5 mM. The large culture was further
incubated for an additional 6 hr.
After expression of the TRX-TAT-Gel, the E.coli cells were harvested by
centrifugation at 4000 rpm for 20 min, then, re-dispersed in 30 mL of 20 mM PBS (300
mM NaCl, pH 7). The cells were lysed by sonication (4 × 30 seconds with 50% output in
ice) and the supernatant fraction containing the soluble TRX-TAT-Gel collected by
centrifugation (15,000 rpm for 30 min) was incubated with 2 mL of Ni-NTA resin
suspension (HisPure® Ni-NTA resin, Bio-Rad Laboratories, Hercules, CA). After
incubation for 2 hrs at 4ºC, the resins were washed with 200 mL of 20 mM PBS (300
mM NaCl, pH 7), and then, TRX-TAT-Gel was eluted with PBS containing imidazole
(20 mM PBS, 300 mM NaCl, 400 mM imidazole, pH 7).
To acquire TAT-Gel, the eluent containing TRX-TAT-Gel was incubated with
TEV protease to remove the thioredoxin-6xHis tag following the vendor’s protocol
(AcTEV™ protease, Invitrogen, Carlsbad, CA). Briefly, 150 µL of 20 × TEV protease
reaction buffer, 30 µL 0.1 M DTT and 300 units of AcTEV™ protease were added to 3

53
mL of TRX-TAT-Gel solution and incubated overnight (18 hr) at 4°C. The final TAT-
Gel product was obtained after heparin column purification (HiTrap Heparin HP, GE
Healthcare Bio-Sciences, Pittsburgh, PA) with a salt gradient elution (0 to 1.4 M NaCl at
a rate of 0.02 M/min, flow rate: 1 mL/min). The expression and purification of TAT-Gel
was monitored by SDS-PAGE in 10% Tris-HCl gel, and the purity was measured via
densitometry analysis of the observed bands using ImageJ software (National Institutes of
Health, Bethesda, MD). The protein concentration was determined based on BCA protein
assay using native gelonin as the standard.
3.3.4 Determination of TAT-Gel’s N-glycosidase Activity
The N-glycosidase activity of TAT-Gel was assessed in a cell-free translational
system using rabbit reticulocyte lysate assay system (Promega Corp., Madison, WI) with
modification of the protocol. Briefly, 5 µL of TAT-Gel or recombinant gelonin (rGel) (at
final concentration of 1 pM, 10 pM, 100 pM, 1 nM, 10 nM or 100 nM) was mixed with
35 µL of rabbit reticulocyte lysate, 1.4 µL of potassium chloride, 1 µL of amino acid
without methionine, 1 µL of amino acid without leucine, 1 µL of luciferase control
mRNA, 1 µL of RNasin® ribonuclease inhibitor and 4.6 µL of Mili-Q water (total
reaction volume: 50 µL). After incubation for 90 min at 30°C, luciferase translation from
each reaction was quantified by measuring the luciferase activity with the luciferase assay
system following the vendor’s protocol (Promega Corp., Madison WI). The IC50 of TAT-
Gel to inhibit luciferase translation was calculated by nonlinear regression using Prism
software (Prism version 5.0, Graphpad, CA).

54
3.3.5 Cell Culture
LS174T and HT116 human adenocarcinoma cells and Madin-Darby Canine
Kidney (MDCK) cells were purchased from American Type Culture Collection (ATCC,
Manassas, VA). The cells were cultured in 75 cm2 flasks and maintained in a humidified
CO2 incubator (5% CO2/95% air) at 37°C. The cells were cultured in Dulbecco’s
Modified Eagle Medium (DMEM) with 2 mM L-glutamine, high glucose, 1% (v/v)
penicillin-streptomycin, and 10% FBS. During the cultures, the culture media in the
flasks was replaced with fresh media every two days, and the cells were subcultured
when the confluency reached 90% by detaching with 0.25% trypsin-EDTA at a 1:3 split
ratio.
3.3.6 Evaluation of TAT-Gel Cell Internalization
TAT-mediated cell internalization was evaluated in a cell entry study using
confocal microscopy. For detection, rGel and TAT-Gel (2 mg/mL in 0.1 M bicarbonate
buffer, pH 9.0) were both labeled with a fluorescence dye by incubation with 5-fold
molar excess of rhodamine B isothiocyanate for 3 hr at room temperature. The unreacted
rhodamine was removed by loading the reaction solutions into a dye removal resin
following the vendor’s protocol (Bio-Rad, Hercules, CA). Successful rhodamine labeling
was determined by measuring the optical density at 280 nm and 520 nm for protein and
the dye, respectively.
LS174T cells were seeded onto an 8-well chambered coverglass (Nunc® Lab-Tek
II Chambered Coverglass, Thermo Scientific, Rockford, IL) at a density of 105 cells/well
and incubated for 24 hr in complete medium. When the cells were attached to the bottom
of the plates, rhodamine-labeled rGel and TAT-Gel were separately added to the cells and

55
incubated for 3 hr at 37°C in the humidified CO2 incubator. The cells were then washed
with a 10 mg/mL heparin/PBS solution once and with PBS three times. Images of the live
cells were taken with a Nikon A1R-A1 confocal laser microscope with a 60 × objective
(Nikon Instruments Inc., Melville, NY). The cell images were acquired and analyzed
using NIS-Elements Microscope Imaging software (Nikon Instruments Inc., Melville,
NY).
3.3.7 Assessment of TAT-Gel Anti-Tumor Activity
The anti-tumor activity of TAT-Gel was determined in various cell lines (e.g.,
LS174T and HCT116 human adenocarcinoma cells and non-cancerous MDCK cells)
using an XTT assay. Briefly, the cells were dispensed into 96-well plates at a density of
5x10³ cells per well, and when the cells were attached on the bottom of the plates, rGel
and TAT-Gel were separately added to the wells at different final concentrations (100 pM,
1 nM, 10 nM, 100 nM, 1 µM or 10 µM) (N=3). The cells were incubated with rGel or
TAT-Gel for 72 hrs, and the relative cell proliferation was measured using an XTT assay
following the vendor’s protocol (Roche Applied Science, Indianapolis IN). The IC50
values were calculated by nonlinear regression using Prism software (Prism version 5.0,
Graphpad, CA).
3.3.8 Evaluation of In Vitro Plasma Stability of TAT-Gel Binding to Heparin and
Protamine-induced Release of the TAT-Gel
TAT-Gel was labeled with a fluorescence dye by mixing the TAT-Gel (2 mg/mL
in 0.1 M bicarbonate buffer, pH 9.0) with 5-fold molar excess of fluorescein
isothiocyanate (FITC) and incubation for 4 hrs at room temperature. The unreacted FITC

56
was removed by loading the reaction solution into a dye removal resin (Bio-Rad,
Hercules CA).
The FITC-labeled TAT-Gel (200 µg/mL in PBS) was loaded in 50 µg aliquots
onto heparin bead slurries (Heparin HyperD®
M, Pall Corporation, Port Washington, NY;
50% (v/v) in PBS) pre-dispensed into separate eppendorf tubes (100 µL slurry per tube).
After incubation for 1 hr at room temperature, the unbound TAT-Gel was removed by
centrifugation at 10,000 rpm for 5 min. The FITC-labeled TAT-Gel loaded beads were
re-dispersed in 250 µL of rat plasma and incubated up to 24 hr at 37°C. At intended time
points (0, 1 hr, 4 hr, 6 hr, 12 hr and 24 hr), the beads (3 tubes per time point) were
washed with PBS 3 times, and the FITC-labeled TAT-Gel remaining on the bead surface
was eluted with 2 M NaCl solution. To test the protamine-triggered release, 100 µL of
protamine solution (10 mg/mL) was added to eppendorf tubes where FITC-labeled TAT-
Gel bound heparin beads were prepared in the presence of rat plasma. After incubation
for 30 min, the beads were washed with PBS 3 times, and the remaining FITC-labeled-
TAT-Gel was eluted with 2 M NaCl solution. For the control, FITC-labeled TAT-Gel
was incubated with beads and, after wash with PBS, eluted with 2 M NaCl solution
without incubation in rat plasma. The fluorescence intensity of each eluent was measured
using a plate reader (excitation/emission wave length: 485 nm/530 nm, BioTEK®
Synergy™ BioTEK, co., Winooski, VT). The portion of TAT-Gel binding to the heparin
beads (%) was calculated by dividing the fluorescence intensities of the eluent of the test
groups (N=3 per each time point and the protamine tested group) by the average
fluorescence intensity of the eluent of the control group (N=3).

57
3.3.9 In Vitro Characterization of Heparin/Protamine-Mediated Regulation on
TAT-Gel Cell Transduction
The heparin/protamine-mediated regulation on TAT-Gel cell transduction was
evaluated by confocal microscopic imaging and cytotoxicity studies. For the imaging
study, TAT-Gel (2 mg/mL in 0.1 M bicarbonate buffer, pH 9.0) was labeled with
rhodamine dye using the same protocol described at Methods section 3.3.6.
Twenty four hrs prior to the study, LS174T cells were seeded onto an 8-well
chambered coverglass (Nunc® Lab-Tek II Chambered Coverglass, Thermo Scientific,
Rockford, IL) at a density of 105 cells/well and incubated in complete medium. When the
cells were attached to the bottom, rhodamine-labeled TAT-Gel was added to the cells and
incubated for 3 hr at 37°C in the humidified CO2 incubator. The TAT-Gel/Hep (complex
of TAT-Gel and heparin) was prepared by incubating TAT-Gel with a 3-fold molar
excess of heparin for 30 min. To evaluate the protamine-induced reversal of the heparin
block, a 3-fold molar excess of protamine sulfate to heparin was immediately added to
the cells pre-treated with the TAT-Gel/Hep complex. After incubation with the different
TAT-Gel samples, the cells were washed with a 10 mg/mL heparin/PBS solution, and the
nuclei were counterstained with Hoechst 33342 (1:1000 dilution of 10 mg/mL stock
solution). The cells were then washed with PBS three more times. Images of the live cells
were taken with a Nikon A1R-A1 confocal laser microscope with a 20 × objective (Nikon
Instruments Inc., Melville, NY). The cell images were acquired and analyzed using NIS-
Elements Microscope Imaging software (Nikon Instruments Inc., Melville, NY).
The heparin/protamine-mediated regulation on cell internalization of TAT-Gel
was further evaluated by cytotoxicity studies on LS174T, HCT116 and MDCK cells. The

58
cells were dispensed into 96-well plates at a density of 5 ×10³ cells per well. When the
cells were attached on the bottom of the plates, TAT-Gel was added to the wells at final
concentrations of either 100 nM or 1 µM (N=3). Preparation of the TAT-Gel/Hep and
protamine treatment was performed as the same for the confocal microscopic imaging
studies. The cells were incubated with the samples for 72 hr at 37°C under 5% CO2 in the
humidified incubator and then the relative cell proliferation was measured using an XTT
assay.
3.3.10 Evaluation of Heparin/Protamine-Based Prodrug Feature of ATTEMPTS in
LS174T S.C. Xenograft Tumor Model
Six-week-old male athymic nude mice (body weight: 23 - 26 g) were purchased
from Charles Rivers Laboratories (Raleigh, NC). Three days after arrival (day 0),
LS174T cells (5 ×10⁶
cells/mice) were implanted into the left hind region of the legs of
the nude mice. When the tumor size reached 100 mm3
(day 16), the mice were randomly
divided into 5 groups (N=5 per group) and treated with: 1) PBS, 2) TAT-Gel (injected
dose: 2 µg), 3) TAT-Gel/Hep (TAT-Gel 2 µg and heparin 3 µg), 4) TAT-Gel/Hep+Pro
(TAT-Gel 2 µg and heparin 3 µg; separate injection of protamine 3 µg) or 5) Protamine
(injected dose: 3 µg). The test samples were administered twice at day 16 and 22 via
intra-tumor injection. For every treatment, the TAT-Gel/Hep was freshly prepared by
mixing TAT-Gel with heparin and incubation for 30 min at 4ºC. For the TAT-
Gel/Hep+Pro group, the TAT-Gel/Hep was injected into mice as described above, and the
protamine was injected separately into the tumor 5 min after the TAT-Gel/Hep
administration. The tumor size was monitored daily, and the volume was calculated using
the following formula: V (mm3) = (w
2 x l) / 2. In this equation, w is the width and l is the

59
length of the tumor. All animal experiments were conducted according to protocols
approved by the University of Michigan Committee on the Use and Care of Animals
(UCUCA).
3.4 Results
3.4.1 Expression and Purification of TAT-Gel
The thioredoxin-6xHis tagged-TAT-Gel (TRX-TAT-Gel) was successfully
expressed as soluble protein from the E.coli and purified by Ni-NTA metal affinity
chromatography (Figure 2A). After incubation of TRX-TAT-Gel with TEV protease and
subsequent heparin column purification, TAT-Gel was acquired as a single peak fraction
at 0.75 M NaCl (Figure 2B). The production of TAT-Gel was further confirmed by SDS-
PAGE gel analysis (Figure 2B inbox). The yield of TAT-Gel was 3 mg per liter culture,
and the purity was higher than 95% according to densitometry analysis.
3.4.2 N-glycosidase Activity of TAT-Gel
The N-glycosidase activity of TAT-Gel was determined by rabbit reticulocyte
lysate assay using luciferase as a marker. As shown in Figure 3, the profiles of
recombinant gelonin (rGel) and TAT-Gel were almost identical and the IC50 values of
TAT-Gel (20 ± 12 pM; Hill slope: -1.46) and rGel (15 ± 4 pM; Hill slope: -1.02) had no
statistical difference (p > 0.05 by student's t-test). Notably, the IC50 value of rGel was in
good accordance with the value reported by Hossan et al.7

60
3.4.3 Intracellular Uptake and Anti-cancer Activity of TAT-Gel
TAT-mediated cell internalization of gelonin was evaluated by confocal
microscopic imaging of LS174T cells after incubation with rhodamine-labeled TAT-Gel
or rGel. Virtually no fluorescence intensity was detected from the rGel-treated cells
(Figure 4B). As a comparison, strong fluorescence was clearly visible in the cells after
incubation with TAT-Gel (Figure 4A). The results indicated that TAT-Gel could
translocate into tumor cells.
Cytotoxicity studies for TAT-Gel were performed on two cancerous cell lines
(LS174T and HCT116) and a non-cancerous cell line (MDCK) using an XTT assay. For
all the tested cells, the rGel showed low cytotoxicity at concentrations above micro-molar,
while TAT-Gel exerted significantly greater cytotoxic effects. Remarkably, the IC50
values of TAT-Gel were 2 to 3 orders lower than those of the rGel (Figure 5 and Table 2).
3.4.4 Plasma Stable Binding of TAT-Gel to Heparin and Protamine-triggered
Release of the TAT-Gel
FITC-labeled TAT-Gel was loaded onto heparin beads, and the release was
monitored during incubation with rat plasma at 37ºC with or without protamine. The
majority (~ 80%) of TAT-Gel load onto the beads were found stably binding on the
surface of the heparin beads for 24 hr (Figure 7). In contrast, addition of protamine
induced release of most of the TAT-Gel (75% release) in less than 30 min (Figure 6).
3.4.5 In Vitro Characterization of Heparin/Protamine-mediated Regulation on
TAT-Gel Cell Internalization
Heparin block of the TAT-mediated cell internalization and the protamine-
induced reversal of this heparin inhibition were evaluated by confocal microscopic

61
imaging and cytotoxicity studies. As shown in Figure 7A, under the confocal
miscroscope, rhodamine-labeled TAT-Gel was visible inside the LS174T cells, while no
fluorescence signal was detected from the cells incubated with TAT-Gel/Hep. In
comparison, when protamine was added to the TAT-Gel/Hep pre-treated cells (TAT-
Gel+Pro), the strong fluorescence intensity was observed from the cells (Figure 7A).
In the cytotoxicity studies on various cells (LS174T, HCT116 and MDCK), TAT-
Gel showed significant cell death in all the tested cells at concentration of either 100 nM
or 1 µM, but almost no cytotoxicity was observed from the cells incubated with TAT-
Gel/Hep (Figure 7B, 7C and 7D). However, when protamine was added to the cells pre-
treated with the TAT-Gel/Hep (TAT-Gel/Hep+Pro), cytotoxicity level was recovered to
that of the TAT-Gel (Figure 7B, 7C and 7D). Protamine, by itself, did not show any
cytotoxicity below 10 µM (> 90% cell viability, data not shown).
3.4.6 In Vivo Evaluation of Heparin/Protamine-Based Prodrug Feature of
ATTEMPTS
The heparin/protamine-mediated regulation on tumoricidal efficacy of TAT-Gel
was tested in s.c. LS174T xenograft tumor mice. As shown in Figure 8, mice
administered with TAT-Gel/Hep complex exerted only low therapeutic effects with 12%
inhibition of tumor growth (at day 38). In contrast, the mice received TAT-Gel/Hep+Pro
treatment, exhibited significant inhibition of tumor growth (67% inhibition), which was
close to that observed from TAT-Gel treatment (78% inhibition) (Figure 8) However,
protamine alone did not show any therapeutic effects (5% inhibition).

62
3.5 Discussion
Although the cell penetrating peptides (CPPs) have been considered highly
favorable intracellular drug carriers for therapeutically potent macromolecules, non-
specific fashion of their cell penetration mechanism prohibits the clinical use because of
potential toxicity issues, especially if the macromolecules have low selectivity for the
diseased tissue. In this study, a recombinant TAT-gelonin chimera protein (TAT-Gel)
was developed as a model CPP-modified macromolecular drug and, after characterization
of its potency, the feasibility to apply a heparin/protamine-based drug delivery system
(DDS), CPP-modified ATTEMPTS, for regulation on the intracellular delivery of TAT-
Gel was explored.
For the synthesis of TAT-Gel, genetic recombination method was adopted
because of the following advantages: 1) site-specific attachment of TAT to gelonin
(generally to the N- or C- terminal of the protein gene), alleviating the risk of activity loss
induced by a random incorporation of the TAT; 2) homogeneous expression of TAT-Gel,
which allows the utilization of TAT-Gel activity with greater reproducibility; 3) efficient
mass production from the E.coli expression system. Using this recombinant engineering
technique, the TAT-Gel was, indeed, successfully prepared and purified.
After preparation of the TAT-Gel, its potentials to be used as an anti-cancer drug
were characterized in vitro. According to the rabbit reticulocyte lysate assay results, the
TAT-Gel showed equipotent N-glycosidase activity to rGel (Figure 3), indicating no
activity loss by conjugation of TAT. Furthermore, cell entry and cytotoxicity studies
(Figure 4 and 5) revealed improved cell internalization and significantly enhanced anti-
cancer activity of the TAT-Gel, compared with the unmodified recombinant gelonin

63
(rGel). Apparent cell internalization of TAT-Gel was observed from the confocal
microscopic images (Figure 4), and the cytotoxicity studies further evidenced the access
of internalized TAT-Gel to their target cytosolic ribosomes. Notably, by TAT
conjugation to gelonin, 2 to 3 orders lower IC50 (avg. IC50: 22.6 nM (± 20.2)) was
achieved, compared with rGel (avg. IC50: 4633 nM (± 635)) (Figure 5 and Table 2).
From the cytotoxicity study results, however, comparable cytotoxic effects of
TAT-Gel on cancer cell lines were also observed with the non-cancerous MDCK cells
(Figure 5C and Table 2), which was expected due to the non-specific cell uptake
mechanism of the CPPs (Chapter 2). Therefore, in an effort to prevent any toxicity issues
caused by TAT-Gel, the applicability of the CPP-modified ATTEMPTS for this TAT-Gel
delivery was explored.
In order to successfully apply CPP-modified ATTEMPTS for TAT-Gel delivery,
there are two requisites to be fulfilled: 1) a tight complex formation between TAT-Gel
and the antibody-heparin conjugate (Ab-Hep) and 2) the efficient release of TAT-Gel
from the Ab-Hep counterpart by protamine. In a simply designed in vitro binding study
using heparin beads (Figure 6), the interaction between TAT-Gel and heparin was proven
enough strong to hold each other under simulated physiological conditions (in the
presence of rat plasma at 37 ºC). Moreover, addition of protamine to those heparin beads
yielded significant release of the TAT-Gel (Figure 6).
Based on the finding that TAT-Gel and heparin can form a stable but reversible
complex, the heparin/protamine-based regulation on TAT-Gel cell internalization was
evaluated in vitro. The confocal microscopic images of the cells showed an obvious
difference in the cell entry of TAT-Gel with and without the presence of heparin and

64
protamine (Figure 7A). By forming a complex with heparin, the TAT-Gel was unable to
enter the cells. However, the addition of protamine to the TAT-Gel/Hep treated cells
markedly enhanced the cell uptake of TAT-Gel. Accordingly, TAT-Gel/Hep (3-fold
molar excess of TAT-Gel) exhibited no cytotoxic effects, while the addition of protamine
(3-fold molar excess of heparin) to the cells pre-treated with this complex induced
significant cell death (Figure 7B). Remarkably, the complex formation of TAT-Gel with
heparin could completely abolish the cell translocation ability of TAT in all of the tested
cell lines, including the non-cancerous MDCK cells. This finding provides an insight that,
if protamine can be administered to the body when the TAT-Gel/Ab-Hep complex is
selectively targeted to the tumor, the potential toxicity induced by TAT-Gel might be
effectively avoided.
In that the in vitro study results were promising, the heparin/protamine regulation
on TAT-Gel cell internalization was further evaluated in an LS174T s.c. xenograft tumor
mouse model. Compared with TAT-Gel (78% tumor growth inhibition), TAT-Gel/Hep
did not yield a significant therapeutic effect (16% tumor growth inhibition) (Figure 8).
However, when protamine was administered to the tumor after injection of TAT-Gel/Hep
(TAT/Gel+Pro), the tumor growth was significantly inhibited (67%) (Figure 8). This in
vivo study results support our hypothesis that TAT-Gel/Hep complex can stably maintain
in the tumor and that protamine is able to release the TAT-Gel from heparin inside the
tumor.

65
3.6 Conclusions
In this Chapter, TAT-Gel was developed using a genetic recombination method
and successfully produced from the E.coli cells. Through in vitro studies, TAT-Gel was
proven for its great potency to kill tumor cells. However, potential toxicity issues related
to non-cell specific internalization of the TAT-Gel were also recognized. To overcome
this problem, the feasibility of employing the CPP-modified ATTEMPTS for TAT-Gel-
based cancer therapy was investigated, specifically focusing on the heparin/protamine-
based regulation of the cell entry of TAT-Gel, a key feature of the DDS. Both our in vitro
and in vivo studies showed that masking TAT with heparin can completely block the cell
internalization of TAT-Gel, but this inhibition can be efficiently reversed by protamine.

66
3.7 Tables
Table 3-1. Summary of PCR primers for preparation of pET-TAT-Gel vector
PCR primers for construction of TAT-Gel encoding gene
TG-forward 5’- AGCCATATGGGTtatggccgtaaaaaacgtcgtcagcgtcgtcgtGGC
GGCCTGGATACCGTG-3’
TG-backward 5’-TTCTTATTATTTCGGATCTTTGTCGACGAATTTCAGCAGCGC-3’
PCR primers for preparation of pET-TAT-Gel vector
pTG-forward-1 5’-GCGAAAACCTGTATTTTCAGTCCCTTAGCCATATG
GGTtatggccgtaaaaaacg-3’
pTG-forward-2 5’-CATCATCATCATCATCATGGTAGCAGCGGCGAAAACCTGTA
TTTTCAG-3’
pTG-forward-3 5’-GCCGTCTCGGATCCCATCATCATCATCATCATGGT-3’
pTG-backward 5’-GCCGTCTCCTCGAGTTATTATTTCGGATCTTTGTC-3’
TAT codons are shown in lower case.
Table 3-2. Summary for the cytotoxicity study results (IC50) of gelonin and TAT-Gel
Samples LS174T a HCT116
a MDCK
a
Gelonin 5749 ± 829 5506 ± 1563 3900 ± 1200
TAT-Gel 17.3 ± 11.7***
5.6 ± 3.2***
45.2 ± 23.1***
a IC50 values are displayed as nM. ***P < 0.0001 by Student t-test. For all experiments,
N=3. (TAT-Gel: TAT-gelonin fusion protein)

67
3.8 Figures
Figure 3-1. Schematic design of (A) pET-TAT-Gel vector, and images of (B) rGel, TRX-
TAT-Gel and TAT-Gel.
(rGel: recombinant gelonin, TRX-TAT-Gel: thioredoxin-6xHis tagged TAT-gelonin
fusion protein, TAT-Gel: TAT-gelonin fusion protein)

68
Figure 3-2. Expression and purification of TAT-Gel. (A) SDS-PAGE results of Ni-NTA
column purification of TRX-TAT-Gel.
Lane M: Mark12 protein molecular weight standard (Invitrogen, Carlsbad, CA). Lane L:
the supernatant fraction of cell lysate. Lane FT1 & FT2: 1st and 2
nd flow through fractions.
Lane W: wash fraction. Lane E: elution fraction containing TRX-TAT-Gel. Lanes FT1 to
E were obtained after loading cell lysate to the Ni-NTA column; (B) Heparin
chromatograpy trace for purification of TAT-Gel. TAT-Gel was acquired by incubation
of TRX-TAT-Gel with TEV protease and heparin column purification with elution buffer
A: 50 mM phosphate; B: 50 mM phosphate, pH 7.4 + 2 M NaCl. The NaCl salt gradient
applied for elution is showed as a red line. Three major peaks (1 (eluted out with no salt),
2 (eluted out at 0.2 M NaCl) and 3 (eluted out at 0.75 M NaCl)) are displayed with the
RAU (relative absorbance unit) according to the retention time (min); In box: SDS-PAGE
69
results of the three peak fractions obtained from the heparin chromatography. Lane M:
Mark12 protein molecule weight standard. Lane 1 to 3: 3 elution fractions. (TRX-TAT-
Gel: thioredoxin-6-His tagged TAT-gelonin fusion protein, TAT-Gel: TAT-gelonin
fusion protein)
Figure 3-3. N-glycosidase activity of TAT-Gel determined by rabbit reticulocyte lysate
assay.
Inhibition of luciferase translation by rGel (closed circle) or TAT-Gel (closed square)
was measured by a chemiluminescent assay (Promega Corp., Madison, WI) and IC50
values were calculated by nonlinear regression using Prism software (Prism version 5.0,
Graphpad, CA). (TAT-Gel: TAT-gelonin fusion protein, rGel: recombinant gelonin)

70
Figure 3-4. Confocal microscopic images of LS174T human adenocarcinoma cells
incubated with rhodamine-labeled (A) TAT-Gel or (B) rGel.
Cells were incubated with 5 µM of rhodamine-labeled TAT-Gel or rGel for 3 hrs at 37°C,
and, after washed once with 10 mg/mL heparin/PBS and 3 times with PBS, the cell
images were taken by a Nikon A1R-A1 confocal laser microscope with a 60x objective
(Nikon Instruments Inc., Melville, NY). (TAT-Gel: TAT-gelonin fusion protein, rGel:
recombinant gelonin)

71
Figure 3-5. Anti-cancer activity of TAT-Gel.
(A) LS174T, (B) HCT116 and (C) MDCK cells, plated onto 96 wells (cell density: 5x10³
cells/well), were incubated with rGel or TAT-Gel for 72 hrs and the cytotoxicity level
was determined by XTT assay (N=3).
Figure 3-6. In vitro plasma stability of TAT-Gel/Hep and protamine-induced release of
TAT-Gel.
FITC-labeled TAT-Gel was loaded onto heparin beads and the release was monitored for
24 hrs in the presence of rat plasma at 37ºC. Release of TAT-Gel by addition of excessive
protamine was also observed. *** P < 0.0001, n.s.: not significant. For all experiments,
N=3. (TAT-Gel: TAT-gelonin fusion protein, TAT-Gel/Hep: TAT-Gel and heparin
complex; Pro: Protamine)

72
Figure 3-7. Heparin/protamine-mediated regulation on TAT-Gel cell internalization
evaluated by cell entry and cytotoxicity studies.
(A) Confocal microscopic images of LS174T cells after incubation with rhodamine-
labeled TAT-Gel, by itself (TAT-Gel; 1st column), a complex with heparin (TAT-
Gel/Hep; 2nd column) or a complex with heparin and later addition of protamine (TAT-
Gel/Hep+Pro; 3rd column). The upper row shows the cell images acquired by a
rhodamine filter (R) and the lower row exhibits the merged cell images obtained by a
rhodamine filter (R) and a Hoechst filter (H). Cytotoxicity study results on (B) LS174T,
(C) HCT116 and (D) MDCK cells, after TAT-Gel, TAT-Gel/Hep or TAT-Gel/Hep+Pro
treatment. Data represent mean ± SD, *** P < 0.0001. For all experiments, N=3. (TAT-
Gel: TAT-gelonin fusion protein, TAT-Gel/Hep: TAT-Gel and heparin complex)

73
Figure 3-8. In vivo evaluation of heparin/protamine-mediated regulation on TAT-Gel
tumoricidal efficacy in a LS174T s.c. xenograft tumor mice model.
(A) Tumor volume profiles as a function of time (days). When the tumor size reached
100 mm3, mice were divided into 5 groups (N=5) and received PBS (circle), TAT-Gel
(triangle), TAT-Gel/Hep (square), TAT-Gel/Hep+Pro (diamond) or protamine (reverse
triangle) treatment. For TAT-Gel/Hep+Pro treatment, the TAT-Gel/Hep was first
administered to the tumor and, 5 min later, protamine injection was followed. The
treatments were given by intra-tumor injection at day 16 and 22. Tumor size was
measured daily using a vernier caliper after tumor inoculation (day 0) and the volume
(mm3) was calculated by the following equation, V = (a
2 x b) / 2. In this equation, a

74
represents the width and b represents the length of the tumor. (B) Average tumor size of
each group at day 38 when the tumor size of the PBS treated group reached 2000 mm3.
Data represent mean ± SD. *** P < 0.0001. (TAT-Gel: TAT-gelonin fusion protein,
TAT-Gel/Hep: TAT-Gel and heparin complex)
3.9 References
1. Brooks H, Lebleu B, Vives E. Tat peptide-mediated cellular delivery: back to
basics. Adv Drug Deliv Rev 2005;57:559-77.
2. Wadia JS, Dowdy SF. Transmembrane delivery of protein and peptide drugs by
TAT-mediated transduction in the treatment of cancer. Adv Drug Deliv Rev
2005;57:579-96.
3. Niesner U, Halin C, Lozzi L, Gunthert M, Neri P, Wunderli-Allenspach H, Zardi
L, Neri D. Quantitation of the tumor-targeting properties of antibody fragments
conjugated to cell-permeating HIV-1 TAT peptides. Bioconjug Chem
2002;13:729-36.
4. Huang Y, Jiang Y, Wang H, Wang J, Shin MC, Byun Y, He H, Liang Y, Yang
VC. Curb challenges of the "Trojan Horse" approach: Smart strategies in
achieving effective yet safe cell-penetrating peptide-based drug delivery. Adv
Drug Deliv Rev 2013.
5. Kwon YM, Li YT, Liang JF, Park YJ, Chang LC, Yang VC. PTD-modified
ATTEMPTS system for enhanced asparaginase therapy: a proof-of-concept
investigation. J Control Release 2008;130:252-8.
6. Kwon YM, Li Y, Naik S, Liang JF, Huang Y, Park YJ, Yang VC. The
ATTEMPTS delivery systems for macromolecular drugs. Expert Opin Drug
Deliv 2008;5:1255-66.
7. Hossann M, Li Z, Shi Y, Kreilinger U, Buttner J, Vogel PD, Yuan J, Wise JG,
Trommer WE. Novel immunotoxin: a fusion protein consisting of gelonin and
an acetylcholine receptor fragment as a potential immunotherapeutic agent for
the treatment of Myasthenia gravis. Protein Expr Purif 2006;46:73-84.

75
Chapter 4
Heparin Functionalized Monoclonal Antibody Mediated
Tumor Targeted Delivery of CPP-Modified Gelonin
4.1 Abstract
Monoclonal antibodies (mAbs) are attractive drug carriers for cancer therapy, as
they can provide effective means of tumor targeting. Specifically, by attaching
extrememly potent toxins to those mAbs, certain clinical successes have been
accomplished. Herein, we investigated the feasibility to exploit the strong electrostatic
interaction between anionic heparin and cationic cell penetrating peptides (CPPs) for
coupling the mAb with a toxin, gelonin. A heparin-functionalized mAb was developed
via chemical conjugation of heparin with T84.66, a murine anti-carcinoembryonic
antigen (CEA) mAb. This T84.66 is well-known for its excellent targeting ability toward
tumors, such as colorectal cancer. Through in vitro assays, it was confirmed that the
T84.66-heparin conjugate (T84.66-Hep) still retains specificity for CEA, and, moreover,
can strongly bind to cationic peptides (e.g., protamine) in the presence of plasma. Live
animal imaging studies further showed that T84.66-Hep can selectively deliver a CPP-
modified toxin, TAT-Gel, to tumor via forming a complex. Through administration of

76
T84.66-Hep/TAT-Gel, markedly enhanced (58-fold) tumor exposure of TAT-Gel was
accomplished, compared with injection of TAT-Gel alone.
4.2 Introduction
The mAbs are attractive macromolecules for cancer therapy due to their ability to
selectively bind to tumor cells via interaction with specific tumor associated antigens.1, 2
Carcinoembryonic antigen (CEA) which was first isolated from human colon cancer
extracts is a GPI-linked highly glycosylated cell surface protein (MW ~ 200 kDa).3, 4
The
CEA is known to have strictly limited expression in normal tissues (e.g., columnar
epithelial cells and goblet cells in colon), but over-expressed in various human
adenocarcinomas (e.g., colon, ovarian, lung, breast and pancreatic cancer).4 Moreover,
although normal colon cells express CEA, its expression is exclusively limited to the
apical surface, which allows very limited access from the blood stream. However, colon
cancer cells lose their polarity and have distribution of CEA all around the cell surface.4
Therefore, CEA has been considered a suitable tumor associated antigen for tumor
detection and targeted drug delivery.5-8
Among the anti-CEA mAbs, T84.66 from murine
origin possesses exceptionally high binding affinity (2.6 × 10¹⁰
M-1
) and specificity
toward the CEA.9 Thus, T84.66 has shown exceptional tumor targeting efficiency.
According to Urva and Balthasar, over 85% of the injected T84.66 (at 1 mg/kg dose) was
found to accumulate in tumor.10
Binding to the antigens, the mAbs, by itself, can elicit anti-tumor activity
mediated via complement dependent cytotoxicity (CDC), antibody dependent cell
cytotoxicity (ADCC) or induction of direct signaling.2 However, the above effects tend to

77
be various among the mAbs and eventually not curative.1 An effective way to improve
the therapeutic efficacy of the mAbs is to couple them with potent toxin molecules.11, 12
This approach has received enormous interest in the past decades and, indeed,
accomplished certain clinical successes.
In this chapter, we describe the development of a heparin functionalized mAb,
T84.66-Hep, by chemical conjugation method using a heterobifunctional PEG (NH2-
PEG-MAL) as a cross-linker. The CEA binding specificity of T84.66-Hep, evaluated by
cell binding and ELISA studies, is reported. Also, the in vitro plasma stability of T84.66-
Hep binding with cationic peptides (e.g. protamine) is discussed. Finally, we examine the
feasibility of T84.66-Hep mediated tumor targeted delivery of TAT-Gel via complex
formation in a LS174T s.c. xenograft tumor model.
4.3 Materials and Methods
4.3.1 Materials
Carbenicillin and isopropyl-β-thiogalactopyranoside (IPTG) were purchased from
Fisher Scientific (Pittsburg, PA). Heparin sulfate and rhodamine B isothiocyanate,
fluorescein isothicyanate (FITC), Traut’s reagent (2-iminothiolane), MES (2-(N-
morpholino) ethanesulfonic acid), EDC (1-Ethyl-3-[3-dimethylaminopropyl]
carbodiimide Hydrochloride), goat anti-mouse-IgG (Fc specific)-alkaline phosphatase, rat
plasma and murine IgG were purchased from Sigma-Aldrich (St. Louis, MO). Competent
E.coli strain (BL21star (DE3)), AcTEVTM
protease, PBS (pH 7.4), Dulbecco's Modified
Eagle Medium (DMEM), Hybridoma serum free medium (SFM), fetal bovine serum
albumin (FBS), Hoechst 33342 trihydrochloride, trihydrate were purchased from

78
Invitrogen (Carlsbad, CA). 1-step PNPP, Dylight 679-C5 and Dylight 775-B4 were
purchased from Thermo Scientific (Rockford, IL). PEG (NH2-PEG-MAL; 3.5 kDa) was
purchased from JenKem Technology USA Inc. (Allen, TX). Recombinant CEA (rCEA)
was purchased from R&D SYSTEMS (Minneapolis, MN).
4.3.2 Production of T84.66
T84.66 was produced from hybridoma cells purchased from American Type
Culture Collection (ATCC # HB-8747, Manassas, VA). Cells were grown in 2L spinner
flasks containing serum free media (Hybridoma SFM, Invitrogen), and the culture
supernatant was harvested every 3 days. T84.66 was purified by loading the culture
supernatant onto protein G column (Protein G Sepharose™ 4 Fast Flow, GE Healthcare
Biosciences, Pittsburg, PA) pre-equilibrated with 20 mM phosphate buffer (PB, pH 7).
After wash with 200 mL of above PB, the T84.66 was eluted with 0.1 M glycine buffer
(pH 2.8) and collected in a tube where 1 M Tris buffer was pre-dispensed for instant
neutralization of the elution buffer. The T84.66 was then dialyzed (Dialysis Tubing
Cellulose Membrane, molecular weight cutoff: 12,000 Da, Sigma-Aldrich, St. Louis,
MO) for overnight against 20 mM phosphate buffer saline (PBS, 0.15 M NaCl, pH 7.4)
for buffer exchange. The final T84.66 product was quantified by measuring the optical
density at 280 nm and kept at 4ºC until use.
4.3.3 Preparation and Purification of Heparin Functionalized T84.66 (T84.66-Hep)
T84.66 was conjugated with heparin via a stable thioether bond utilizing a
heterobifunctional PEG (NH2-PEG-MAL, 3.5 kDa, JenKem Technology USA Inc.) as a
cross-linker. The conjugation scheme is depicted in Figure 1. Thiol groups were
introduced to T84.66 by incubation of the T84.66 (10 mg/mL in 50 mM HEPES buffer, 5

79
mM EDTA, pH 8) with 10-fold molar excess of Traut’s reagent for 1 hr at room
temperature. The unreacted Traut’s reagent was removed by ultrafiltration using
centrifugal filtration device (molecular weight cut off: 10 kDa, Amicon® Centricon®
Centrifugal Filter Devices, Millipore Corporation, Billerica, MA) and the generated thiol
groups were quantified by Ellman’s assay.13
To introduce thiol reactive maleimide groups
to heparin, heparin (40 mg/mL in 0.1 M MES buffer 1 mL, pH 5) was incubated with 5-
fold molar excess of NH2-PEG-MAL (40 mg/mL in 0.1 M MES buffer 1 mL) and EDC
(40 mg/mL in 0.1 M MES buffer 0.5 mL) for 2 hr at room temperature. The conjugate,
heparin-PEG-MAL, was loaded onto an anion exchange column (Bio-Scale™ Mini
UNOsphere™ Q Cartridge, Bio-Rad Laboratories, Hercules, CA) connected to HPLC
(Alltech 526 HPLC pump, Deerfield, IL) and eluted with salt gradient (0 to 2 M NaCl at
a rate of 0.02 M/min, flow rate: 1 mL/min). The heparin-to-PEG conjugation ratio was
determined by measuring the heparin and NH2-PEG-MAL content by azure A assay14
and
barium iodide assay,15
respectively. The prepared heparin-PEG-MAL was slowly added
to the thiol activated T84.66 (T84.66-SH), and the conjugation reaction was performed at
room temperature for overnight. The T84.66-Hep was purified from T84.66-SH using an
anion exchange column and elution with a salt gradient (0 to 2 M NaCl at a rate of
0.02M/min, flow rate: 1 mL/min, detection: 280 nm). Any unreacted heparin and heparin-
PEG-MAL was further removed by ultrafiltration (molecular weight cut off: 100 kDa).
All the peak fractions including the final T84.66-Hep product was analyzed by SDS-
PAGE and the T84.66 and heparin contents were quantified by measuring the optical
density at 280 nm (OD280) and azure A assay, respectively.

80
4.3.4 Cell Culture
LS174T and HT116 human adenocarcinoma cells were purchased from American
Type Culture Collection (ATCC) (Manassas, VA). The cells were cultured in 75 cm2
flasks and maintained in a humidified atmosphere of 5% CO2 at 37°C. The cells were
cultured in DMEM with 2 mM L-glutamine, high glucose, 1% (v/v) penicillin-
streptomycin, and 10% FBS. During the cultures, culture media in flasks was replaced by
fresh media every other day, and the cells were sub-cultured when confluent, by
detaching with 0.25% trypsin-EDTA.
4.3.5 Specific Cell Binding Assay
Specific binding of T84.66-Hep to cell surface expressed CEA was evaluated in
vitro by cell binding assay using confocal microscopy. Prior to the cellular studies,
T84.66-Hep (2 mg/mL in 0.1 M bicarbonate buffer, pH 9.0) was labeled with a
fluorescence dye by incubation with 5-fold molar excess of rhodamine B isothiocyanate
(TRITC) at room temperature for 2 hr. The unreacted TRITC was removed using dye
removal resin following the vendor’s protocol (Bio-Rad Laboratories, Hercules, CA).
For the cell binding assay, LS174T (CEA high expression cell line) and HCT116
(CEA low expression cell line) cells were seeded onto an 8-well chambered coverglass
(Nunc® Lab-Tek II Chambered Coverglass, Thermo Scientific, Rockford, IL) at a
density of 105 cells/well and incubated for overnight in complete medium. When the cells
were attached on the bottom of the wells, rhodamine-labeled T84.66-Hep (final
concentration of 5 µM) was incubated with the cells for 2 hr at 37°C in a humidified
atmosphere of 5% CO2. Additionally, to investigate whether T84.66-Hep binding to the
cells is via specific interaction with the CEA, LS174T cells were pre-incubated with 10-

81
fold molar excess of unlabeled T84.66 for 1 hr, and then, incubated with the rhodamine-
labeled T84.66-Hep for 2 hr. After washing the cells with PBS, the images of the live
cells were taken with a Nikon A1R-A1 confocal laser microscope with a 60x objective
(Nikon Instruments Inc., Melville, NY). The cell images were acquired and analyzed
using NIS-Elements microscope imaging software (Nikon Instruments Inc., Melville,
NY).
4.3.6 ELISA Assay
Specific binding of T84.66-Hep to CEA was determined by ELISA assay using
the protocols by Urva et al. with modification.16
Briefly, 96-well plates (Corning® 96
well EIA/RIA clear flat bottom polystyrene high bind microplate, Tewksbury, MA) were
coated with recombinant CEA (rCEA, 400 ng/mL in 20mM phosphate buffer, 250
µL/well, R&D SYSTEMS) and incubated at 4ºC for overnight. The unbound rCEA was
removed and the wells were washed by PB-Tween (20 mM phosphate buffer with 0.05%
Tween 20) three times, followed by wash with MQ water twice. Various concentrations
of T84.66 and T84.66-Hep (0, 10, 50 and 100 ng/mL) were then separately added to the
wells (200 µL/well). After incubation for 2 hr at room temperature, the wells were
washed and goat anti-mouse-IgG (Fc specific)-alkaline phosphatase (1:1000 in PB-
Tween, 100 µL/well, Sigma-Aldrich) was added to the wells and incubated for 2 hr at
room temperature. After washing as above, 100 µL of p-nitrophenyl phosphate (1-step
PNPP, Thermo Scientific) was added to each well and the change in absorbance at 405
nm was monitored by a microplate reader (BioTEK® Synergy™ BioTEK, co., Winooski,
VT) using kinetic mode. The absorbance of each well was measured every minute for

82
total 6 minutes and the initial rate (slope, dA/dt) was calculated by linear regression using
Prism software (Prism version 5.0, GraphPad, San Diego, CA).
4.3.7 Evaluation of the In Vitro Plasma Stability of T84.66-Hep Binding to
Cationic Protamine
In vitro plasma stability of T84.66-Hep binding to cationic CPP was evaluated at
physiologically simulated condition using protamine beads (Protamine-Agarose, Sigma-
Aldrich, St. Louis, MO) as an alternative for the CPPs. Prior to the study, T84.66-Hep
was labeled with a fluorescent dye. Briefly, T84.66-Hep (2 mg/mL in 0.1 M bicarbonate
buffer, pH 9.0) was incubated with 5-fold molar excess of FITC for 2 hr at room
temperature and the unreacted FITC was removed using dye removal resins (Bio-Rad
Laboratories).
The FITC-labeled T84.66-Hep (200 µg/mL in PBS) was loaded 50 µg each onto
100 µL of protamine beads (50% (v/v) slurry) and incubated at room temperature for 1
hr. The unbound FITC-labeled T84.66-Hep was removed by centrifugation at 10,000 rpm
for 5 min. The FITC-labeled T84.66-Hep loaded beads were then re-dispersed in 250 µL
of rat plasma (Sigma-Aldrich) and incubated up to 24 hr. At intended time points (0, 1hr,
2 hr, 4 hr, 6 hr, 12 hr and 24 hr), the beads were washed with PBS for 3 times and the
FITC-labeled T84.66-Hep remaining on the bead surface was eluted with 2 M NaCl
solution. For the control, the FITC-labeled T84.66-Hep was eluted from the beads
without incubation in the rat plasma. The fluorescence intensities of the eluents were
measured by a plate reader (excitation/emission (Ex/Em) wave length: 485nm/530 nm,
BioTEK® Synergy™ BioTEK, co., Winooski, VT). The bound fraction (%) of FITC-

83
labeled T84.66-Hep was calculated by dividing the mean fluorescence intensities of the
eluents by that of the control (N=3 for each time point).
4.3.8 LS174T S.C. Xenograft Tumor Mouse Model
Male athymic nude mice (body weight: 21 ~ 25 g, 6 weeks old) were purchased
from Charles Rivers Laboratories (Raleigh, NC). Mice were housed in sterile animal
facilities, handled under aseptic conditions in a laminar hood, and fed by standard chow
diet. At day 0 (three days after arrival), LS174T cells (5 × 10⁶
cells/mice) were injected
(s.c.) into the left flank of the mice. After tumor implantation, the mice were fed by
special alfalfa-free diet (AIN-76A rodent diet, gamma-irradiated, Research Diets, Inc.,
New Brunswick, NJ) to reduce the background autofluorescence during the imaging
studies.17, 18
Tumor size was measured using a vernier caliper and the volume was
calculated by the formula of volume, V (mm3) = (w
2 x l) / 2. In the equation, w is the
width and l is the length of the tumor. When the tumor size reached average 200 mm3, the
imaging study was performed.
4.3.9 Live Animal Imaging
Prior to the imaging studies, antibody (Ab) samples (T84.66-Hep, nonspecific
mouse IgG and IgG-heparin conjugate (IgG-Hep)) and TAT-Gel were labeled with near
infrared (NIR) dyes, Dylight 679-C5 (C5, Thermo Scientific) and Dylight 775-B4 (B4,
Thermo Scientific), respectively. The C5 and B4 were chosen based on their minimal
overlapping of excitation and emission (Ex/Em) wavelengths, in order to simultaneously
image both the antibody samples and TAT-Gel in the same mouse. To assess any
interference or quenching between the two dyes, the fluorescence intensities of C5, B4
and 1:1 mixture of C5 and B4 were measured at Ex/Em wavelengths of 675 nm/720 nm

84
(optimal for C5) and 745 nm/800 nm (optimal for B4), using the IVIS® spectrum
imaging system (Xenogen, Alameda, CA).
Dye labeling was performed following the vendor’s protocol (Thermo Scientific).
Briefly, non-specific IgG, IgG-Hep and T84.66-Hep (5 mg/mL in 50 mM sodium
bicarbonate buffer, pH 9.3) were separately incubated with 5-fold molar excess of C5 (10
mg/mL stock solution in DMF) at room temperature for 2 hr. Similarly, TAT-Gel (2
mg/mL in 50 mM sodium bicarbonate buffer, pH 9.3) was incubated with 5-fold molar
excess of B4 (10 mg/mL in DMF). The unreacted C5 and B4 were removed using the dye
removal resins (Bio-Rad Laboratories). The dye-to-protein ratio was calculated based on
the vendor’s protocol (Thermo Scientific).
For the live animal imaging, the LS174T s.c. xenograft tumor mice were
randomly divided into 6 groups (N=3 per group) and administered with: 1) PBS, 2) C5,
3) nonspecific IgG-C5 (360 µg), 4) TAT-Gel-B4 (135 µg), 5) IgG-Hep-C5/TAT-Gel-B4
(345 µg of IgG-Hep-C5 and 135 µg of TAT-Gel-B4) or (6) T84.66-Hep-C5/TAT-Gel-B4
(400 µg of T84.66-Hep-C5 and 135 µg of TAT-Gel-B4). The above prepared C5, IgG-C5
and T84.66-Hep-C5 sample solutions contained similar C5 content. The Ab-Hep/TAT-
Gel complex was prepared by incubation of the Ab-Hep-C5 with TAT-Gel-B4 at 4ºC for
1 hr, prior to the imaging studies. The samples were injected via tail vein injection and
the live animal imaging was performed using IVIS® spectrum imaging system (Xenogen,
Alameda, CA). During imaging, mice were maintained anesthetized with isoflurane
(Abbott Laboratories, Chicago, IL). The animal images were obtained at 5 min, 30 min,
1hr, 2 hr, 6 hr, 24 hr, 48 hr and 72 hr after the injection of the samples. Animal

85
experiments were conducted according to the protocol approved by the University of
Michigan Committee on Use and Care of Animals (UCUCA; protocol No. 08945).
To acquire the images of the C5-labeled Ab samples in the animal body, Cy5.5
filter (Ex/Em: 675 nm/720 nm) was used and, for the detection of TAT-Gel-B4, ICG
filter (Ex/Em: 745 nm/800 nm) was utilized, respectively. Identical illumination settings,
such as exposure time (1 s), binning (8), f/stop (4 for C5-labeled Ab samples and 2 for
TAT-Gel-B4) and fields of view (25 cm x 25 cm) were used for the imaging. The images
were analyzed using Living Image 2.5 software (Xenogen, Alameda, CA) and the signal
was normalized to photon per second per centimeter squared per steradian (ps-1
cm-2
sr-1
).
Intra-tumor accumulation of TAT-Gel-B4 was assessed by measuring the
fluorescence intensity of the tumor, designated as the region of interest (ROI), from each
animal image. The fluorescence intensity of each ROI was acquired by subtracting the
mean fluorescence intensity of the corresponding ROI on the control blank mice. The
mean fluorescence intensity was plotted as a function of time and the area under the
curve (AUC) for each plot was calculated using Metamorph software (Molecular Devices
Corporation, Sunnyvale, CA).
4.3.10 Statistical Analysis
All data are presented as mean ± standard deviation. Statistical comparisons were
made using student t-test (unpaired t-test, two-tailed, Prism version 5.0, GraphPad, San
Diego, CA). Less than p-values of 0.05 were considered significant.

86
4.4 Results
4.4.1 Purification of T84.66
The T84.66 was expressed from the hybridoma cells and purified by protein G
affinity chromatography. Successful purification of T84.66 was confirmed by SDS-
PAGE gel analysis (data not shown). The T84.66 was observed at the position
corresponding to the size of about 170 kDa. The average yield of T84.66 was 2 mg per L
culture and the purity was higher than 95% based on the densitometry analysis using
imageJ software.
4.4.2 Preparation and Purification of Heparin Functionalized T84.66 (T84.66-Hep)
The T84.66 was conjugated to heparin via a thioether bond using a
heterobifunctional PEG (NH2-PEG-MAL, 3.5 kDa) as a cross-linker (Figure 1). To
prepare the conjugate, thiol activation of T84.66 (T84.66-SH) was achieved using Traut’s
reagent. Ellman’s assay indicated that an average of 5 thiol groups was introduced to
each T84.66. Moreover, a thiol active maleimide group was successfully introduced to
heparin by conjugation with NH2-PEG-MAL. As the PEG does not have strong binding
affinity to anion exchange resins, the heparin-PEG-MAL was purified from unreacted
PEG by anion exchange chromatography. The eluent contained both heparin and PEG at
a molar ratio of 1:0.4 (heparin:PEG), determined by Azure A and Barium iodide assay.
The conjugation reaction was performed by incubation of the T84.66-SH with 5-fold
molar excess of the heparin-PEG-MAL and the T84.66-Hep was successfully purified
from T84.66-SH by anion exchange chromatography using NaCl salt gradient (Figure
2A). Whereas T84.66 did not bind to the column (Figure 2A), T84.66-Hep elution profile
showed two distinct peak fractions, F#1 (eluted with no salt) and F#2 (retention time: 50

87
min, elution with 0.8 - 1.8 M NaCl) (Figure 2A). SDS-PAGE analysis indicated that F#2
contained the T84.66-Hep (Figure 2B). After removal of the unreacted heparin and
heparin-PEG-MAL that contained in the F#2 by ultrafiltration (MWCO:100 kDa), the
final yield of T84.66-Hep was 25% (2.5 mg of T84.66-Hep from initial 10 mg T84.66)
and the average T84.66-to-heparin conjugation molar ratio was 1:3 (see Figure 2C).
4.4.3 CEA-mediated Specific Cell Binding of T84.66-Hep
To determine whether T84.66-Hep can specifically bind to CEA overexpressed on
tumor cell surface, cell binding studies were performed on CEA high expressing LS174T
cell line and CEA low expressing HT116 cell line. After 2 hr incubation with rhodamine-
labeled T84.66-Hep, whereas no apparent fluorescence intensity was observed from the
HT116 cells, strong fluorescence signal was clearly visible on the surface of LS174T
cells (Figure 3). However, when the LS174T cells were incubated with rhodamine-
labeled T84.66-Hep after pre-incubation with 10-fold molar excess of T84.66, only
minimal signal was observed (Figure 3).
4.4.4 ELISA Assay
The specific binding of T84.66-Hep to CEA was further evaluated using ELISA
assay. With all the tested concentrations (10, 25, 50, 75 and 100 ng/mL), T84.66-Hep
showed lower CEA binding profile than the T84.66 (Figure 4 and Table 1) with
averaging 69% T84.66-Hep/T84.66 rate ratio (R T84.66-Hep/T84.66).
4.4.5 Plasma Stability of T84.66-Hep Binding to Cationic Protamine
The plasma stability of the interaction between T84.66-Hep and cationic CPPs
was evaluated in vitro utilizing protamine beads as alternatives for the CPPs. By simple

88
mixing, the FITC-labeled T84.66-Hep was able to bind to the protamine beads (65%
loading efficiency). When the T84.66-Hep-loaded protamine beads were incubated with
plasma, 25% FITC-labeled T84.66-Hep was released within an hour. However, the
majority of the FITC-labeled T84.66-Hep stably remained on the surface of the beads for
24 hrs (68% remaining on the surface of the beads) (Figure 5).
4.4.6 In Vivo Evaluation of Tumor Targeted Delivery of TAT-Gel Via Complex
Formation with T84.66-Hep
A live animal imaging study was performed with near infrared (NIR) dye-labeled
samples, C5-labeled antibodies samples (non-specific IgG, IgG-Hep, T84.66-Hep) and
TAT-Gel-B4, in an LS174T s.c. xenograft tumor mice model. Little, if any, interference
between the C5 and B4 was observed, specifically at their low concentrations (< 6.25
µg/mL) that was used in this study (Figure 6).
The absence of any fluorescence signal from the PBS-treated mice (Figure 7B)
evidenced no autofluorescence from the tissues. After administration of T84.66-Hep-
C5/TAT-Gel-B4, the T84.66-Hep-C5 was observed in the tumor over 72 hr with a
localized fashion and its major disposition site appeared to be the liver (Figure 7A). In
comparison, the control mice (administered with PBS, C5 or IgG-C5) displayed no
fluorescence intensity in the tumor at either 5 min or 48 hr post-injection (Figure 7B).
The TAT-Gel-B4 was observed from the body for a short period (less than 6 hrs)
when administered alone (Figure 8A). However, by administration as a complex with
IgG-Hep-C5 or T84.66-Hep-C5, the TAT-Gel-B4 was visible over 48 hr (Figure 8B and
8C). Furthermore, by administration as a complex with IgG-Hep-C5 or T84.66-Hep-C5,
enhanced accumulation of TAT-Gel-B4 was observed in the tumor (Figure 8B and 8C).

89
When the mean fluorescence intensity of TAT-Gel-B4 in the tumors was plotted as a
function of time (Figure 9A), a 7-fold and a 58-fold increase in tumor exposure (AUC) of
the TAT-Gel-B4 was observed by administration as a complex with IgG-Hep-C5 and
T84.66-Hep-C5, respectively (Figure 9A). The relative fluorescence intensities of the
TAT-Gel-B4 in the dissected tumors are shown in Figure 9B.
4.5 Discussion
Heparin, a clinically approved anticoagulant,19
is an attractive biomaterial
applicable for developing drug delivery systems (DDS), as it is biodegradable,
biocompatible and less toxic.20
Added to the above characteristics, heparin possesses a
unique property, exceptionally high negative charge density on the molecule surface,
which enables heparin to serve as an effective affinity tag for coupling two molecules.21
On the other hand, CPPs which are well known for their cell translocating ability also
have potentials to serve as an affinity linker due to their highly cationic nature.22
In this
work, by utilizing the exquisite merits of both the heparin and CPPs, we developed a
heparin functionalized mAb, T84.66-Hep, by chemical conjugation method and evaluated
the in vivo applicability for tumor targeted delivery of a CPP-modified toxin was
explored.
The T84.66-Hep was prepared via a thioether linkage between the thiol group
introduced to T84.66 and the maleimide group of the heparin-PEG conjugate.
Structurally, heparin consists of a linear polymer with repeating units of disaccharide
which are abundant in carboxyl groups.23
The sugar residues and the carboxyl groups of
heparin have been the main target sites for chemical conjugation. In previous studies, the

90
sugar residues have been successfully utilized for conjugation of heparin to nanoparticle24
and antibody25
by generating amine-reactive aldehyde groups using nitrous acid-induced
deamination reaction25, 26
. However, this method has a major drawback. During heparin
activation with nitrous acid, fragmentation of heparin inadvertently occurs under the
acidic environment (pH 2.5) which is necessary for the reaction.25, 26
Hence, this method
is not suitable to conjugate the full length heparin. Another method for heparin activation
is using the EDC chemistry to functionalize the carboxyl groups on the heparin. The EDC
enables heparin activation without causing degradation of the heparin.27
Furthermore,
EDC-activated carboxyl groups of heparin which are not incorporated in the conjugation
reaction are rapidly reversed to their original carboxyl groups via hydrolysis.27
Therefore,
considering the merits of the EDC activation method, in this study, we chose to use the
EDC for the heparin activation.
For conjugation of T4.66 with the EDC-activated heparin, a short
heterobifunctional PEG (NH2-PEG-MAL, 3.5 kDa) was used as a cross-linker. Compared
with the small molecule cross-linkers, the PEG composed of extended and flexible
polymer chain can provide an effective way to alleviate aggregation issues which
frequently occurs during conjugation of highly charged bio-molecules. Indeed in this
study, by utilizing the EDC for heparin activation and the PEG as a cross-linker, T84.66
and heparin could be successfully conjugated to each other with no aggregation. The
preparation and purification of final the T84.66-Hep product was confirmed by the anion
exchange chromatogram (Figure 2A), SDS-PAGE result (Figure 2B) and the T84.66 and
heparin quantification results (Figure 2C).

91
Once the T84.66-Hep was successfully prepared, the CEA binding specificity of
T84.66-Hep was evaluated in vitro via cell binding assay and ELISA. From the cellular
studies using confocal microscopy, the binding of T84.66-Hep to the LS174T CEA high
expression cells was clearly visible (Figure 3), while, the T84.66-Hep showed only
minimal binding to the HCT116 CEA low expression cells and the LS174T cells pre-
treated with excess of unlabeled T84.66 (Figure 3). The CEA binding ability of T84.66-
Hep was, further, confirmed by the ELISA assay results. It was found that the T84.66-
Hep can bind to the CEA with slightly lower binding affinity (69% of T84.66) compared
with the T84.66 (Figure 4 and Table 1). However, caution is required for interpreting the
ELISA results, as it might be underestimating the actual CEA binding ability of T84.66-
Hep, because heparin conjugation to the T84.66 can not only affect the binding of T84.66
to the CEA, but also interfere the binding of goat anti-mouse-IgG-alkaline phosphatase to
the T84.66. Thus, the T84.66-Hep binding affinity to CEA might be higher than what is
reported here.
While the results showing specific CEA binding was encouraging, it is also
required for the T84.66-Hep to form a tight complex with the TAT-Gel to achieve tumor
targeted delivery. The plasma stability of the interaction between T84.66-Hep and TAT-
Gel was investigated in vitro using protamine beads. The study results showed that
majority of the T84.66-Hep (68%) could stably bind to the surface of protamine beads up
to 24 hrs (Figure 5). Although the interaction between T84.66-Hep and TAT-Gel is likely
to be weaker than that between T84.66-Hep and protamine, as protamine consists of more
basic residues (21 arginines) than TAT (6 arginines and 2 lysines)28, 29
, the result suggests
that T84.66-Hep can strongly bind to cationic peptides and maintain the bond in the

92
plasma. In a previous study, the plasma stability of TAT-Gel binding to immobilized
heparin was also investigated under similar experimental condition. It was found that
more than 80% of the TAT-Gel remained bound on the heparin beads after 24 hrs of
incubation at 37°C in the presence of plasma (Chapter 3). Considering the above study
results, the formation and maintenance of T84.66-Hep/TAT-Gel complex in vivo
appeared feasible.
Inspired by the promising in vitro assay results, the applicability of T84.66-Hep
for tumor targeted delivery of the TAT-Gel was investigated in vivo. Previously, NIR
dyes have been successfully applied for the live animal imaging, due to their great tissue
penetrating ability30, 31
and low background interference caused by animal tissues.30
Therefore, in this study, we labeled the TAT-Gel and the mAb samples including T84.66-
Hep with different NIR dyes, B4 and C5, respectively. The tumor targeting feature of
T84.66-Hep/TAT-Gel was demonstrated from the animal images. Localized
accumulation of T84.66-Hep-C5 was apparent in the tumor after administration of the
T84.66-Hep-C5/TAT-Gel-B4 (Figure 7A), while the images of the control mice
(administered with PBS, C5 or IgG-C5) showed no evidence of targeting (Figure 7B).
Furthermore, when the T84.66-Hep-C5 and TAT-Gel-B4 were simultaneously imaged in
the same mouse after administration of the T84.66-Hep-C5/TAT-Gel-B4, both the
components of the DDS were found co-localized in the tumor (Figure 7A and 8C).
Interestingly, higher tumor accumulation of TAT-Gel-B4 was achieved (7-fold
increase of AUC) by administration as a complex with IgG-Hep than by injection of
TAT-Gel alone (Figure 8A and 8B). This may be explained by extended blood circulation
of the TAT-Gel-B4 via complex formation (Figure 8B). However, the most dramatic

93
change in TAT-Gel tumor accumulation was accomplished by the T84.66-Hep-C5/TAT-
Gel-B4 administration. Remarkably, 58-fold increased drug exposure (AUC) of TAT-Gel
was accomplished by administration of the T84.66-Hep/TAT-Gel, compared with
injection of TAT-Gel alone. Overall, the hypothesis that TAT-Gel can be targeted to
tumor via complex formation with T84.66-Hep was evidenced by the in vivo imaging
studies.
4.6 Conclusions
In this research, a heparin functionalized mAb, T84.66-Hep, was developed for
tumor targeted delivery of a CPP-modified toxin, TAT-Gel. The T84.66-Hep was
successfully prepared by chemical conjugation using a heterobifunctional PEG as the
cross-linker. Both in vitro and in vivo assays demonstrated that T84.66-Hep can form a
complex with TAT-Gel, and, via specific binding to CEA expressed on the tumor cells,
T84.66-Hep could provide enhanced delivery of TAT-Gel to the tumor. By
administration of TAT-Gel as a complex with T84.66-Hep, significantly enhanced tumor
exposure of TAT-Gel (58-fold) was accomplished. Overall, this study demonstrated a
convenient but effective strategy to target and deliver highly potent toxins selectively to
tumor.
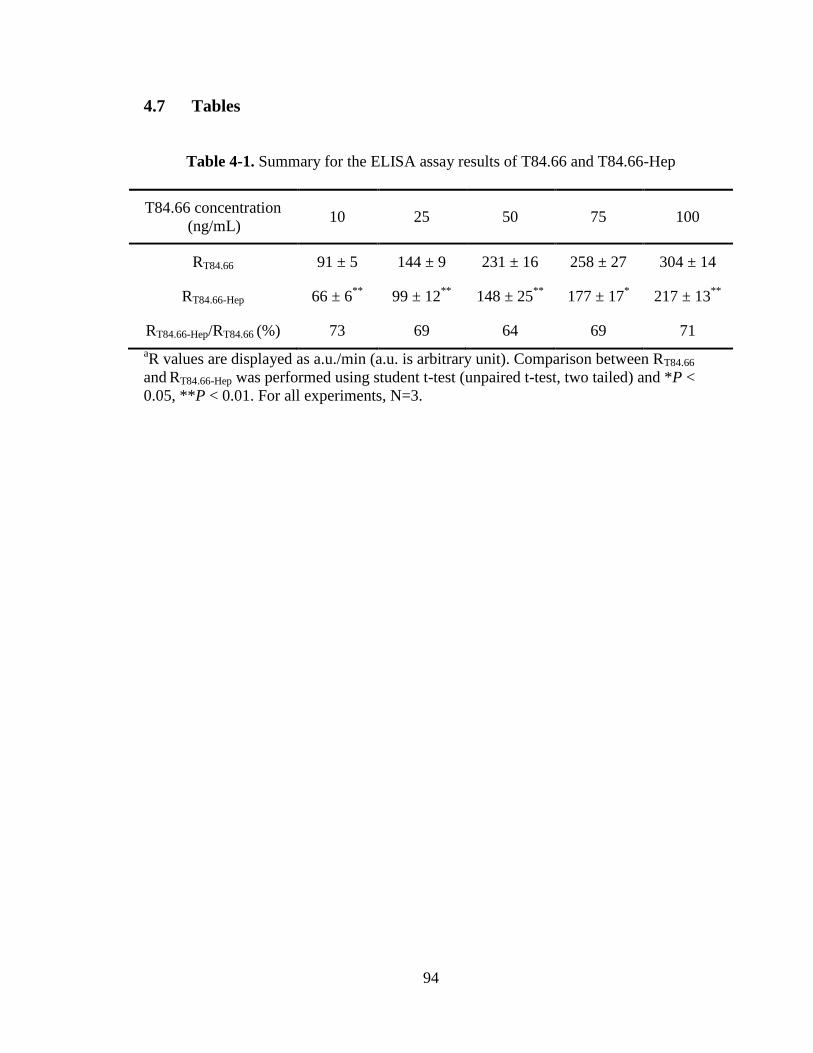
94
4.7 Tables
Table 4-1. Summary for the ELISA assay results of T84.66 and T84.66-Hep
T84.66 concentration
(ng/mL) 10 25 50 75 100
RT84.66 91 ± 5 144 ± 9 231 ± 16 258 ± 27 304 ± 14
RT84.66-Hep 66 ± 6**
99 ± 12**
148 ± 25**
177 ± 17* 217 ± 13
**
RT84.66-Hep/RT84.66 (%) 73 69 64 69 71
aR values are displayed as a.u./min (a.u. is arbitrary unit). Comparison between RT84.66
and RT84.66-Hep was performed using student t-test (unpaired t-test, two tailed) and *P <
0.05, **P < 0.01. For all experiments, N=3.

95
4.8 Figures
Figure 4-1. Schematic illustration of T84.66-Hep chemical conjugation.

96
Figure 4-2. Purification of T84.66-Hep.
(A) Chromatograms of T84.66 (upper) and T84.66-Hep (lower) from an anion exchange
column. The results are displayed with the RAU (relative absorbance unit) according to
the retention time (min). Buffer A: 50 mM phosphate buffer, B: 50 mM PBS (pH 7.4, 2
M NaCl). The NaCl gradient applied for elution of T84.66-Hep is displayed as a red
dotted line. T84.66-Hep was eluted at 0.8 - 1.8 M NaCl, while unreacted T84.66 eluted at
the beginning without NaCl gradient; (B) SDS-PAGE results of the two separate peak
fractions obtained from T84.66-Hep purification by anion exchange column. Lane M:
Mark12 protein molecular weight standard (Invitrogen, Carlsbad, CA). Lane 1 and 2:
peak fractions 1 and 2 from T84.66-Hep elution. Lane T: T84.66; (C) T84.66 and heparin
contents in the peak fractions 1, 2 or 2 after ultrafiltration (molecular weight cut-off: 100
kDa).

97
Figure 4-3. Confocal microscopic images of (A) HCT116 and (B) LS174T cells
incubated with rhodamine-labeled T84.66-Hep, and (C) LS174T cells incubated with 10-
fold molar excess of T84.66 followed by rhodamine-labeled T84.66-Hep.
Cell images were taken by Nikon A1R-A1 confocal laser microscope (Nikon Instruments
Inc., Melville, NY).

98
Figure 4-4. ELISA assay results of T84.66 and T84.66-Hep tested against recombinant
carcinoembryonic antigen (rCEA, R&D SYSTEMS).
T84.66 and T84.66-Hep of different concentrations (0, 10, 25, 50, 75 or 100 ng/mL) were
separately incubated with rCEA (400 ng/mL, 250 µL/well) coated on 96-well plates for 2
hours. After wash, the bound T84.66 and T84.66-Hep were further incubated with Fc
specific goat anti-mouse IgG-alkaline phosphatase. For detection, 100 µL of p-nitro
phenyl phosphate (1-step PNPP, Thermo Scientific) was added to each well and the
change in absorbance at 405nm (dA/dt) was monitored by a microplate reader using
kinetic mode. (CEA: carcinoembryonic antigen).

99
Figure 4-5. In vitro plasma stability of T84.66-Hep binding with cationic protamine
immobilized beads (Protamine-Agarose, Sigma-Aldrich).
100
Figure 4-6. Images of C5 and B4 under investigation of interference or quenching.
0 - 50 µg/mL of C5, B4, or mixture of C5 and B4 (1:1) were imaged at Ex/Em
wavelength of (A) 675nm/720nm (optimal for detection of C5); and (B) 745nm/800nm
(optimal for detection of B4) by IVIS®
spectrum imaging system (Xenogen, Alameda,
CA). (C5: Dylight 679-C5 dye and B4: Dylight 775-B4 dye)

101
Figure 4-7. Fluorescence images of athymic nude mice bearing LS174T xenograft tumor
after i.v. injection of (A) T84.66-Hep-C5/TAT-Gel-B4; (B) PBS, C5 or nonspecific
murine IgG-C5.
Animal images were taken using Cy5.5 filter at Ex/Em wavelength of 675 nm/720 nm
(specific for C5 detection) by IVIS® spectrum imaging system (Xenogen, Alameda, CA).
(C5: Dylight 679-C5 dye and B4: Dylight 775-B4 dye)

102
Figure 4-8. Fluorescence images of athymic nude mice bearing LS174T xenograft tumor
after i.v. injection of (A) TAT-Gel-B4; (B) non-specific IgG-Hep-C5/TAT-Gel-B4; or
(C) T84.66-Hep-C5/TAT-Gel-B4.
Animal images were taken using ICG filter with Ex/Em wavelength of 745 nm/800 nm
(specific for B4 detection) by the IVIS® spectrum imaging system (Xenogen, Alameda,
CA); (D) Scale bar for the relative fluorescence intensity. (C5: Dylight 679-C5 dye and
B4: Dylight 775-B4 dye)

103
Figure 4-9. Intra-tumor accumulation of TAT-Gel-B4.
(A) Mean fluorescence intensity of TAT-Gel-B4 in tumors after administration of TAT-
Gel-B4, IgG-Hep-C5/TAT-Gel-B4, or T84.66-Hep-C5/TAT-Gel-B4. The tumor from
each animal image taken by IVIS® spectrum imaging system (Xenogen, Alameda, CA)
was designated as the region of interest (ROI) and the fluorescence intensity of each ROI
was acquired by subtracting the mean fluorescence intensity of the corresponding ROI on
the control blank mice. The images were analyzed using Living Image 2.5 software
(Xenogen, Alameda, CA) and the results are displayed with the average radiance
(p/s/cm²/sr) according to time (hr); (B) Fluorescence images of the tumors dissected from
mice 6hrs after no treatment (blank), or administration of TAT-Gel-B4, IgG-Hep-
C5/TAT-Gel-B4, or T84.66-Hep-C5/TAT-Gel-B4.
104
4.9 References
1. Wu AM, Senter PD. Arming antibodies: prospects and challenges for
immunoconjugates. Nat Biotechnol 2005;23:1137-46.
2. Adams GP, Weiner LM. Monoclonal antibody therapy of cancer. Nat
Biotechnol 2005;23:1147-57.
3. Gold P, Freedman SO. Specific carcinoembryonic antigens of the human
digestive system. J Exp Med 1965;122:467-81.
4. Hammarstrom S. The carcinoembryonic antigen (CEA) family: structures,
suggested functions and expression in normal and malignant tissues. Semin
Cancer Biol 1999;9:67-81.
5. Meyer T, Gaya AM, Dancey G, Stratford MR, Othman S, Sharma SK, Wellsted
D, Taylor NJ, Stirling JJ, Poupard L, Folkes LK, Chan PS, Pedley RB, Chester
KA, Owen K, Violet JA, Malaroda A, Green AJ, Buscombe J, Padhani AR,
Rustin GJ, Begent RH. A phase I trial of radioimmunotherapy with 131I-A5B7
anti-CEA antibody in combination with combretastatin-A4-phosphate in
advanced gastrointestinal carcinomas. Clin Cancer Res 2009;15:4484-92.
6. Shibata S, Raubitschek A, Leong L, Koczywas M, Williams L, Zhan J, Wong
JY. A phase I study of a combination of yttrium-90-labeled anti-
carcinoembryonic antigen (CEA) antibody and gemcitabine in patients with
CEA-producing advanced malignancies. Clin Cancer Res 2009;15:2935-41.
7. Sharkey RM, Hajjar G, Yeldell D, Brenner A, Burton J, Rubin A, Goldenberg
DM. A phase I trial combining high-dose 90Y-labeled humanized anti-CEA
monoclonal antibody with doxorubicin and peripheral blood stem cell rescue in
advanced medullary thyroid cancer. J Nucl Med 2005;46:620-33.
8. Avila AD, Mateo de Acosta C, Lage A. A carcinoembryonic antigen-directed
immunotoxin built by linking a monoclonal antibody to a hemolytic toxin. Int J
Cancer 1989;43:926-9.
9. Neumaier M, Shively L, Chen FS, Gaida FJ, Ilgen C, Paxton RJ, Shively JE,
Riggs AD. Cloning of the genes for T84.66, an antibody that has a high
specificity and affinity for carcinoembryonic antigen, and expression of
chimeric human/mouse T84.66 genes in myeloma and Chinese hamster ovary
cells. Cancer Res 1990;50:2128-34.
10. Urva SR, Balthasar JP. Target mediated disposition of T84.66, a monoclonal
anti-CEA antibody: application in the detection of colorectal cancer xenografts.
MAbs 2010;2:67-72.
11. Keppler-Hafkemeyer A, Kreitman RJ, Pastan I. Apoptosis induced by
immunotoxins used in the treatment of hematologic malignancies. Int J Cancer
2000;87:86-94.
12. Hertler AA, Frankel AE. Immunotoxins: a clinical review of their use in the
treatment of malignancies. J Clin Oncol 1989;7:1932-42.
13. Ellman GL. Tissue sulfhydryl groups. Arch Biochem Biophys 1959;82:70-7.

105
14. Jaques LB, Wollin A. A modified method for the colorimetric determination of
heparin. Can J Physiol Pharmacol 1967;45:787-94.
15. Cole AJ, David AE, Wang J, Galban CJ, Hill HL, Yang VC. Polyethylene
glycol modified, cross-linked starch-coated iron oxide nanoparticles for
enhanced magnetic tumor targeting. Biomaterials 2011;32:2183-93.
16. Urva SR, Yang VC, Balthasar JP. An ELISA for quantification of T84.66, a
monoclonal anti-CEA antibody, in mouse plasma. J Immunoassay Immunochem
2010;31:1-9.
17. Troy T, Jekic-McMullen D, Sambucetti L, Rice B. Quantitative comparison of
the sensitivity of detection of fluorescent and bioluminescent reporters in animal
models. Mol Imaging 2004;3:9-23.
18. Billinton N, Knight AW. Seeing the wood through the trees: a review of
techniques for distinguishing green fluorescent protein from endogenous
autofluorescence. Anal Biochem 2001;291:175-97.
19. Agnelli G, Piovella F, Buoncristiani P, Severi P, Pini M, D'Angelo A,
Beltrametti C, Damiani M, Andrioli GC, Pugliese R, Iorio A, Brambilla G.
Enoxaparin plus compression stockings compared with compression stockings
alone in the prevention of venous thromboembolism after elective neurosurgery.
N Engl J Med 1998;339:80-5.
20. Sun IC, Eun DK, Na JH, Lee S, Kim IJ, Youn IC, Ko CY, Kim HS, Lim D,
Choi K, Messersmith PB, Park TG, Kim SY, Kwon IC, Kim K, Ahn CH.
Heparin-coated gold nanoparticles for liver-specific CT imaging. Chemistry
2009;15:13341-7.
21. Absar S, Choi S, Yang VC, Kwon YM. Heparin-triggered release of
camouflaged tissue plasminogen activator for targeted thrombolysis. J Control
Release 2012;157:46-54.
22. Kwon YM, Li YT, Liang JF, Park YJ, Chang LC, Yang VC. PTD-modified
ATTEMPTS system for enhanced asparaginase therapy: a proof-of-concept
investigation. J Control Release 2008;130:252-8.
23. Nagarajan M, Rao VS. Conformational studies of proteoglycans: theoretical
studies on the conformation of heparin. Biopolymers 1979;18:1407-20.
24. Chertok B, David AE, Yang VC. Magnetically-enabled and MR-monitored
selective brain tumor protein delivery in rats via magnetic nanocarriers.
Biomaterials 2011;32:6245-53.
25. Liang JF, Park YJ, Song H, Li YT, Yang VC. ATTEMPTS: a
heparin/protamine-based prodrug approach for delivery of thrombolytic drugs. J
Control Release 2001;72:145-56.
26. Shively JE, Conrad HE. Formation of anhydrosugars in the chemical
depolymerization of heparin. Biochemistry 1976;15:3932-42.
27. Wang XH, Li DP, Wang WJ, Feng QL, Cui FZ, Xu YX, Song XH. Covalent
immobilization of chitosan and heparin on PLGA surface. Int J Biol Macromol
2003;33:95-100.
28. Magzoub M, Graslund A. Cell-penetrating peptides: [corrected] from inception
to application. Q Rev Biophys 2004;37:147-95.
29. Park YJ, Chang LC, Liang JF, Moon C, Chung CP, Yang VC. Nontoxic
membrane translocation peptide from protamine, low molecular weight

106
protamine (LMWP), for enhanced intracellular protein delivery: in vitro and in
vivo study. FASEB J 2005;19:1555-7.
30. Frangioni JV. In vivo near-infrared fluorescence imaging. Curr Opin Chem Biol
2003;7:626-34.
31. Zou P, Xu S, Povoski SP, Wang A, Johnson MA, Martin EW, Jr., Subramaniam
V, Xu R, Sun D. Near-infrared fluorescence labeled anti-TAG-72 monoclonal
antibodies for tumor imaging in colorectal cancer xenograft mice. Mol Pharm
2009;6:428-40.

107
Chapter 5
Application of CPP-modified ATTEMPTS for Enhanced
Toxin-Based Colorectal Cancer Therapy: Proof-of-Concept
Investigation
5.1 Abstract
In the previous chapters, the two components of the CPP-modified ATTEMPTS,
recombinant TAT-gelonin chimera (TAT-Gel) and T84.66 and heparin chemical
conjugate (T84.66-Hep), were successfully produced and characterized for their
potencies. On this basis, the aim for this chapter was to combine the two components into
a DDS and evaluate the feasibility of applying CPP-modified ATTEMPTS for toxin-
based colorectal cancer therapy.
Cytotoxicity studies revealed that T84.66-Hep can effectively block the TAT-Gel
cell internalization, as T84.66-Hep/TAT-Gel complex yielded markedly reduced cell
death, compared with incubation of the cells with TAT-Gel alone. However, when
protamine was added to the cells pre-treated with the T84.66-Hep/TAT-Gel complex,
significantly higher level of cytotoxicity was observed, indicating successful reversal of
the heparin-mediated block of TAT. The PK and biodistribution studies further showed
that TAT-Gel could tightly bind with T84.66-Hep in the blood circulation and be

108
delivered to tumor. By administered as a complex with T84.66-Hep, the PK profiles of
TAT-Gel were markedly changed (17-fold increase of the plasma half-life) and, obvious
through biodistribution studies, significantly enhanced tumor exposure to TAT-Gel (58-
fold) was accomplished, in comparison with injection of TAT-Gel alone.
Based on the above encouraging results, the in vivo toxicity and therapeutic efficacy
of TAT-Gel in conjunction with the CPP-modified ATTEMPTS was evaluated in an s.c.
LS174T xenograft tumor mouse model. Compared with TAT-Gel, the T84.66-Hep/TAT-
Gel complex displayed significantly reduced toxicity. Furthermore, by T84.66-Hep/TAT-
Gel complex treatment followed with protamine injection (T84.66-Hep/TAT-Gel+Pro)
after 24 hrs, the most significant therapeutic effects (70% inhibition of tumor growth)
were accomplished, while no therapeutic effects were observed by administration of
TAT-Gel alone even at close to its maximum tolerable dose (MTD). Overall, this study
demonstrated the feasibility of CPP-modified ATTEMPTS application for enhanced
toxin-based cancer therapies.
5.2 Introduction
The previous chapters provided data for production and characterization of TAT-
Gel and T84.66-Hep, the two components of the CPP-modified ATTEMPTS. TAT-Gel
was proven for its great tumoricidal activity, which was further found controllable by
heparin/protamine-mediated regulation (Chapter 3). Moreover, it was realized that
T84.66-Hep can deliver TAT-Gel selectively to tumor by forming a tight complex (see
Chapter 4). Based on the previous findings, in this chapter, the functionality of CPP-
modified ATTEMPTS is investigated in vitro and in vivo.

109
The DDS is first evaluated in vitro by cytotoxicity studies on LS174T human
adenocarcinoma cell line, using similar protocols described in Chapter 3. Cytotoxicity
levels are assessed for the T84.66-Hep/TAT-Gels after preparation with various T84.66-
Hep-to-TAT-Gel molar ratios. The effect of protamine addition to the T84.66-Hep/TAT-
Gel cytotoxcity is also investigated, using different protamine-to-T84.66-Hep molar
ratios and addition time points.
After the in vitro characterizations, the in vivo stability, tumor targeting and acute
toxicity of the T84.66-Hep/TAT-Gel is further investigated by PK, biodistribution and
MTD determination studies. Based on the T84.66-Hep/TAT-Gel behavior profiles in the
body and the severity of toxicity, the dosing regimen and the protamine administration
time are determined. Finally, the therapeutic efficacy of TAT-Gel with the CPP-modified
ATTEMPTS is evaluated using a LS174T xenograft tumor bearing nude mice. Eventually,
the feasibility to apply this DDS for toxin-based cancer therapy is explored.
5.3 Materials and Methods
5.3.1 Cell Culture
LS174T human adenocarcinoma cells were purchased from American Type
Culture Collection (ATCC) (Manassas, VA). The cells were cultured in a 75 cm2 flask
and maintained in a humidified incubator at 37°C (5% CO2). The cells were cultured in
DMEM with 2 mM L-glutamine, high glucose, 1% (v/v) penicillin-streptomycin, and
10% FBS. Culture media in the flasks was replaced by fresh media every two days, and

110
the cells were sub-cultured when it was confluent, by detaching with 0.25% trypsin-
EDTA.
5.3.2 In Vitro Evaluation of CPP-Modified ATTEMPTS
The T84.66-Hep block of TAT-Gel cell internalization and protamine-induced
reversal of the heparin-mediated block was evaluated via cytotoxicity study using XTT
assay. LS174T cells were dispensed into 96-well plates at a density of 5 ×10³ cells per
well. When the cells were attached on the bottom of the plates, TAT-Gel and T84.66-
Hep/TAT-Gel were separately added to the wells (TAT-Gel concentration: 10-10
- 10-5
M,
N=3). T84.66-Hep/TAT-Gel was prepared by mixing the TAT-Gel with T84.66-Hep
(Hep:TAT = 3:1, 1:1, 1:3, 1:5 or 1:10) and incubation for 30 min at 4°C. To evaluate the
protamine-induced reversal of the T84.66-Hep block, different amount of protamine
sulfate (Hep:Pro molar ratio = 1:2, 1:1, 1:0.3 or 1:0.2) was immediately added to the cells
pre-incubated with T84.66-Hep/TAT-Gel (Hep:TAT = 1:3). Additionally, to evaluate the
effect of protamine addition time to the reversal of the T84.66-Hep inhibition, cells were
first incubated with T84.66-Hep/TAT-Gel (Hep:TAT = 1:3, 1 µM TAT-Gel conc.) and,
at different time points (2 hr-, 6 hr-, 24 hr-, 48 hr-post-incubation with T84.66-Hep/TAT-
Gel), washed with PBS and then treated with protamine (Hep:Pro = 1:10). Cells were
incubated at 37 °C for total 72 hrs after treatment of TAT-Gel or T84.66-Hep/TAT-Gel
and the relative cell proliferation was measured by XTT assay.
5.3.3 Animal Studies
All animal experiments were conducted according to protocols approved by the
University of Michigan Committee on Use and Care of Animals (UCUCA).

111
NIR Dye Labeling
The T84.66 and T84.66-Hep were labeled with Dylight 679-C5 (C5) and the rGel
and TAT-Gel were labeled with Dylight 775-B4 (B4), following the vendor’s protocol
(Thermo Scientific, Rockford, IL). Briefly, the protein samples (10 mg/mL in 20 mM
sodium bicarbonate buffer; pH 9.3) were incubated with 5-fold molar excess of the NIR
dyes (10 mg/mL in DMF) for 2 hrs at room temperature, and the labeled proteins were
purified using dye removal resins (Thermo Scientific, Rockford, IL).
Plasma Pharmacokinetics (PK) Analyses of T84.66, T84.66-Hep, rGel, TAT-Gel and
T84.66-Hep/TAT-Gel
PK studies for T84.66, T84.66-Hep, rGel, TAT-Gel and T84.66-Hep/TAT-Gel
were performed with C57BL/6 mice (body weight: 25 ~ 28 g, Charles Rivers
Laboratories, Raleigh, NC). Three days after arrival, the mice were randomly divided into
5 groups and administered with: 1) 11 mg/kg of T84.66-C5, 2) 11 mg/kg of T84.66-Hep-
C5, 3) 5 mg/kg of rGel-B4, 4) 5 mg/kg of TAT-Gel-B4 or 5) T84.66-Hep/TAT-Gel (11
mg/kg of T84.66-Hep and 5 mg/kg of TAT-Gel) via tail vein injection. At intended time
points, blood was collected and the plasma samples were obtained by centrifugation at
3000 rpm for 5 min. To determine the PK profiles of T84.66, blood was withdrawn at 0
hr, 1hr, 2 hr, 6 hr, 24 hr, 48 hr, 72 hr, 96 hr, 168 hr, 240 hr, 288 hr and 504 hr post-
injection (total 12 time points), and for the T84.66-Hep, blood was collected at 0 hr, 0.5
hr, 1 hr, 2 hr, 4 hr, 6 hr, 12 hr, 24 hr and 48 hr post-injection (total 9 time points). To
obtain the PK profiles of rGel and TAT-Gel, blood was taken at 0 min, 2 min, 5 min, 10
min and 30 min post-injection (total 5 time points), and for the T84.66-Hep/TAT-Gel,

112
blood was collected at 0 min, 5 min, 15 min, 30 min, 1 hr, 2 hr, 3 hr, 4 hr, 6 hr, 12 hr and
24 hr post-injection (total 11 time points).
The plasma samples were dispensed in a black 96 well plate and the fluorescence
intensity of each well was measured via the IVIS® spectrum imaging system (Xenogen,
Alameda, CA). The Ex/Em wavelength of 675 nm/720 nm was used for measurement of
the T84.66-C5 and the T84.66-Hep-C5 and the Ex/Em wavelength of 745 nm/800 nm
was utilized for assessment of both the rGel-B4 and TAT-Gel-B4. Exposure time (2 s),
binning (8), f/stop (4 for C5 labeled-T84.66 and T84.66-Hep, 1 for B4 labeled-rGel and
TAT-Gel) and fields of view (25 cm x 25 cm) were used identically for imaging the
samples. Each well of the images was designated as region of interest (ROI) and the
fluorescence intensity was analyzed using Living Image 2.5 software (Xenogen, Alameda,
CA). The fluorescence intensity of each ROI was determined by subtracting the mean
fluorescence intensity of blank wells. The plasma concentration of T84.66, T84.66-Hep,
rGel and TAT-Gel was calculated using standard curves prepared with the NIR dye
labeled standard solutions, and their PK profiles were analyzed by Phoenix WinNonlin
6.3 (Pharsight, Sunnyvale, CA).
LS174T S.C. Xenograft Tumor Mice Model
Male athymic nude mice (body weight: 23 ~ 27 g, 6 weeks old) were purchased
from Charles Rivers Laboratories (Raleigh, NC). Mice were housed in sterile animal
facilities and fed by standard chow diet. At day 0 (three days after arrival), LS174T cells
(5 × 10⁶
cells/mice) were implanted (s.c.) in the left flank region of the mice. For the
biodistribution studies, after tumor implantation, the mice were fed by special alfalfa-free
diet (AIN-76A rodent diet, gamma-irradiated, Research Diets, Inc, New Brunswick, NJ)

113
to reduce the autofluorescence during the tissue imaging.1 The tumor growth and the
body weight were monitored daily. The tumor size was measured using a vernier caliper
and the volume was calculated by the formula of V (mm3) = (w
2 x l) / 2. In the equation,
w is the width and l is the length of the tumor. The biodistribution and the efficacy studies
were performed when the average tumor size reached 500 mm3
(at day 25) and 30 mm3
(at day 3), respectively.
Biodistribution of TAT-Gel and T84.66-Hep/TAT-Gel
The tissue distribution of TAT-Gel and T84.66-Hep/TAT-Gel was determined in
LS174T xenograft tumor bearing mice. When the average tumor size reached about 500
mm3, the mice were administered with either 5 mg/kg of TAT-Gel-B4 or 2) T84.66-Hep-
C5/TAT-Gel-B4 (11 mg/kg of T84.66-Hep-C5 and 5 mg/kg of TAT-Gel-B4) via tail vein
injection. The mice injected with TAT-Gel were euthanized at 15 min, 1 hr, 5 hr and 24
hr post-injection, and the T84.66-Hep/TAT-Gel injected mice were euthanized at 2 hr, 24
hr, 48 hr and 72 hr post-injection, and the major organs including tumor, heart, liver,
spleen, lung, kidney and intestine were harvested. The fluorescence intensity of each
tissue was measured immediately by IVIS® spectrum imaging system (Xenogen,
Alameda, CA) and analyzed using Living Image 2.5 software (Xenogen, Alameda, CA).
The relative fluorescence intensity of each tissue sample was calculated by subtracting
the mean fluorescence intensity of corresponding tissue from the blank mouse.
Determination of Maximum Tolerable Dose (MTD)
The MTD of TAT-Gel and T84.66-Hep/TAT-Gel was tested in C57BL/6 mice
(body weight: 26 - 29 g, 6 weeks old, Charles Rivers Laboratories). The MTD was
defined as the maximum drug dose administered once bolus to non-tumor bearing mice

114
without mortality. The mice were administered with either TAT-Gel (dose: 9 mg/kg, 18
mg/kg, 36 mg/kg and 72 mg/kg) or T84.66-Hep/TAT-Gel (dose: T84.66-Hep 20 mg/kg
with TAT-Gel 9 mg/kg, T84.66-Hep 40 mg/kg with TAT-Gel 18 mg/kg and T84.66-Hep
80 mg/kg with TAT-Gel 36 mg/kg) via tail vein injection (N=3). The T84.66-Hep/TAT-
Gel was prepared by mixing the T84.66-Hep with the TAT-Gel and incubating for 30
min at room temperature. The mortality of the mice was monitored for 24 hr post-
injection.
In Vivo Efficacy Studies
Three days after tumor implantation (at day 3) when average tumor size reached
30 mm3, LS174T xenograft tumor mice were randomly divided into 5 groups and
received: 1) PBS, 2) TAT-Gel (7 mg/kg), 3) T84.66-Hep/TAT-Gel (21 mg/kg T84.66-
Hep and 7 mg/kg TAT-Gel), 4) T84.66-Hep/TAT-Gel+Pro (21 mg/kg T84.66-Hep, 7
mg/kg TAT-Gel and 10 mg/kg protamine) or 5) protamine (10 mg/kg) treatment. Each
mouse was treated three times with the above recipe at day 3, 6 and 9 via tail vein
injection. For each treatment, the T84.66-Hep/TAT-Gel was freshly prepared by mixing
T84.66-Hep with TAT-Gel and incubating for 30 min at 4ºC. For the T84.66-Hep/TAT-
Gel+Pro treatment, the T84.66-Hep/TAT-Gel was prepared and administered as above,
and protamine was injected via tail vein 24 hr post-injection of the complex. The tumor
size and body weight of the mice was measured daily.
5.3.4 Statistical Analysis
All measurements are presented as mean ± standard deviation. Statistically
significant differences among groups were determined using the one-way ANOVA and
Tukey’s multiple comparison test as post-hoc test (Prism version 5.0, GraphPad, San

115
Diego, CA). Results that yielded p-values less than 0.05 were considered to be
statistically significant.
5.4 Results
5.4.1 In Vitro Evaluation of CPP-Modified ATTEMPTS
The heparin inhibition of TAT-Gel cell internalization and protamine-induced
reversal of the heparin block was evaluated by cytotoxicity studies on LS174T cells. The
results are shown in Figure 1 and the IC50 values are summarized in Table 1. Treatment
of cells with T84.66-Hep/TAT-Gel showed no cell death (at concentration up to 5 µM of
TAT-Gel) with above 1:3 molar ratio (heparin:TAT), while high level of cytotoxicity
(IC50: 15.7 ± 12.2 nM) was observed by treatment with TAT-Gel alone (see Figure 1A
and Table 1). In comparison, when protamine was added to the cells pre-incubated with
the T84.66-Hep/TAT-Gel, significantly enhanced cytotoxicity was observed. Notably,
T84.66-Hep/TAT-Gel+Pro treatment (with heparin-to-protamine molar ratios of 1:2 to
1:0.2) yielded IC50 values close to that of TAT-Gel (Figure 1B and Table 1). Moreover,
this protamine-induced reversal of the heparin block was available even after 48 hrs post-
treatment of the T84.66-Hep/TAT-Gel (Figure 1C).
5.4.2 PK Profiles
The PK profiles of T84.66, T84.66-Hep, rGel, TAT-Gel and T84.66-Hep/TAT-
Gel were determined using C57BL/6 mice. The plasma concentration vs. time profile for
each sample is shown in Figure 2 and the various PK parameters (e.g., plasma half-live
(t1/2), clearance (CL), area under the curve (AUC) and volume of distribution at steady-
state (Vss)) calculated by multi-compartment model analyses are summarized in Table 2

116
and 3. The plasma concentration profile of T84.66 fit a 2-compartment model and the
plasma half-life of T84.66 was 2.5 days (Figure 2A and Table 2). In comparison, the
T84.66-Hep profile fit better a 1-compartment model and showed a relatively shorter
plasma half-life (2.76 ± 0.80 hr). The conjugation with heparin might have affected the
FcRn receptor binding of the T84.66, thereby, impeding the recycling of the antibody in
the blood circulation. This possibility was supported by severely hampered T84.66-Hep
binding to protein G resins (data not shown). When the T84.66-Hep was administered as
a complex with TAT-Gel, the kinetics fit a 2-compartment model and T84.66-Hep had
even shorter plasma half-life (2.22 ± 0.54 hr) (Figure 2A and Table 2).
The rGel and TAT-Gel both showed a similar monophasic plasma concentration
profile and were rapidly cleared from the blood circulation (t1/2 of rGel: 3.7 min (± 0.6)
and t1/2 of TAT-Gel: 4.7 min (± 0.5)) (Figure 2B and Table 3). As a comparison, TAT-
Gel as a complex with T84.66-Hep yielded significantly prolonged plasma half-life (68 ±
24 min) and the plasma profile fit better a 2-compartment model (Figure 2B and Table 3).
Comparison of the PK parameters of the TAT-Gel indicated that, via complex
formation with the T84.66-Hep, the CL of TAT-Gel was reduced by 3-fold (15.56 ± 3.07
mL·hr-1 5.00 ± 0.56 mL·hr
-1) leading to significantly increased AUC (8.94 ± 1.75
mg·hr·L-1
27.27 ± 3.09 mg·hr·L-1
). The Vss of TAT-Gel was also increased by 3-fold
(1.72 ± 0.31 mL 4.94 ± 1.99 mL), suggesting more extensive distribution of TAT-Gel
outside the blood circulation (Table 3).
5.4.3 Biodistribution Profiles of TAT-Gel and T84.66-Hep/TAT-Gel
Tissue distribution of TAT-Gel and T84.66-Hep/TAT-Gel was evaluated in
LS174T xenograft bearing nude mice. Figure 3A shows the images of dissected tissues

117
harvested from the mice administered with TAT-Gel-B4, at 15 min, 1 hr, 5 hr or 24 hr
post-injection. The relative fluorescence intensity of each tissue is shown in Figure 3B.
Figure 4A and 4B show the tissue distribution profiles of T84.66-Hep-C5 and TAT-Gel-
B4 in the tissues collected from the mice administered with T84.66-Hep-C5/TAT-Gel-B4,
at 2 hr, 24 hr, 48 hr or 72 hr post-injection. The relative fluorescence intensity of each
tissue is also shown in Figure 4A and 4B.
Certain background autofluorescence was detected only from the intestine when
imaged at Ex/Em wavelength of 675nm/720 nm, but not at 745nm/800 nm (Figure 3A,
4A and 4B). The TAT-Gel-B4 was mainly distributed in kidney and liver, but only weak
fluorescence signal was detected in the tumor (Figure 3A and 3B). In comparison, after
administration of T84.66-Hep-C5/TAT-Gel-B4, T84.66-Hep-C5 was observed largely in
the liver and tumor (Figure 4A), and TAT-Gel-B4 was found mainly in the kidney, tumor
and liver (Figure 4B). Based on the tissue images, it was clearly realized that enhanced
tumor accumulation of TAT-Gel-B4 was accomplished by administered as a complex
with T84.66-Hep-C5 (Figure 3 and 4B).
The fluorescence intensities of both the T84.66-Hep-C5 and TAT-Gel-B4 peaked
in the tumor 24 hr after administration of the T84.66-Hep-C5/TAT-Gel-B4 (Figure 4A
and 4B). Furthermore, both the tumor-to-kidney and the tumor-to-liver distribution ratios
of the TAT-Gel-B4 reached their maximum levels at 24 hr post-injection of the T84.66-
Hep-C5/TAT-Gel-B4 (Figure 4B). Therefore, 24 hr-post injection of the T84.66-
Hep/TAT-Gel was considered optimal for protamine administration.

118
5.4.4 Maximum Tolerable Dose (MTD) Assay
The MTD of TAT-Gel and T84.66-Hep/TAT-Gel was determined using non-
tumor bearing C57BL/6 mice. Injection of more than 18 mg/kg TAT-Gel caused death of
all the mice in the group (N = 3) within 24 hr post-injection, but no mice died at lower
than 9 mg/kg dose. Therefore, the MTD of the TAT-Gel was determined as 9 mg/kg. In
case of the T84.66-Hep/TAT-Gel, no mouse was dead even by administration of 80
mg/kg T84.66-Hep and 36 mg/kg TAT-Gel complex. As the above complex dose was
considered high, no studies were further performed for determining the MTD of the
T84.66-Hep/TAT-Gel.
5.4.5 In Vivo Efficacy Studies
The efficacy of TAT-Gel to treat colorectal cancer in conjunction of CPP-
modified ATTEMPTS was evaluated in LS174T xenograft tumor mice model. The
results are shown in Figure 5A and 5B. The tumor volumes of the mice treated with PBS,
TAT-Gel or protamine continued exponential growth and, at day 40, reached average size
of 1935.6 ± 429.6 mm3, 1981.9 ± 312.9 mm
3 and 2182.3 ± 417.2 mm
3, respectively.
Notably, no therapeutic effect was observed with TAT-Gel treatment even at dose (7
mg/kg) close to its MTD (9 mg/kg). In comparison, remarkably, T84.66-Hep/TAT-
Gel+Pro treatment yielded a 70% inhibition of the tumor growth (583.1 ± 202.2 mm3 at
day 40, p < 0.001***). The mice treated with T84.66-Hep/TAT-Gel without protamine
also yielded a 31% inhibition of tumor growth (1331.1 ± 365.5 mm3 at day 40, p < 0.05*).
During the efficacy studies, whereas the body weight of mice treated with PBS or
protamine continuously increased, the mice received TAT-Gel (15% weight loss by day
10), T84.66-Hep/TAT-Gel (1% weight loss by day 10) or T84.66-Hep/TAT-Gel+Pro

119
(8.5% weight loss by day 10) treatment experienced temporary loss of weight specifically
during the sample treatment (Figure 5C). However, no other apparent symptoms of
toxicity were observed and, since the last treatment at day 9, the body weight of the mice
received TAT-Gel, T84.66-Hep/TAT-Gel or T84.66-Hep/TAT-Gel+Pro treatment
gradually increased and eventually caught up that of the control mice (Figure 5C).
5.5 Discussion
While great anti-cancer activity of TAT-Gel was reported, its utilization for
cancer therapy remains a challenge, due to potential toxicity issues induced by
nonspecific internalization2. In this research, we explored in vitro and in vivo the
feasibility to apply the CPP-modified ATTEMPTS for toxin-based colorectal cancer
therapy.
The T84.66 mAb was chosen as the targeting moiety of the DD. Besides its
excellent targeting ability against CEA over-expressed tumors (e.g., colorectal cancer)3,
additionally, the non-internalizing property of the T84.66 was also a crucial factor.4 To
utilize the great translocation ability of the CPP, ideally, the targeted mAb-Hep/CPP-drug
should stably remain on the surface of the tumor cells until the CPP-drug is triggered
release by protamine.
Once the TAT-Gel and T84.66-Hep were both synthesized, the ‘prodrug’ feature
of the DDS was determined in cytotoxicity studies. Dose dependent inhibition of TAT-
Gel cell internalization was observed by T84.66-Hep. Especially, with molar ratios of
above 1:3 (Hep:TAT), the T84.66-Hep/TAT-Gel yielded no cytotoxicity (up to 5 µM of
TAT-Gel) (Figure 1A), suggesting that TAT-Gel cell internalization is completely

120
blocked by the T84.66-Hep. As a comparison, addition of protamine to the cells pre-
treated with the T84.66-Hep/TAT-Gel significantly enhanced the cytotoxic effect which
was close to that observed from the cells treated with TAT-Gel alone (Figure 1B).
The ‘targeting’ feature of the DDS was realized by biodistribution studies.
Compared with the tumor images harvested from the TAT-Gel administered mice (Figure
3), significantly higher accumulation of TAT-Gel was observed in the tumors dissected
from the mice administered with the T84.66-Hep-TAT-Gel (Figure 4B). This result was
in good accordance with the previous findings (Chapter 4). Remarkably, 58-fold
enhanced tumor exposure of TAT-Gel was accomplished by the complex formation with
the T84.66-Hep.
The in vivo complex stability of the T84.66-Hep/TAT-Gel was evidenced by the
PK and biodistribution profiles (Figure 2 and 4). Similar to the rGel, the TAT-Gel was
rapidly eliminated (t1/2: 4.7 ± 0.5 min) by renal excretion (supported by high disposition
of TAT-Gel in the kidney (Figure 3)), following a monophasic plasma profile. However,
by complex formation with T84.66-Hep, the plasma concentration profile of TAT-Gel
better fit a 2-compartment model, and the clearance rate was markedly reduced by 3-fold,
resulting in significant increase of plasma half-life (17-fold, 68 ± 24 min) (Figure 2B).
Meanwhile, the plasma concentration profiles of the T84.66-Hep as a complex with the
TAT-Gel also fit a 2-compartment model, and the plasma half-life was significantly
reduced (Figure 2A). This plasma stability of the T84.66-Hep/TAT-Gel was further
confirmed from the tissue distribution profiles. Both the T84.66-Hep and TAT-Gel
displayed similar accumulation profiles in the tumor along the time (Figure 4A and 4B).

121
The tissue distribution profiles, however, also raised certain issues. T84.66-Hep
showed high disposition in the liver but low in the kidney, while highest disposition of
TAT-Gel was observed in the kidney (Figure 4A and 4B). A possible explanation for this
is the presence of unbound or weakly bound TAT-Gel in the sample as we applied no
purification step after the complex formation. In regard to this problem, optimizations of
the mixing ratio of T84.66-Hep and TAT-Gel, or applications of more stringent binding
condition (e.g., higher salt concentration) and purification steps appears to be necessary
for solving the problem of TAT-Gel loss.
Encouraged by the promising outcome from the feature characterization, the in
vivo efficacy was evaluated using the nude mice with LS174T xenograft bearing mice.
The results are shown in Figure 5. TAT-Gel yielded no therapeutic effect even with dose
close to the MTD (9 mg/kg). This result was somewhat expected because TAT-Gel
displayed a short plasma half-life (4.7 ± 0.5 min) (see Figure 2 and Table 3) and very low
tumor accumulation (see Figure 3). In comparison, when the mice were treated with
T84.66-Hep/TAT-Gel, delayed tumor growth (31% inhibition of tumor growth, p <
0.05*) was observed (Figure 5A and 5B). Possibly, certain portion of the TAT-Gel might
have been released from the T84.66-Hep after delivered to the tumor. However, the most
crucial finding of this study was observed from the treatment group. Remarkably,
administration T84.66-Hep/TAT-Gel followed by injection of protamine (24 hr post-
injection of complex) yielded the highest therapeutic effect (70% inhibition of tumor
growth) (Figure 5A and 5B). This result substantiates the hypothesis that protamine can
reverse the inhibition of T84.66-Hep block in vivo and enable the release of TAT-Gel.

122
The in vivo toxicity of TAT-Gel was assessed through MTD assays. The TAT-Gel
caused severe acute toxicity with above 18 mg/kg dose, which caused death of all the
tested mice within 24 hrs. This toxicity level of TAT-Gel was greater than that reported
for gelonin (LD50 ~ 75 mg/kg)5 presumably due to enhanced nonspecific cellular uptake
in various organs. However, when TAT-Gel was administered as a complex with T84.66-
Hep, significantly reduced level of toxicity (no death of mice even with 36 mg/kg dose)
was observed. This reduced toxicity by complex formation with T84.66-Hep was further
evidenced by the body weight profile during the efficacy studies (Figure 5C). The
average body weight of the T84.66-Hep/TAT-Gel treated mice was similar to that of the
control mice (PBS treatment) along the time, while the treatment with TAT-Gel and
T84.66-Hep/TAT-Gel+Pro induced significant body weight loss during the treatment. A
possible explanation for the body weight loss of the treatment group could be due to
toxicity caused by the TAT-Gel released from T84.66-Hep by protamine. However,
importantly, the body weight of the mice was regained gradually since the last treatment
(at day 9) and no other symptoms were observed.
5.6 Conclusions
Overall, the feasibility to apply CPP-modified ATTEMPTS for toxin-based
colorectal cancer therapy was explored in this research. Through in vitro and in vivo
studies, appropriate functioning of both the ‘targeting’ and ‘prodrug’ features of the DDS
was confirmed. Targeted delivery of TAT-Gel to tumor via complex formation with the
T84.66-Hep was evidenced by PK and biodistribution studies. Also, through in vitro
cytotoxicity assays and in vivo efficacy studies, the protamine induced reversal of

123
T84.66-Hep block was realized. Although further optimization is in need in preparation
and purification of T84.66-Hep/TAT-Gel, this study clearly demonstrated that the DDS
can provide enhanced therapeutic efficacy as well as reduced toxicity.

124
5.7 Tables
Table 5-1. Summary for the cytotoxicity study results (IC50) after TAT-Gel, T84.66-
Hep/TAT-Gel or T84.66-Hep/TAT-Gel+Pro treatment
TAT-Gel T84.66-Hep/TAT-Gel T84.66-Hep/TAT-Gel+Pro
IC50 Hep:TAT IC50 Hep:Pro IC50
15.7 ± 12.2 1:0.3 > 5000 1:2 9.7 ± 1.5
1:1 > 5000 1:1 6.2 ± 2.2
1:3 > 5000 1:0.3 19.2 ± 9.1
1:5 > 5000 1:0.2 6.8 ± 3.6
1:10 2100 ± 520
IC50 values are displayed as nM. For all experiments, N=3.
Table 5-2. Summary for PK profiles of T84.66, T84.66-Hep and T84.66-Hep as a
complex with TAT-Gel
Samples t1/2 (β) (hr) CL (mL·hr-1
) AUC (mg·hr·L-1
) Vss (mL)
T84.66 > 2.5 days n.a. n.a. n.a.
T84.66-Hep 2.8 ± 0.8 0.3 ± 0.1 1400 ± 330 1.1 ± 0.1
T84.66-Hep/TAT-
Gel 2.2 ± 0.5 0.9 ± 0.2*** 460 ± 110*** 2.3 ± 0.3****
n.a.: not applicable. ***P < 0.001, ****P < 0.0001 by student t-test (unpaired t-test, two
tailed). For all experiments, N=5. (t1/2 (β): plasma half-life calculated by slope of terminal
phase, CL: clearance rate from plasma, AUC: area under the concentration/time curve,
Vss: volume of distribution at steady-state)

125
Table 5-3. Summary for PK profiles of rGel, TAT-Gel and TAT-Gel as complex with
T84.66-Hep
Samples T1/2 (β)
(min) CL (mL·hr
-1) AUC (mg·hr·L
-1) Vss (mL)
rGel 3.7 ± 0.6 22.1 ± 5.3 6.5 ± 1.4 1.9 ± 0.5
TAT-Gel 4.7 ± 0.5 16.3 ± 3.1 8.9 ± 1.8 1.7 ± 0.3
TAT-Gel/T84.66-
Hep 68 ± 24
*** 5.0 ± 0.6** 27.1 ± 3.1*** 4.9 ± 2.2**
** P < 0.001, *** P < 0.0001. For all experiments, N=5. (t1/2 (β): plasma half-life
calculated by slope of terminal phase, CL: clearance rate from plasma, AUC: area under
the concentration/time curve, Vss: volume of distribution at steady-state)

126
5.8 Figures
Figure 5-1. In vitro evaluation of CPP-modified ATTEMPTS on LS174T cells by XTT
assay.
(A) T84.66-Hep-mediated inhibition of TAT-Gel cell internalization; Reversal of T84.66-
Hep block by protamine with different concentration (B) or addition time (C) ((N=3).
n.s.: not significant, ** P < 0.001. (N.P.: no protamine)

127
Figure 5-2. Plasma clearance of T84.66, T84.66-Hep, rGel, TAT-Gel and T84.66-
Hep/TAT-Gel in mice.
(A) PK of T84.66, T84.66-Hep and T84.66-Hep as a complex with TAT-Gel; (B) PK of
rGel, TAT-Gel and TAT-Gel as a complex with T84.66-Hep. Each symbol represents the
mean concentration, and error bars indicate the standard deviation (N = 5).

128
Figure 5-3. Tissue distribution of TAT-Gel in athymic nude mice bearing LS174T
xenograft tumor.
(A) Representative images of the dissected mice organs sacrificed at 15 min, 1 hr, 5 hr or
24 h post-administration of TAT-Gel-B4. (B) Relative fluorescence intensity of each
organ normalized by the tissue weight (displayed as average radiance per gram tissue).

129
Figure 5-4. Tissue distribution of T84.66-Hep (A) and TAT-Gel (B) in athymic nude
mice bearing LS174T xenograft tumor after administration of T84.66-Hep-C5/TAT-Gel-
B4.
At 2 hr, 24 hr, 48 hr or 72 hr post-administration of T84.66-Hep-C5/TAT-Gel-B4, mice
were sacrificed and dissected organs were imaged. Relative fluorescence intensity of each
organ was calculated by subtracting the mean fluorescence intensity of corresponding
organ from the blank mouse. The relative fluorescence intensity was further normalized
by the tissue weight and displayed as average radiance per gram tissue.

130
Figure 5-5. In vivo efficacy study results in an LS174T s.c. xenograft tumor mice model.
(A) Tumor volume profiles as a function of time (days). When the tumor size reached ~
30 mm3
(at day 3), mice were divided into 5 groups (N=5) and received PBS (circle),
TAT-Gel (triangle), T84.66-Hep/TAT-Gel (reversed triangle), T84.66-Hep/TAT-Gel+Pro
(square) or protamine (diamond) treatment. The treatment was given by tail vein injection
at day 3, 6 and 9. For T84.66-Hep/TAT-Gel+Pro treatment, the T84.66-Hep/TAT-Gel
was administered at day 3, 6 and 9 and protamine was given 24 hrs after each treatment
of the T84.66-Hep/TAT-Gel. Tumor size was measured daily using a vernier caliper after
tumor inoculation (day 0) and the volume (mm3) was calculated by the following
equation, V = (a2
x b) / 2. In this equation, a represents the width and b represents the
length of the tumor. (B) Average tumor size of each group at day 40 when the tumor size
of the PBS treated group reached 2000 mm3. Data represent mean ± SD. *** P < 0.0001.
(C) Body weight change of each group during treatment.

131
5.9 References
1. Billinton N, Knight AW. Seeing the wood through the trees: a review of
techniques for distinguishing green fluorescent protein from endogenous
autofluorescence. Anal Biochem 2001;291:175-97.
2. Schwarze SR, Ho A, Vocero-Akbani A, Dowdy SF. In vivo protein
transduction: delivery of a biologically active protein into the mouse. Science
1999;285:1569-72.
3. Urva SR, Balthasar JP. Target mediated disposition of T84.66, a monoclonal
anti-CEA antibody: application in the detection of colorectal cancer xenografts.
MAbs 2010;2:67-72.
4. Bryan JN, Lewis MR, Henry CJ, Owen NK, Zhang J, Mohsin H, Jia F, Sivaguru
G, Anderson CJ. Development of a two-antibody model for the evaluation of
copper-64 radioimmunotherapy. Vet Comp Oncol 2004;2:82-90.
5. Woodhams J, Lou PJ, Selbo PK, Mosse A, Oukrif D, MacRobert A, Novelli M,
Peng Q, Berg K, Bown SG. Intracellular re-localisation by photochemical
internalisation enhances the cytotoxic effect of gelonin--quantitative studies in
normal rat liver. J Control Release 2010;142:347-53.

132
Chapter 6
Conclusions
6.1 Summary
In this research, CPP-modification was employed to facilitate the intracellular
delivery of gelonin. Two model CPPs, TAT and LMWP, were successfully linked to
gelonin via chemical conjugation and genetic recombination method. The prepared CPP-
modified gelonins (cG-L, rG-L and TAT-Gel) possessed equivalent N-glycosidase
activity to that of unmodified rGel. Moreover, the CPP-modified gelonins displayed a
markedly improved cell uptake and significantly enhanced tumoricidal activities,
compared with the rGel.
Although CPP-modification successfully enhanced the anti-cancer activity of
gelonin, it also aggravated the potential toxicity concerns due to nonspecific fashion of
the CPP-mediated cell uptake. To overcome this non-selective cell penetration of the
CPP-modified gelonins, a modified ATTMEPTS was investigated for the applicability.
Preliminary in vitro and in vivo studies demonstrated that the cell internalization of TAT-
Gel could be effectively regulated by masking the positive charge of TAT with heparin,
and reversing this block by protamine.
In order to provide specific tumor targeting properties for TAT-Gel, a heparin
functionalized mAb, T84.66-Hep, was developed by chemical conjugation. The prepared

133
T84.66-Hep possessed specific CEA binding ability and was able to bind tightly to
cationic protamine. Through live animal imaging, it was proven that T84.66-Hep can
selectively deliver TAT-Gel to tumor via complex formation.
Once the two components of the DDS, the TAT-Gel and the T84.66-Hep, were prepared
and characterized, the functionality of the CPP-modified ATTEMPTS was evaluated in
vitro and in vivo. Through PK, biodistribution, toxicity and efficacy studies, appropriate
functioning of the key features, ‘mAb mediated active tumor targeting’ and ‘prodrug’
were demonstrated.
Overall, this dissertation research provides the evidence that CPPs may serve as
tools to enhance the anti-cancer activity of potent but cell-impermeable macromolecules,
such as protein toxins. Also, this research demonstrates that CPP-modified ATTEMPTS
can provide an effective way to selectively and safely deliver the CPP-modified
macromolecules to the tumor site.
6.2 Future Studies
Based on the promising results of the proof-of-concept in vivo results, further
optimizations for preparation of the CPP-modified ATTEMPTS system are currently
proceeding in our laboratory. To reduce the unbound fraction of the TAT-Gel in the
sample, application of a purification step or optimization of the incubation condition is
considered. Also, to improve the binding strength between the TAT-Gel and T84.66-Hep,
different approaches (e.g., insertion of a tandem peptide sequence in between TAT and
gelonin, addition of more cationic residues in adjacent to the TAT peptide) are currently
underway. Furthermore, expanded PK and biodistribution studies will be performed for

134
PBPK (physiologically based PK) modeling, and thereby, protamine administration time
will be optimized.