a progressive geophysical exploration strategy at the shea...
TRANSCRIPT
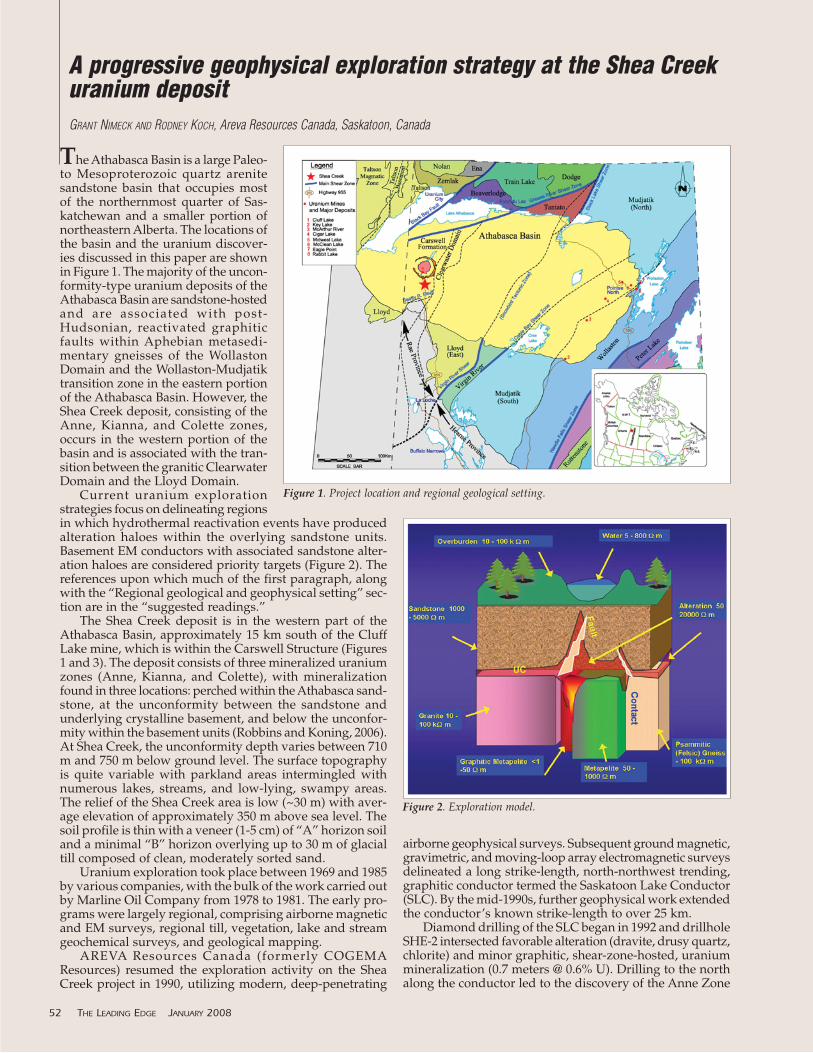
The Athabasca Basin is a large Paleo-to Mesoproterozoic quartz arenitesandstone basin that occupies mostof the northernmost quarter of Sas-katchewan and a smaller portion ofnortheastern Alberta. The locations ofthe basin and the uranium discover-ies discussed in this paper are shownin Figure 1. The majority of the uncon-formity-type uranium deposits of theAthabasca Basin are sandstone-hostedand are associated with post-Hudsonian, reactivated graphiticfaults within Aphebian metasedi-mentary gneisses of the WollastonDomain and the Wollaston-Mudjatiktransition zone in the eastern portionof the Athabasca Basin. However, theShea Creek deposit, consisting of theAnne, Kianna, and Colette zones,occurs in the western portion of thebasin and is associated with the tran-sition between the granitic ClearwaterDomain and the Lloyd Domain.
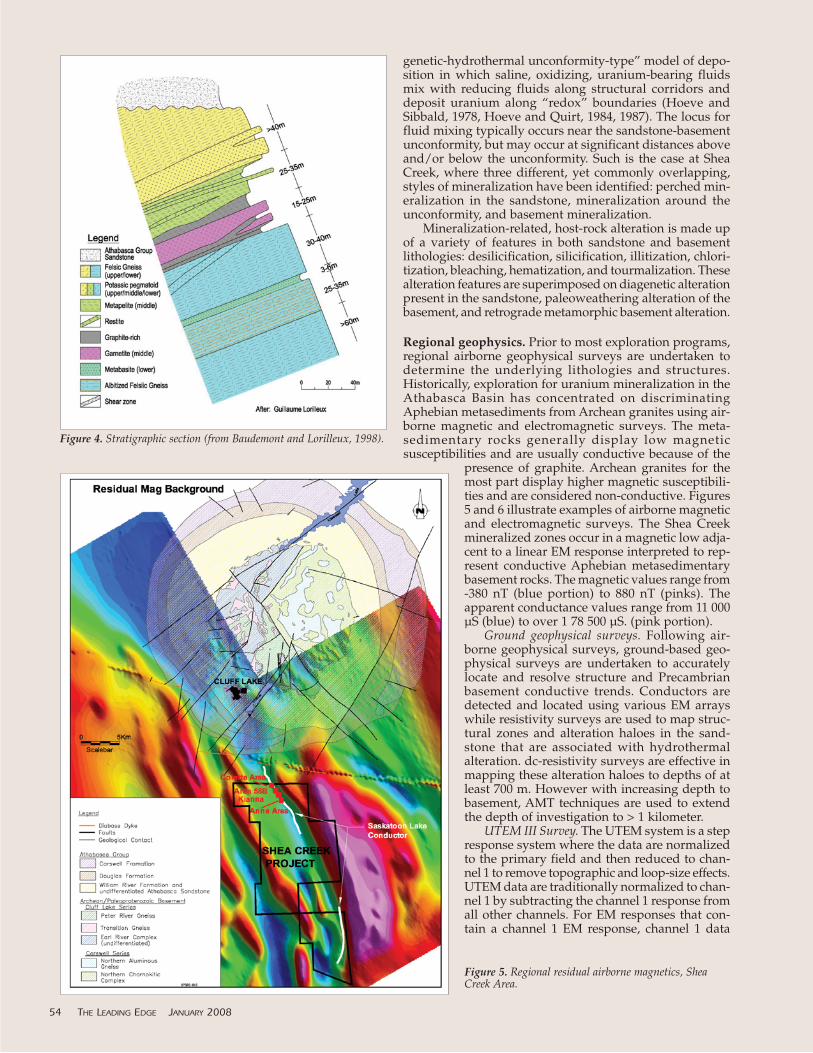
Current uranium explorationstrategies focus on delineating regionsin which hydrothermal reactivation events have producedalteration haloes within the overlying sandstone units.Basement EM conductors with associated sandstone alter-ation haloes are considered priority targets (Figure 2). Thereferences upon which much of the first paragraph, alongwith the “Regional geological and geophysical setting” sec-tion are in the “suggested readings.”
The Shea Creek deposit is in the western part of theAthabasca Basin, approximately 15 km south of the CluffLake mine, which is within the Carswell Structure (Figures1 and 3). The deposit consists of three mineralized uraniumzones (Anne, Kianna, and Colette), with mineralizationfound in three locations: perched within the Athabasca sand-stone, at the unconformity between the sandstone andunderlying crystalline basement, and below the unconfor-mity within the basement units (Robbins and Koning, 2006).At Shea Creek, the unconformity depth varies between 710m and 750 m below ground level. The surface topographyis quite variable with parkland areas intermingled withnumerous lakes, streams, and low-lying, swampy areas.The relief of the Shea Creek area is low (~30 m) with aver-age elevation of approximately 350 m above sea level. Thesoil profile is thin with a veneer (1-5 cm) of “A” horizon soiland a minimal “B” horizon overlying up to 30 m of glacialtill composed of clean, moderately sorted sand.
Uranium exploration took place between 1969 and 1985by various companies, with the bulk of the work carried outby Marline Oil Company from 1978 to 1981. The early pro-grams were largely regional, comprising airborne magneticand EM surveys, regional till, vegetation, lake and streamgeochemical surveys, and geological mapping.
AREVA Resources Canada (formerly COGEMAResources) resumed the exploration activity on the SheaCreek project in 1990, utilizing modern, deep-penetrating
airborne geophysical surveys. Subsequent ground magnetic,gravimetric, and moving-loop array electromagnetic surveysdelineated a long strike-length, north-northwest trending,graphitic conductor termed the Saskatoon Lake Conductor(SLC). By the mid-1990s, further geophysical work extendedthe conductor’s known strike-length to over 25 km.
Diamond drilling of the SLC began in 1992 and drillholeSHE-2 intersected favorable alteration (dravite, drusy quartz,chlorite) and minor graphitic, shear-zone-hosted, uraniummineralization (0.7 meters @ 0.6% U). Drilling to the northalong the conductor led to the discovery of the Anne Zone
A progressive geophysical exploration strategy at the Shea Creekuranium depositGRANT NIMECK AND RODNEY KOCH, Areva Resources Canada, Saskatoon, Canada
52 THE LEADING EDGE JANUARY 2008
Figure 1. Project location and regional geological setting.
Figure 2. Exploration model.

in 1995, the Colette Zone in 1997, and the Kianna Zone in2000. In 2004, COGEMA signed a joint venture agreementwith UEX Corporation to continue exploration along theShea Creek trend.
In 2004, an aggressive exploration strategy was under-taken with the completion of regional airborne EM andgravity gradiometer (MEGATEM and FALCON) surveysflown over large areas of the western Athabasca Basin. Since2004, a number of ground surveys have been completed overthe Shea Creek deposit, including acquiring a large 3D pole-pole array dc-resistivity block, transient audio magneto tel-luric (TAMT), TITAN 24, and a UTEM double-loop EMsurvey.
Regional geological and geophysical setting. The north-ern part of Saskatchewan is underlain by rocks of the west-ern Canadian Shield, comprising Archean and Proterozoichigh grade metamorphic crystalline basement that is, inpart, unconformably overlain by late Paleoproterozoic sed-imentary rocks of the Athabasca Basin and Phanerozoic sed-imentary rocks of Western Canandian Sedimentary Basin
(Figure 1). The crystalline basement issubdivided into the eastern HearnProvince and western Rae Provincealong the Snowbird tectonic zone. TheRae Province is further subdivided,south of the Grease River Shear Zone,into the Tantato, Lloyd, and Clear-water Domains, the latter cross-cutting the Lloyd Domain from south-west to northeast. The Shea Creek andCluff Lake uranium deposits lie withinthe western Lloyd Domain of the RaeProvince.
In the Shea Creek region, theAthabasca basement comprises agranulite facies metamorphic succes-sion of upper felsic quartzofeldspathicgneiss, middle aluminous (pelitic)gneiss, and lower felsic gneiss (Figure4.) The felsic gneisses also containbiotite ± garnet, while the aluminousgneiss are variably pelitic in compo-sition with quartz, bioite, and garnet,± graphite and cordierite
The William River Subgroup, thelowest part of the Athabasca Group,is present in the Shea Creek region. Itis dominated by fine- to coarse-grained, variously pebbly quartz aren-ites. Clay interclasts are common insome formations. Subordinate pebble-and cobble-conglomerate are also pre-sent in addition to minor mudstoneand clay-rich beds. The depositionalenvironment is interpreted as a seriesof fresh-water, fluvial, braided streamsystems that evolved in response tochanging uplift/subsidence relatingto regional tectonics and basin-fill.
The structural styles and ages ofthe sub-Athabasca basement rocksvary substantially and include earlyregional ductile and brittle-ductilestructures that predate the depositionof the Athabasca Group, as well assyn- and post-Athabasca brittle struc-
tures. Subsequent tectonic events during Phanerozoic timehave reactivated some of these earlier structures. At SheaCreek, the brittle structures that postdate the deposition ofthe Athabasca Group are considered favorable loci for explo-ration activity. The intersections of the early and late struc-tures provide the necessary “plumbing” to bringuranium-bearing oxidized sandstone brines in contact withreduced basement fluids to produce the redox-related ura-nium deposits.
The Shea Creek structural trend is defined by theSaskatoon Lake conductor (SLC), a northwest-southeast/,southwesterly-dipping graphitic zone. The conductor, inter-preted to be a large-scale reverse (thrust) structure orientedparallel or sub-parallel to the main foliation, dips moder-ately (30—50º) to the southwest. In local terminology, it iscommonly referred to as the “R3” structure. It is the earli-est mineralization-related structure. The Colette, Kianna,and Anne deposits all lie on, or are adjacent to this struc-ture.
The weak, polymetallic uranium mineralization at SheaCreek is considered to be a good representation of the “dia-
JANUARY 2008 THE LEADING EDGE 53
Figure 3. Project location map.
genetic-hydrothermal unconformity-type” model of depo-sition in which saline, oxidizing, uranium-bearing fluidsmix with reducing fluids along structural corridors anddeposit uranium along “redox” boundaries (Hoeve andSibbald, 1978, Hoeve and Quirt, 1984, 1987). The locus forfluid mixing typically occurs near the sandstone-basementunconformity, but may occur at significant distances aboveand/or below the unconformity. Such is the case at SheaCreek, where three different, yet commonly overlapping,styles of mineralization have been identified: perched min-eralization in the sandstone, mineralization around theunconformity, and basement mineralization.
Mineralization-related, host-rock alteration is made upof a variety of features in both sandstone and basementlithologies: desilicification, silicification, illitization, chlori-tization, bleaching, hematization, and tourmalization. Thesealteration features are superimposed on diagenetic alterationpresent in the sandstone, paleoweathering alteration of thebasement, and retrograde metamorphic basement alteration.
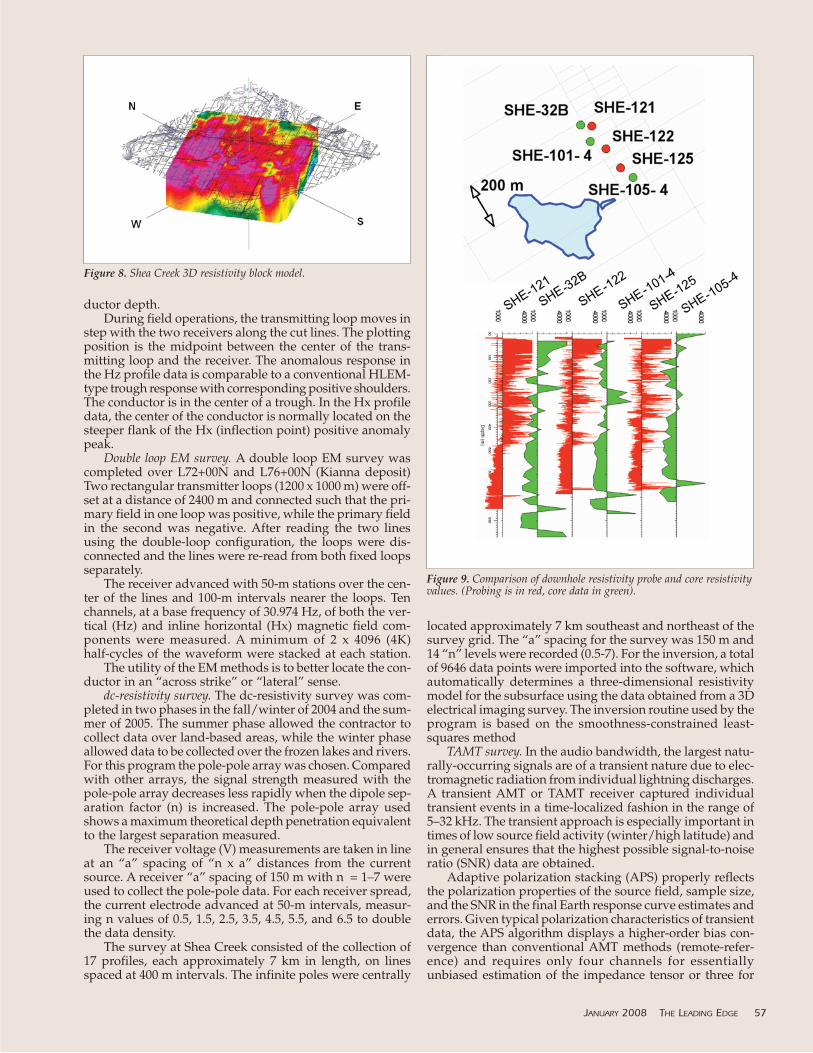
Regional geophysics. Prior to most exploration programs,regional airborne geophysical surveys are undertaken todetermine the underlying lithologies and structures.Historically, exploration for uranium mineralization in theAthabasca Basin has concentrated on discriminatingAphebian metasediments from Archean granites using air-borne magnetic and electromagnetic surveys. The meta-sedimentary rocks generally display low magneticsusceptibilities and are usually conductive because of the
presence of graphite. Archean granites for themost part display higher magnetic susceptibili-ties and are considered non-conductive. Figures5 and 6 illustrate examples of airborne magneticand electromagnetic surveys. The Shea Creekmineralized zones occur in a magnetic low adja-cent to a linear EM response interpreted to rep-resent conductive Aphebian metasedimentarybasement rocks. The magnetic values range from-380 nT (blue portion) to 880 nT (pinks). Theapparent conductance values range from 11 000µS (blue) to over 1 78 500 µS. (pink portion).
Ground geophysical surveys. Following air-borne geophysical surveys, ground-based geo-physical surveys are undertaken to accuratelylocate and resolve structure and Precambrianbasement conductive trends. Conductors aredetected and located using various EM arrayswhile resistivity surveys are used to map struc-tural zones and alteration haloes in the sand-stone that are associated with hydrothermalalteration. dc-resistivity surveys are effective inmapping these alteration haloes to depths of atleast 700 m. However with increasing depth tobasement, AMT techniques are used to extendthe depth of investigation to > 1 kilometer.
UTEM III Survey. The UTEM system is a stepresponse system where the data are normalizedto the primary field and then reduced to chan-nel 1 to remove topographic and loop-size effects.UTEM data are traditionally normalized to chan-nel 1 by subtracting the channel 1 response fromall other channels. For EM responses that con-tain a channel 1 EM response, channel 1 data
54 THE LEADING EDGE JANUARY 2008
Figure 4. Stratigraphic section (from Baudemont and Lorilleux, 1998).
Figure 5. Regional residual airborne magnetics, SheaCreek Area.

should be filtered as required andadded back into the other EM chan-nels. Measurements obtained fromselected areas in the Athabasca Basinsuggest ranges of Tau from <5 for poorconductors to >10 for good conduc-tors. The response parameter “τ” (tau)obtained by this process is then usedin simple approximation formulas todetermine conductance.
Normally, the output currenttransmitted into the loop wire isaccomplished using a continuous tri-angular waveform operating at a fre-quency of 31 Hz. Its signal in theground is sensed by a ferrite core coilthat responds to the time derivative ofthe local magnetic field (stepresponse). For each component, 10time channels are sampled that spanan interval from 25 microseconds to12.8 milliseconds. These data are dig-itally recorded within the receiverunit. Figure 7 illustrates the looparrays normally used to collect the EMdata.
Fixed and moving loop EM surveys.In fixed loop mode, the UTEM systemmakes use of large fixed rectangularloops. The loop size used is depen-dent upon the target depth. Loop sizescan range from 400 x 400 m for shal-low targets and up to a size of 2400 x2000 m for deep conductors. In thefixed loop mode, the profile data canbe presented either continuously orpoint normalized. In the case of con-tinuously normalized data, the com-ponent values (Hx and Hz) arereduced using the total primary fieldat each respective survey point, whilefor point-normalized data, a constantprimary field value is used at all sta-tions on that particular line. The pointof normalization is usually chosen atthe location of a suspected conductor.The point-normalized data preservethe shape of the anomaly and are used
for interpretation. Continuous normalization equalizes theamplitude of the response with respect to the location alongthe survey line. It is a good method for quickly determin-ing the presence of a conductor.
In the moving loop mode, all data are continuously nor-malized. Two receivers are generally used to collect the data.The size of the loop and the positioning of the two receiversare dependent upon the search depth. For small loop sizes,the magnetic field approximates a magnetic dipole asobserved by a distant receiver, however the dipole momentis small and for deeper targets it is necessary to increase thedipole moment by increasing the loop size. Receivers posi-tioned at a large distance from the transmitting loop tendto degrade the anomaly resolution. The best location for thereceiver with the conductor geometry is obtained where theprimary field lines cross the conductor at right angles. Agen-eral rule of thumb is that the loop size should approximatethe search depth, while the distance from the center of theloop to the receiver should be approximately twice the con-
56 THE LEADING EDGE JANUARY 2008
Figure 6. Apparent conductance derived from fifth-order moment B field Z data, Shea Creek area.
Figure 7. Common EM arrays.
ductor depth.During field operations, the transmitting loop moves in
step with the two receivers along the cut lines. The plottingposition is the midpoint between the center of the trans-mitting loop and the receiver. The anomalous response inthe Hz profile data is comparable to a conventional HLEM-type trough response with corresponding positive shoulders.The conductor is in the center of a trough. In the Hx profiledata, the center of the conductor is normally located on thesteeper flank of the Hx (inflection point) positive anomalypeak.
Double loop EM survey. A double loop EM survey wascompleted over L72+00N and L76+00N (Kianna deposit)Two rectangular transmitter loops (1200 x 1000 m) were off-set at a distance of 2400 m and connected such that the pri-mary field in one loop was positive, while the primary fieldin the second was negative. After reading the two linesusing the double-loop configuration, the loops were dis-connected and the lines were re-read from both fixed loopsseparately.
The receiver advanced with 50-m stations over the cen-ter of the lines and 100-m intervals nearer the loops. Tenchannels, at a base frequency of 30.974 Hz, of both the ver-tical (Hz) and inline horizontal (Hx) magnetic field com-ponents were measured. A minimum of 2 x 4096 (4K)half-cycles of the waveform were stacked at each station.
The utility of the EM methods is to better locate the con-ductor in an “across strike” or “lateral” sense.
dc-resistivity survey. The dc-resistivity survey was com-pleted in two phases in the fall/winter of 2004 and the sum-mer of 2005. The summer phase allowed the contractor tocollect data over land-based areas, while the winter phaseallowed data to be collected over the frozen lakes and rivers.For this program the pole-pole array was chosen. Comparedwith other arrays, the signal strength measured with thepole-pole array decreases less rapidly when the dipole sep-aration factor (n) is increased. The pole-pole array usedshows a maximum theoretical depth penetration equivalentto the largest separation measured.
The receiver voltage (V) measurements are taken in lineat an “a” spacing of “n x a” distances from the currentsource. A receiver “a” spacing of 150 m with n = 1–7 wereused to collect the pole-pole data. For each receiver spread,the current electrode advanced at 50-m intervals, measur-ing n values of 0.5, 1.5, 2.5, 3.5, 4.5, 5.5, and 6.5 to doublethe data density.
The survey at Shea Creek consisted of the collection of17 profiles, each approximately 7 km in length, on linesspaced at 400 m intervals. The infinite poles were centrally
located approximately 7 km southeast and northeast of thesurvey grid. The “a” spacing for the survey was 150 m and14 “n” levels were recorded (0.5-7). For the inversion, a totalof 9646 data points were imported into the software, whichautomatically determines a three-dimensional resistivitymodel for the subsurface using the data obtained from a 3Delectrical imaging survey. The inversion routine used by theprogram is based on the smoothness-constrained least-squares method
TAMT survey. In the audio bandwidth, the largest natu-rally-occurring signals are of a transient nature due to elec-tromagnetic radiation from individual lightning discharges.A transient AMT or TAMT receiver captured individualtransient events in a time-localized fashion in the range of5–32 kHz. The transient approach is especially important intimes of low source field activity (winter/high latitude) andin general ensures that the highest possible signal-to-noiseratio (SNR) data are obtained.
Adaptive polarization stacking (APS) properly reflectsthe polarization properties of the source field, sample size,and the SNR in the final Earth response curve estimates anderrors. Given typical polarization characteristics of transientdata, the APS algorithm displays a higher-order bias con-vergence than conventional AMT methods (remote-refer-ence) and requires only four channels for essentiallyunbiased estimation of the impedance tensor or three for
JANUARY 2008 THE LEADING EDGE 57
Figure 8. Shea Creek 3D resistivity block model.
Figure 9. Comparison of downhole resistivity probe and core resistivityvalues. (Probing is in red, core data in green).
the magnetic field tipper.The transverse electric (TE) mode occurs when the elec-
tric field lies parallel to strike. The transverse magnetic (TM)mode occurs when the electric field lies perpendicular tostrike. The TE mode is purely inductive, while the TM modeadditionally has a galvanic component inherent to itsresponse. This makes the TM mode higher-resolution withrespect to defining lateral contacts, and it is more robust to3D effects associated with conductive structure. However,
when searching for vertical conductors, for example, the TMmode is only weakly excited, while the TE mode can showa very strong response with large spatial extent. Therefore,the interpretational weight of each mode depends on theorientation (vertical, horizontal) and nature of the target(resistive, conductive) and the amount of 3D distortion inthe data.
For the Shea Creek program, interpretational emphasiswas placed on the tipper for mapping basement conductorsand the TE mode impedance for mapping shallow sandstonealteration. The TM mode impedance should be well-coupledto approximately flat-lying or very shallow-dipping, con-ductive structure at the depth associated with the SLC. Thesurvey used 50 m E field dipoles at each station. Stationswere spaced at 100-m intervals along the survey lines. BothE and H field data were recorded at all stations over thedeposits while H field data were recorded at 200-m inter-vals away from the deposits. The reduction in recording theH field data away from the deposits was facilitated toimprove survey productivity.
TITAN 24 survey. The Titan 24 system employs a dis-tributed array technology for data acquisition. The Titan sys-tem combines tensor magnetotelluric resistivity (MT) andgalvanic dc-resistivity and induced polarization (dcIP) sur-veys. By measuring 24 or more stations simultaneously,Titan can record and process a vast amount of data efficiently.By sampling more data, faster and simultaneously, the sys-tem provides increased reliability and accuracy of infor-mation compared to other methods.
For the dc-resistivity recordings, an extended hybridpole-dipole-dipole array was used. The contractor used areceiver configuration whereby 24 inline voltages and 12crossline voltages were recorded using 150-m dipoles, foran effective array of 3.6 km. The transmitter was frequencydomain using square-wave current. The receiver recordeda full-waveform time series with the data processing/out-put in frequency domain. The AMT used a remote-refer-enced base station with 24 inline Ex-field dipoles and 12crossline Ey-field dipoles.
Borehole physical property logging. To verify the results ofthe resistivity methods, rock physical property measure-ments were completed on core samples from five drillholes,obtained at 20 m intervals downhole. Downhole resistivitylogging was also completed in a series of drillholes in theKianna area to corroborate the results of the physical prop-erty measurements conducted on the core and the resultsof the surface resistivity survey programs.
For the downhole resistivity logging, a Dual GuardFocused Resistivity Slim Tool Sonde manufactured by GEO-VISTA provided a medium and a deep LL3 focused resis-tivity log with finer vertical resolution than the traditionalnormal resistivity sonde.
Discussion. The historical geophysical exploration pro-grams using airborne magnetic and electromagnetic surveyswere completed to outline favorable geological settings. Avariety of ground-based surveys were then conducted to fur-ther refine drill targets. These surveys comprised primarilyEM techniques; however, various other surveys were alsocompleted, such as magnetic, gravity, dc-resistivity, amongothers. Until recently, neither the software nor the comput-ing power required to invert the obtained data were read-ily available. With the advent of 3D dc-resistivity inversioncodes, the exploration approach has changed from groundEM surveys following up airborne EM conductors to com-pleting grid-based dc-resistivity surveys over the identifiedairborne EM conductors. The dc-resistivity surveys are con-
58 THE LEADING EDGE JANUARY 2008
Figure 10. Shea Creek, comparison of apparent resistivity: (a) -50 masl,(b) -250 masl, and (c) physical property values.
ducted to outline higher-priority tar-gets longitudinally along the strike ofthe conductors (particularly the SLC),followed by ground EM techniques tobetter locate the conductor positionlaterally across the conductor strike.
Following inversion of the appar-ent resistivity data, the data were geo-referenced and imported into a 3Dblock modeling program (Figure 8),and subsequent depth slices and ver-tical sections were derived from thismodel. For comparison purposes, allthe resistivity data are presented withthe same logarithmic color scale witha minimum of 50 ohm-m and maxi-mum of 10 000 ohm-m.
Physical property measurementswere determined on drill core taken at20 m intervals down 5 drillholes (DGS-15, SHE-32B, SHE-77, SHE-101-4, andSHE-105-4). The drill hole locationsare indicated by large dots in Figure9. These holes were chosen becausethey are in areas characterized by lowresistivity to moderate resistivity val-ues as outlined in the depth slice. SHE-77 was included as physical propertiesrelated to alteration of the sandstonesin this drillhole were considered rep-resentative of regional background.
The downhole in-situ resistivityvalues compare very favorably to theresistivity values obtained directlyfrom the core samples. Profilesobtained from the probe (red profiles)and core (green profiles) are presentedin Figure 9.
Resistivity values and calculatedporosity values are plotted in Figure10 as profiles for the 5 drillholes alongwith a -50 masl (300 m above theunconformity) and -250 masl (150 mabove the unconformity) depth slices.The porosity profiles for the uppersandstone display low values thatappear to be slightly variable, whilethe lower sandstone exhibits higherporosity values and less variability.The resistivity values show the oppo-site pattern, with the upper sand-stone values being more than 1 000 ohm-m and the values associatedwith the lower sandstone decreasing toapproximately 500 ohm-m. Thesetrends correspond with the dc-resistiv-ity depth slices providing the longitu-dinal prioritization along the SLC.
Increased clay content and higher fractures (i.e. increasedporosity) have been identified in drill core in areas display-ing low sandstone resistivity values in other uranium depositslocated in the Athabasca Basin.
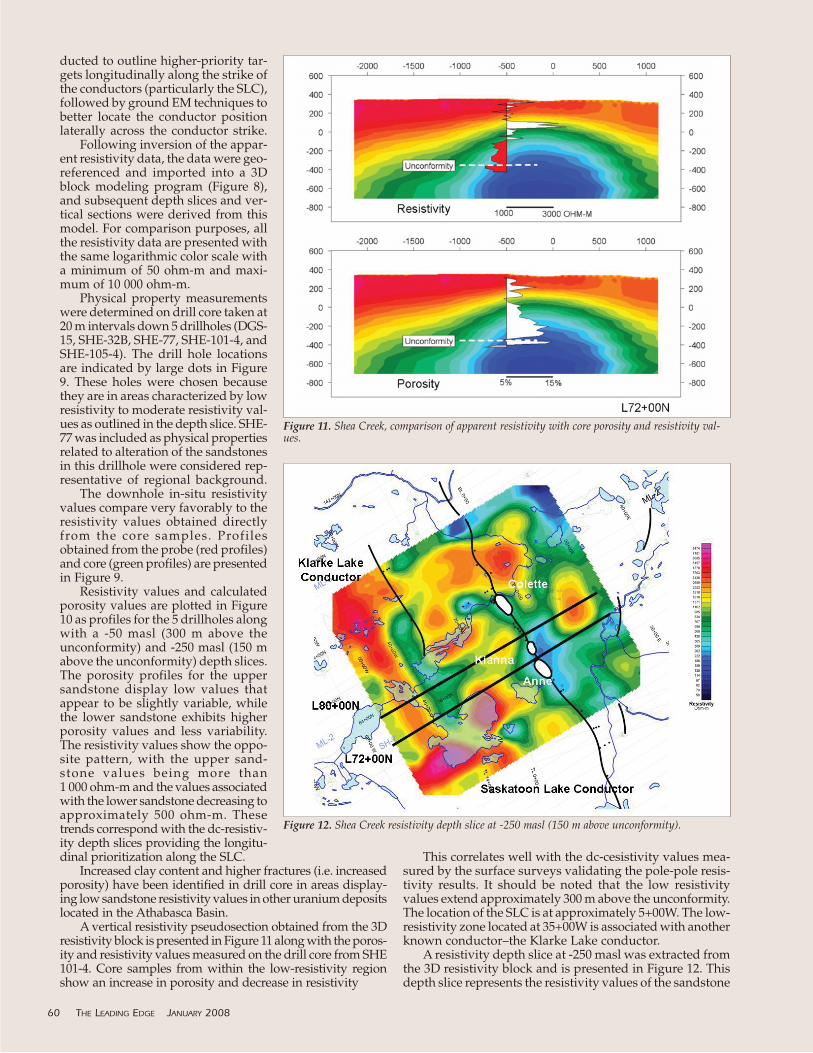
A vertical resistivity pseudosection obtained from the 3Dresistivity block is presented in Figure 11 along with the poros-ity and resistivity values measured on the drill core from SHE101-4. Core samples from within the low-resistivity regionshow an increase in porosity and decrease in resistivity
This correlates well with the dc-cesistivity values mea-sured by the surface surveys validating the pole-pole resis-tivity results. It should be noted that the low resistivityvalues extend approximately 300 m above the unconformity.The location of the SLC is at approximately 5+00W. The low-resistivity zone located at 35+00W is associated with anotherknown conductor–the Klarke Lake conductor.
A resistivity depth slice at -250 masl was extracted fromthe 3D resistivity block and is presented in Figure 12. Thisdepth slice represents the resistivity values of the sandstone
60 THE LEADING EDGE JANUARY 2008
Figure 11. Shea Creek, comparison of apparent resistivity with core porosity and resistivity val-ues.
Figure 12. Shea Creek resistivity depth slice at -250 masl (150 m above unconformity).
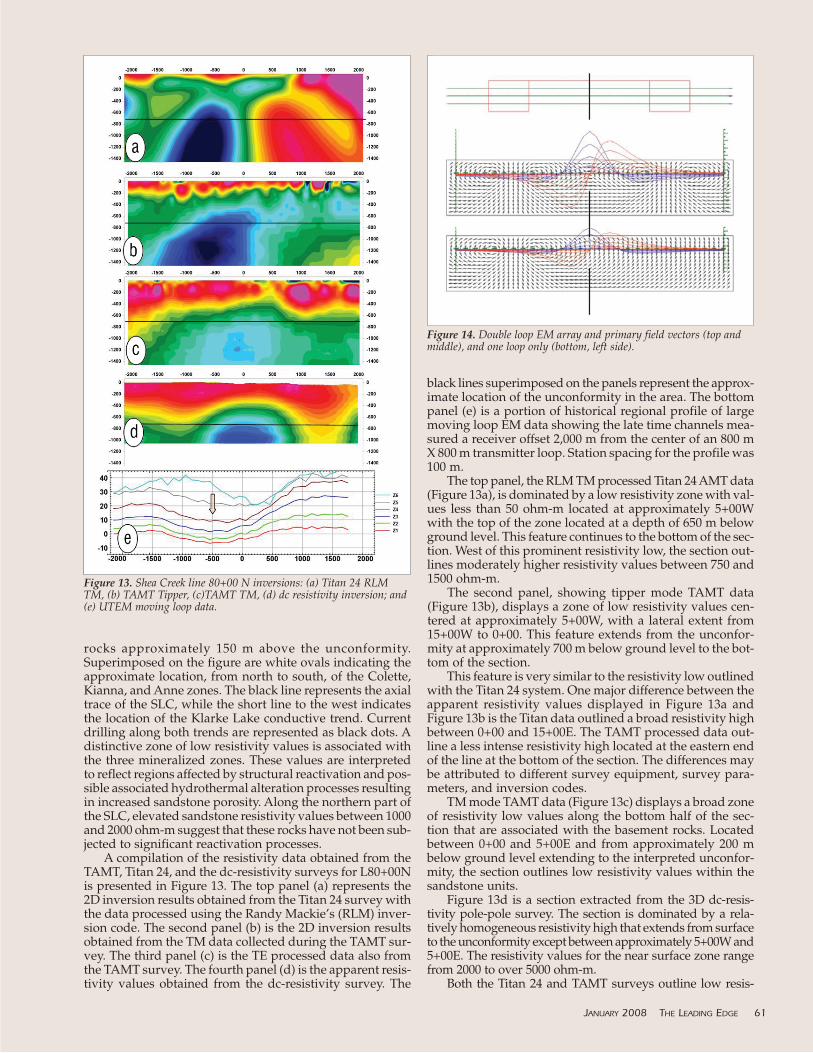
rocks approximately 150 m above the unconformity.Superimposed on the figure are white ovals indicating theapproximate location, from north to south, of the Colette,Kianna, and Anne zones. The black line represents the axialtrace of the SLC, while the short line to the west indicatesthe location of the Klarke Lake conductive trend. Currentdrilling along both trends are represented as black dots. Adistinctive zone of low resistivity values is associated withthe three mineralized zones. These values are interpretedto reflect regions affected by structural reactivation and pos-sible associated hydrothermal alteration processes resultingin increased sandstone porosity. Along the northern part ofthe SLC, elevated sandstone resistivity values between 1000and 2000 ohm-m suggest that these rocks have not been sub-jected to significant reactivation processes.
A compilation of the resistivity data obtained from theTAMT, Titan 24, and the dc-resistivity surveys for L80+00Nis presented in Figure 13. The top panel (a) represents the2D inversion results obtained from the Titan 24 survey withthe data processed using the Randy Mackie’s (RLM) inver-sion code. The second panel (b) is the 2D inversion resultsobtained from the TM data collected during the TAMT sur-vey. The third panel (c) is the TE processed data also fromthe TAMT survey. The fourth panel (d) is the apparent resis-tivity values obtained from the dc-resistivity survey. The
black lines superimposed on the panels represent the approx-imate location of the unconformity in the area. The bottompanel (e) is a portion of historical regional profile of largemoving loop EM data showing the late time channels mea-sured a receiver offset 2,000 m from the center of an 800 mX 800 m transmitter loop. Station spacing for the profile was100 m.
The top panel, the RLM TM processed Titan 24 AMT data(Figure 13a), is dominated by a low resistivity zone with val-ues less than 50 ohm-m located at approximately 5+00Wwith the top of the zone located at a depth of 650 m belowground level. This feature continues to the bottom of the sec-tion. West of this prominent resistivity low, the section out-lines moderately higher resistivity values between 750 and1500 ohm-m.
The second panel, showing tipper mode TAMT data(Figure 13b), displays a zone of low resistivity values cen-tered at approximately 5+00W, with a lateral extent from15+00W to 0+00. This feature extends from the unconfor-mity at approximately 700 m below ground level to the bot-tom of the section.
This feature is very similar to the resistivity low outlinedwith the Titan 24 system. One major difference between theapparent resistivity values displayed in Figure 13a andFigure 13b is the Titan data outlined a broad resistivity highbetween 0+00 and 15+00E. The TAMT processed data out-line a less intense resistivity high located at the eastern endof the line at the bottom of the section. The differences maybe attributed to different survey equipment, survey para-meters, and inversion codes.
TM mode TAMT data (Figure 13c) displays a broad zoneof resistivity low values along the bottom half of the sec-tion that are associated with the basement rocks. Locatedbetween 0+00 and 5+00E and from approximately 200 mbelow ground level extending to the interpreted unconfor-mity, the section outlines low resistivity values within thesandstone units.
Figure 13d is a section extracted from the 3D dc-resis-tivity pole-pole survey. The section is dominated by a rela-tively homogeneous resistivity high that extends from surfaceto the unconformity except between approximately 5+00W and5+00E. The resistivity values for the near surface zone rangefrom 2000 to over 5000 ohm-m.
Both the Titan 24 and TAMT surveys outline low resis-
JANUARY 2008 THE LEADING EDGE 61
Figure 13. Shea Creek line 80+00 N inversions: (a) Titan 24 RLMTM, (b) TAMT Tipper, (c)TAMT TM, (d) dc resistivity inversion; and(e) UTEM moving loop data.
Figure 14. Double loop EM array and primary field vectors (top andmiddle), and one loop only (bottom, left side).

tivity zones within the basement that correlate with the loca-tion of the SLC. The surveys also appear to outline a localizedzone of low resistivity values within the sandstone unitsbetween 0+00 and 5+00E. This layer is interpreted to repre-sent unaltered fresh sandstone rocks. The low resistivity zoneabove the approximate location of the unconformity may rep-resent evidence of hydrothermal and structural reactivationevents that have affected the sandstone in this region.
The UTEM Slingram profile (Figure 13e) displays a strongmigration of the EM fields from Z5 (mid-time channel) to Z1(late time channel), where the later time channels focus on thebasement SLC at 5+00W. There have been numerous internaldiscussions regarding the source of the mid-time anomaly at3+00E to 5+00E. It has been postulated that a weak, poorlygraphitic basement conductive trend is the source of the mid-time response. It corresponds to the location of the resistivitylow outlined by the dc-resistivity and TAMT TM-mode data.There does not appear to be any basement TAMT TE-moderesponse associated with this mid-time channel, and as such,this feature is likely related to a source within the sandstone.
The configuration of the double-loop EM array employstwo separate fixed loops connected in series with oppositepolarities to increase the amplitude of the primary field at theconductor at depth, over what would be achievable with aconventional fixed loop array.
As well, the array increases the region within the earthwhere the primary field would be optimally coupled to ver-tical conductors. Figure 14 presents a model comparing theconventional fixed-loop array to the double-loop array.Continuously normalized Hx and Hz profiles of the doubleloop results are presented in Figure 15 for L72+00N. The sin-gle fixed Loop data are merged into one Combined double-loop EM data set in Figure 16.
Both the Hx and Hz components of the double-loop andCombined double-loop EM results are extremely similar intheir response. This would indicate that there is no need tophysically connect the loops together to increase the primaryfield to energize basement conductors. The primary disad-vantage of using separate loops and combining the data wouldbe that the survey line has to be read from both loops dou-bling the survey time.
Conclusion. Physical property studies conducted on drill corecorroborate the dc-resistivity results. It appears that AMT isalso capable of delineating resistivity lows within the sand-stone units that may reflect hydrothermal alteration zones.
Combined dc-resistivity and AMT surveys are effective explo-ration strategies in deep-basin environments to outline base-ment conductors.
The downhole resistivity probe data and the physicalproperty resistivity values measured on the sandstone com-pare very favorably with the surface resistivity data. This fur-ther supports the conclusion that the resistivity values andapparent depths obtained from the inversions are reasonable.
The 3D dc-resistivity survey over the Shea Creek depositclearly images an intense resistivity low apparently locatedin the lower sandstone. This low-resistivity region may be inter-preted to represent structural reactivation associated with pos-sible hydrothermal alteration along the EM conductor–afavorable loci for uranium mineralization. Resistivity surveysare thus an effective way to prioritize airborne EM targets andto optimize drilling programs by providing locations of highpriority portions along the SLC.
Historically, a common approach to exploration projectswas to fly to prospective areas with airborne EM and mag-netic surveys to identify favorable basement conductors andmagnetic lithologies. This was followed by ground-based EMsurveys to verify the airborne results. This approach resultedin identification of portions of the conductor that have a longtime constant indicating higher conductivity. Conductorsexhibiting high time constants are considered higher prioritytargets. There was little attempt to upgrade these targets byobtaining evidence of hydrothermal activity and structuralreactivation associated with the basement conductors. This his-torical approach has changed as a result of the great improve-ments that have been made in geophysical modeling softwareand data acquisition hardware.
Present and future exploration projects use, or will use, amore integrated approach, including acquisition of airborneEM surveys combined with high sensitivity magnetics and air-borne gravity gradiometry and current geological knowledge.Priority airborne targets are then followed up on the groundusing either dc-resistivity or AMT depending on the requireddepth of investigation. Positive results–identification of anom-alous regions along the strike of the conductor trace–providethe location(s) for focused ground EM surveys which then pro-vide better locations of the conductor across the strike of theairborne conductor trace.
This approach will provide improved vectoring to thehighest priority drill targets while reducing the drilling timealong less prospective portions of otherwise lengthy conduc-tor traces.
62 THE LEADING EDGE JANUARY 2008
Figure 15. Shea Creek L72+00N: Double loop UTEM III, inline horizontal and vertical (right) components (L72+00N).
Figure 16. Shea Creek L72+00N: Combined double loop UTEM III,inline horizontal and vertical components.

Acknowledgements. The authors thank the following for their cooperationand assistance: the AREVAgeologists and geophysicists who directly workedon or oversaw these discoveries; joint venture partner UEX Corp.; numer-ous contractors and consultants. In particular, the authors thank D. Quirtfor his review of the paper. TLE
Corresponding author: [email protected].
Suggested reading. “Shea Creek project–Anne mineralized zone.Lithostratigraphy, structural geology, hydrothermal breccias” byBaudemont and Lorilleux (COGEMA Resources Internal Report,1998). “Magnetotellurics in the context of the theory of ill-posedproblems” by Berdichevsky and Dmitriev (SEG ExpandedAbstracts, 2002). “New investigations of basement to the west-ern Athabasca Basin, in Summary of Investigations” by Card(Saskatchewan Geological Survey, 2002). “The Shea Creekdeposits, West Athabasca Basin, Saskatchewan” by Carroll et al.2006, (Uranium Field Conference, Saskatoon, 2006).“Occam’sinversion to generate smooth, two-dimensional models frommagnetotelluric data” by deGroot-Hedlin and Constable,(GEOPHYSICS, 1990). “Transient Magnetotellurics with adaptivepolarization stacking” by Goldak and Goldak, SEG ExpandedAbstracts, 2001). “The Carswell formation, northernSaskatchewan: stratigraphy, sedimentology, and structure in TheCarswell Structure Uranium Deposits, Saskatchewan” edited byLaine et al. (Geological Association of Canada, 1985). “On the gen-esis of Rabbit Lake and other unconformity-type uranium depositsnorthern Saskatchewan, Canada” by Hoeve and Sibbald (EconomicGeology, 1978). “Mineralization and host rock alteration in rela-tion to clay mineral diagenesis and evolution of the middle-Proterozoic Athabasca Basin, northern Saskatchewan, Canada”by Hoeve and Quirt (Saskatchewan Research Council, Technical
Report, 1984). “A stationary redox front as a critical factor in theformation of high-grade unconformity-type uranium ores in theAthabasca Basin, northern Saskatchewan” by Hoeve and Quirt(Bulletin Mineralogique, 1987). “Shea Creek–A Deep GeophysicalExploration Discovery” by Koch and Dalidowicz (MinExpo’96).“Applications of wideband, time domain, EM measurements inmineral exploration” by Lamontagne (Geophysics Laboratory, 1975).“Approximate inverse mappings in dc resistivity problems” byLi and Oldenburg (Geophysical Journal International, 1992). “Rapidleast-squares inversion of apparent resistivity pseudosections bya quasi-Newton method” by Loke and Barker, (GeophysicalProspecting, 1996). “Rapid 3D Resistivity and IP inversion usingthe least-squares method (For 3D surveys using the pole-pole,pole-dipole, dipole-dipole, rectangular, Wenner, Wenner-Schlumberger and non-conventional arrays) on land, underwa-ter and borehole surveys” by Loke (RES3DINV manual, 2005).“Geology of the Athabasca Group (Helikian) in northernSaskatchewan” by Raemakers (Saskatchewan Energy and MinesReport, 1990). “Shea Creek Deposit, West Athabasca BasinCanada” by Robbins and Koning (abstract presentation, UraniumField Conference, 2006). “Nonlinear conjugate gradients algo-rithm for 2D magnetotelluric inversion” by Rodi and Mackie(GEOPHYSICS, 2001). “Three-dimensional resistivity inversion usingthe finite element method” by Sasaki. (SEG Expanded Abstracts,1992). “Saskatchewan Geological Survey: Geology, and mineraland petroleum resources of Saskatchewan” by Sasaki(Saskatchewan Industry and Resources, Miscellaneous Report2003). “Magnetotelluric surveying one can afford: Interpretationof MT sounding profiles in natural environments” byWannamaker (International Symposium on Three-DimensionalElectromagnetics, 1995). “A new survey design for 3D IP model-ing at Copper hill” by White et al. (Exploration Geophysics, 2001).
JANUARY 2008 THE LEADING EDGE 63