a profile of the working population of large towns - cso.ie · portlaoighise working population...
TRANSCRIPT

Portlaoighise
54
Portlaoighise Working population 6,601 Catchment area by Electoral Division
5,018 workers resided in Portlaoighise in April 2006. Of these, 2,615 worked outside the town leaving 2,403 persons who both lived and worked in the town. A further 4,198 workers travelled into Portlaoighise to work resulting in a working population of 6,601. Portlaoighise was therefore a net gainer in employment terms. Public administration and defence was the most important industry sector accounting for just over one in five jobs in April 2006 and reflecting the importance of the prison as a local employer. The wholesale and retail and health sectors accounted for a further 35 per cent of workers. Despite a reasonably good rail service just under 2 per cent of workers travelled by either bus or train. The preferred means of travel was the car accounting for 80 per cent of daily commuters. Portarlington, Stradbally, Abbeyleix, Mountrath and Mountmellick were the major sources of commuters into Portlaoighise each day.
●
●
●●
●
●
●
●
●
●
●
●●
●
●
●
●
●
●
●
●●●
●
●
●
●
●
●
●
●●
●
●
●
●
●
●
●
●
●●
●●
●
●
●
●
●
●●
●
●●
●
●
●
●
●●
●
●●
●
●
●
●
●
●
●
●●
●
●
●
●
●
●
●
●●
●
●
●
●
●
●
●
●●●
●
●
●
●
●
●
●
●●
●
●
●
●
●
●
●
●
●●
●●
●
●
●
●
●
●●
●
●●
●
●
●
●
●●
●
●●
●
●
●
●
●
Birr
Kill
Naas
Athy
Ferns
Clane
Durrow
Borris
Ballon
Tullow
Carlow
Carnew
Carragh
Thurles
Roscrea
Cloghan
FerbaneSallins
Kildare
Mucklagh
Shinrone
Suncroft
BunclodyKilkenny
Daingean
Dunlavin
Holycross
Blackwood
Johnstown
Clonaslee
Abbeyleix
Mountrath
Moneenroe
Paulstown
Freshford
Rathvilly
Kilcormac
TullamoreKilmeague
Allenwood NewcastleRathcoole
Rathangan
Kilcullen
Templemore
Ballylynan
Rathdowney
Stradbally
UrlingfordMuinebheag
Prosperous
Calverstown
BallyraggetCastlecomer
Hacketstown
Blessington
Baltinglass
Mountmellick
Castledermot
Monasterevin
Twomileborris
Portarlington
Bennetsbridge
Droichead Nua
Leighlinbridge
Ballymore Eustace
Portlaoighise
No. of Workers0 - 20
21 - 50
51 - 100
101 - 500
501 - 1000
1001 and above
0 7 14 21 283.5Kilometers

Portlaoighise
55
Industrial Group
Total resident workers
Residents working outside
town
Workers living and working in
town
Workers travelling
from outside town
Working population
[A + B] [A] [B] [C] [B + C]Agriculture, forestry and fishing 40 30 10 32 42Manufacturing* 545 401 144 309 453Construction 407 290 117 247 364Wholesale and retail trade 921 352 569 652 1,221Hotels and restaurants 369 118 251 176 427Transport, storage and communications 330 206 124 231 355Banking and financial services 201 148 53 105 158Real estate, renting and business activities 341 201 140 261 401Public administration and defence 598 234 364 1,036 1,400Education 364 219 145 246 391Health and social work 647 297 350 722 1,072Other community, social and personal service activities
225 101 124 163 287
Industry not stated 30 18 12 18 30Total 5,018 2,615 2,403 4,198 6,601
*Includes Mining, quarrying and turf production and Electricity, gas and water supply
Level of Education
Total resident workers
Residents working outside
town
Workers living and working in
town
Workers travelling
from outside town
Working population
[A + B] [A] [B] [C] [B + C]Primary Education or none 221 101 120 176 296Lower Secondary 758 362 396 648 1,044Leaving Cert., Technical or Vocational 1,670 817 853 1,529 2,382Third level or higher 1,737 1,018 719 1,540 2,259Persons still in education (incl. not stated) 632 317 315 305 620Total 5,018 2,615 2,403 4,198 6,601
Socio-Economic Group
Total resident workers
Residents working outside
town
Workers living and working in
town
Workers travelling
from outside town
Working population
[A + B] [A] [B] [C] [B + C]A Employers and managers 716 384 332 565 897B Higher professional 309 185 124 233 357C Lower professional 730 413 317 824 1,141D Non-manual 1,795 700 1,095 1,711 2,806E Manual skilled 587 392 195 395 590F Semi-skilled 508 326 182 255 437G Unskilled 222 121 101 120 221H Own account workers 102 66 36 54 90Others including farmers, agricultural workers and not stated (I, J & Z) 49 28 21 41 62Total 5,018 2,615 2,403 4,198 6,601

Sligo
56
Sligo Working population 13,398 Catchment area by Electoral Division
●
●
●
●
●
●
●
●
●
●
●
●
●
●
●
●
●
●
●
●
●
●
●
●
●
●
●
●
●
●
●
●
●
●
●
●
●
●
●
●
●
●
●
●
●
●
●
●
Boyle
Killala
Foxford
Ballina
Kinlough
Swinford
Bundoran
Ballincar
Dromahair
Collooney
Ballymote
Inniscrone
Strandhill
DrumshanboTobercurry
Ballysodare
Charlestown
Rosses Point
Ballyshannon
Manorhamilton
Ballaghaderreen
Carrick on Shannon
Sligo
6,769 workers resided in Sligo in April 2006. Of these, 1,483 worked outside the town leaving 5,286 persons who both lived and worked in the town. A further 8,112 workers travelled into Sligo to work resulting in a working population of 13,398. Sligo was therefore a major net gainer in employment terms with the number of workers almost doubling as a result of inflows. The health and manufacturing sectors accounted for two out of five jobs in Sligo with public administration and defence accounting for a further 10.8 per cent. 44 per cent of workers were educated to third level. Sligo drew a significant numbers of its daily workers from the surrounding towns of Tobercurry, Ballymote, Collooney, Ballysadare, Dromahair, Manorhamilton and from along the coastal strip to Bundoran. While nearly 80 per cent of workers travelled by car a significant minority (13.4%) walked to work.
0 5 10 15 202.5Kilometers
No. of Workers0 - 20
21 - 50
51 - 100
101 - 500
501 - 1000
1001 and above

Sligo
57
Industrial Group
Total resident workers
Residents working outside
town
Workers living and working in
town
Workers travelling
from outside town
Working population
[A + B] [A] [B] [C] [B + C]Agriculture, forestry and fishing 29 20 9 47 56Manufacturing* 1,165 198 967 1,374 2,341Construction 242 118 124 284 408Wholesale and retail trade 1,067 204 863 1,009 1,872Hotels and restaurants 686 140 546 243 789Transport, storage and communications 234 43 191 318 509Banking and financial services 170 55 115 269 384Real estate, renting and business activities 497 111 386 575 961Public administration and defence 496 105 391 1,057 1,448Education 556 151 405 720 1,125Health and social work 1,270 247 1,023 1,960 2,983Other community, social and personal service activities
327 80 247 233 480
Industry not stated 30 11 19 23 42Total 6,769 1,483 5,286 8,112 13,398
*Includes Mining, quarrying and turf production and Electricity, gas and water supply
Level of Education
Total resident workers
Residents working outside
town
Workers living and working in
town
Workers travelling
from outside town
Working population
[A + B] [A] [B] [C] [B + C]Primary Education or none 436 81 355 273 628Lower Secondary 1,017 224 793 999 1,792Leaving Cert., Technical or Vocational 1,982 424 1,558 2,450 4,008Third level or higher 2,541 582 1,959 3,953 5,912Persons still in education (incl. not stated) 793 172 621 437 1,058Total 6,769 1,483 5,286 8,112 13,398
Socio-Economic Group
Total resident workers
Residents working outside
town
Workers living and working in
town
Workers travelling
from outside town
Working population
[A + B] [A] [B] [C] [B + C]A Employers and managers 842 226 616 1,076 1,692B Higher professional 554 108 446 787 1,233C Lower professional 1,052 264 788 1,801 2,589D Non-manual 2,290 388 1,902 2,581 4,483E Manual skilled 542 172 370 630 1,000F Semi-skilled 1,015 183 832 951 1,783G Unskilled 276 46 230 142 372H Own account workers 144 74 70 79 149Others including farmers, agricultural workers and not stated (I, J & Z) 54 22 32 65 97Total 6,769 1,483 5,286 8,112 13,398

Swords
58
Swords Working population 5,651 Catchment area by Electoral Division
15,012 workers resided in Swords in April 2006. Of these, 12,914 worked outside the town leaving 2,098 persons who both lived and worked in the town. A further 3,553 workers travelled into Swords to work resulting in a working population of 5,651. Swords was therefore a significant net loser in employment terms – not surprising considering its proximity to Dublin airport and its closeness to Dublin City. Wholesale and retail trade accounted for 23 per cent of jobs in Swords while public administration and defence, boosted by the presence of the Fingal County Council head office, accounted for a further 13.4 per cent. More than two out of five jobs were in non-manual occupations. Balbriggan, Rush, Lusk, Donabate and Portrane supplied a significant number of daily commuters to Swords. 63.5 per cent of commuters to Swords spent less than a half an hour commuting each day. Just over 500 workers travelled by bus or train.
●
●
●●
●
●●●
● ●
●
●
●
●
●
●
●
●
●
●●
●
●
●
●
●
●
●
●
●
●
●
●●
●
●
●
●
●
●
●●
●
●●
●
●●●
● ●
●
●
●
●
●
●
●
●
●
●●
●
●
●
●
●
●
●
●
●
●
●
●●
●
●
●
●
●
●
●
Lusk Rush
Slane
Navan
Clane
Dublin
Clonee
Collon
Duleek
Laytown
Ratoath
Leixlip
Kilcock
Drogheda
Portrane
Kinsealy
Donabate
Skerries
Dunboyne
Asbourne
Malahide
Maynooth
StamullinKentstown
Newcastle
Celbridge
Rivermeade
Tullyallen
Summerhill
Balbriggan
Julianstown
Loughshinny
Portmarnock
Termonfeckin
Dunshaughlin
Dun Laoghaire
Swords
No. of Workers0 - 20
21 - 50
51 - 100
101 - 500
501 - 1000
1001 and above
0 4 8 12 162Kilometers

Swords
59
Industrial Group
Total resident workers
Residents working outside
town
Workers living and working in
town
Workers travelling
from outside town
Working population
[A + B] [A] [B] [C] [B + C]Agriculture, forestry and fishing 105 102 3 9 12Manufacturing* 1,708 1,581 127 432 559Construction 608 513 95 211 306Wholesale and retail trade 2,647 1,988 659 643 1,302Hotels and restaurants 948 661 287 137 424Transport, storage and communications 2,064 1,969 95 245 340Banking and financial services 1,124 1,050 74 205 279Real estate, renting and business activities 2,128 1,983 145 319 464Public administration and defence 1,035 859 176 579 755Education 741 566 175 338 513Health and social work 1,272 1,123 149 234 383Other community, social and personal service activities
539 435 104 178 282
Industry not stated 93 84 9 23 32Total 15,012 12,914 2,098 3,553 5,651
*Includes Mining, quarrying and turf production and Electricity, gas and water supply
Level of Education
Total resident workers
Residents working outside
town
Workers living and working in
town
Workers travelling
from outside town
Working population
[A + B] [A] [B] [C] [B + C]Primary Education or none 508 367 141 196 337Lower Secondary 2,042 1,609 433 492 925Leaving Cert., Technical or Vocational 4,933 4,212 721 1,052 1,773Third level or higher 5,751 5,244 507 1,561 2,068Persons still in education (incl. not stated) 1,778 1,482 296 252 548Total 15,012 12,914 2,098 3,553 5,651
Socio-Economic Group
Total resident workers
Residents working outside
town
Workers living and working in
town
Workers travelling
from outside town
Working population
[A + B] [A] [B] [C] [B + C]A Employers and managers 2,643 2,398 245 600 845B Higher professional 948 870 78 381 459C Lower professional 2,011 1,826 185 570 755D Non-manual 5,627 4,510 1,117 1,217 2,334E Manual skilled 1,399 1,306 93 252 345F Semi-skilled 1,468 1,273 195 305 500G Unskilled 462 357 105 140 245H Own account workers 299 233 66 68 134Others including farmers, agricultural workers and not stated (I, J & Z) 155 141 14 20 34Total 15,012 12,914 2,098 3,553 5,651

Tralee
60
Tralee Working population 11,548 Catchment area by Electoral Division
●
●
●
●
●
●
●
●
●
●
●
●
●
●
●
●
●
●
●
●
●
●
●
●
Ardfert
Rathmore
ListowelBallyduff
Killarney
Killorglin
AbbeyfealeBallyheigue
Ballybunion
An Daingean
Castleisland
Tralee
6,844 workers resided in Tralee in April 2006. Of these, 1,808 worked outside the town leaving 5,036 persons who both lived and worked in the town. A further 6,512 workers travelled into Tralee to work resulting in a working population of 11,548. Tralee was therefore a major net gainer in employment terms. Wholesale and retail trade and the health sector each accounted for 20 per cent of employment in Tralee with the manufacturing sector (13%) and public administration and defence (8.9%) also playing a major role. 41.3 per cent of workers were educated to third level – high compared with other towns of 5,000 population and over. Significant numbers of commuters travelled into Tralee from the surrounding towns of Listowel, Castleisland and Killarney. About four out of five commuters travelled by car and 70 per cent of commuters took less than a half an hour to travel to work.
0 4 8 12 162Kilometers No. of Workers
0 - 20
21 - 50
51 - 100
101 - 500
501 - 1000
1001 and above

Tralee
61
Industrial Group
Total resident workers
Residents working outside
town
Workers living and working in
town
Workers travelling
from outside town
Working population
[A + B] [A] [B] [C] [B + C]Agriculture, forestry and fishing 56 51 5 29 34Manufacturing* 936 252 684 819 1,503Construction 358 177 181 288 469Wholesale and retail trade 1,427 246 1,181 1,206 2,387Hotels and restaurants 630 171 459 228 687Transport, storage and communications 301 79 222 311 533Banking and financial services 208 97 111 168 279Real estate, renting and business activities 559 169 390 402 792Public administration and defence 433 84 349 675 1,024Education 601 224 377 614 991Health and social work 973 156 817 1,524 2,341Other community, social and personal service activities
325 83 242 222 464
Industry not stated 37 19 18 26 44Total 6,844 1,808 5,036 6,512 11,548
*Includes Mining, quarrying and turf production and Electricity, gas and water supply
Level of Education
Total resident workers
Residents working outside
town
Workers living and working in
town
Workers travelling
from outside town
Working population
[A + B] [A] [B] [C] [B + C]Primary Education or none 324 63 261 246 507Lower Secondary 1,054 247 807 1,040 1,847Leaving Cert., Technical or Vocational 2,088 470 1,618 1,935 3,553Third level or higher 2,727 858 1,869 2,905 4,774Persons still in education (incl. not stated) 651 170 481 386 867Total 6,844 1,808 5,036 6,512 11,548
Socio-Economic Group
Total resident workers
Residents working outside
town
Workers living and working in
town
Workers travelling
from outside town
Working population
[A + B] [A] [B] [C] [B + C]A Employers and managers 1,066 324 742 836 1,578B Higher professional 550 175 375 528 903C Lower professional 987 315 672 1,383 2,055D Non-manual 2,337 436 1,901 2,177 4,078E Manual skilled 626 204 422 631 1,053F Semi-skilled 742 129 613 650 1,263G Unskilled 252 54 198 205 403H Own account workers 202 119 83 70 153Others including farmers, agricultural workers and not stated (I, J & Z) 82 52 30 32 62Total 6,844 1,808 5,036 6,512 11,548
Tullamore
62
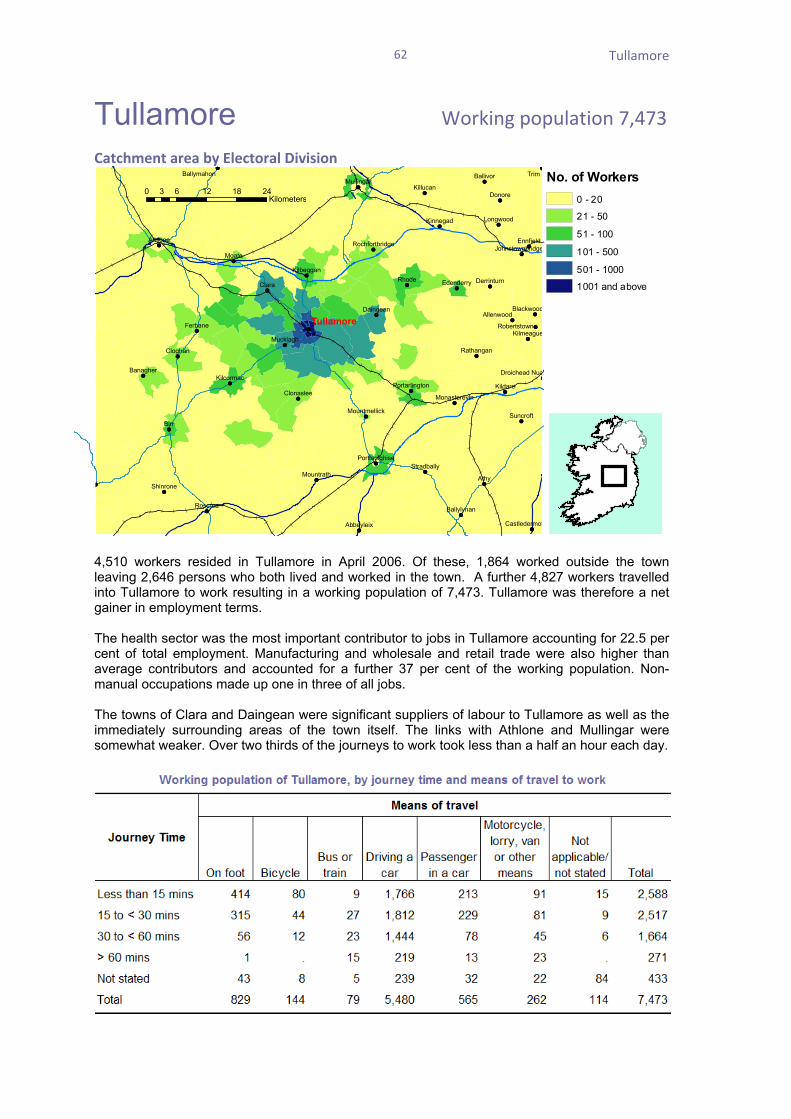
Tullamore Working population 7,473 Catchment area by Electoral Division
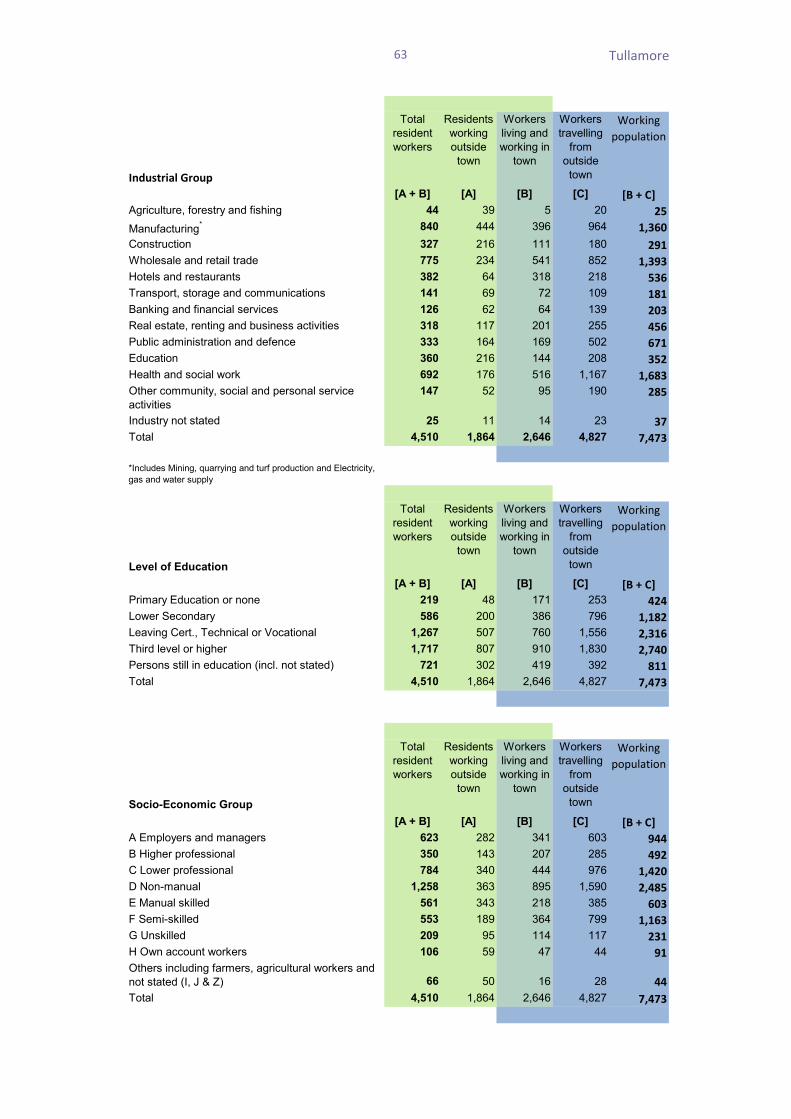
4,510 workers resided in Tullamore in April 2006. Of these, 1,864 worked outside the town leaving 2,646 persons who both lived and worked in the town. A further 4,827 workers travelled into Tullamore to work resulting in a working population of 7,473. Tullamore was therefore a net gainer in employment terms. The health sector was the most important contributor to jobs in Tullamore accounting for 22.5 per cent of total employment. Manufacturing and wholesale and retail trade were also higher than average contributors and accounted for a further 37 per cent of the working population. Non-manual occupations made up one in three of all jobs. The towns of Clara and Daingean were significant suppliers of labour to Tullamore as well as the immediately surrounding areas of the town itself. The links with Athlone and Mullingar were somewhat weaker. Over two thirds of the journeys to work took less than a half an hour each day.
●
●●
●
●
●
●
●
●
●
●
●●
● ●
●
●●
●
●
●
●
●
●
●
●
●
●
●
●
●
●
●●
●
●
●
●
●
●
●
●
●
●
●
●
●
●
●
●●
●
●
●
●
●
●
●
●
●●
● ●
●
●●
●
●
●
●
●
●
●
●
●
●
●
●
●
●
●●
●
●
●
●
●
●
●
●
●
●
●
●
●
●
Birr
Trim
Athy
RhodeClara
Moate
Donore
Roscrea
Cloghan
Ferbane
Athlone
Kildare
Mucklagh
Shinrone
Suncroft
Daingean
Banagher
Kinnegad
Killucan
Longwood
Ballivor
Ennfield
Blackwood
Clonaslee
Abbeyleix
Mountrath
Edenderry
Kilcormac
Kilbeggan
Mullingar
Kilmeague
Allenwood
Rathangan
Ballymahon
Derrinturn
Ballylynan
Stradbally
Robertstown
Mountmellick
Castledermot
Monasterevin
Portarlington
Portlaoighise
Droichead Nua
RochfortbridgeJohnstownbridge
Tullamore
No. of Workers0 - 20
21 - 50
51 - 100
101 - 500
501 - 1000
1001 and above
0 6 12 18 243Kilometers
Tullamore
63
Industrial Group
Total resident workers
Residents working outside
town
Workers living and working in
town
Workers travelling
from outside town
Working population
[A + B] [A] [B] [C] [B + C]Agriculture, forestry and fishing 44 39 5 20 25Manufacturing* 840 444 396 964 1,360Construction 327 216 111 180 291Wholesale and retail trade 775 234 541 852 1,393Hotels and restaurants 382 64 318 218 536Transport, storage and communications 141 69 72 109 181Banking and financial services 126 62 64 139 203Real estate, renting and business activities 318 117 201 255 456Public administration and defence 333 164 169 502 671Education 360 216 144 208 352Health and social work 692 176 516 1,167 1,683Other community, social and personal service activities
147 52 95 190 285
Industry not stated 25 11 14 23 37Total 4,510 1,864 2,646 4,827 7,473
*Includes Mining, quarrying and turf production and Electricity, gas and water supply
Level of Education
Total resident workers
Residents working outside
town
Workers living and working in
town
Workers travelling
from outside town
Working population
[A + B] [A] [B] [C] [B + C]Primary Education or none 219 48 171 253 424Lower Secondary 586 200 386 796 1,182Leaving Cert., Technical or Vocational 1,267 507 760 1,556 2,316Third level or higher 1,717 807 910 1,830 2,740Persons still in education (incl. not stated) 721 302 419 392 811Total 4,510 1,864 2,646 4,827 7,473
Socio-Economic Group
Total resident workers
Residents working outside
town
Workers living and working in
town
Workers travelling
from outside town
Working population
[A + B] [A] [B] [C] [B + C]A Employers and managers 623 282 341 603 944B Higher professional 350 143 207 285 492C Lower professional 784 340 444 976 1,420D Non-manual 1,258 363 895 1,590 2,485E Manual skilled 561 343 218 385 603F Semi-skilled 553 189 364 799 1,163G Unskilled 209 95 114 117 231H Own account workers 106 59 47 44 91Others including farmers, agricultural workers and not stated (I, J & Z) 66 50 16 28 44Total 4,510 1,864 2,646 4,827 7,473

Waterford City
64
Waterford City Working population 25,389 Catchment area by Electoral Division
●
●
●
●●
●
●
●
●
●
●
●●
●
●
●
●
●
●
●
● ●
●
●
●
●
●
●
●
●
●
●
●
●
●
●
●
●
●●
●
●
●
●
●
●
●●
●
●
●
●
●
●
●
● ●
●
●
●
●
●
●
●
●
●
●
●
●
●
Cahir
Tallow
Borris
Callan
Cashel
Fethard
Lismore
Portlaw
Tramore
Kimacow
Piltown
Thurles
Clonmel
Clogheen Mooncoin
Kilkenny
New Ross
Ardfinnan
Cappoquin
Holycross
Paulstown
Dungarvan
Kilsheelan
Killenaule
Ballinroad
Thomastown
Kilmacthomas
Passage East
Dunmore East
Ballyclerehan
Twomileborris
Bennetsbridge
Graiguenamanagh
Carrick on Suir
Waterford
16,458 workers resided in Waterford City (including its suburbs) in April 2006. Of these, 2,754 worked outside the town leaving 13,704 persons who both lived and worked in the town. A further 11,685 workers travelled into Waterford City to work resulting in a working population of 25,389. Waterford City was therefore a significant net gainer in employment terms. Manufacturing was by far the most important industry sector in April 2006 accounting for 27.2 per cent of overall employment in the city. Manual skilled and semi-skilled occupations made up 28.5 per cent of all jobs compared with 18.7 per cent for all towns with a population of 5,000 or more. Waterford City drew its workers from a wide catchment area. Apart from the city and its immediate suburbs the main suppliers of labour were Tramore, Dungarvan, Kilmacthomas, Carrick-on-Suir, Piltown, New Ross, Passage East and Dunmore East. Four out of five workers travelled by car and 71 per cent of all journeys took less than a half an hour.
0 5 10 15 202.5Kilometers
No. of Workers0 - 20
21 - 50
51 - 100
101 - 500
501 - 1000
1001 and above

Waterford City
65
Industrial Group
Total resident workers
Residents working outside
town
Workers living and working in
town
Workers travelling
from outside town
Working population
[A + B] [A] [B] [C] [B + C]Agriculture, forestry and fishing 84 57 27 30 57Manufacturing* 4,403 603 3,800 3,097 6,897Construction 714 269 445 604 1,049Wholesale and retail trade 2,690 350 2,340 1,385 3,725Hotels and restaurants 1,293 211 1,082 377 1,459Transport, storage and communications 681 163 518 534 1,052Banking and financial services 470 87 383 490 873Real estate, renting and business activities 1,518 273 1,245 1,077 2,322Public administration and defence 639 147 492 635 1,127Education 1,295 220 1,075 1,115 2,190Health and social work 1,942 235 1,707 1,932 3,639Other community, social and personal service activities
637 115 522 368 890
Industry not stated 92 24 68 41 109Total 16,458 2,754 13,704 11,685 25,389
*Includes Mining, quarrying and turf production and Electricity, gas and water supply
Level of Education
Total resident workers
Residents working outside
town
Workers living and working in
town
Workers travelling
from outside town
Working population
[A + B] [A] [B] [C] [B + C]Primary Education or none 982 128 854 411 1,265Lower Secondary 3,145 461 2,684 1,866 4,550Leaving Cert., Technical or Vocational 5,093 773 4,320 3,575 7,895Third level or higher 5,676 1,086 4,590 5,117 9,707Persons still in education (incl. not stated) 1,562 306 1,256 716 1,972Total 16,458 2,754 13,704 11,685 25,389
Socio-Economic Group
Total resident workers
Residents working outside
town
Workers living and working in
town
Workers travelling
from outside town
Working population
[A + B] [A] [B] [C] [B + C]A Employers and managers 2,250 482 1,768 1,765 3,533B Higher professional 1,210 239 971 1,161 2,132C Lower professional 2,125 411 1,714 2,264 3,978D Non-manual 4,828 556 4,272 2,955 7,227E Manual skilled 2,138 444 1,694 1,559 3,253F Semi-skilled 2,728 306 2,422 1,553 3,975G Unskilled 693 102 591 261 852H Own account workers 323 143 180 128 308Others including farmers, agricultural workers and not stated (I, J & Z) 163 71 92 39 131Total 16,458 2,754 13,704 11,685 25,389

Wexford
66
Wexford Working population 9,020 Catchment area by Electoral Division
●
●
●
●
●
●
●
●
●
●
●
●●
●
●
●
●
●
●
●
●●
●●
●
●
●
●
●
● ●
●
●
●
●
●
●
●
●
●
●
●
●
●
●●
●
●
●
●
●
●
●
●●
●●
●
●
●
●
●
● ●
●
●
Ferns
Gorey
Borris
Ballon
Callan
Carnew
Portlaw
Tramore
Taghmon
Kimacow
Piltown
Rosslare
Bunclody
Mooncoin
Kilkenny
New Ross
Paulstown
Freshford
Waterford
Piercetown
Thomastown
Muinebheag
Enniscorthy
Passage East
Dunmore East
Castlebridge
Bennetsbridge
Leighlinbridge
Graiguenamanagh
Courtown Harbour
Rosslare Harbour
Wexford
6,372 workers resided in Wexford town in April 2006. Of these, 2,524 worked outside the town leaving 3,848 persons who both lived and worked in the town. A further 5,172 workers travelled into Wexford town to work resulting in a working population of 9,020. Wexford town was therefore a net gainer in employment terms. Wholesale and retail trade was the largest sector of economic activity accounting for just over one in five of all jobs. The health sector (16.6%) and manufacturing (15%) were also important providers of employment. Two out of five occupations were non-manual. While most of the labour force was drawn from the immediate vicinity of Wexford town Enniscorthy and Rosslare were also significant sources of labour. One in six workers walked to their place of employment while three quarters travelled by car. Only 17.6 per cent of journeys to work took over half an hour.
0 7 14 21 283.5Kilometers
No. of Workers0 - 20
21 - 50
51 - 100
101 - 500
501 - 1000
1001 and above

Wexford
67
Industrial Group
Total resident workers
Residents working outside
town
Workers living and working in
town
Workers travelling
from outside town
Working population
[A + B] [A] [B] [C] [B + C]Agriculture, forestry and fishing 48 43 5 8 13Manufacturing* 963 385 578 777 1,355Construction 414 248 166 233 399Wholesale and retail trade 1,306 332 974 932 1,906Hotels and restaurants 705 226 479 266 745Transport, storage and communications 204 124 80 109 189Banking and financial services 268 106 162 395 557Real estate, renting and business activities 468 233 235 352 587Public administration and defence 451 219 232 457 689Education 421 179 242 369 611Health and social work 656 176 480 1,013 1,493Other community, social and personal service activities
443 241 202 245 447
Industry not stated 25 12 13 16 29Total 6,372 2,524 3,848 5,172 9,020
*Includes Mining, quarrying and turf production and Electricity, gas and water supply
Level of Education
Total resident workers
Residents working outside
town
Workers living and working in
town
Workers travelling
from outside town
Working population
[A + B] [A] [B] [C] [B + C]Primary Education or none 432 136 296 254 550Lower Secondary 1,410 469 941 939 1,880Leaving Cert., Technical or Vocational 2,092 798 1,294 1,779 3,073Third level or higher 1,924 910 1,014 1,931 2,945Persons still in education (incl. not stated) 514 211 303 269 572Total 6,372 2,524 3,848 5,172 9,020
Socio-Economic Group
Total resident workers
Residents working outside
town
Workers living and working in
town
Workers travelling
from outside town
Working population
[A + B] [A] [B] [C] [B + C]A Employers and managers 861 352 509 759 1,268B Higher professional 358 179 179 270 449C Lower professional 809 387 422 1,016 1,438D Non-manual 2,283 595 1,688 1,990 3,678E Manual skilled 663 367 296 425 721F Semi-skilled 924 410 514 536 1,050G Unskilled 275 108 167 111 278H Own account workers 153 91 62 49 111Others including farmers, agricultural workers and not stated (I, J & Z) 46 35 11 16 27Total 6,372 2,524 3,848 5,172 9,020

68
The table below shows how towns gained and lost workers due to commuting. As well as the 27 towns profiled in this report, this table includes all other towns with a de facto population of 10,000 or more.

69
The table highlights the ‘dormitory town’ effect around the major cities, with Celbridge, Greystones, Malahide and Balbriggan appearing as large net losers of commuters to Dulbin City. The pattern is repeated for the towns around Cork City, with significant numbers travelling from Carrigaline, Cobh and Midleton. Unsurprisingly, Dublin City was the top gainer with over 48,000 people travelling into the city to work. As a result, the towns in Dublin’s commuter belt were the losers in terms of working population. This was most pronounced in Swords with 9,361 fewer workers employed in the town than lived there (equivalent to 62.4% of Swords’ resident workers). A notable exception to this pattern was Leixlip, which in spite of losing 5,362 commuters, attracted 5,794 mainly high tech manufacturing workers. Cork, Galway and Waterford Cities were also major gainers of workers, while the number of workers in Limerick City grew by a more modest proportion (9%) due to commuter effects. Towns in the west of the country with a large rural hinterland attracted large net gains, with commuters to both Castlebar and Sligo almost doubling their respective working populations.

70