a profile of the south african dairy market ... a profile of the south african dairy market value...
TRANSCRIPT
1
A PROFILE OF THE SOUTH AFRICAN DAIRY MARKET VALUE CHAIN
2015
Directorate Marketing Tel: 012 319 8455 Private Bag X 15 Fax: 012 319 8131 Arcadia E-mail:[email protected] 0007 www.daff.gov.za
TABLE OF CONTENTS

2
1. DESCRIPTION OF THE INDUSTRY ....................................................................................... 1
1.1. MILK PRODUCTION AREAS .................................................................................................. 1 1.2. PRODUCTION TRENDS ........................................................................................................ 2 1.3. EMPLOYMENT ................................................................................................................... 3
2. MARKET STRUCTURE .......................................................................................................... 3
2.1. DOMESTIC MARKET AND PRICES ............................................................................... 4 2.2. EXPORT AND IMPORT OF DAIRY PRODUCTS ............................................................ 5 2.2. EXPORTS ...................................................................................................................... 6
2.2.1. Export values of milk and dairy products .................................................................... 9 2.3. SHARE ANALYSIS ..............................................................................................................14
2.3.1. Share analysis of milk and dairy products exports ........................................................14 2.4. IMPORTS .............................................................................................................................18 2.5. MARKETING CHANNELS IN THE DAIRY INDUSTRY ........................................................21
3. EMPOWERMENT PLANS BY THE INDUSTRY ....................................................................23
3.1. SUCCESSFUL VENTURES: COMMERCIALLY VIABLE ...............................................................23 3.2. TRAINING PROGRAMMES ...................................................................................................23 3.3. MAGAZINES .....................................................................................................................23
4. BARRIERS TO THE LEVEL OF PARTICIPATION BY THE EMERGING SECTOR .............23
5. OPPORTUNITIES AND WEAKNESSES ...............................................................................24
6. MARKET INTELLIGENCE .....................................................................................................24
6.1. EXPORT TARIFFS ....................................................................................................................24 6.2. IMPORT TARIFFS .....................................................................................................................30
7. COMPETITIVENESS OF THE DAIRY INDUSTRY ................................................................34
7.1. EXPORTS ...............................................................................................................................34 7.1.1. Milk and cream (neither concentrated nor sweetened) .................................................34 7.1.2. Milk and cream, concentrated or sweetened ................................................................40 7.1.3. Buttermilk and yoghurt ..................................................................................................46 7.1.4. Whey and other natural milk products ..........................................................................52 7.1.5. Butter and other fats and oils derived from milk ............................................................58 7.1.6. Cheese and Curd .........................................................................................................64
7.2. IMPORTS .........................................................................................................................70 7.2.1. Milk and cream (neither concentrated nor sweetened) .................................................70 7.2.2. Milk and cream, concentrated or sweetened ................................................................76 7.2.3. Buttermilk and yoghurt ..................................................................................................82 7.2.4. Whey and other natural milk products ..........................................................................88 7.2.5. Butter and other fats and oils derived from milk ............................................................94 14.2.6. Cheese and Curd .....................................................................................................100
8. ACKNOWLEDGEMENTS ....................................................................................................106

1
1. DESCRIPTION OF THE INDUSTRY The contribution of milk production in South Africa makes approximately 0.5% to the world milk production. There are four major dairy breeds in South Africa namely, Holstein, Jersey, Guernsey and Ayrshire. The industry comprises of number of different economic activities and significant differences exist between farming methods and processing of dairy products. These activities involve the production and marketing of raw milk, pasteurized milk and cream, fermented milk, long-life milk and cream, yoghurt, cheese and its by-product whey, milk powder, sweetened and unsweetened concentrated milk, butter and butter oil (ghee).
Source: Statistics and Economic Analysis, DAFF
The gross value of production for milk is dependent on the quantity produced and prices received by producers. Figure 1 indicates that the gross value of fresh milk has been moving at an increasing rate and reached its new peak of R12.7 billion in 2013/14. There is an exponential increase of 138% during 2013/14 relative to 2004/05. The average gross value of milk produced amounted to R8.6 billion for the past ten years. 1.1. Milk production areas The coastal areas are more suitable for milk production because of mild temperatures as well as good rainfall ensuring good quality natural and artificial pastures. The inland production areas are generally climatically less favorable for milk production. Dairy farming in these areas necessitate intensive and high cost feedlot production systems. Figure 2 shows contribution of provinces to total milk production in South Africa in 2014.
0
2000
4000
6000
8000
10000
12000
14000
2004/05 2005/06 2006/07 2007/08 2008/09 2009/10 2010/11 2011/12 2012/13 2013/14
Mill
ion
Ran
ds
Years
Figure 1: Gross value of fresh milk production
2
Source: MPO
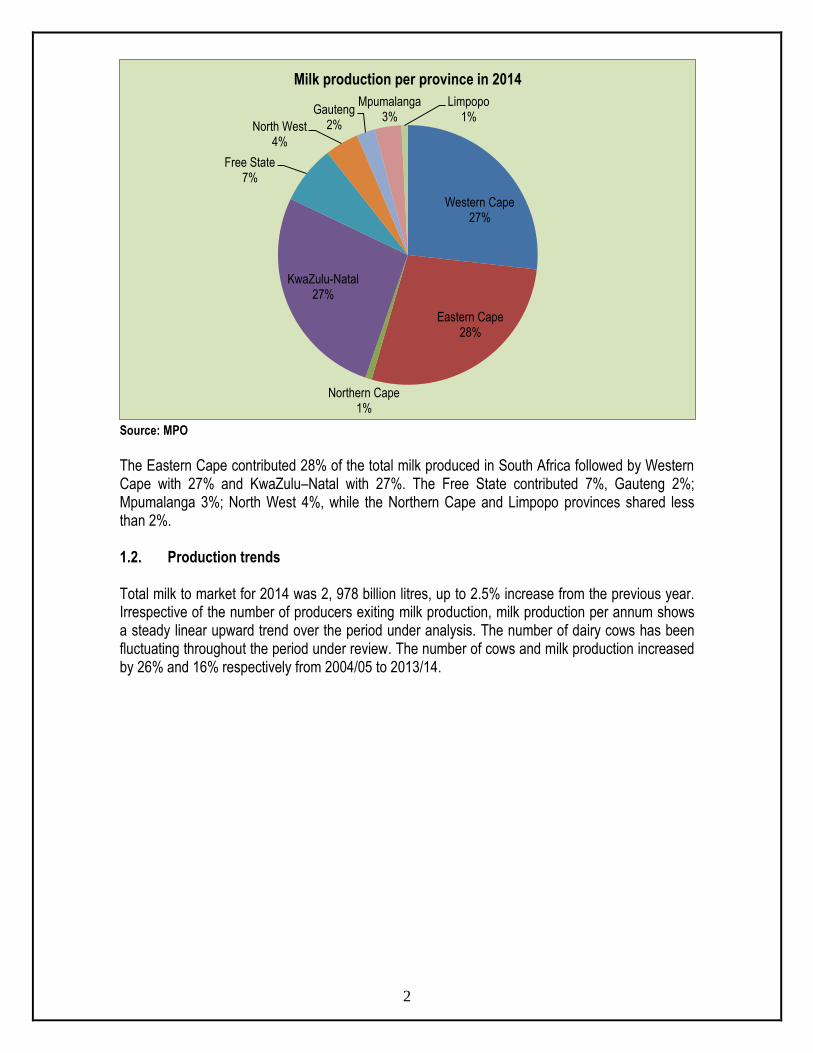
The Eastern Cape contributed 28% of the total milk produced in South Africa followed by Western Cape with 27% and KwaZulu–Natal with 27%. The Free State contributed 7%, Gauteng 2%; Mpumalanga 3%; North West 4%, while the Northern Cape and Limpopo provinces shared less than 2%. 1.2. Production trends Total milk to market for 2014 was 2, 978 billion litres, up to 2.5% increase from the previous year. Irrespective of the number of producers exiting milk production, milk production per annum shows a steady linear upward trend over the period under analysis. The number of dairy cows has been fluctuating throughout the period under review. The number of cows and milk production increased by 26% and 16% respectively from 2004/05 to 2013/14.
Western Cape 27%
Eastern Cape 28%
Northern Cape 1%
KwaZulu-Natal 27%
Free State 7%
North West 4%
Gauteng 2%
Mpumalanga 3%
Limpopo 1%
Milk production per province in 2014

3
Source: Statistics and Economic Analysis, DAFF and LACTODATA
1.3. Employment The South African dairy industry is important to the job market with over 1 961 milk producers employing 60 000 farm workers and providing 40 000 people with indirect jobs within the value chain like milk processing and milling industry. 2. MARKET STRUCTURE The South African dairy market is divided into 60% liquid and 40% concentrated products. Pasteurized liquid milk and UHT milk are the major liquid products, while hard and semi-hard cheese is the major concentrated product. Different types in each category are shown in Figures 4 and 5.
0
200
400
600
800
1000
1200
0
500
1000
1500
2000
2500
3000
3500
2004/05 2005/06 2006/07 2007/08 2008/09 2009/10 2010/11 2011/12 2012/13 2013/14
No
. of
cow
s '0
00
Th
ou
san
d t
on
s
Figure 3: Milk production and number of cows
Production Dairy of Cows '000
Flavoured Milk 2%
Maas & Buttermilk 5%
Yoghurt 13%
UHT 29%
Pasteurised Milk 51%
Figure 4: Composition of milk products

4
Source: MPO
Figure 4 shows that pasteurized milk has the highest percentages of 51% followed by UHT (long life) by 29%, yoghurt by 13%, mass and buttermilk by 5 percent. Flavored milk commanded the lowest market share of liquid milk with 2% share.
Source: MPO
Concentrated milk products consist of 38% of hard and semi cheese followed by milk powder with 19%, other cheese at 16%, butter at 11%, and then condensed milk at 7% and whey powder with a percentage of 8. 2.1. DOMESTIC MARKET AND PRICES Local milk consumption and prices are illustrated in Figure 6.
Butter 11%
Whey Powder 8%
Buttermilk Powder
1%
Condensed Milk 7%
Hard and Semi Cheese
38%
Other Cheese 16%
Milk Pwder 19%
Figure 5: Compostion of concentrated milk products

5
Source: Statistics and Economic Analysis, DAFF
Figure 6 indicates that milk price started low from 2004/05 to 2006/07, then started moving at an increasing rate from 2007/08 to 2013/14 with a slight decrease in 2010/11. Milk price moved at a fast increasing rate during year 2011/12 to 2013/14. During the period 2004/05 and 2005/06 milk price experienced a decline in prices as processors were positioning themselves for an expected increase in production but this led to no growth in production that forced processors to review their pricing. Consumption of milk has been fluctuating throughout the period under review and reached the new peak of 1.98 billion litres in 2013/14. Milk consumption is driven by global population growth and growth in per capita consumption. Despite the fluctuating trend, milk consumption has increased by 8% from 2004/05 to 2013/14.
2.2. EXPORT AND IMPORT OF DAIRY PRODUCTS The most important producers of milk internationally are Asia, the European Union (EU), North America and Central America. Milk production in South Africa makes a very small contribution (0.5%) to the world production but in terms of the values of agricultural production in South Africa, it is the sixth largest agricultural industry Milk is produced much more cheaply in New Zealand and certain parts of the world than in South Africa. Imported milk from the EU and US is cheaper than in South Africa because of subsidies in these countries. Dairy companies in those countries are paid a guaranteed floor price for designated quantities of dairy products. Dairy companies in both countries are given a subsidy to bridge the gap between the supported domestic price and world market price. In the EU dairy farmers are paid subsidies for the use of certain inputs. The annual imports and exports of dairy products of South Africa from 2005 to 2014 are shown in Figure 8.
0.0
0.5
1.0
1.5
2.0
2.5
3.0
3.5
4.0
4.5
1550
1600
1650
1700
1750
1800
1850
1900
1950
2000
2004/05 2005/06 2006/07 2007/08 2008/09 2009/10 2010/11 2011/12 2012/13 2013/14
Ran
ds
per
Lit
re
Th
ou
san
d t
on
s
Figure 6: Consumption and price of fresh milk
Consumption Rands/litre

6
Source: Quantec EasyData
Figure 8 showed that South Africa became a net exporter of milk and dairy products during the periods 2008 and again from 2010 to 2014 and became a net importer during 2005 to 2007 and 2009. The increase in exports from 2010 to 2014 was due to the attractive international price of milk which encouraged more exports. 2.2. EXPORTS The dairy industry is an important earner of foreign exchange. In 2014 only, exports of dairy products amounted to 1 058 million kilograms valued at over R1 326 million. There was a significant increase in quantity and value of milk and dairy products exported to the world in 2014 compared to 2005. Figure 9 below shows the exports of dairy products from 2005 to 2014.
0
5
10
15
20
25
30
35
40
45
50
2005 2006 2007 2008 2009 2010 2011 2012 2013 2014
47 M
illio
n K
ilog
ram
s
Figure 8: Imports and exports quantity of milk and dairy products
Exports Imports

7
Source: Quantec EasyData
From Figure 9, exports quantity fluctuated throughout the period under analysis. Exports of milk and dairy products experienced the lowest exports during the periods 2005 to 2009 before increasing substantially in 2010 and fluctuated at an increasing trend during the following years. The decrease in quantity experienced in 2009 was due to the low production in the local market. Both quantity and value almost followed the same trend throughout the period under analysis. In 2011, the export quantity increased while value declined. This shows that exporting of milk and dairy products were not profitable in 2011 relative to other years of analysis.
1058
0
200
400
600
800
1000
1200
1400
0
200
400
600
800
1000
1200
2005 2006 2007 2008 2009 2010 2011 2012 2013 2014
Mill
ion
Ran
ds
Mill
ion
Kilo
gra
ms
Figure 9: Exports of milk and dairy products
Quantity Value

8
Source: Quantec EasyData
Figure 10 shows that during 2014 Swaziland commanded the greatest market share of South African milk and dairy products exports accounting for 20% followed closely by Mozambique with 19% and Zimbabwe with 17%. Lesotho commanded 15% and Namibia along with Angola commanded 12% each. Zambia commanded 2% share. The smallest shares of 1% were commanded by Congo, Mauritius and Malawi each.
Source: Quantec EasyData
Figure 11 shows that milk and cream (not concentrated nor sweetened) dominated the export market of milk and dairy products and commanded the highest shares from 2005 to 2014. Buttermilk commanded the second greatest shares during 2005 to 2014. Butter, other fats and oils commanded the lowest quantities exported during the past decade.
Zimbabwe 17% Zambia
2%
Swaziland 20%
Namibia 12%
Mozambique 19%
Malawi 1%
Lesotho 15%
Congo 1%
Mauritius 1% Angola
12%
Figure 10: South African milk and dairy products destination in 2014
0
10000
20000
30000
40000
50000
60000
70000
80000
2005 2006 2007 2008 2009 2010 2011 2012 2013 2014
Vo
lum
e (T
on
s)
Figure 11: Quantities of milk and dairy products exports by South Africa
Milk and cream, concentrated or sweetened Milk and cream,not concentrated nor sweetened
Buttermilk, curdled milk and cream and yoghurt, Whey
Butter, other fats and oils Cheese and Curd

9
2.2.1. Export values of milk and dairy products Figures 12 – 21 shows the export of milk and dairy products from provinces and district municipalities.
Source: Quantec EasyData
Figure 12 illustrates that Gauteng province played a major role in the exports of milk and dairy products from 2005 to 2014 with a peak value of R1.5 billion in 2013. This may be due to the fact that Gauteng is the main exit point to the SADC region as most of these exports were destined to SADC region. Western Cape province commanded the second level of milk and dairy products exports throughout the period under review. Averagely Gauteng commanded R703 million followed by Western Cape with R121 million, then Mpumalanga and Limpopo provinces which commanded R35.7 million and R7.2 million respectively. The lowest value of milk and dairy products were recorded in Free State and North West provinces with R 6.7 million and R277 000 respectively. Northern Cape and North West recorded fractional exports from 2005 to 2014.
2005 2006 2007 2008 2009 2010 2011 2012 2013 2014
Western Cape 33474 45395 54013 88003 127992 82883 64562 84822 113544 547983
North West 6 0 0 391 796 129 0 4 14 1427
Eastern Cape 4301 3763 1924 4939 14162 9351 16094 28850 35380 74360
Northern Cape 0 0 0 0 0 0 0 0 0 502
Mpumalanga 6198 23688 14728 11041 3919 9805 24358 50537 98708 114055
Limpopo 153 58 1652 4466 682 8831 7092 16966 23984 9018
Kwazulu Natal 6478 4462 3585 12145 9535 11820 10734 18429 48893 88198
Gauteng 77946 96469 100832 227769 316644 1071818 1046721 1208011 1514968 1375838
Free State 0 0 0 0 1797 1640 2406 10101 6582 44567
0
200000
400000
600000
800000
1000000
1200000
1400000
1600000
Th
ou
san
d R
and
s
Figure 12: Value of milk and dairy products from provinces

10
Source: Quantec EasyData
In Western Cape province, City of Cape Town metropolitan municipality and Cape Winelands district municipality played an important role in the export of milk and dairy products throughout the period under analysis.. Fractional exports were recorded from West Coast, Eden and Overberg district municipalities. There was a drastic increase of export value of milk and dairy products from Cape Winelands which amounted to R388 million in 2014. Central Karoo exported milk and dairy products only in 2013.
Source: Quantec EasyData
2005 2006 2007 2008 2009 2010 2011 2012 2013 2014
City of Cape Town 29116 31437 35646 52628 78867 40020 30610 39580 47861 105614
West Coast 105 500 457 511 1626 0 300 0 0 3468
Cape Winelands 4250 13056 17911 34727 46623 40920 32538 40505 58577 388206
Overberg 3 1 0 0 0 0 0 0 0 240
Eden 1 400 0 137 876 2943 1114 4737 6494 49554
Central Karoo 0 0 0 0 0 0 0 0 612 0
0
50000
100000
150000
200000
250000
300000
350000
400000
450000
Th
ou
san
d R
and
s
Figure 13: Values of milk and dairy products exported from the Western Cape province
2005 2006 2007 2008 2009 2010 2011 2012 2013 2014
Cacadu 4278 3763 1924 4939 14162 9351 16094 28850 35380 61253
Joe Gqabi 0 0 0 0 0 0 0 0 0 27
Alfred Nzo 0 0 0 0 0 0 0 0 0 353
Nelson Mandela Bay 7 1 2 1716 0 4 175 6 13 12727
Buffalo City 15 1 229 0 0 5 0 0 0 0
0
10000
20000
30000
40000
50000
60000
70000
Th
ou
san
d R
and
s
Figure 14: Value of milk and dairy products exported from the Eastern Cape province

11
In Eastern Cape province, high milk and dairy products exports values have been recorded from Cacadu district municipality which commanded the highest values during the past decade. Nelson Mandela metropolitan municipality reached its peak of over R12 million in 2014. Irregular exports of milk and dairy products were recorded in the Nelson Mandela Bay metropolitan municipality, Joe Gqabi, Alfred Nzo and Buffalo City district municipalities.
Source: Quantec EasyData
Intermittent values were recorded from Free State province from four district municipalities (Xhariep, Thabo Mofutsanyane, Fezile Dabi, and Mangaung). Mangaung district municipality recorded a highest value of R22 million in 2014 and Thabo Mofutsanyane recorded the second highest values of R11 million in 2014.
Source: Quantec Easy data
2005 2006 2007 2008 2009 2010 2011 2012 2013 2014
Xhariep 0 0 0 0 0 0 0 3020 5869 357
Thabo Mofutsanyane 0 0 0 0 0 16 33 104 309 11152
Fezile Dabi 0 0 0 0 1797 362 0 0 0 11003
Mangaung 0 0 0 0 0 1262 2372 6978 403 22053
0
5000
10000
15000
20000
25000
Th
ou
san
d R
and
s
Figure 15: Value of milk and dairy products exported from Free State province
2005 2006 2007 2008 2009 2010 2011 2012 2013 2014
Ugu 0 14 0 0 63 0 0 0 0 0
UMgungundlovu 1199 15 5 0 10 0 0 0 11 19141
Uthukela 0 0 0 0 0 0 0 0 0 13
Zululand 0 0 0 0 0 0 0 0 0 2
Uthungulu 0 45 0 0 0 14 0 0 0 1
iLembe 0 0 0 995 786 122 0 0 0 0
eThekwini 5279 4389 3581 11150 8676 11683 10733 18429 48882 69040
01000020000300004000050000600007000080000
Th
ou
san
d R
and
s
Figure 16: Value of milk and dairy products exported from Kwazulu Natal province
12
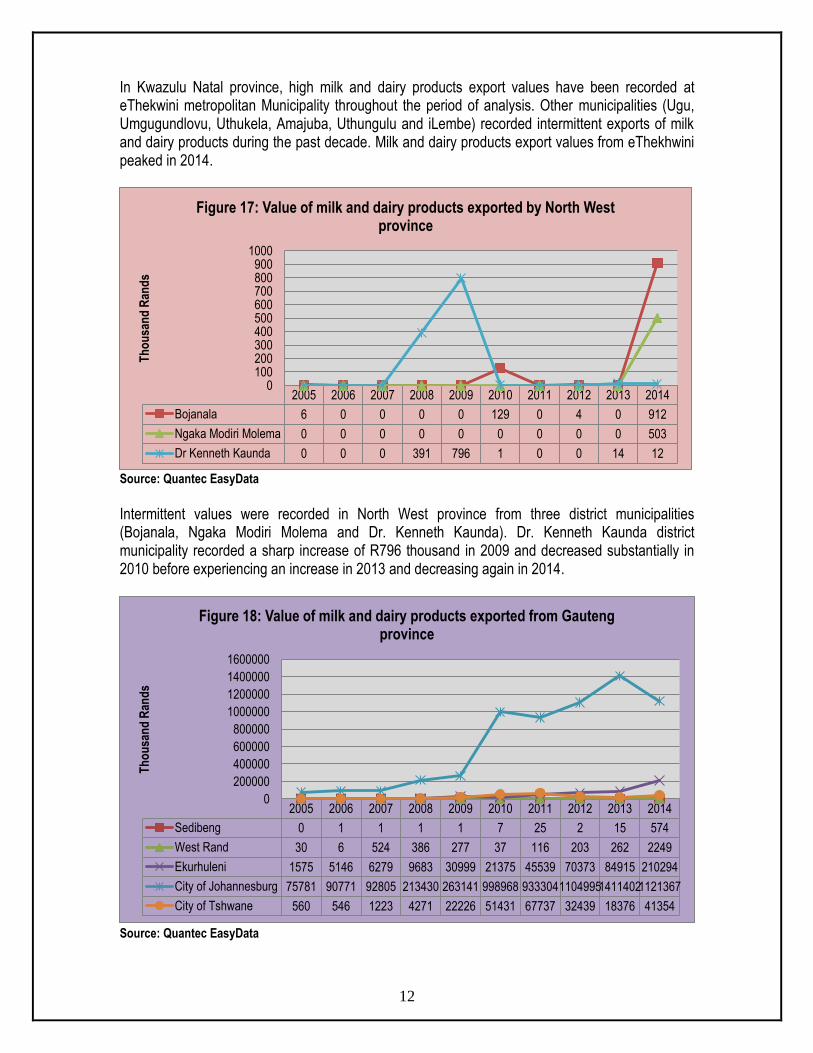
In Kwazulu Natal province, high milk and dairy products export values have been recorded at eThekwini metropolitan Municipality throughout the period of analysis. Other municipalities (Ugu, Umgugundlovu, Uthukela, Amajuba, Uthungulu and iLembe) recorded intermittent exports of milk and dairy products during the past decade. Milk and dairy products export values from eThekhwini peaked in 2014.
Source: Quantec EasyData
Intermittent values were recorded in North West province from three district municipalities (Bojanala, Ngaka Modiri Molema and Dr. Kenneth Kaunda). Dr. Kenneth Kaunda district municipality recorded a sharp increase of R796 thousand in 2009 and decreased substantially in 2010 before experiencing an increase in 2013 and decreasing again in 2014.
Source: Quantec EasyData
2005 2006 2007 2008 2009 2010 2011 2012 2013 2014
Bojanala 6 0 0 0 0 129 0 4 0 912
Ngaka Modiri Molema 0 0 0 0 0 0 0 0 0 503
Dr Kenneth Kaunda 0 0 0 391 796 1 0 0 14 12
0100200300400500600700800900
1000
Th
ou
san
d R
and
s
Figure 17: Value of milk and dairy products exported by North West province
2005 2006 2007 2008 2009 2010 2011 2012 2013 2014
Sedibeng 0 1 1 1 1 7 25 2 15 574
West Rand 30 6 524 386 277 37 116 203 262 2249
Ekurhuleni 1575 5146 6279 9683 30999 21375 45539 70373 84915 210294
City of Johannesburg 75781 90771 92805 213430 263141 998968 933304110499514114021121367
City of Tshwane 560 546 1223 4271 22226 51431 67737 32439 18376 41354
0
200000
400000
600000
800000
1000000
1200000
1400000
1600000
Th
ou
san
d R
and
s
Figure 18: Value of milk and dairy products exported from Gauteng province

13
In Gauteng province, high milk and dairy products export values have been recorded for the past ten years at the City of Johannesburg metropolitan municipality with the new peak in 2013 valued at over R1.4 billion. However, the milk and dairy products export values decreased by 21% in 2014. Ekurhuleni district municipality commanded the second level following City of Johannesburg at a distance. Fractional exports of milk and dairy products were recorded in Sedibeng district municipality. West Rand, Ekurhuleni, City of Johannesburg and City of Tshwane recorded regular exports of milk and dairy products.
Source: Quantec EasyData
In Mpumalanga province, outstanding export values of milk and dairy products were recorded at Ehlanzeni district municipality which recorded exports regularly during the past decade. Irregular exports of milk and dairy products were recorded from Gert Sibande, Nkangala and Albert Luthuli district municipalities.
2005 2006 2007 2008 2009 2010 2011 2012 2013 2014
Gert Sibande 405 0 848 0 579 1 0 286 146 8064
Nkangala 0 0 0 0 1 13 0 0 0 8
Ehlanzeni 5793 23688 13880 11041 3339 9792 24358 50250 98562 105983
Albert Luthuli 0 0 0 0 0 0 0 0 0 3400
0
20000
40000
60000
80000
100000
120000
Th
ou
san
d R
and
s
Figure 19: Value of milk and dairy products exported from Mpumalanga Province

14
Source: Quantec EasyData
Limpopo province recorded minimal exports of milk and dairy products during 2005 to 2006 from Waterberg and Capricorn district municipalities. Vhembe district municipality recorded exports regularly and experienced the highest exports from 2007 to 2014. Waterberg district municipality reached a peak in milk and dairy products export values and became second highest exporter in 2014.
Source: Quantec EasyData
Northern Cape province has not been recording any exports except in 2014. Siyanda district and Frances Baard district were the only districts in Northern Cape which exported milk and dairy products in 2014. Frances Baard district municipality commanded the highest value during 2014. 2.3. SHARE ANALYSIS
2.3.1. Share analysis of milk and dairy products exports
2005 2006 2007 2008 2009 2010 2011 2012 2013 2014
Vhembe 0 24 1543 4466 612 5812 4850 15629 22349 6123
Capricorn 153 34 109 0 70 3019 2240 1338 1628 542
Waterberg 0 0 0 0 0 0 0 0 7 2353
0
5000
10000
15000
20000
25000
Th
ou
san
d R
and
s
Figure 20: Value of milk and dairy products exported from Limpopo Province
2005 2006 2007 2008 2009 2010 2011 2012 2013 2014
Siyanda 0 0 0 0 0 0 0 0 0 5
Frances Baard 0 0 0 0 0 0 0 0 0 498
0
100
200
300
400
500
600
Th
ou
san
d R
and
s
Figure 21: Value of milk and dairy products exported from Northern Cape Province

15
Table 1 presents the contributions of the various provinces to total exports value for milk and dairy products of South Africa during the past ten years. Table 1: Share of provincial milk and dairy products to the total RSA milk and dairy products exports (%) Years Provinces
2005 2006 2007 2008 2009 2010 2011 2012 2013 2014
Western Cape 26.0 26.1 30.6 25.2 26.9 7.0 5.5 5.9 6.2 24.3
Eastern Cape 3.4 2.2 1.1 1.4 2.9 0.8 1.4 2.0 1.9 3.3
Northern Cape 0.0 0.0 0.0 0.0 0.0 0.0 0.0 0.0 0.0 0.0
Free State 0.0 0.0 0.0 0 0.4 0.1 0.2 0.7 0.4 1.9
Kwazulu Natal 5.0 2.6 2.0 3.5 2.0 0.9 0.9 1.3 2.7 3.9
North West 0.0 0.0 0.0 0.1 0.2 0.0 0.0 0.0 0.0 0.1
Gauteng 60.6 2.6 57.1 65.3 66.6 89.6 89.3 85.2 82.2 60.9
Mpumalanga 4.8 13.6 8.3 3.17 0.8 0.8 2.1 3.7 5.4 5.1
Limpopo 0.1 0.0 0.9 1.3 0.1 0.7 0.6 1.2 1.3 0.4
Total 100.0 100.0 100.0 100.0 100.0 100.0 100.0 100.0 100.0 100.0 Source: Quantec EasyData
Table 1 show that Gauteng province commands the greatest share of South African milk and dairy products’ exports followed by Western Cape province. This is in spite of the fact that Western Cape and Eastern Cape provinces are the major milk producing provinces. This may be due to the fact that Gauteng and Western Cape provinces are the exit points for milk and dairy products to the SADC region. Eastern Cape, Kwazulu Natal, Gauteng, Mpumalanga and Limpopo provinces reported regular exports of milk and dairy products. Northern Cape, North West and Free State provinces recorded intermittent export shares of milk and dairy products. Northern Cape province did not receive any share in the past decade. Table 2: Share of district to the total Western Cape provincial milk and dairy products exports (%). Years Districts
2005 2006 2007 2008 2009 2010 2011 2012 2013 2014
City of Cape Town
86.9 69.3 66.0 59.8 61.6 47.7 47.4 46.7 42.2 19.3
West Coast 0.3 1.1 0.9 0.6 1.3 0.0 0.5 0.0 0.0 0.6
Cape Winelands
12.7 28.8 33.2 39.5 36.4 48.8 50.4 47.8 51.6 70.9
Overberg 0.0 0.0 0.0 0.0 0.0 0.0 0.0 0.0 0.0 0.0
Eden 0.0 0.9 0.0 0.2 0.7 3.5 1.7 5.6 5.7 9.1
Central Karoo
0.0 0.0 0.0 0.0 0.0 0.0 0.0 0.0 0..5 0.0
Total 100.0 100.0 100.0 100.0 100.0 100.0 100.0 100.0 100.0 100.0
Source: Quantec EasyData
The City of Cape Town metropolitan municipality has commanded the greatest share of milk and dairy products’ exports in the Western Cape province from 2005 to 2014 followed by Cape Winelands. Fractional exports of milk and dairy products occurred in the West Coast, Overberg and Eden district municipalities.

16
Table 3: Share of district to the total Eastern Cape provincial milk and dairy products exports (%) Years Districts
2005 2006 2007 2008 2009 2010 2011 2012 2013 2014
Cacadu 99.5 99.9 89.3 74.2 100.0 99.9 98.9 99.9 99.9 82.4
Joe Gqabi 0.0 0.0 0.0 0.0 0.0 0.0 0.0 0.0 0.0 0.0
Alfred Nzo 0.0 0.0 0.0 0.0 0.0 0.0 0.0 0.0 0.0 0.5
Nelson Mandela
0.2 0.0 0.0 25.8 0.0 0.0 1.1 0.0 0.0 17.1
Buffalo City 0.4 0.0 10.6 0.0 0.0 0.0 0.0 0.0 0.0 0.0
Total 100.0 100.0 100.0 100.0 100.0 100.0 100.0 100.0 100.0 100.0
Source: Quantec EasyData
Cacadu district municipality has commanded the greatest share of milk and dairy products exports in the Eastern Cape province. Irregular exports were also recorded in Nelson Mandela Metropolitan Municipality, Joe Gqabi, Alfred Nzo, and Buffalo City district municipalities. Table 4: Share of district to total Free State provincial milk and dairy products exports (%)
Source: Quantec EasyData Free State province experienced fractional exports of milk and dairy products from Xhariep, Fezile Dabi, Mangaung and Thabo Mofutsanyane district municipalities. Fezile Dabi district municipality commanded the highest share of milk and dairy products during 2010. Mangaung district municipality commanded the highest export value in 2014. Table 5: Share of district to the total KwaZulu Natal provincial milk and dairy products exports (%) Years Districts
2005 2006 2007 2008 2009 2010 2011 2012 2013 2014
Ugu 0.0 0.3 0.0 0.0 0.7 0.0 0.0 0.0 0.0 0.0
Umgungundlovu 18.5 0.3 0.1 0.0 0.1 0.0 0.0 0.0 0.0 21.7
Uthungulu 0.0 1.0 0.0 0.0 0.0 0.1 0.0 0.0 0.0 0.0
iLembe 0.0 0.0 0.0 8.2 8.2 1.0 0.0 0.0 0.0 0.0
eThekwini 81.5 98.4 99.9 91.8 90.9 98.8 100 100.0 100. 78.3
Total 100.0 100.0 100.0 100.0 100.0 100.0 100.0 100.0 100 100
Source: Quantec EasyData
ILembe district municipality has commanded the greatest shares of milk and dairy products’ exports in the Kwazulu Natal province from 2005 to 2014 and it was consistent during the past decade. Fractional exports of milk and dairy products occurred in Ugu, Umgungundlovu, Uthungulu and eThekwini district municipalities.
Years Districts
2005 2006 2007 2008 2009 2010 2011 2012 2013 2014
Xhariep 0.0 0.0 0.0 0.0 0 0.0 0.0 29.9 89.2 0.8
Thabo Mofutsanyane
0.0 0.0 0.0 0.0 0.0 0.9 1.4 1.0 4.7 25.0
Fezile Dabi 0.0 0.0 0.0 0.0 100. 22.1 0.0 0.0 0.0 24.7
Mangaung 0.0 0.0 0.0 0.0 0.0 76.9 98.6 69.1 6.1 49.5
Total 0.0 0.0 0.0 0.0 100 100 100 100 100 100

17
Table 6: Share of district to total North West provincial milk and dairy products exports (%) Years Districts
2005 2006 2007 2008 2009 2010 2011 2012 2013 2014
Bojanala 100 0.0 0.0 0.0 0.0 100 0.0 100 0.0 63.9
Ngaka Modiri Molema 0.0 0.0 0.0 0.0 0.0 0.0 0.0 0.0 0.0 35.3
Dr. Kenneth Kaunda 0.0 0.0 0.0 100 100 0.0 0.0 0.0 100 0.8
Total 100 0.0 0.0 100 100 100 0.0 100 100 100
Source: Quantec EasyData
Intermittent milk and dairy exports in North West province were recorded from Bojanala, Ngaka
Modiri Molema and Dr. Kenneth Kaunda district Municipalities from 2005 to 2014. Bojanala district municipality commanded 100% shares during 2005 and 63.9% in 2014. Dr. Kenneth Kaunda district municipality has commanded 100% share of milk and dairy products exports during 2008 to 2009 and 2013 and just 0.8% in 2014. Table 7: Share of district to the total Gauteng provincial milk and dairy products exports (%) Years Districts
2005 2006 2007 2008 2009 2010 2011 2012 2013 2014
Sedibeng 0.0 0.0 0.0 0.0 0.0 0.0 0.0 0.0 0.0 0.0
West Rand 0.0 0.0 0.5 0.2 0.0 0.0 0.0 0.0 0.0 0.2
Ekurhuleni 2.0 5.3 6.2 4.25 9.8 1.9 4.4 5.8 5.6 15.3
City of Johannesburg
97.2 94.1 92.0 93.7 83.1 93.2 89.2 91.5 93.2 81.5
City of Tshwane 0.7 0.6 1.2 1.9 7.0 4.8 0.7 2.7 1.2 3.0
Total 100.0 100.0 100.0 100.0 100.0 100.0 100.0 100.0 100.0 100
Source: Quantec EasyData
The City of Johannesburg municipality has commanded the greatest share of milk and dairy products exports in Gauteng province from 2005 to 2014 followed at a vast distance by Ekurhuleni district municipality. City of Tshwane, West Rand, City of Johannesburg and Ekurhuleni municipalities reported regular exports throughout the period under analysis. Fractional exports of milk and dairy products occurred in the Sedibeng district municipality. Table 8: Share of district to total Mpumalanga provincial milk and dairy products exports (%) Years Districts
2005 2006 2007 2008 2009 2010 2011 2012 2013 2014
Gert Sibande 6.5 0.0 5.8 0.0 14.8 0.0 0.0 0.6 0.2 6.9
Nkangala 0.0 0.0 0.0 0.0 0.0 0.1 0.0 0.0 0.0 0.0
Ehlanzeni 93.5 100 94.2 100 85.2 99.9 100 99.4 99.9 90.2
Albert Luthuli 0.0 0.0 0.0 0.0 0.0 0.0 0.0 0.0 0.0 2.9
Total 100 100 100 100 100 100 100.0 100.0 100.0 100.0
Source: Quantec EasyData
Ehlanzeni district municipality has commanded the greatest shares of milk and dairy products’ exports in Mpumalanga Province from 2005 to 2014. Irregular exports of milk and dairy products occurred in the Gert Sibande district and Nkangala district. Table 9: Share of district to the total Limpopo provincial milk and dairy products exports (%)

18
Years Districts
2005 2006 2007 2008 2009 2010 2011 2012 2013 2014
Mopani 0.0 0.0 0.0 0.0 0.0 0.0 0.0 0.0 0.0 0.0
Vhembe 0.0 41.4 93.4 100.0 89.7 65.8 68.4 92.1 93.2 67.9
Capricorn 100.0 58.6 6.6 0.0 10.3 34.2 31.6 7.9 6.8 6.0
Waterberg 0.0 0.0 0.0 0.0 0.0 0.0 0.0 0.0 26.1
Total 100.0 100.0 100.0 100.0 100.0 100.0 100.0 100.0 100.0 100.0
Source: Quantec EasyData
Intermittent exports of milk and dairy products were recorded in Limpopo province. Vhembe and Capricorn district municipalities dominated the export market during the past decade. Capricorn district municipality commanded the greatest shares of milk and dairy products exports during 2005 while the Vhembe district municipality commanded the greatest shares during 2007 to 2014. Table 10: Share of the total Northern Cape provincial milk and dairy products exports (%) Years Districts
2005 2006 2007 2008 2009 2010 2011 2012 2013 2014
Siyanda 0.0 0.0 0.0 0.0 0.0 0.0 0.0 0.0 0.0 1.0
Francis Baard 0.0 0.0 0.0 0.0 0.0 0.0 0.0 0.0 0.0 99.2
Total 0.0 0.0 0.0 0.0 0.0 0.0 0.0 0.0 0.0 100.0
Source: Quantec EasyData
Francis Baard district municipality commanded 99.2% shares during 2014. 2.4. IMPORTS South Africa is an importer of dairy products. The average import quantity and value over the past ten years amounted to 654 million kilograms at a value of R7.6 billion over the past 10 years. Figure 22 presents the imports of milk and dairy products from 2005 to 2014.
Source: Quantec Easydata
0
100
200
300
400
500
600
700
800
900
0
5
10
15
20
25
30
35
40
2005 2006 2007 2008 2009 2010 2011 2012 2013 2014
Mill
ion
Ran
ds
Mill
ion
Kilo
gra
ms
Figure 22: South African imports of milk and dairy products
Quantity Value

19
Figure 22 above shows that imports of milk and dairy products fluctuated in both quantity and value throughout the period under analysis. The import quantity of milk and dairy products reached the new peak of over 59 million kilograms during 2012 and the value reached a new peak of over R1.4 billion in 2012. The quantity and value dropped significantly in 2013 and remained constant throughout 2014. This might be due to the weaker South African Rand. Figure 23 below shows the different types of milk and dairy products imported from 2005 to 2014 in terms of quantity.
Source: Quantec EasyData
Figure 23 shows that milk and cream (concentrated or sweetened), whey and milk and cream (not concentrated nor sweetened) were among the most imported dairy products in South Africa during the period under analysis. Milk and cream (not concentrated nor sweetened) took a dive in 2013 from being the highest in 2012. Milk and cream (concentrated or sweetened) commanded the greatest quantities of the import market from 2005 to 2007. Milk and cream (concentrated and sweetened) dominated the imports market from 2009 to 2012 whereas whey recorded the highest quantities imported during 2013 and 2014. Figure 24 below shows the different types of milk and dairy products imported from 2005 to 2014 in terms of value.
0
5000
10000
15000
20000
25000
2005 2006 2007 2008 2009 2010 2011 2012 2013 2014
Mill
ion
Kilo
gra
ms
Figure 23: Quantities of milk and dairy products imported by South Africa
Milk and cream, concentrated and sweetened Milk and cream, not concentrated nor sweetened
Buttermilk, curdled milk, cream and yogurt Whey
Butter, other fats and oils Cheese and curd
20
Source: Quantec Easydata
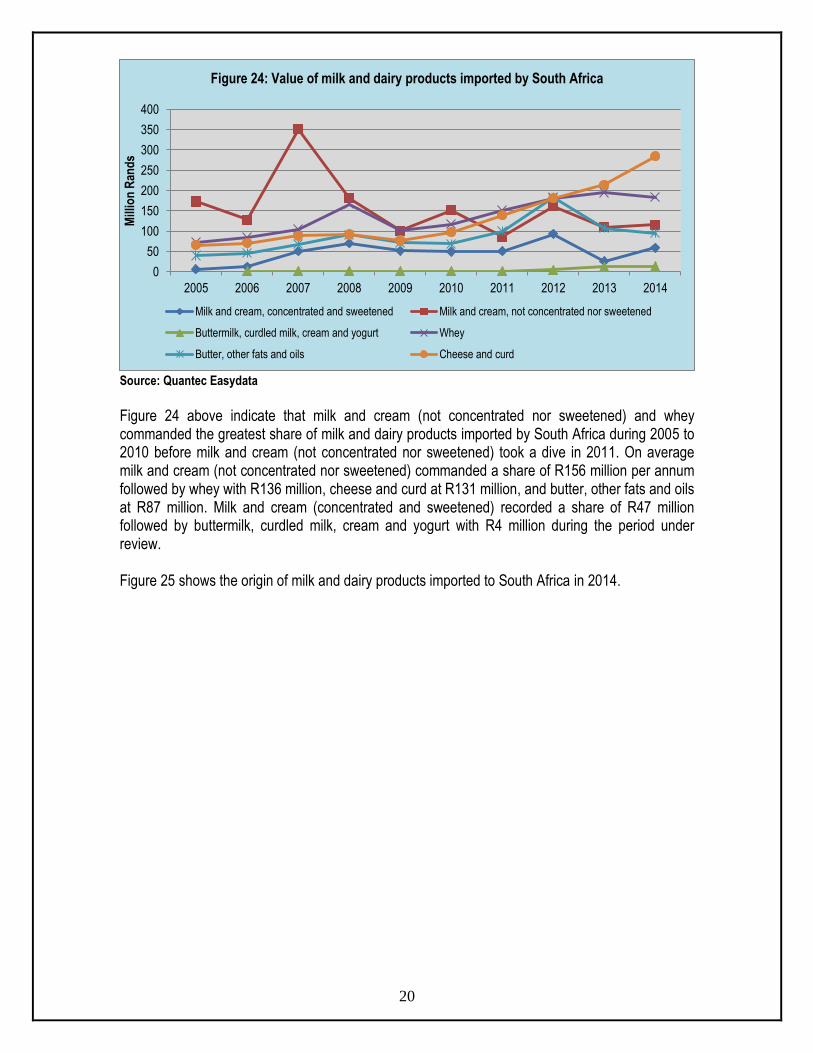
Figure 24 above indicate that milk and cream (not concentrated nor sweetened) and whey commanded the greatest share of milk and dairy products imported by South Africa during 2005 to 2010 before milk and cream (not concentrated nor sweetened) took a dive in 2011. On average milk and cream (not concentrated nor sweetened) commanded a share of R156 million per annum followed by whey with R136 million, cheese and curd at R131 million, and butter, other fats and oils at R87 million. Milk and cream (concentrated and sweetened) recorded a share of R47 million followed by buttermilk, curdled milk, cream and yogurt with R4 million during the period under review. Figure 25 shows the origin of milk and dairy products imported to South Africa in 2014.
0
50
100
150
200
250
300
350
400
2005 2006 2007 2008 2009 2010 2011 2012 2013 2014
Mill
ion
Ran
ds
Figure 24: Value of milk and dairy products imported by South Africa
Milk and cream, concentrated and sweetened Milk and cream, not concentrated nor sweetened
Buttermilk, curdled milk, cream and yogurt Whey
Butter, other fats and oils Cheese and curd

21
Source: Quantec EasyData
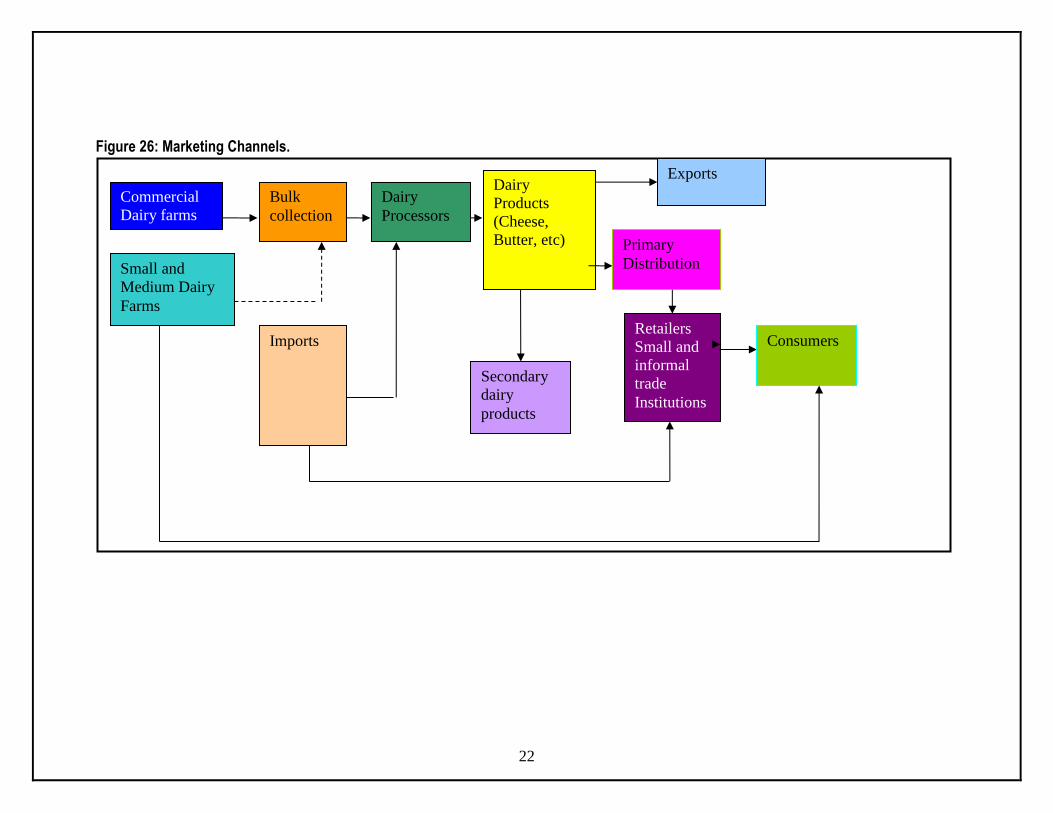
Figure 25 above shows that the main supplier of milk and dairy products to South Africa in 2014 was France which had an import market share of 31% followed by New Zealand which exported 20%. Germany together with Denmark exported 30% of milk and dairy products to South Africa. Plenty of countries exported minimal amount of milk and dairy products to South African in 2014. 2.5. MARKETING CHANNELS IN THE DAIRY INDUSTRY Milk production in South Africa is mainly by two sectors; commercial producers, and small and medium size producers (see Figure 26). Commercial producers sell milk to dairy processors. Small and medium size producers sell most of their milk directly to consumers and some to processors. Dairy processors buy milk from farmers and import milk concentrates and produces dairy products for primary distribution to retailers, exports and for further processing.
Italy 2%
France 31%
Germany 19%
Netherland 1%
Ireland 7%
New Zealand 20%
Lesotho 7%
Spain 0%
Poland 2%
Denmark 11%
Figure 25: Countries of origin for milk and dairy products imported by South Africa during 2014
22
Figure 26: Marketing Channels.
Commercial
Dairy farms
Bulk
collection
Dairy
Processors
Dairy
Products
(Cheese,
Butter, etc)
Secondary
dairy
products
Primary
Distribution
Retailers
Small and
informal
trade
Institutions
Imports
Small and
Medium Dairy
Farms
Exports
Consumers
23
3. EMPOWERMENT PLANS BY THE INDUSTRY The following is a list of ventures/projects/programmes. Media releases were arranged for the dairy industry. The MPO, in conjunction with the provincial departments and municipalities and other relevant stakeholders were responsible for these empowerment plans. 3.1. Successful ventures: Commercially viable Fort Hare Dairy Trust outside Alice in Eastern Cape started in 2004 and the first cow was milked in October 2007. The trust started between a partnership between 70 white farmers from the Tsitsikamma and the Underberg area – through their company Amandlelo Agri and University of Fort Hare. The University donated land and the cost of the project was R22 million (R2 million donated by University, R5 million by Amandlelo and 15 million by Land Bank of which 7.5 million is loan). The farmers signed on an empowerment company Vuwa Investments which was given 35% stake in the company. The farmers kept 49 % and the rest was shared among 600 workers from the 70 dairy farms. Today Fort Hare Dairy Trust is a state-of-the-art commercial dairy farm. It has 800 cow rotary parlor that produces approximately 10 000 litres of milk a day much of which is supplied to Clover milk company. The farm that requires 600 tons of maize is sourced from farmers in the Alice area. Every year Amandlelo takes between 10 and 15 black interns. Some of them are sent to Fort Hare Dairy Trust. Farmers are rewarded with cattle as they pass through different stages. This will enable them to start their own full time dairy farming (Pretoria News, 17 June 2009). 3.2. Training Programmes
Agri SETA accredited farm worker training. Agri SETA accredited emerging farmer training. Workers training funded by MILK SA. Training of Extension officers of Department of Agriculture in North West Province and Free State.
3.3. Magazines Ubisi Mail and Dairy Mail are distributed free of charge to emerging farmers. 4. BARRIERS TO THE LEVEL OF PARTICIPATION BY THE EMERGING SECTOR The low profitability of milk production is the major barrier to entry for the emerging farmers. Access to credit facilities and financial package specially structured to their needs also plays a role. The volatility of the market and the effect of imports in depressing producer prices make it difficult for
the emerging farmers to enter the industry. The dynamics of pricing in the dairy industry as well as the shelf life of the products is such that the
farmers are squeezed to accept whatever price that the producers/processors offer them to dispose of their products.
The market is dominated by 4 major processors in the milk industry making it extremely difficult for the emerging farmers to make inroads in the dairy processing industry.
They lack the necessary capital to invest in dairy equipment. The volume of milk produced may not be sufficient to invest in capital equipment. To form a cooperative would assist in increasing the volume through the collection of milk from several small farms. However the infrastructure and the

24
underdeveloped roads and the great distances between farms could be inhibiting factors to go this route.
Smaller processors tend to pay higher raw milk prices than the larger processors during periods of seasonal milk shortages because they lack the bargaining power that the larger processors have. During periods of surpluses the large producers dump their products in the retail sector at very low prices making it difficult for the small processors to compete.
The big players in the market have facilities to convert raw milk into milk powder, butter, cheese or long-life milk which can be stored for longer periods of time. This facility is capital intensive and for the volumes of raw milk produced by the emerging farmers it is not really worth it in the long term.
The farmers/producers lack the expertise, equipment to pasteurize milk. Transport and the quantity are major deterrents for small farmers to get their products to the big processors. The big processors/buyers find it not worth the effort to access these farmers due to the road infrastructure and small inconsistent and small volumes of milk produced.
5. OPPORTUNITIES AND WEAKNESSES Success in the dairy market depends on two factors namely: quality products and the support of processors. Successful advertising, exports and the development of new products are also important. Some consumers like to buy fresh milk direct from producers because the origin of the milk is known. A strong relationship can be built between producer/s and consumers. Producers can sell direct to small cafes and street vendors shortening the value chain cutting out some transaction costs resulting in an increase in profits. This channel will require higher capital and involves more risks. A sound relationship needs to be in place between the sellers and the buyers. Since deregulation the number of smaller milk producers has increased dramatically and processors are willing to receive milk from the smaller producers. However this supply channel will require a high level control measures on hygiene and the producer has to comply with the required standards. High demand of value added products such as sour milk, yoghurt and cheese can be a market to be explored. However to go this route would require high investment, market knowledge and the necessary training. Packaging to promote brand identification can open an opportunity but this would require market research and knowledge, training and investment. 6. MARKET INTELLIGENCE 6.1. Export Tariffs Tariffs that different importing countries applied to milk and dairy products originating from South Africa in 2013 and 2014 are shown in Tables 10 to 15.

25
Table 10: Milk and cream (neither concentrated nor sweetened) Country Product Code Trade
Regime Description
2013 2014
Applied Tariffs
Total Ad valorem Equivalent Tariff (estimated)
Applied Tariffs
Total Ad valorem Equivalent Tariff (estimated)
DRC 04011000 MFN duties 20% 20% 20% 20%
Malawi
04011000 Preferential tariff for SA MFN duties (Applied)
10% 25.00%
10% 25.00%
10% 25.00%
10% 25.00%
Mauritius 04011000 MFN duties 0%
0% 0% 0%
Mozambique 04011000 Preferential
tariff for SA 15%
15%
15%
15%
United Republic of Tanzania
04011000 MFN duties 60% 60% 60% 60%
Zimbabwe
04011000 MFN duties Preferential tariff (SADC) for South Africa Preferential tariff for South Africa
40% 10.00% 0%
40% 10.00% 0%
40% 10.00% 0%
40% 10.00% 0%
Source: Market Access Map
Mauritius allowed the importation of milk and cream (not concentrated or sweetened) from South Africa duty free during 2013 and 2014. The most protected market exists in United Republic of Tanzania which applied the MFN duties of 60% in 2013 and 2014 followed by Zimbabwe by 40% MFN duties applied during the same period. Mozambique continued with preferential tariff of 15%. Democratic Republic of Congo applied the MFN duties of 5% and Malawi applied 10% to South African milk and cream (not concentrated nor sweetened) during 2013 and 2014. Table 11: Milk and cream (concentrated or sweetened) Country Product code Trade Regime
Description 2013 2014
Applied Tariffs
Total Ad valorem Equivalent Tariff (estimated)
Applied Tariffs
Total Ad valorem Equivalent Tariff (estimated)
Angola 04021000; 04022100; 04029100 & 04029900
MFN duties 2% 2% 2% 2%

26
Country Product code Trade Regime Description
2013 2014
Applied Tariffs
Total Ad valorem Equivalent Tariff (estimated)
Applied Tariffs
Total Ad valorem Equivalent Tariff (estimated)
DRC
04021000 & 04022100
MFN duties
10% 10% 5%
5%
Malawi 04021000 & 04022100 &
MFN Duties Preferential tariff for South Africa
10% 0%
10% 0%
10% 0%
10% 0%
04022900 MFN Duties Preferential tariff for South Africa
25.00% 0%
25.00% 0%
10.00% 0%
10.00% 0%
Mozambique
04021010, 04022110
MFN Duties 0%
0% 0%
0%
04021090, 04029100, 04029990, 04029910, 04022900 & 04022190
MFN Duties Preferential tariff for South Africa
20% 15%
20% 15%
20% 15%
20% 15%
04022120 MFN duties (Applied) Preferential tariff for South Africa
7.50% 0%
7.50% 0%
7.50% 0%
7.50% 0%
Zambia 04021010, 04022110, 04022920 & 04029110
MFN duties 0% 0% 0% 0%
04021090, 04022120, 04022190, 04022930, 04029120 & 04029190
MFN duties (Applied) Preferential tariff for South Africa
25.00% 0%
25.00% 0%
25.00% 0%
25.00% 0%
04022130 MFN duties (Applied) Preferential tariff for South Africa
5.00% 0%
5.00% 0%
5.00% 0%
5.00% 0%
04022910 & 04029900
MFN duties (Applied) Preferential tariff for South Africa
15% 0%
15% 0%
15% 0%
15% 0%

27
Country Product code Trade Regime Description
2013 2014
Applied Tariffs
Total Ad valorem Equivalent Tariff (estimated)
Applied Tariffs
Total Ad valorem Equivalent Tariff (estimated)
Zimbabwe 04021010 MFN duties Preferential tariff (SADC) for South Africa
20.00% 0%
20.00% 0%
20.00% 0%
20.00% 0%
04021090
MFN duties Preferential tariff for South Africa
40% 0%
40% 0%
40% 0%
40% 0%
04022110 & 04022910
MFN duties (Applied) Preferential tariff (SADC) for South Africa
20.00% 0%
20.00% 0%
20.00% 0%
20.00% 0%
Swaziland; Namibia & Lesotho
04021010 04021090
Intra SACU rate 0% 0% 0% 0%
04022110 04022190 04022900
Intra SACU rate 0% 0% 0% 0%
Source: Market Access Map
Angola and Democratic Republic of Congo and Malawi applied reasonable MFN duties to South African milk and cream (concentrated and sweetened) of 2% and 10% respectively in 2013 and 2% and 5% respectively during 2014. Mozambique has applied MFN duties of 0%, 7.5% and 20% for period 2013 and 2014 and also a preferential tariff of 0% and 15% during the same period. Zambia has applied a MFN duties of 0% or otherwise a preferential tariff of 0% for exports of milk and cream (concentrated or sweetened) from South Africa during 2013 and 2014. Zimbabwe’s market of milk and cream (concentrated & sweetened) is the highest protected market with the MFN duties of 20% during the period under review. Swaziland, Namibia and Lesotho have applied an Intra SACU rate of 0% in 2013 and 2014. Table 12: Buttermilk, cream, yoghurt, etc Country Product Code Trade Regime
Description 2013 2014
Applied Tariffs
Total Ad valorem Equivalent Tariff (estimated)
Applied Tariffs
Total Ad valorem Equivalent Tariff (estimated)
Angola
04031000 & 04039000
MFN duties 10% 10% 10% 10%

28
Country Product Code Trade Regime Description
2013 2014
Applied Tariffs
Total Ad valorem Equivalent Tariff (estimated)
Applied Tariffs
Total Ad valorem Equivalent Tariff (estimated)
Malawi
04031000 & 04039000
MFN duties Preferential tariff for South Africa
10% 0%
10% 0%
10% 0%
10% 0%
Mozambique
04031000
MFN duties (Applied) Preferential tariff for South Africa
20% 15%
20% 15%
20% 15%
20% 15%
04039000
MFN duties (Applied) Preferential tariff for South Africa
20% 0%
20% 0%
20% 0%
20% 0%
Zambia 04031000 & 04039000
MFN duties (Applied) Preferential tariff for South Africa
25% 0%
25% 0%
25% 0%
25% 0%
Zimbabwe 04031000 & 04039000
MFN duties
40.00% 40.00% 40.00% 40.00%
Source: Market Access Map
South African exports its buttermilk, cream and yoghurt to Angola received 10% MFN duties rate. Malawi applied the MFN duties of 10% but South Africa received preferential rate of 0% during 2013 and 2014 respectively. Mozambique has charged MFN duty of 20% and South Africa received a preferential tariff of 15% and 0% for 04031000 and 04039000 respectively. Zimbabwe applies the highest MFN duties of 40% to buttermilk, curdled milk, cream and yoghurt originating from South Africa in 2013 and 2014. Table 13: Whey and natural milk products Country Product
code Trade Regime Description
2013 2014
Applied Tariffs
Total Ad valorem Equivalent Tariff (estimated)
Applied Tariffs
Total Ad valorem Equivalent Tariff (estimated)
Japan
040410111; 040410119
MFN duties 35% 25%
35% 25%
35% 25%
35% 25%

29
Country Product code
Trade Regime Description
2013 2014
Applied Tariffs
Total Ad valorem Equivalent Tariff (estimated)
Applied Tariffs
Total Ad valorem Equivalent Tariff (estimated)
Zimbabwe 04041000 04049000
MFN duties 5% 10%
5% 10%
5% 10%
5% 10%
Zambia 04041000 & 04049000
MFN duties (Applied) Preferential tariff for SA
25% 0%
25% 0%
25% 0%
25% 0%
Namibia & Lesotho
04041000 & 04049000
Intra SACU rate
0% 0% 0% 0%
Source: Market Access Map
Japan has applied the highest tariff of whey and natural milk product originating from South Africa, 35% for 040410111 and 25% for 040410119. Zambia allowed importation of whey from South Africa at a preferential rate of 0% in 2013 and 2014. Zimbabwe applied the MFN tariff of 5% and 10% respectively in 2013 and 2014. Namibia and Lesotho have applied an Intra SACU rate of 0% for whey and natural milk product originating from South Africa in 2013 and 2014. Table 14: Butter and other fats and oils derived from milk Country Product
code Trade Regime Description
2013 2014
Applied Tariffs
Total Ad valorem Equivalent Tariff (estimated)
Applied Tariffs
Total Ad valorem Equivalent Tariff (estimated)
Namibia and Botswana
04051000, 04052000, 04059000
Intra SACU rate
0% 0% 0% 0%
Mozambique
04051000, 04052000, 04059090
MFN duties (Applied) Preferential tariff for SA
20% 0%
20% 0%
20% 0%
20% 0%
04059010
MFN duties (Applied) Preferential tariff for SA
2.5% 0%
2.5% 0%
2.5% 0%
2.5% 0%
Egypt 0405101000 MFN duties 5% 5% 5% 5%
0405901000, 0405109050,0405109090,
MFN duties (Applied)
0% 0% 0% 0%
Zimbabwe 04051000, 04052000 & 04059000
MFN duties (Applied)
40.00% 40.00% 40.00% 40.00%
Source: Market Access Map
30
Namibia and Botswana apply Intra SACU rate of 0% for butter and other fats and oils derived from milk originating from South Africa. Mozambique has charged 20% and 2.5% MFN duties for imported dairy products indicated on Table 14 above, however South Africa have received a 0% preferential tariff. Egypt has charged South Africa 5% and 0% MFN duties on butter and other fats and oils derived from milk exported to them in 2013 and 2014. The most protected market exists in Zimbabwe with the total ad valorem equivalent tariff estimated at 40% during 2013 and 2014. Table 15: Cheese and curd Country Product code Trade
Regime Description
2013 2014
Applied Tariffs
Total Ad valorem Equivalent Tariff (estimated)
Applied Tariffs
Total Ad valorem Equivalent Tariff (estimated)
Namibia, Botswana & Swaziland
04061000; 04062000; 04063000; 04064000 & 04069000
Intra SACU rate
0% 0% 0% 0%
Mozambique
04061000; 04062000; 04063000& 04064000
MFN duties (Applied) Preferential tariff for SA
20.00% 15%
20.00% 15%
20.00% 15%
20.00% 15%
Zambia 04061000; 04062000; 04063000; 04064000 & 04069000
MFN duties (Applied) Preferential tariff for SA
25.00% 0%
25.00% 0%
25.00% 0%
25.00% 0%
Zimbabwe 04061000; 04062000; 04063000; 04064000 & 04069000
MFN duties (Applied)
40%
40% 40% 40%
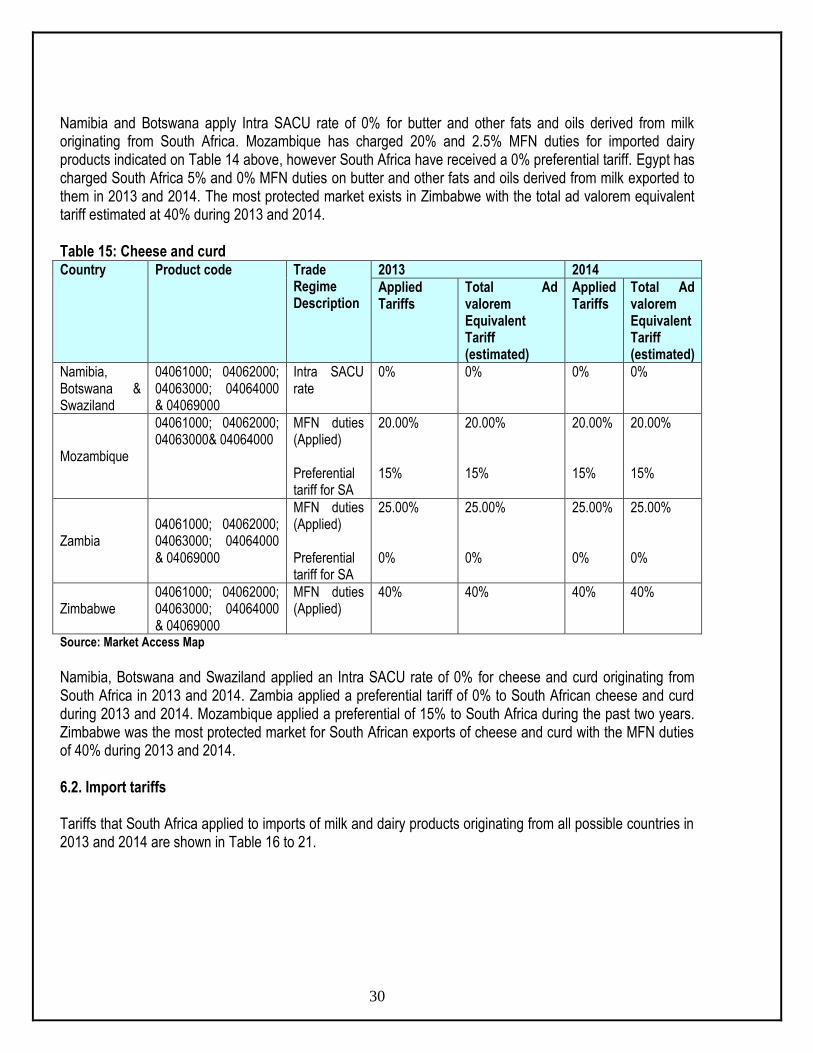
Source: Market Access Map Namibia, Botswana and Swaziland applied an Intra SACU rate of 0% for cheese and curd originating from South Africa in 2013 and 2014. Zambia applied a preferential tariff of 0% to South African cheese and curd during 2013 and 2014. Mozambique applied a preferential of 15% to South Africa during the past two years. Zimbabwe was the most protected market for South African exports of cheese and curd with the MFN duties of 40% during 2013 and 2014. 6.2. Import tariffs Tariffs that South Africa applied to imports of milk and dairy products originating from all possible countries in 2013 and 2014 are shown in Table 16 to 21.

31
Table 16: Milk and cream, neither concentrated nor sweetened Country Product code Trade
Regime Description
2013 2014
Applied Tariffs
Total Ad valorem Equivalent Tariff (estimated)
Applied Tariffs
Total Ad valorem Equivalent Tariff (estimated)
Argentina; France; United Kingdom; Uruguay
04011007; 04011009; 04011090; 04012007; 04012009; 04012090; 04014007; 04014009; 04014090; 04015007; 04015009 & 04015090
MFN duties
0%
0%
0%
0%
Lesotho and Swaziland
04011007; 04011009; 04011090; 04012007; 04012009; 04012090; 04014007; 04014009; 04014090; 04015007; 04015009 & 04015090
Intra SACU rate
0%
0%
0%
0%
Source: Market Access Map
South Africa applied 0% MFN duties to Uruguay, United Kingdom, France and Argentina on milk and cream (neither concentrated nor sweetened) exports to the country during 2013 and 2014. South Africa also applied a 0% Intra SACU rate to Lesotho and Swaziland for milk and cream (neither concentrated nor sweetened) during the same period. Table 17: Milk and cream, concentrated or sweetened Country Product code Trade
Regime Description
2013 2014
Applied Tariffs
Total Ad valorem Equivalent Tariff (estimated)
Applied Tariffs
Total Ad valorem Equivalent Tariff (estimated)
Belgium; France; United Kingdom; Germany; New Zealand & Argentina
04021010, 04021090, 04022110, 04022190, 04022900, 04029100, 04029900,
MFN duties
96.00% OR 540.00$/Ton whichever is lower
OTQR: 14.02% ITQR: 19.2%
OQTR: 96.00% or 418.93 $/Ton whichever is the lower IQTR : 19.20%
OQTR: 12.65% IQTR : 19.20%
Source: Market Access Map
Table 17 indicates that South Africa applied a total ad valorem equivalent tariff for milk and cream (concentrated or sweetened) Inside Tariff Quota Rate (ITQR) of 19.2% and the Outside Tariff Quota Rate (OTQR) of 14.02% to imports from Belgium, France, United Kingdom; Germany, New Zealand and Argentina in 2013. In 2014, OQTR of 19.2% and OTQR of 12.65% were applied to the same countries on milk and cream (concentrated or sweetened) imports by South Africa.
32
Table 18: Buttermilk, cream, yoghurt, etc Country Product
code Trade Regime Description
2013 2014
Applied Tariffs
Total Ad valorem Equivalent Tariff (estimated)
Applied Tariffs
Total Ad valorem Equivalent Tariff (estimated)
France; Germany; Ireland; United Kingdom & Netherlands
04031000; 04039010; 04039020; 04039090
MFN duties (Applied) Preferential tariff for European Union countries
0% 0%
0% 0%
0% 0%
0% 0%
Source: Market Access Map
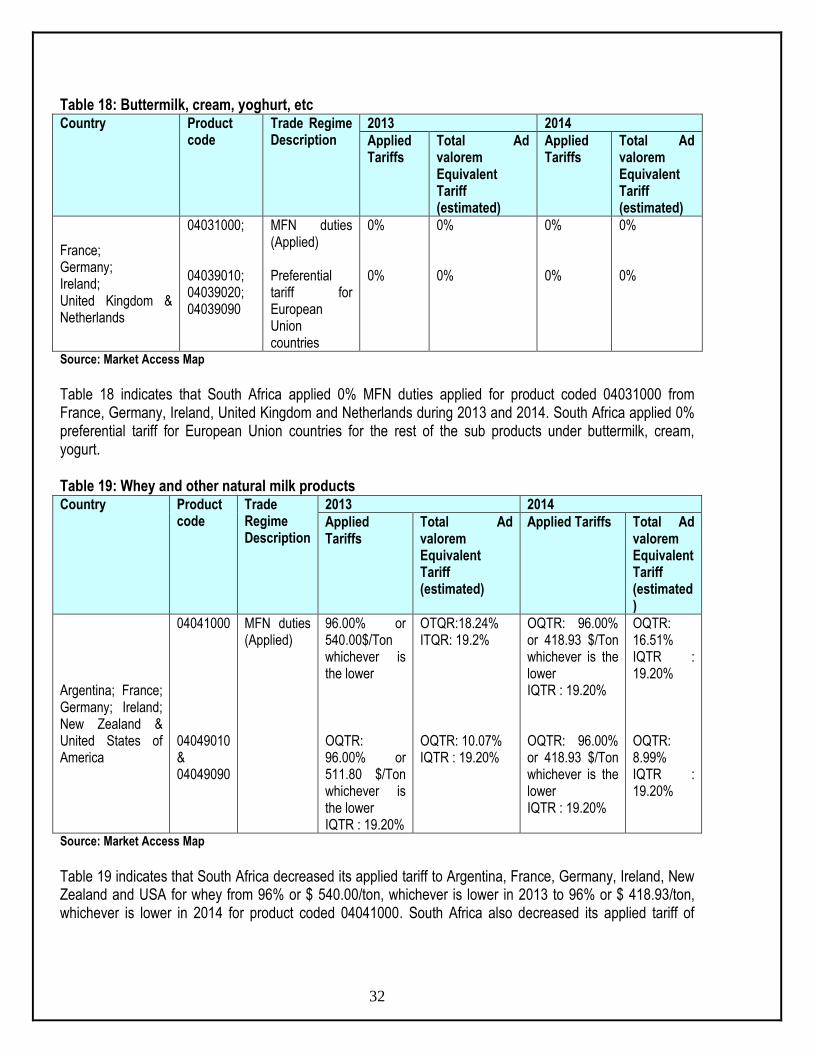
Table 18 indicates that South Africa applied 0% MFN duties applied for product coded 04031000 from France, Germany, Ireland, United Kingdom and Netherlands during 2013 and 2014. South Africa applied 0% preferential tariff for European Union countries for the rest of the sub products under buttermilk, cream, yogurt. Table 19: Whey and other natural milk products Country Product
code Trade Regime Description
2013 2014
Applied Tariffs
Total Ad valorem Equivalent Tariff (estimated)
Applied Tariffs Total Ad valorem Equivalent Tariff (estimated)
Argentina; France; Germany; Ireland; New Zealand & United States of America
04041000 04049010 & 04049090
MFN duties (Applied)
96.00% or 540.00$/Ton whichever is the lower OQTR: 96.00% or 511.80 $/Ton whichever is the lower IQTR : 19.20%
OTQR:18.24% ITQR: 19.2% OQTR: 10.07% IQTR : 19.20%
OQTR: 96.00% or 418.93 $/Ton whichever is the lower IQTR : 19.20% OQTR: 96.00% or 418.93 $/Ton whichever is the lower IQTR : 19.20%
OQTR: 16.51% IQTR : 19.20% OQTR: 8.99% IQTR : 19.20%
Source: Market Access Map
Table 19 indicates that South Africa decreased its applied tariff to Argentina, France, Germany, Ireland, New Zealand and USA for whey from 96% or $ 540.00/ton, whichever is lower in 2013 to 96% or $ 418.93/ton, whichever is lower in 2014 for product coded 04041000. South Africa also decreased its applied tariff of

33
products coded 04049010 and 04049090 to the same countries from 96% or $ 511.80/ton, whichever is lower in 2013 to 96% or $ 418.93/ton, whichever is lower in 2014. Table 20: Butter and other fats and oils derived from milk Country Product
code Trade Regime Description
2013 2014
Applied Tariffs
Total Ad valorem Equivalent Tariff (estimated)
Applied Tariffs Total Ad valorem Equivalent Tariff (estimated)
Denmark Ireland; New Zealand; United Kingdom & France
04051000 04052000 & 04059000
MFN duties OQTR: 79.00% or 568.66 $/Ton whichever is the lower IQTR : 15.80% OQTR: 79.00% or 568.66 $/Ton whichever is the lower IQTR : 15.80%
OQTR: 13.34% IQTR : 15.80% OQTR: 19.60% IQTR : 15.80%
OQTR: 79.00% or 465.48 $/Ton whichever is the lower IQTR : 15.80% OQTR: 79.00% or 465.48 $/Ton whichever is the lower IQTR : 15.80%
OQTR: 10.99% IQTR : 15.80% OQTR: 11.30% IQTR : 15.80%
Source: Market Access Map
Table 20 indicates that South Africa applied the MFN duties on butter and other fats imported from Denmark, Ireland, New Zealand, France and United Kingdom. The applied tariff and total ad valorem equivalent tariff (estimated) have decreased on OQRT and remained the same on IQRT from 2013 to 2014. Table 21: Cheese and curd Country Product
code Trade Regime Description
2013 2014
Applied Tariffs
Total Ad valorem Equivalent Tariff (estimated)
Applied Tariffs
Total Ad valorem Equivalent Tariff (estimated)
United Kingdom; Germany; New Zealand; France; Denmark; Ireland
04061000 MFN duties
OQTR: 95.00% or 568.66 $/Ton whichever is the lower
OQTR: 6.31%
OQTR: 95.00% or 465.48 $/Ton whichever is the lower
OQTR: 7.30%
Source: Market Access Map
Table 21 indicates that South Africa applied a total ad valorem equivalent tariff of 6.31% in 2013 and the Outside Tariff Quota Rate (OTQR) of 7.3% during 2013 to imports of cheese and curd from United Kingdom, France, Germany, Ireland, New Zealand and Denmark.

34
7. COMPETITIVENESS OF THE DAIRY INDUSTRY
7.1. Exports
7.1.1. Milk and cream (neither concentrated nor sweetened) Table 22: List of importing markets for the product exported by South Africa in 2015 South Africa’s exports represent 0.83% of world exports for milk and cream, (not concentrated or sweetened), its ranking in world’s exports is 24.
Importers
Trade Indicators
Tariff (estimated) faced by South Africa (%)
Exported value 2015 (USD thousand)
Trade balance 2015 (USD thousand)
Share in South Africa's exports (%)
Exported quantity 2015
Quantity unit
Unit value (USD/unit)
Exported growth in value between 2011-2015 (%, p.a.)
Exported growth in quantity between 2011-2015 (%, p.a.)
Exported growth in value between 2014-2015 (%, p.a.)
Ranking of partner countries in world imports
Share of partner countries in world imports (%)
Total import growth in value of partner countries between 2011-2015 (%, p.a.)
World 60463 43183 100 88464 Tons 683 -1 -2 -3 100 -1
Botswana 11925 11925 19.7 25918 Tons 460 2 -9 26 60 0.2 2 0
Lesotho 11673 11267 19.3 12904 Tons 905 -10 8 1 62 0.2 -10 0
Zimbabwe 9405 9405 15.6 11020 Tons 853 -8 -3 -21 66 0.1 -7
Mozambique 8751 8751 14.5 10963 Tons 798 15 27 -14 70 0.1 31 9.1
Swaziland 7573 7573 12.5 13963 Tons 542 4 22 -4 76 0.1 4 0
Namibia 5762 5762 9.5 6586 Tons 875 7 -29 15 82 0.1 7 0
Tanzania, 2592 2592 4.3 3908 Tons 663 4 12 -1 104 0 5 0
Mauritius 624 624 1 806 Tons 774 8 21 45 99 0 -3 0
Malawi 582 582 1 616 Tons 945 16 27 13 145 0 2 0
Zambia 330 330 0.5 217 Tons 1521 17 22 -21 172 0 13 0
Comoros 320 320 0.5 449 Tons 713 -2 7 6 148 0 -3 0
Angola 296 296 0.5 316 Tons 937 28 26 -72 40 0.4 14 2
Source: ITC Trademap.
35
Table 22 shows that during 2015, South Africa exported a total of 88 464 tons of milk and cream (not concentrated or sweetened) at an average value of US$683/unit. South Africa exported greater quantities of milk and cream (not concentrated or sweetened) to Botswana, Lesotho and Zimbabwe. The greatest share of South African milk and cream (not concentrated or sweetened) exports were destined to Botswana which commanded 19.7% share during the year 2015 followed by Lesotho at 19.3% and then Zimbabwe at 15.6%. South Africa’s milk and cream (not concentrated or sweetened) exports decreased by 1% in value and 2% in quantity between the periods 2011 and 2015. During the same period, exports of milk and cream (not concentrated or sweetened) to Botswana increased by 2% in value while quantity decreased by 9% and Lesotho decreased by 10% in value and increased by 8% in quantity. Between the periods 2014 and 2015 South Africa’s exports of milk and cream (not concentrated or sweetened) decreased by 3% in value. During the same period, Botswana and Lesotho increased by 26% and 1% respectively in value.

36
Figure 26: Growth in demand for milk and cream exports by South Africa in 2015
Source: ITC Trademap
37
Figure 26 illustrates that South Africa’s exports of milk and cream (not concentrated or sweetened) represent 0.83% of world exports. Between 2011 and 2015 South Africa’s milk and cream, not concentrated or sweetened to United Republic of Tanzania, Zambia, Angola, Malawi, and Seychelles were growing at a rate that is greater than their import growth from the world. This means that South Africa is gaining the market in the mentioned countries. During the same period, South Africa’s milk and cream (not concentrated or sweetened) exports to, Namibia, Botswana, Swaziland and Mozambique were growing at a rate that is less than their imports from the rest of the world. Therefore South Africa is losing the market share in those countries. Mauritius, Malawi and Mozambique represent loses in the dynamic market. Mozambique experienced the highest growth in demand of milk and cream not concentrated nor sweetened imports during the periods 2011 to 2015. Annual growth of exports to Angola was 28%.

38
Figure 27: Prospects for market diversification for milk and cream exported by South Africa in 2015
Source: ITC Trademap

39
South Africa is currently exporting large quantities of milk and cream, not concentrated nor sweetened to Botswana, and it has a market share of 19.7% of South Africa’s exports (see Figure 27). South Africa exports to Botswana are less than that of the world. South Africa can penetrate Angola import market because its annual growth stands at 14%. If South Africa wishes to diversify its exports of milk and cream (not concentrated or sweetened), Zambia is the second fastest growing market with an annual imports growth of 13%. Malawi is the small market but its imports from the South Africa are greater than its imports from world.
40
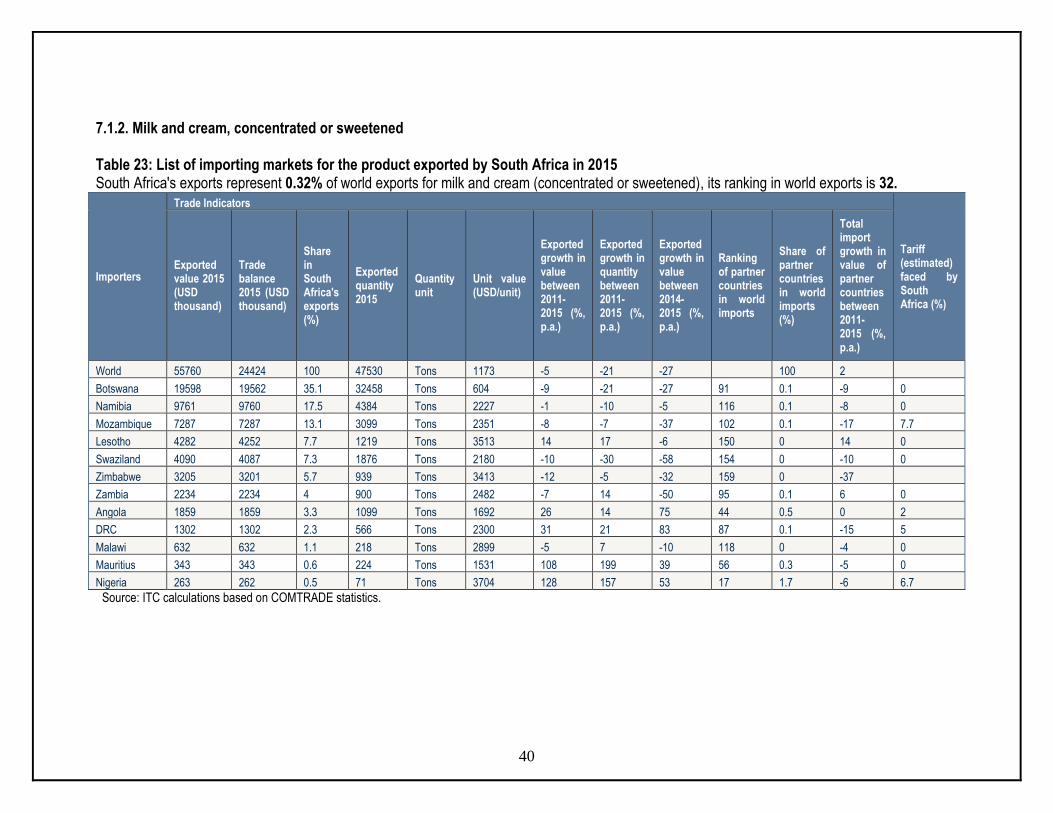
7.1.2. Milk and cream, concentrated or sweetened Table 23: List of importing markets for the product exported by South Africa in 2015 South Africa's exports represent 0.32% of world exports for milk and cream (concentrated or sweetened), its ranking in world exports is 32.
Importers
Trade Indicators
Tariff (estimated) faced by South Africa (%)
Exported value 2015 (USD thousand)
Trade balance 2015 (USD thousand)
Share in South Africa's exports (%)
Exported quantity 2015
Quantity unit
Unit value (USD/unit)
Exported growth in value between 2011-2015 (%, p.a.)
Exported growth in quantity between 2011-2015 (%, p.a.)
Exported growth in value between 2014-2015 (%, p.a.)
Ranking of partner countries in world imports
Share of partner countries in world imports (%)
Total import growth in value of partner countries between 2011-2015 (%, p.a.)
World 55760 24424 100 47530 Tons 1173 -5 -21 -27 100 2
Botswana 19598 19562 35.1 32458 Tons 604 -9 -21 -27 91 0.1 -9 0
Namibia 9761 9760 17.5 4384 Tons 2227 -1 -10 -5 116 0.1 -8 0
Mozambique 7287 7287 13.1 3099 Tons 2351 -8 -7 -37 102 0.1 -17 7.7
Lesotho 4282 4252 7.7 1219 Tons 3513 14 17 -6 150 0 14 0
Swaziland 4090 4087 7.3 1876 Tons 2180 -10 -30 -58 154 0 -10 0
Zimbabwe 3205 3201 5.7 939 Tons 3413 -12 -5 -32 159 0 -37
Zambia 2234 2234 4 900 Tons 2482 -7 14 -50 95 0.1 6 0
Angola 1859 1859 3.3 1099 Tons 1692 26 14 75 44 0.5 0 2
DRC 1302 1302 2.3 566 Tons 2300 31 21 83 87 0.1 -15 5
Malawi 632 632 1.1 218 Tons 2899 -5 7 -10 118 0 -4 0
Mauritius 343 343 0.6 224 Tons 1531 108 199 39 56 0.3 -5 0
Nigeria 263 262 0.5 71 Tons 3704 128 157 53 17 1.7 -6 6.7
Source: ITC calculations based on COMTRADE statistics.
41
Table 23 shows that during 2015 South Africa exported a total of 47 530 tons of milk and cream (concentrated or sweetened) at an average value of US$ 1 173/unit. South Africa exported greater quantities of milk and cream (concentrated or sweetened) to Botswana, Namibia and Mozambique. The greatest share of South African milk and cream (concentrated or sweetened) exports were destined to Botswana which commanded 35.1% share during the year 2015 followed by Namibia with 17.5% then Mozambique with 13.1%. South Africa’s milk and cream (concentrated or sweetened) exports decreased by 5% in value and 21% in quantity between the periods 2011 and 2015. During the same period, exports of milk and cream (concentrated or sweetened) to Mauritius increased by 108% in value and 199% in quantity and increased by 128% in value and 157% in quantity to Nigeria during the period 2011 to 2015. Between the periods 2014 and 2015, South Africa’s exports of milk and cream (concentrated or sweetened) decreased by 27% in value.

42
Figure 28: Growth in demand for sweetened milk and cream exported by South Africa in 2015
Source: ITC Trademap

43
Figure 28 illustrates that South Africa’s exports of milk and cream (concentrated or sweetened) represent 0.32% of world exports. Between 2011 and 2015 South Africa’s milk and cream (concentrated or sweetened) exports to Zambia, Lesotho, Saint Helena, Malawi, Botswana and Ghana were growing at a rate that is less than their imports growth from the world. During the same periods, South Africa was gaining the market shares of milk and cream (concentrated or sweetened) exports to Mozambique, Uganda, Namibia, Nigeria, Zimbabwe, Mauritius, Congo and Angola because imports from South African were growing at a rate that is greater than their imports from the rest of the world. Countries which have the most imports growing demand of South African Milk and Cream (Concentrated and sweetened) are Nigeria and Mauritius with the annual imports growth of 128% and 108% respectively.

44
Figure 29: Prospects for market diversification for sweetened milk and cream exported by South Africa in 2015
Source: ITC Trademap

45
Most of South African milk and cream (concentrated and sweetened) were destined to Botswana. However, this country imported less from South Africa than the rest of the world (see Figure 29). South Africa can either penetrate Saint Helena import market or diversify to Somalia. China, Hong Kong is the biggest market of milk and cream (concentrated or sweetened) in the world, with the world’s imports market share of 7.7%.

46
7.1.3. Buttermilk and yoghurt Table 24: List of importing markets for Buttermilk and yoghurt exported by South Africa in 2015 South Africa’s exports represent 1.14% of world exports for Buttermilk and yoghurt, its ranking in world exports is 20.
Importers
Trade Indicators
Tariff (estimated) faced by South Africa (%)
Exported value 2015 (USD thousand)
Trade balance 2015 (USD thousand)
Share in South Africa's exports (%)
Exported quantity 2015
Quantity unit
Unit value (USD/unit)
Exported growth in value between 2011-2015 (%, p.a.)
Exported growth in quantity between 2011-2015 (%, p.a.)
Exported growth in value between 2014-2015 (%, p.a.)
Ranking of partner countries in world imports
Share of partner countries in world imports (%)
Total import growth in value of partner countries between 2011-2015 (%, p.a.)
World 45254 39362 100 35101 Tons 1289 6 -3 -26 100 0
Angola 10840 10840 24 4973 Tons 2180 9 11 -56 26 0.9 4 10
Mozambique 10051 10051 22.2 8965 Tons 1121 23 35 -25 59 0.2 50 6.8
Botswana 9847 9847 21.8 8379 Tons 1175 0 -12 3 53 0.2 0 0
Namibia 4060 4060 9 3099 Tons 1310 7 -30 13 76 0.1 7 0
Lesotho 3914 3913 8.6 4274 Tons 916 -1 8 15 80 0.1 -1 0
Swaziland 3352 3352 7.4 3252 Tons 1031 -3 -4 9 88 0.1 -3 0
Zimbabwe 606 598 1.3 448 Tons 1353 -26 -19 -21 145 0 -37
Malawi 592 592 1.3 435 Tons 1361 13 15 23 128 0 8 0
Zambia 467 467 1 338 Tons 1382 -3 2 -32 136 0 -1 0
DRC 372 372 0.8 178 Tons 2090 13 13 17 125 0 0 10
Seychelles 245 245 0.5 127 Tons 1929 17 23 1 124 0 -6 0
Congo 214 214 0.5 136 Tons 1574 125 138 -48 130 0 19 16.3
Source: ITC Trademap.

47
Table 24 shows that during 2015 South Africa exported a total of 35 101 tons of buttermilk and yoghurt at an average value of US$ 1 289/unit. South Africa exported greater quantities of buttermilk and yoghurt to Angola, Mozambique and Botswana. The greatest share of South African buttermilk and yoghurt exports were destined to Angola which commanded 24% share during the year 2015 followed at by Mozambique with 22.2%. South Africa’s buttermilk and yoghurt exports have increased by 6% in value and decreased by 3% in quantity from 2011 to 2015. During the same period, exports of buttermilk and yoghurt to Angola increased by 9% in value and 11% in quantity; Mozambique increased by 23% in value and 35% in quantity. Between the periods 2014 and 2015, South Africa’s exports of buttermilk and yoghurt decreased by 26% in value. During the same period, Angola and Mozambique decreased by 56% and 25% respectively in value.
48
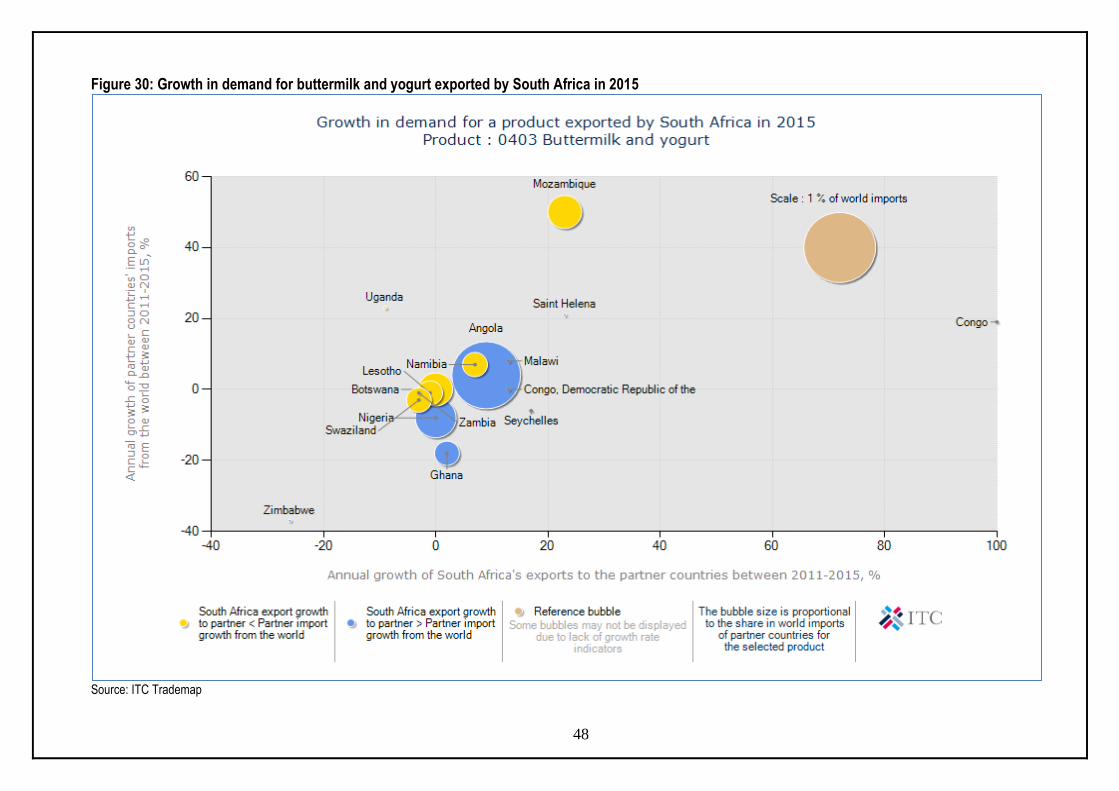
Figure 30: Growth in demand for buttermilk and yogurt exported by South Africa in 2015
Source: ITC Trademap
49
Figure 30 illustrates that South Africa’s exports of buttermilk and yoghurt represent 1.14% of the world exports in 2015. South Africa was losing the market share of buttermilk and yoghurt in Mozambique, Namibia, Zambia, Botswana, Swaziland, Uganda and Lesotho, because its exports were growing at a rate that is less than their import growth from the rest of the world. During the same periods, South Africa’s buttermilk and yoghurt exports to Democratic Republic of Congo Angola, Seychelles, Ghana, Malawi, Nigeria, Zimbabwe and Saint Helena were growing at a rate that is greater than their imports from the rest of the world. Therefore South Africa is gaining the market share in these countries. The fastest growing market of South African buttermilk and Yogurt exist in Mozambique with the annual South African exports of 23%.

50
Figure 31: Prospects for market diversification for buttermilk and yogurt exported by South Africa in 2015
Source: ITC Trademap
51
South Africa’s exports of buttermilk and yoghurt are dominant in Angola. If South Africa wishes to diversify its exports the most attractive markets will be Comoros, Uganda and Saint Helena (see Figure 31). Their growth of imports from the world is at 38%, 23% and 21% respectively.

52
7.1.4. Whey and other natural milk products Table 25: List of importing markets for whey and natural milk exported by South Africa in 2015 South Africa's exports represent 0.18% of world exports for whey and natural milk and its ranking in world exports is 36.
Importers
Trade Indicators
Tariff (estimated) faced by South Africa (%)
Exported value 2015 (USD thousand)
Trade balance 2015 (USD thousand)
Share in South Africa's exports (%)
Exported quantity 2015
Quantity unit
Unit value (USD/unit)
Exported growth in value between 2011-2015 (%, p.a.)
Exported growth in quantity between 2011-2015 (%, p.a.)
Exported growth in value between 2014-2015 (%, p.a.)
Ranking of partner countries in world imports
Share of partner countries in world imports (%)
Total import growth in value of partner countries between 2011-2015 (%, p.a.)
World 7153 -16427 100 5488 Tons 1303 23 12 16 100 0
Namibia 2333 2333 32.6 582 Tons 4009 86 74 11 78 0.1 60 0
Japan 2284 2284 31.9 3339 Tons 684 35 48 255 8 3.3 0 179.2
Botswana 750 744 10.5 300 Tons 2500 5 -38 16 112 0 5 0
Lesotho 486 486 6.8 303 Tons 1604 44 58 -38 119 0 44 0
Zimbabwe 349 349 4.9 318 Tons 1097 42 65 -41 110 0 26
Zambia 227 227 3.2 204 Tons 1113 -9 -5 -67 127 0 -3 0
DRC 221 221 3.1 20 Tons 11050 67 9 342 120 0 38 5
Korea, Republic of 190 190 2.7 200 Tons 950 -8 -2 45 10 2.7 -1 44.6
Malaysia 124 124 1.7 125 Tons 992 9 10 91 13 2.4 -1 0
Swaziland 112 112 1.6 71 Tons 1577 -40 -46 173 132 0 -20 0
Mozambique 29 29 0.4 13 Tons 2231 -13 -18 -77 153 0 8 0
Source: ITC Trademap.
53
Table 25 shows that during 2015 South Africa exported a total of 5 488 tons of whey and natural milk products at an average value of US$1 303/unit. South Africa exported greater quantities of whey and natural milk products to Namibia, Japan, and Botswana. The greatest share of South African whey and natural milk products exports were destined to Namibia which commanded 32.6% share during the year 2015 followed by Japan taking 31.9% and Botswana by 10.5%. South Africa’s whey and natural milk products exports increased by 23% in value and 12% in quantity between the periods 2011 and 2015. During the same periods, exports of whey and natural milk products to Namibia increased by 86% in value and 74% in quantity and Japan experienced increases of 48% in quantity and 35% in value; while Lesotho increased by 44% in value and 58% in quantity. Between the periods 2014 and 2015, South Africa’s exports of whey and natural milk products increased by 16% in value. During the same period, Japan increased by 25%; DRC increased by 342% and Swaziland increased by 173% respectively in value.
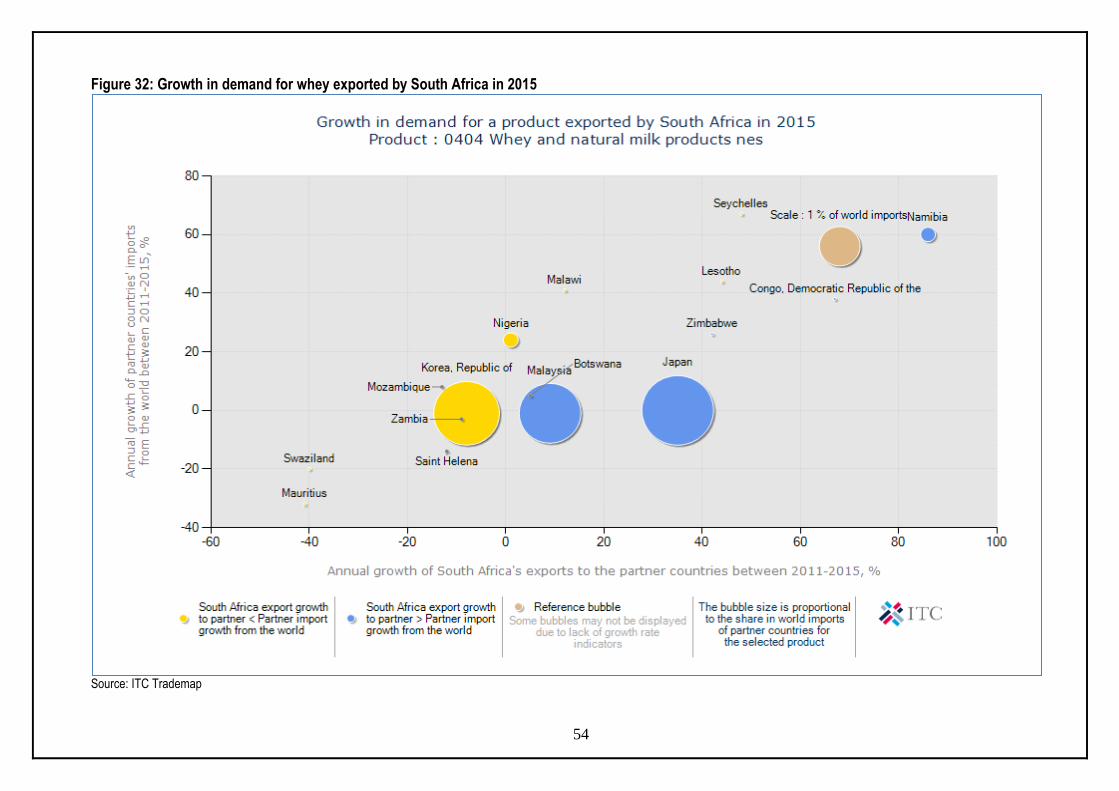
54
Figure 32: Growth in demand for whey exported by South Africa in 2015
Source: ITC Trademap

55
Figure 32 illustrates that South Africa’s exports of whey and natural milk products represent 0.18% of the world exports. Between 2011 and 2015 South Africa’s whey and natural milk products exported to Zambia, Lesotho, Seychelles, Mauritius, Swaziland, Nigeria and Malawi were growing at a rate that is less than their import growth from the rest of the world. Therefore, South Africa is losing the market share in the mentioned countries. During the same period, South Africa is gaining the market shares of whey and natural milk products exports in Japan, Malaysia, Zimbabwe, Namibia and Saint Helena because their imports from South Africa were growing at a rate that is greater than their imports from the rest of the world. Namibia annual growth of imports from the world of whey and a natural milk product is the highest at 60% rate.
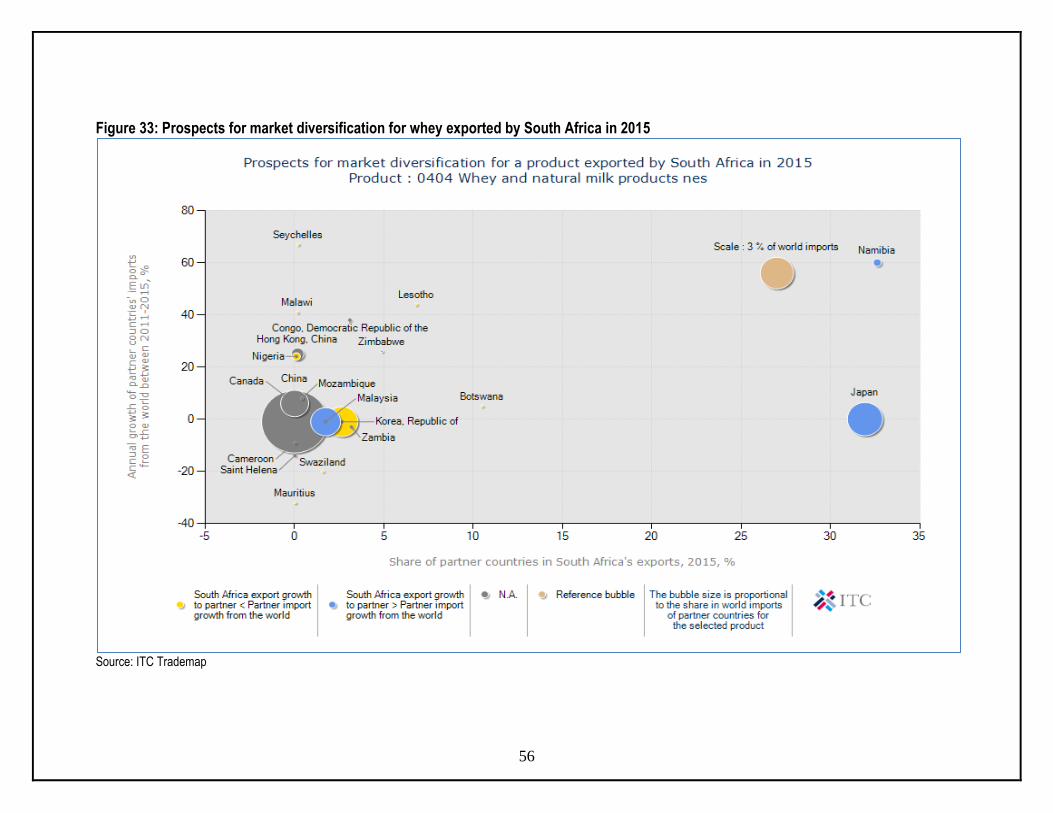
56
Figure 33: Prospects for market diversification for whey exported by South Africa in 2015
Source: ITC Trademap

57
The chart illustrates that Namibia is the biggest importer of South African whey and natural milk products with a share of 32.6% (see Figure 33). The biggest market exists in China with the world import share of 12.7%. South Africa might look on developing a new market in Seychelles because its annual import growth is at 67%. The fastest growing market although small exist in DRC. DRC’s annual import growth is at 38%. Therefore this market might be the most attractive market for South Africa’s diversification.

58
7.1.5. Butter and other fats and oils derived from milk Table 26: List of importing markets for butter and other fats and oils derived from milk exported by South Africa in 2015 South Africa’s export represent 0.17% of world export for butter and other fats and oils derived from milk, its ranking in world exports is 32.
Importers
Trade Indicators
Tariff (estimated) faced by South Africa (%)
Exported value 2015 (USD thousand)
Trade balance 2015 (USD thousand)
Share in South Africa's exports (%)
Exported quantity 2015
Quantity unit
Unit value (USD/unit)
Exported growth in value between 2011-2015 (%, p.a.)
Exported growth in quantity between 2011-2015 (%, p.a.)
Exported growth in value between 2014-2015 (%, p.a.)
Ranking of partner countries in world imports
Share of partner countries in world imports (%)
Total import growth in value of partner countries between 2011-2015 (%, p.a.)
World 11073 -4610 100 4463 Tons 2481 0 -9 -30 100 -1
Namibia 4899 4899 44.2 2446 Tons 2003 5 -9 -33 83 0.1 5 0
Mozambique 1564 1564 14.1 519 Tons 3013 4 14 -24 114 0 29 0
Botswana 1032 1032 9.3 378 Tons 2730 -16 -33 -6 133 0 -17 0
Zimbabwe 925 925 8.4 390 Tons 2372 -3 14 9 143 0 -19
Mauritius 853 853 7.7 237 Tons 3599 4 14 -13 77 0.1 -5 0
Zambia 525 525 4.7 125 Tons 4200 -1 -1 7 149 0 0 0
Tanzania 297 297 2.7 85 Tons 3494 71 99 12 123 0 65 0
Malawi 244 244 2.2 55 Tons 4436 12 7 4 145 0 37 15
Swaziland 237 237 2.1 73 Tons 3247 -34 -36 7 166 0 -34 0
Lesotho 167 167 1.5 75 Tons 2227 -17 17 -29 175 0 -17 0
DRC 103 103 0.9 24 Tons 4292 2 4 5 119 0 -19 20
Saint Helena 58 58 0.5 24 Tons 2417 13 29 -21 188 0 7
Ethiopia 53 53 0.5 5 Tons 10600 3 -65 112 0 167 30
Sources: ITC Trademap.

59
Table 26 shows that during 2015 South Africa exported a total of 4 463 tons of butter and other fats derived from milk at an average value of US$2 481/unit. South Africa exported greater quantities of butter and other fats derived from milk to Namibia, Mozambique and Botswana. The greatest share of South African butter and other fats derived from milk exports were destined to Namibia which commanded 44.2% share during the year 2015 followed by Mozambique (14.1%) and then Botswana received a share of 9.3%. South Africa’s butter and other fats derived from milk exports did not record any change in value, but decreased by 9% in quantity between the periods 2011 and 2015. During the same period, exports of butter and other fats derived from milk to Namibia increased by 5% in value and decreased by 9% in quantity. Mozambique increased by 4% in value and 14% in quantity and Botswana decreased by 16% in value and 33% in quantity. Between the period 2014 and 2015, South Africa’s exports of butter and other fats derived from butter and other fats and oils decreased by 30% in value. During the same period, Namibia decreased by 33% and Mozambique decreased by 24% in value.

60
Figure 34: Growth in demand for butter exported by South Africa in 2015
Source: ITC Trademap

61
Figure 34 illustrates that South Africa’s exports of butter and other fats and oils represent 0.17% of the world exports. Between 2011 and 2015 South Africa’s butter and other fats exported to Mozambique, Malawi and Namibia were growing at a rate that is less than their import growth from the rest of the world. During the same period, South Africa’s butter and other fats exports to Angola, Saint Helena, Ghana, Mauritius and Botswana were growing at a rate that is greater than their imports from the rest of the world. Ghana, Mauritius, Botswana and Lesotho represent the declining market while Angola and Saint Helena represent gains in the dynamic market. The most growing demand of butter and other fats and oils exist in Malawi with annual imports growth of 37% per annum during the period 2014 to 2015.

62
Figure 35: Prospects for market diversification for butter exported by South Africa in 2015
Source: ITC Trademap
63
Figure 35 illustrates that South Africa is currently exporting most of its butter and other fats to Namibia and Mozambique but if South Africa needs to diversify its export market, the biggest market exist in Ethiopia with an annual import growth of 167%. Malawi is a small market but its annual import growth of 37% is attractive.

64
7.1.6. Cheese and Curd Table 27: List of importing markets for the product exported by South Africa in 2015 South Africa’s exports represent 0.13% of world exports of cheese and curd, its ranking in world exports is 42.
Importers
Trade Indicators
Tariff (estimated) faced by South Africa (%)
Exported value 2015 (USD thousand)
Trade balance 2015 (USD thousand)
Share in South Africa's exports (%)
Exported quantity 2015
Quantity unit
Unit value (USD/unit)
Exported growth in value between 2011-2015 (%, p.a.)
Exported growth in quantity between 2011-2015 (%, p.a.)
Exported growth in value between 2014-2015 (%, p.a.)
Ranking of partner countries in world imports
Share of partner countries in world imports (%)
Total import growth in value of partner countries between 2011-2015 (%, p.a.)
World 34049 -21433 100 9079 Tons 3750 3 -6 -4 100 0
Namibia 11314 11314 33.2 2763 Tons 4095 3 -15 -4 94 0 2 0
Botswana 4663 4659 13.7 1350 Tons 3454 -5 -18 -8 124 0 -5 0
Mozambique 4498 4498 13.2 1450 Tons 3102 8 18 -11 123 0 32 12.5
Zambia 3984 3984 11.7 1099 Tons 3625 15 23 9 125 0 13 0
Zimbabwe 3128 3128 9.2 680 Tons 4600 2 9 1 140 0 -3
Swaziland 2451 2448 7.2 703 Tons 3486 -1 -15 -7 143 0 -1 0
Lesotho 1021 1021 3 225 Tons 4538 -6 10 0 162 0 -6 0
Malawi 710 710 2.1 189 Tons 3757 14 14 25 168 0 7 15
DRC 528 528 1.6 119 Tons 4437 16 22 -8 149 0 -2 19.8
United Arab Emirates 362 362 1.1 93 Tons 3892 143 210 -14 27 0.9 -3 5
Angola 297 297 0.9 102 Tons 2912 -17 -11 -5 82 0.1 0 20
Nigeria 217 217 0.6 73 Tons 2973 -6 10 -8 127 0 7 20
Seychelles 198 198 0.6 49 Tons 4041 59 74 -19 147 0 14 0
Tanzania 168 168 0.5 21 Tons 8000 2 10 22 155 0 17 0
Sources: ITC Trademap.

65
Table 27 shows that during 2015 South Africa exported a total of 9 079 tons of cheese and curd at an average value of US$3 750/unit. South Africa exported greater quantities of cheese and curd to Namibia, Botswana and Mozambique. The greatest share of South African cheese and curd exports were destined to Namibia which commanded 33.2% share during the year 2015 followed by Botswana with 13.7% and then Mozambique by 13.2%. South Africa’s exports of cheese and curd increased by 3% in value and decreased by 6% in quantity between the period 2011 and 2015. During the same period, exports of cheese and curd to Namibia increased by 3% in value and decreased by 15% in quantity. Botswana decreased by 5% in value and 18% in quantity and Mozambique increased by 8% in value and quantity by 18%. Between the period 2014 and 2015, South Africa’s exports of cheese and curd decreased by 4% in value. During the same period, Namibia decreased by 4%, Botswana decreased by 8% and Mozambique decreased by 11%.

66
Figure 36: Growth in demand for cheese and curd from South Africa in 2015
Source: ITC Trademap

67
Figure 36 illustrates that that South Africa’s exports of cheese and curd represent 0.13% of the world exports. Between 2011 and 2015 South Africa is losing the market share of cheese and curd exports to Mauritius, Angola, United Republic of Tanzania, Mozambique and Nigeria because its exports were growing at a rate that is less than their import growth from the rest of the world. During the same period, South Africa gained the market share of cheese and curd exports to Zambia, Namibia, Malawi and United Arab Emirates because these markets were growing at a rate that is greater than their imports from the rest of the world. The most growing demand for cheese and curd exist in Mozambique with an annual import growth of 32%.
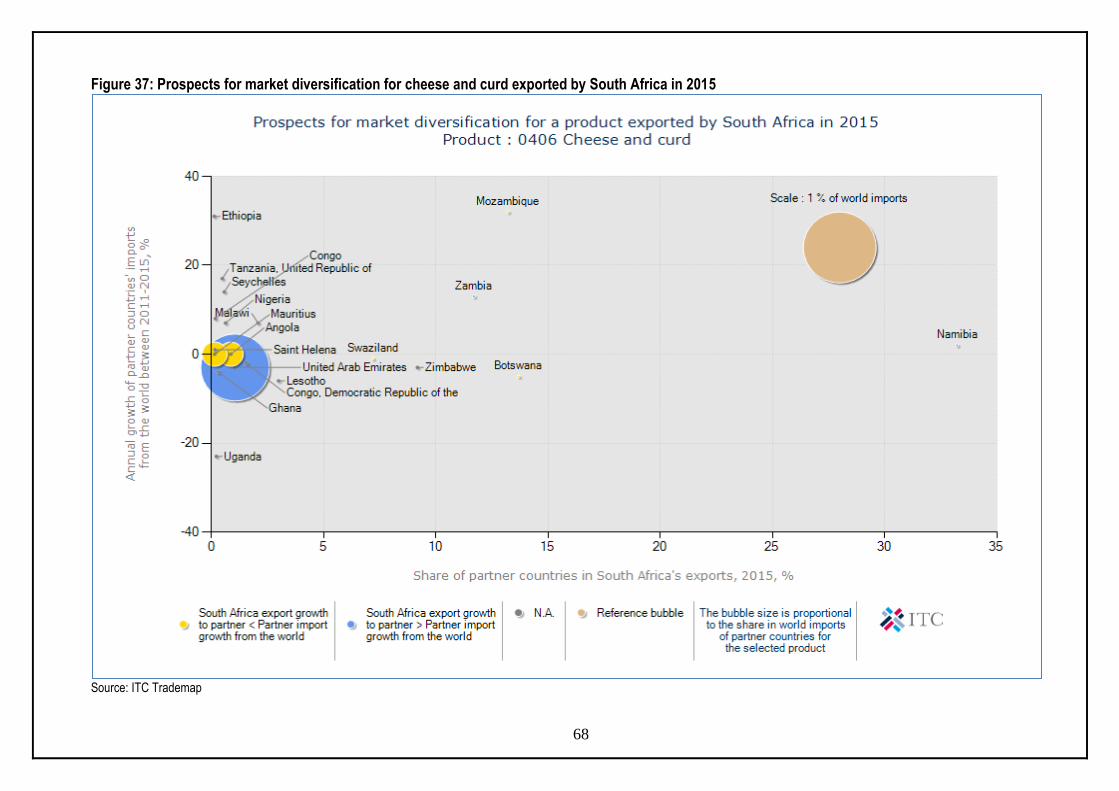
68
Figure 37: Prospects for market diversification for cheese and curd exported by South Africa in 2015
Source: ITC Trademap

69
Figure 37 shows that Namibia, Botswana and Mozambique are the world’s greatest importers of South African cheese and curd. They have shares in South African market of 33.2%, 13.7% and 13.2% respectively. If South Africa wishes to diversify, the small and fastest growing market is Ethiopia. Ethiopia’s annual import growth is at 31% rate. This is the most lucrative market for South Africa.
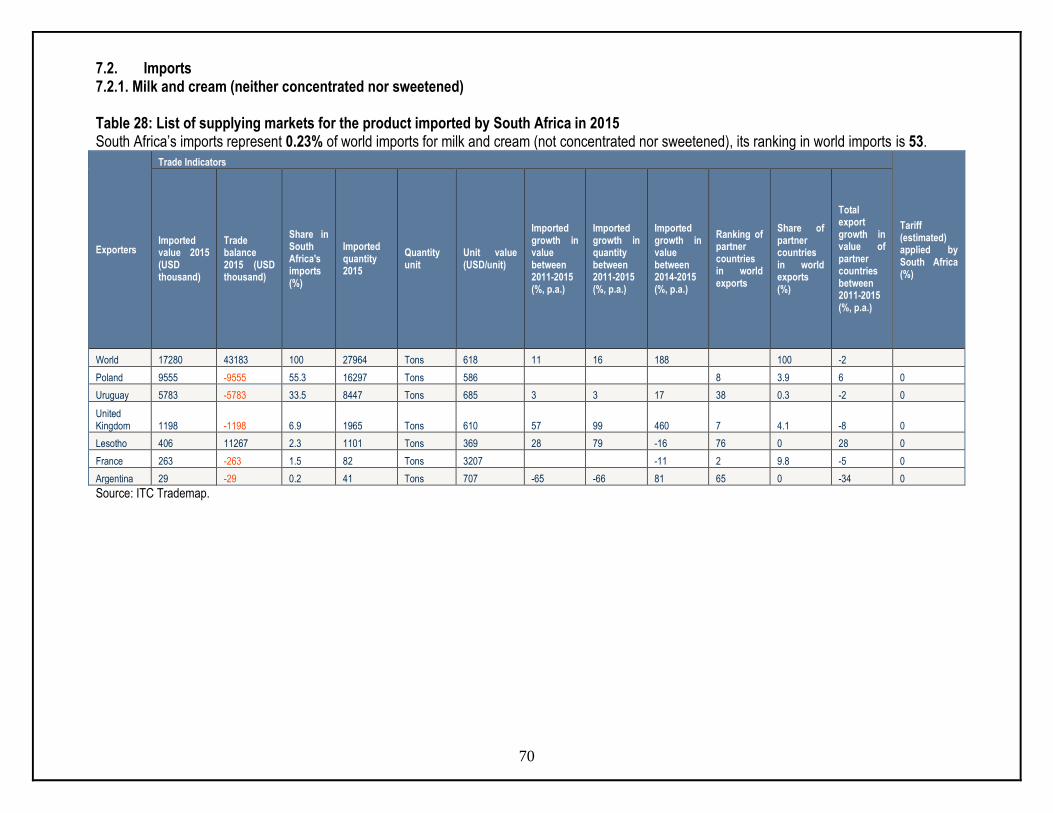
70
7.2. Imports 7.2.1. Milk and cream (neither concentrated nor sweetened) Table 28: List of supplying markets for the product imported by South Africa in 2015 South Africa’s imports represent 0.23% of world imports for milk and cream (not concentrated nor sweetened), its ranking in world imports is 53.
Exporters
Trade Indicators
Tariff (estimated) applied by South Africa (%)
Imported value 2015 (USD thousand)
Trade balance 2015 (USD thousand)
Share in South Africa's imports (%)
Imported quantity 2015
Quantity unit
Unit value (USD/unit)
Imported growth in value between 2011-2015 (%, p.a.)
Imported growth in quantity between 2011-2015 (%, p.a.)
Imported growth in value between 2014-2015 (%, p.a.)
Ranking of partner countries in world exports
Share of partner countries in world exports (%)
Total export growth in value of partner countries between 2011-2015 (%, p.a.)
World 17280 43183 100 27964 Tons 618 11 16 188 100 -2
Poland 9555 -9555 55.3 16297 Tons 586 8 3.9 6 0
Uruguay 5783 -5783 33.5 8447 Tons 685 3 3 17 38 0.3 -2 0
United Kingdom 1198 -1198 6.9 1965 Tons 610 57 99 460 7 4.1 -8 0
Lesotho 406 11267 2.3 1101 Tons 369 28 79 -16 76 0 28 0
France 263 -263 1.5 82 Tons 3207 -11 2 9.8 -5 0
Argentina 29 -29 0.2 41 Tons 707 -65 -66 81 65 0 -34 0
Source: ITC Trademap.

71
Table 28 shows that during 2015 South Africa imported a total of 27 964 tons of milk and cream (not concentrated nor sweetened), at an average value of US$618/unit. South Africa imported greater quantities of milk and cream, (not concentrated or sweetened) from Poland, Uruguay, and United Kingdom. The greatest share of South African milk and cream (not concentrated or sweetened) imports originated from Poland which commanded 55.3% share during the year 2015 followed at a distance by Uruguay with 33.5% and United Kingdom with 6.9%. South Africa’s milk and cream (not concentrated or sweetened) imports increased by 11% in value and 16% in quantity between the period 2011 and 2015. During the same period, imports of milk and cream (not concentrated or sweetened) from Uruguay increased by 3% in value and 3% in quantity, United Kingdom increased drastically in value and quantity by 57% and 99% respectively. Between the period 2014 and 2015 South Africa’s imports of milk and cream (not concentrated or sweetened) increased by 188% in value. During the same period imports of milk and cream (not concentrated or sweetened) from Uruguay to South Africa increased by 17% and United Kingdom imports increased by 460% in value.

72
Figure 38: Competitiveness of suppliers to South Africa for unsweetened milk and cream in 2015
Source: ITC Trademap

73
Figure 38 illustrates that South Africa’s imports between 2011 and 2015 represent 0.23% of the world’s imports of milk and cream, not concentrated or sweetened. During the same period, South Africa is gaining the market share of milk and cream imports from Uruguay and United Kingdom because South Africa’s import growth were growing at a rate that is greater than these countries’ exports to the rest of the world. The most competitive market is United Kingdom because its annual export growth rate was at 57% during the period 2011 to 2015, but the biggest market exists in Germany with the world share of 17.4%.

74
Figure 39: Prospects for diversification of suppliers for unsweetened milk and cream imported by South Africa in 2015
Source: ITC Trademap

75
Figure 39 illustrates that Germany is not a big supplier of South Africa’s market for milk and cream (not concentrated or sweetened) but it was the world’s greatest exporter of milk and cream (not concentrated or sweetened) over the period 2011 to 2015. However, Germany’s annual export growth is very low at -4%. South Africa can easily diversify to Germany for market development. The second attractive market exists in Lesotho with the annual export growth of 26%.
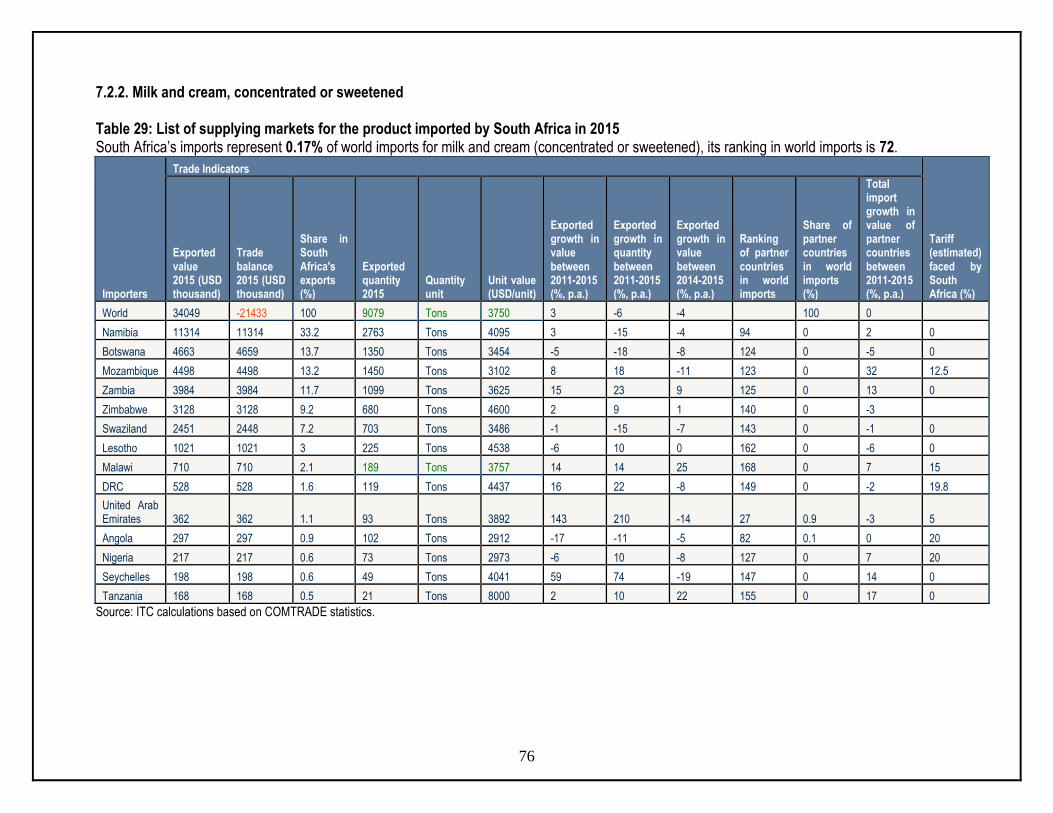
76
7.2.2. Milk and cream, concentrated or sweetened Table 29: List of supplying markets for the product imported by South Africa in 2015 South Africa’s imports represent 0.17% of world imports for milk and cream (concentrated or sweetened), its ranking in world imports is 72.
Importers
Trade Indicators
Tariff (estimated) faced by South Africa (%)
Exported value 2015 (USD thousand)
Trade balance 2015 (USD thousand)
Share in South Africa's exports (%)
Exported quantity 2015
Quantity unit
Unit value (USD/unit)
Exported growth in value between 2011-2015 (%, p.a.)
Exported growth in quantity between 2011-2015 (%, p.a.)
Exported growth in value between 2014-2015 (%, p.a.)
Ranking of partner countries in world imports
Share of partner countries in world imports (%)
Total import growth in value of partner countries between 2011-2015 (%, p.a.)
World 34049 -21433 100 9079 Tons 3750 3 -6 -4 100 0
Namibia 11314 11314 33.2 2763 Tons 4095 3 -15 -4 94 0 2 0
Botswana 4663 4659 13.7 1350 Tons 3454 -5 -18 -8 124 0 -5 0
Mozambique 4498 4498 13.2 1450 Tons 3102 8 18 -11 123 0 32 12.5
Zambia 3984 3984 11.7 1099 Tons 3625 15 23 9 125 0 13 0
Zimbabwe 3128 3128 9.2 680 Tons 4600 2 9 1 140 0 -3
Swaziland 2451 2448 7.2 703 Tons 3486 -1 -15 -7 143 0 -1 0
Lesotho 1021 1021 3 225 Tons 4538 -6 10 0 162 0 -6 0
Malawi 710 710 2.1 189 Tons 3757 14 14 25 168 0 7 15
DRC 528 528 1.6 119 Tons 4437 16 22 -8 149 0 -2 19.8
United Arab Emirates 362 362 1.1 93 Tons 3892 143 210 -14 27 0.9 -3 5
Angola 297 297 0.9 102 Tons 2912 -17 -11 -5 82 0.1 0 20
Nigeria 217 217 0.6 73 Tons 2973 -6 10 -8 127 0 7 20
Seychelles 198 198 0.6 49 Tons 4041 59 74 -19 147 0 14 0
Tanzania 168 168 0.5 21 Tons 8000 2 10 22 155 0 17 0
Source: ITC calculations based on COMTRADE statistics.
77
Table 29 shows that during 2015 South Africa imported a total of 9 079 tons of milk and cream (concentrated or sweetened), at an average value of US$2 484/unit. South Africa imported greater quantities of milk and cream, (concentrated or sweetened) from France, United Kingdom and New Zealand. The greatest share of South African milk and cream (concentrated or sweetened) imports originated from France which commanded 27.5% share during the year 2015 followed by United Kingdom with 21.5% and New Zealand with 18.3%. South Africa’s milk and cream (not concentrated or sweetened) imports increased by 0% in value and 6% in quantity between the period 2011 and 2015. During the same period, imports of milk and cream (concentrated or sweetened) from France also increased by 11% in value and 17% in quantity and United Kingdom increased in value and quantity by 111% and 117% respectively. Between the period 2014 and 2015, South Africa’s imports of milk and cream (concentrated or sweetened) decreased by 19% in value. During the same period, France’s milk and cream (concentrated or sweetened) exports to South Africa decreased by 22% in value and United Kingdom increased by 20% in value during the same period.

78
Figure 40: Competitiveness of suppliers to South Africa for sweetened milk and cream in 2015
Source: ITC Trademap

79
Figure 40 illustrates that between 2011 and 2015 South Africa’s milk and cream (concentrated or sweetened) imports from Germany, United States of America, Switzerland, Ireland, Lithuania, Netherlands, Italy, Argentina and Australia were growing at a rate that is less than their export growth to the rest of the world. During the same period, South Africa’s milk and cream, concentrated or sweetened imports from Belgium, France, New Zealand, United Kingdom, Botswana, Lesotho and Belgium were growing at a rate that is greater than their exports to the rest of the world. Italy is the biggest competitive market with a world market share of 0.3% and an annual growth of 20%.

80
Figure 41: Prospects for diversification of suppliers for sweetened milk and cream imported by South Africa in 2015
Source: ITC Trademap

81
Figure 41 illustrates that Italy is neither the biggest supplier of South Africa’s market for milk and cream (concentrated or sweetened) nor the main world exporter. Its share in world exports was at 0.3% per annum over the period 2011 to 2015, with an annual growth rate of 20%. Italy is therefore the biggest prospective supplier for South Africa’s milk and cream (concentrated or sweetened). The chart also shows that United Kingdom is the second prospective import market due to its annual exports growth rate of 9% during 2011 to 2015. It represents a small possible supplier for South Africa’s milk and cream (concentrated or sweetened).

82
7.2.3. Buttermilk and yoghurt Table 30: List of supplying markets for the product imported by South Africa in 2015 South Africa’s imports represent 0.15% of world imports for Buttermilk and yoghurt, its ranking in world’s imports is 65.
Exporters
Trade Indicators
Tariff (estimated) applied by South Africa (%)
Imported value 2015 (USD thousand)
Trade balance 2015 (USD thousand)
Share in South Africa's imports (%)
Imported quantity 2015
Quantity unit
Unit value (USD/unit)
Imported growth in value between 2011-2015 (%, p.a.)
Imported growth in quantity between 2011-2015 (%, p.a.)
Imported growth in value between 2014-2015 (%, p.a.)
Ranking of partner countries in world exports
Share of partner countries in world exports (%)
Total export growth in value of partner countries between 2011-2015 (%, p.a.)
World 5892 39362 100 2654 Tons 2220 1 4 -27 100 -1
France 2262 -2220 38.4 1131 Tons 2000 15 22 32 2 15.1 -5 0
Germany 1014 -1014 17.2 342 Tons 2965 111 118 -76 1 21.9 1 0
New Zealand 860 -859 14.6 398 Tons 2161 -22 -17 -44 10 3 1 9.4
United Kingdom 721 -721 12.2 301 Tons 2395 -20 -10 6455 13 2.2 4 0
Ireland 718 -718 12.2 375 Tons 1915 -16 -7 457 17 1.2 -4 0
Netherlands 137 -137 2.3 43 Tons 3186 -20 -24 -51 9 3 1 0
USA 110 -110 1.9 41 Tons 2683 18 1 55 16 1.6 -17 9.4
Italy 29 -29 0.5 4 Tons 7250 -2 -12 27 0.5 4 0
Source: ITC calculations based on COMTRADE statistics.

83
Table 30 shows that during 2015 South Africa imported a total of 2 654tons of buttermilk and yoghurt, at an average value of US$2 220/unit. South Africa imported greater quantities of milk and cream, (concentrated or sweetened) from France, Germany and New Zealand. The greatest share of South African buttermilk and yoghurt imports originated from France which commanded 38.4% share during the year 2015 followed by Germany with 17.2% and New Zealand with 14.6%. South Africa’s buttermilk and yoghurt imports increased by 1% in value and 4% in quantity between the period 2011 and 2015. During the same period, imports of buttermilk and yoghurt from France also increased by 15% in value and 22% in quantity and imports from Germany increased by 111% in value and 118% in quantity during the same period. Between the periods 2014 and 2015, South Africa’s imports of buttermilk and yoghurt decreased by 27% in value. During the same period, France’s buttermilk and yoghurt exports increased by 32%, Germany decreased by 76% while New Zealand decreased by 44%.
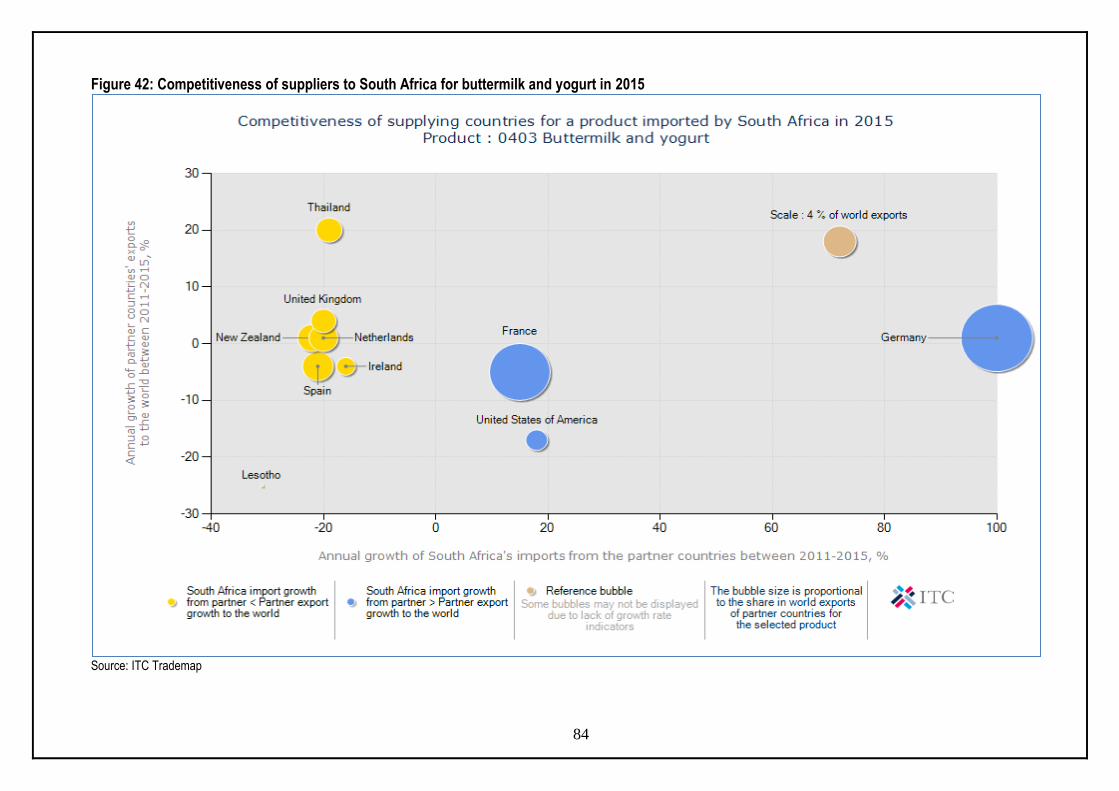
84
Figure 42: Competitiveness of suppliers to South Africa for buttermilk and yogurt in 2015
Source: ITC Trademap

85
Figure 42 illustrates that between 2011 and 2015 South Africa’s buttermilk and yoghurt imported from Ireland, Thailand, Spain, United Kingdom, New Zealand and Netherland were growing at a rate that is less than their export growth to the world. During the same period, South Africa’s buttermilk and yoghurt imports from United States of America, France and Germany were growing at a rate that is greater than their exports to the rest of the world. Germany is the most competitive market during the period 2011 and 2015 due to its world market share of 21.9% followed by France with the world market share of 15.1%.
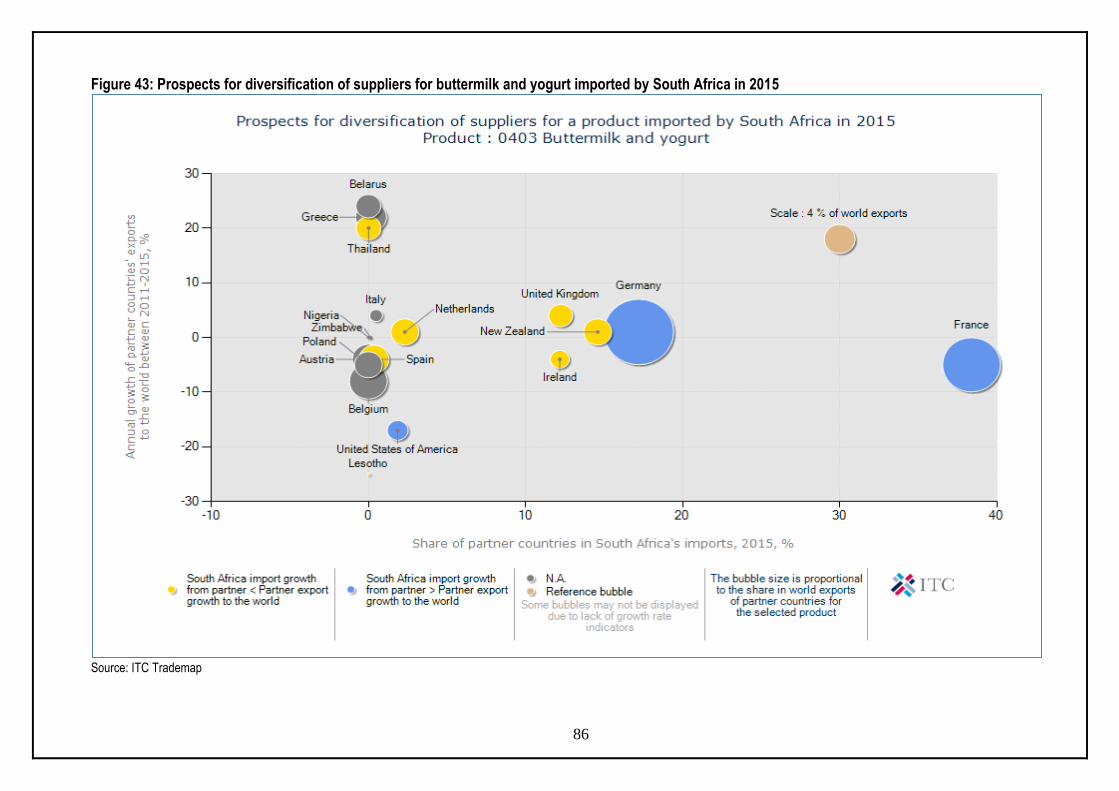
86
Figure 43: Prospects for diversification of suppliers for buttermilk and yogurt imported by South Africa in 2015
Source: ITC Trademap

87
France is the biggest supplier of buttermilk and yoghurt and has a share of 38.39% of South African’s imports (see Figure 43). France has an annual export growth of -5%. South Africa can diversify to the fastest growing markets of buttermilk and yoghurt at Belarus with an annual export growth of 24%.
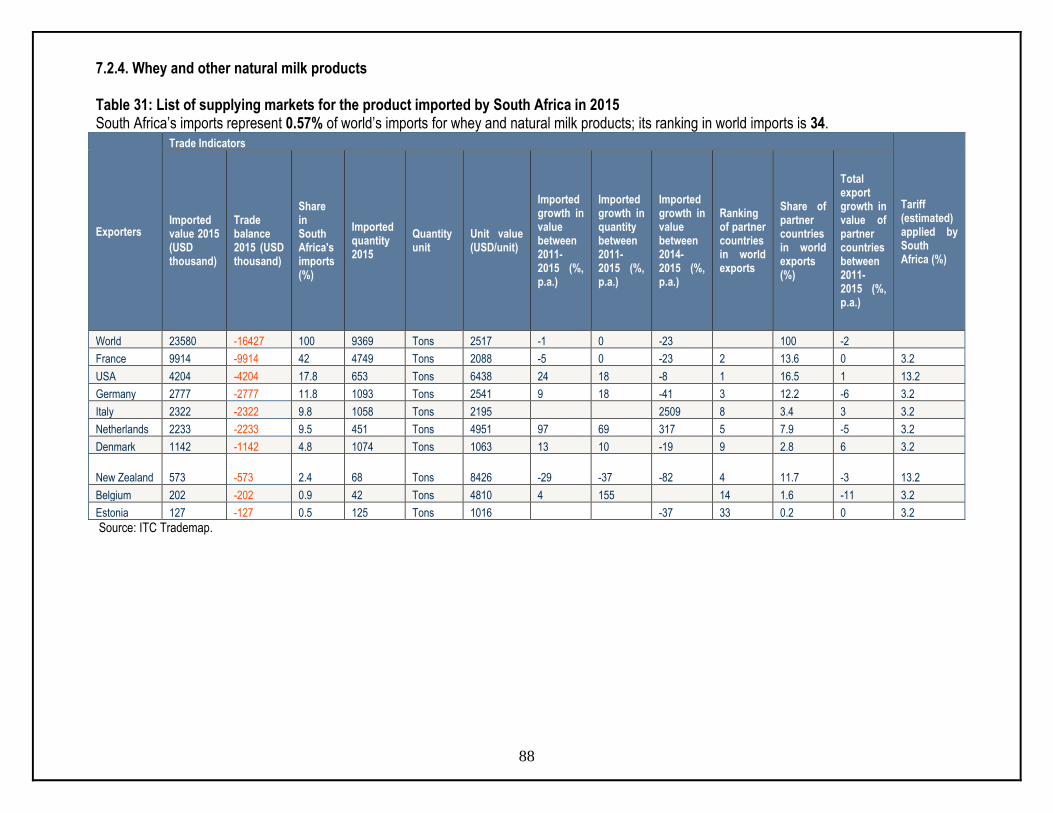
88
7.2.4. Whey and other natural milk products Table 31: List of supplying markets for the product imported by South Africa in 2015 South Africa’s imports represent 0.57% of world’s imports for whey and natural milk products; its ranking in world imports is 34.
Exporters
Trade Indicators
Tariff (estimated) applied by South Africa (%)
Imported value 2015 (USD thousand)
Trade balance 2015 (USD thousand)
Share in South Africa's imports (%)
Imported quantity 2015
Quantity unit
Unit value (USD/unit)
Imported growth in value between 2011-2015 (%, p.a.)
Imported growth in quantity between 2011-2015 (%, p.a.)
Imported growth in value between 2014-2015 (%, p.a.)
Ranking of partner countries in world exports
Share of partner countries in world exports (%)
Total export growth in value of partner countries between 2011-2015 (%, p.a.)
World 23580 -16427 100 9369 Tons 2517 -1 0 -23 100 -2
France 9914 -9914 42 4749 Tons 2088 -5 0 -23 2 13.6 0 3.2
USA 4204 -4204 17.8 653 Tons 6438 24 18 -8 1 16.5 1 13.2
Germany 2777 -2777 11.8 1093 Tons 2541 9 18 -41 3 12.2 -6 3.2
Italy 2322 -2322 9.8 1058 Tons 2195 2509 8 3.4 3 3.2
Netherlands 2233 -2233 9.5 451 Tons 4951 97 69 317 5 7.9 -5 3.2
Denmark 1142 -1142 4.8 1074 Tons 1063 13 10 -19 9 2.8 6 3.2
New Zealand 573 -573 2.4 68 Tons 8426 -29 -37 -82 4 11.7 -3 13.2
Belgium 202 -202 0.9 42 Tons 4810 4 155 14 1.6 -11 3.2
Estonia 127 -127 0.5 125 Tons 1016 -37 33 0.2 0 3.2
Source: ITC Trademap.
89
Table 31 shows that during 2015 South Africa imported a total of 9 369 tons of whey and natural milk products, at an average value of US$2 517/unit. South Africa imported greater quantities of whey and natural milk products from France, United States of America and Germany. The greatest share of South African whey and natural milk products’ imports originated from France which commanded 42% share during the year 2015 followed by United States of America with 17.8% and Germany with 11.8%. South Africa’s whey and natural milk products imports decreased by 1% in value and 0% in quantity between the period 2011 and 2015. During the same period, imports of whey and natural milk products from France decreased by 5% in value and 0% in quantity. Imports from United States of America increased by 24% in value and 18% in quantity. Germany experienced an increase of 9% in value and 18% in quantity during 2011 to 2015. Between the period 2014 and 2015 South Africa’s imports of whey and natural milk products experienced a decrease of 23% in value. During the same period, France’ whey and natural milk products exports to South Africa decreased by 23% in value while imports from United States of America decreased by 8% in value.
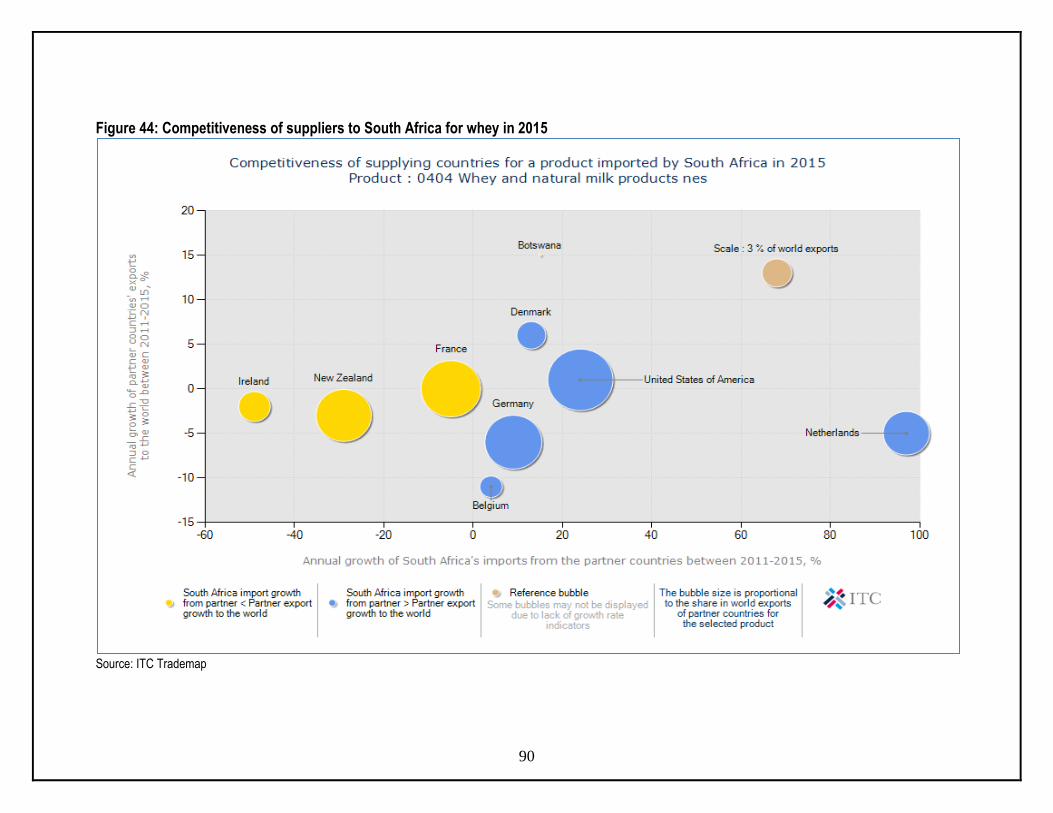
90
Figure 44: Competitiveness of suppliers to South Africa for whey in 2015
Source: ITC Trademap

91
Figure 44 illustrates that between 2011 and 2015 South Africa’s whey and natural milk products imported from Ireland, Botswana, France and New Zealand were growing at a rate that is less than their export growth to the rest of the world. During the same period, South Africa’s whey and natural milk products imported from Netherlands, Belgium, Germany, Denmark and United States of America were growing at a rate that is greater than their exports to the rest of the world. The most competitive supplier of whey and natural milk products is Botswana which has an annual import growth of 14% followed by Denmark by 6%.
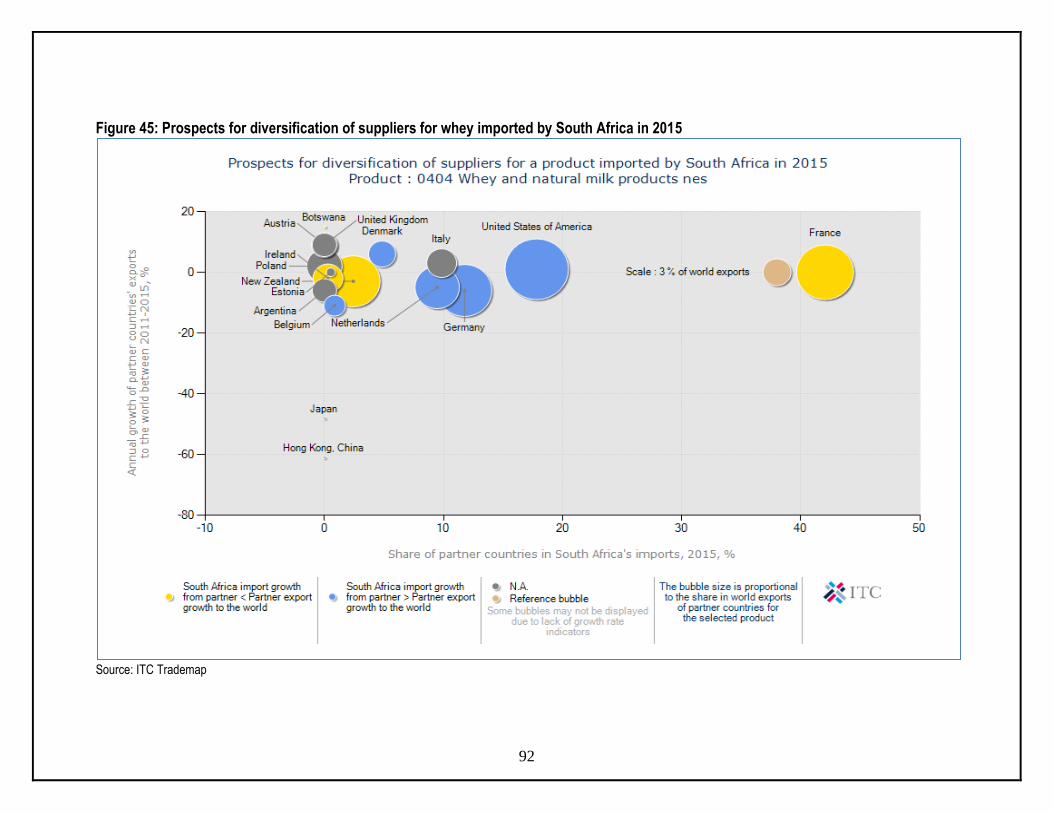
92
Figure 45: Prospects for diversification of suppliers for whey imported by South Africa in 2015
Source: ITC Trademap

93
South Africa is already importing from the biggest exporters of whey and natural milk products which are USA, France and Germany. USA has a world market share of 16.5%, France has 13.6% while Germany has a world market share of 12.2% during 2015. They have share of South Africa’s import market of 17.83%, 42.04% and 11.78% respectively.

94
7.2.5. Butter and other fats and oils derived from milk Table 32: List of supplying markets for the product imported by South Africa in 2015 South Africa’s imports represent 0.24% of world imports for butter and other fats and oils derived from milk, its ranking in world’s imports is 52.
Exporters
Trade Indicators
Tariff (estimated) applied by South Africa (%)
Imported value 2015 (USD thousand)
Trade balance 2015 (USD thousand)
Share in South Africa's imports (%)
Imported quantity 2015
Quantity unit
Unit value (USD/unit)
Imported growth in value between 2011-2015 (%, p.a.)
Imported growth in quantity between 2011-2015 (%, p.a.)
Imported growth in value between 2014-2015 (%, p.a.)
Ranking of partner countries in world exports
Share of partner countries in world exports (%)
Total export growth in value of partner countries between 2011-2015 (%, p.a.)
World 15683 -4610 100 5132 Tons 3056 -6 -1 70 100 -2
New Zealand 9231 -9231 58.9 3721 Tons 2481 -11 -3 124 1 24.7 -1 10.2
Ireland 3043 -3043 19.4 631 Tons 4823 3 9 -18 3 10.5 -1 10.2
Denmark 1325 -1325 8.4 248 Tons 5343 13 14 26 8 3.2 -10 10.2
United Kingdom 1177 -1177 7.5 345 Tons 3412 239 331 1318 9 2.7 1 10.2
France 691 -691 4.4 129 Tons 5357 75 84 432 6 6.8 2 10.2
Belgium 99 -99 0.6 17 Tons 5824 -30 -27 5 5 7.8 -3 10.2
Netherlands 64 -64 0.4 9 Tons 7111 611 2 14.2 1 10.2
Source: ITC calculations based on COMTRADE statistics.

95
Table 32 shows that during 2015 South Africa imported a total of 5 132 tons of butter and other fats, at an average value of US$3 056/unit. South Africa imported greater quantities of butter and other fats from New Zealand, Ireland and Denmark. The greatest share of South African butter and other fats imports originated from New Zealand which commanded 58.9% share during the year 2015, followed by Ireland by 19.4% and Denmark by 8.4%. South Africa’s butter and other fats imports decreased by 6% in value and by 1% in quantity between the period 2011 and 2015. During the same period, imports of butter and other fats from New Zealand decreased by 11% in value and 3% in quantity while Ireland increased by 3% in value and 9% in quantity. Denmark increased by 13% in value and 14% in quantity. Between the periods 2014 and 2015, South Africa’s imports of butter and other fats increased by 70% in value. During the same period, New Zealand’s butter and other fats exports to South Africa increased by 124% in value while imports from Ireland decreased by 18%.

96
Figure 46: Competitiveness of suppliers to South Africa for butter in 2015
Source: ITC Trademap
97
Figure 46 illustrates that between 2011 and 2015 South Africa’s butter and other fats imported from New Zealand and Belgium were growing at a rate that is less than their export growth to the rest of the world. During the same period, South Africa’s butter and other fats imports from Denmark, France, Ireland and United Kingdom were growing at a rate that is greater than their exports to the rest of the world. France is the most competitive supplier of butter and other fats because its world market share is 6.8% and its annual exports growth increased by 2% and it exported a share of 75% of butter and other fats to South Africa.

98
Figure 47: Prospects for diversification of suppliers for butter imported by South Africa in 2015
Source: ITC Trademap

99
Figure 47 illustrates that New Zealand is the main supplier of world’s butter and other fats. If South Africa wishes to diversify from New Zealand, Ghana will be the prospective supplier due to its exports annual growth of 65%. It is a small market with a world market share of 0.3% but South Africa might have a chance to develop a new market. The biggest market is New Zealand with the world market share of 24.7%.
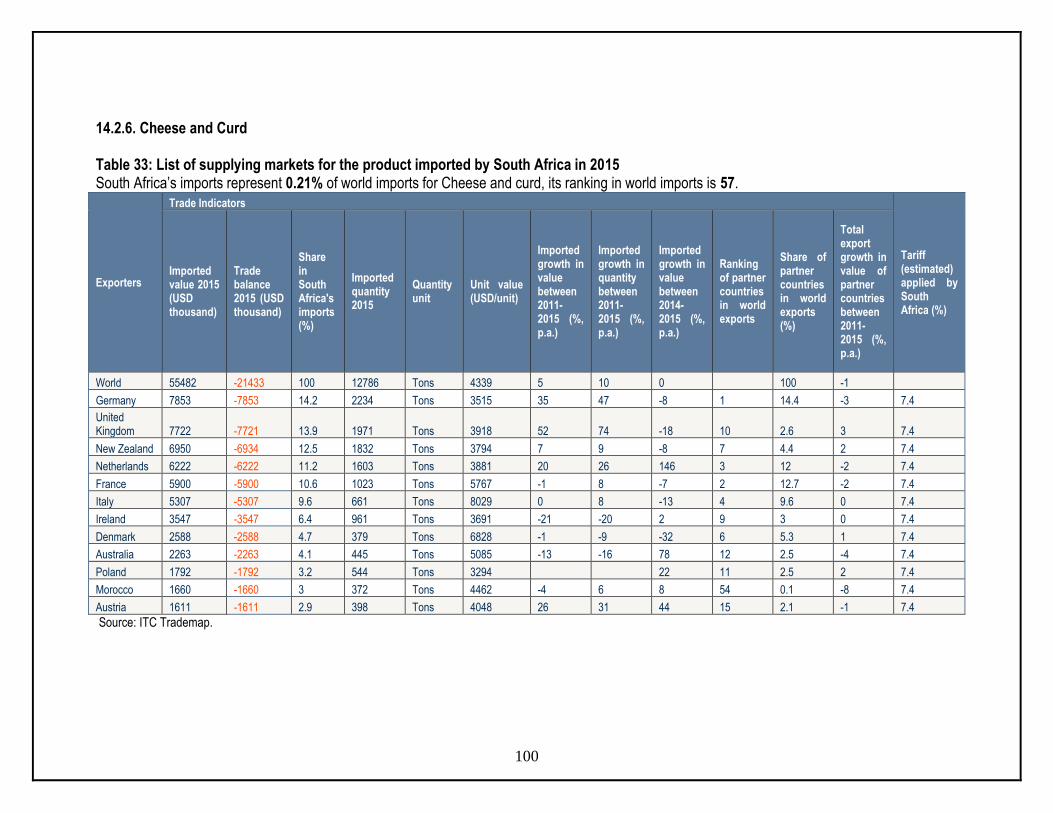
100
14.2.6. Cheese and Curd Table 33: List of supplying markets for the product imported by South Africa in 2015 South Africa’s imports represent 0.21% of world imports for Cheese and curd, its ranking in world imports is 57.
Exporters
Trade Indicators
Tariff (estimated) applied by South Africa (%)
Imported value 2015 (USD thousand)
Trade balance 2015 (USD thousand)
Share in South Africa's imports (%)
Imported quantity 2015
Quantity unit
Unit value (USD/unit)
Imported growth in value between 2011-2015 (%, p.a.)
Imported growth in quantity between 2011-2015 (%, p.a.)
Imported growth in value between 2014-2015 (%, p.a.)
Ranking of partner countries in world exports
Share of partner countries in world exports (%)
Total export growth in value of partner countries between 2011-2015 (%, p.a.)
World 55482 -21433 100 12786 Tons 4339 5 10 0 100 -1
Germany 7853 -7853 14.2 2234 Tons 3515 35 47 -8 1 14.4 -3 7.4
United Kingdom 7722 -7721 13.9 1971 Tons 3918 52 74 -18 10 2.6 3 7.4
New Zealand 6950 -6934 12.5 1832 Tons 3794 7 9 -8 7 4.4 2 7.4
Netherlands 6222 -6222 11.2 1603 Tons 3881 20 26 146 3 12 -2 7.4
France 5900 -5900 10.6 1023 Tons 5767 -1 8 -7 2 12.7 -2 7.4
Italy 5307 -5307 9.6 661 Tons 8029 0 8 -13 4 9.6 0 7.4
Ireland 3547 -3547 6.4 961 Tons 3691 -21 -20 2 9 3 0 7.4
Denmark 2588 -2588 4.7 379 Tons 6828 -1 -9 -32 6 5.3 1 7.4
Australia 2263 -2263 4.1 445 Tons 5085 -13 -16 78 12 2.5 -4 7.4
Poland 1792 -1792 3.2 544 Tons 3294 22 11 2.5 2 7.4
Morocco 1660 -1660 3 372 Tons 4462 -4 6 8 54 0.1 -8 7.4
Austria 1611 -1611 2.9 398 Tons 4048 26 31 44 15 2.1 -1 7.4
Source: ITC Trademap.

101
Table 33 shows that during 2015, South Africa imported a total of 12 786 tons of cheese and curd, at an average value of US$4 339/unit. South Africa imported greater quantities of cheese and curd from Germany, United Kingdom and New Zealand. The greatest share of South African cheese and curd imports originated from Germany which commanded 14.2% share during the year 2015 followed by United Kingdom with 13.9% share and New Zealand with 12.5%. South Africa’s imported cheese and curd increased by 5% in value and 10% in quantity between the period 2011 and 2015. During the same period, imports of cheese and curd from Germany increased by 35% in value and 47% in quantity. Imports from United Kingdom increased by 52% in value and 74% in quantity and imports from New Zealand increased by 7% in value and by 9% in quantity. Between the periods 2014 and 2015, South Africa’s imports of cheese and curd did not change in value. During the same period, Germany’ cheese and curd exports to South Africa decreased by 8% in value and imports from United Kingdom decreased by 18% in value while those from New Zealand also decreased by 8%.

102
Figure 48: Competitiveness of suppliers to South Africa for cheese and curd in 2015
Source: ITC Trademap

103
Figure 48 illustrates that between 2011 and 2015 South Africa’s cheese and curd imported from Switzerland, Spain, Ireland, Denmark, Italy, United State of America and Australia were growing at a rate that is less than their export growth to the rest of the world. During the same period, South Africa’s cheese and curd imports from New Zealand, Morocco, Portugal, Netherlands, Germany, Canada, Lithuania, Belgium, Austria, France, Greece and United Kingdom were growing at a rate that is greater than their exports to the rest of the world. The most competitive suppliers of cheese and curd are United States of America and Spain with the annual growth import shares of 12% and 11% respectively during the period 2011 to 2015.

104
Figure 49: Prospects for diversification of suppliers for cheese and curd imported by South Africa in 2015
Source: ITC Trademap

105
South Africa’s imports of Cheese and Curd are from the biggest and fastest growing markets in the world which are Germany, France and Netherlands. There is no need for South Africa to diversify it cheese and curd import market. It can only look for chances to penetrate more in USA because USA’s exports to the world are still greater than its exports to South Africa.
106
8. ACKNOWLEDGEMENTS 1. Statistics and Economic Analysis.
www.daff.gov.za. 2. Clover Roodepoort
South Africa 1715 Tel: +27 (11) 471 1400 Fax: +27 (11) 471 1504 www.clover.co.za
3. Competition Commission Tel: 012 394 3300 Fax: 012 394 0169 www.comptrib.co.za.
4. Dairy Belle (PTY) LTD Private Bag 208 Bryanston 2021 Tel: 011 840 4000 Fax: 011 514 0084 www.dairybelle.co.za
5. International Trade Center www.trademap.org
6. LactoData
www.dairyconnect.co.za.
7. MacMap www.macmap.org
8. Milk Producers Organization (MPO)
Dr Koos Coetzee 012-8435600 www.mpo.co.za
9. National Agricultural Marketing Council (NAMC). Tel: (012) 3411115 Fax: (012) 3411911 www.namc.co.za
10. Nestle
P O Box 50661, Randburg, 2125 Fax: (011) 889 6559 086 009 6116 (General) 086 009 6789 (Nutrition) 0800 001 691 (Pet Care) www.nestle.co.za
11. Parmalat SA(PTY)LTD
Stellenbosch 7600 Tel: +27 21 809 1400 Fax: +27 21 809 1518 www.parmalat.co.za
12. Quantec.
www.Quantec.co.za.
13. Trade & Industrial Policy Strategies (TIPS)
www.tips.org.za.
Disclaimer: This document and its contents have been compiled by the Department of Agriculture, Forestry and Fisheries for the purpose of detailing the dairy industry. The views expressed in this document are those of the Department of Agriculture, forestry and fisheries with regard to agricultural industry, unless otherwise stated and, therefore the Department of Agriculture, forestry and fisheries does not accept responsibility for any errors in such information and anyone acting on such information does so entirely at his or her own risk.