a profile of the south african citrus market value chain …nda.agric.za/docs/amcp/cmvp2012.pdf ·...
TRANSCRIPT
A PROFILE OF THE SOUTH AFRICAN CITRUS MARKET VALUE CHAIN
2012
Directorate Marketing Private Bag X 15
ARCADIA 0007
Tel: 012 319 8455/6 Fax: 012 319 8131
Email: [email protected] www.daff.gov.za
www.webapps.daff.gov.za/mis
2
TABLE OF CONTENTS
1. DESCRIPTION OF THE INDUSTRY ......................................................................................................... 4
1.1 Production areas ................................................................................................................................. 5
1.2 Citrus cultivars ................................................................................................................................... 11
1.3 Production ......................................................................................................................................... 14
1.4 Employment ...................................................................................................................................... 15
2. MARKET STRUCTURE .......................................................................................................................... 16
2.1 Orange crop distribution .................................................................................................................... 16
2.2 Orange prices .................................................................................................................................... 17
2.3 Soft citrus crop distribution ................................................................................................................ 18
2.4 Soft citrus prices ................................................................................................................................ 18
2.5 Grapefruit crop distribution ................................................................................................................ 19
2.6 Grapefruit prices ................................................................................................................................ 20
2.7 Lemons and limes crop distribution ................................................................................................... 21
2.8 Lemon and lime prices ...................................................................................................................... 21
2.9 Exports .............................................................................................................................................. 22
2.9.1 Oranges ..................................................................................................................................... 23
2.9.2 Lemons and limes ...................................................................................................................... 28
2.9.3 Grapefruits ................................................................................................................................. 32
2.9.4 Soft citrus ................................................................................................................................... 36
2.10 Provincial and district export values of South African citrus ............................................................ 38
2.11 Share analysis ................................................................................................................................. 45
2.12 Imports ............................................................................................................................................ 49
2.12.1 Orange ..................................................................................................................................... 49
2.12.2 Grapefruit ................................................................................................................................. 49
2.12.3 Lemons and limes .................................................................................................................... 50
2.12.4 Soft citrus ................................................................................................................................. 50
2.13 Processing....................................................................................................................................... 50
2.13.1 Orange ..................................................................................................................................... 51
2.13.2 Lemon ...................................................................................................................................... 51
2.13.3 Lime ......................................................................................................................................... 52
2.13.4 Grapefruit ................................................................................................................................. 52
3. MARKET INTELIGENCE ........................................................................................................................ 52
3.1 Competitiveness of South African citrus products ............................................................................. 52
3.2 South Africa vs. southern hemisphere production ............................................................................. 69
4. MARKET ACCESS ................................................................................................................................. 72
4.1 Tariff, quotas and the price entry system .......................................................................................... 72
4.2 Non tariff barriers ............................................................................................................................... 81
4.2.1 Quality standards ....................................................................................................................... 81
4.2.2 Biosecurity ................................................................................................................................. 81
4.2.3 Plant Protection Product (PPP) database .................................................................................. 81
4.3 European Union (EU) ........................................................................................................................ 81
4.4 Consumer health and safety requirements ........................................................................................ 81
4.5 Japan ................................................................................................................................................ 83
4.6 United States of America ................................................................................................................... 83
5. DISTRIBUTION CHANNELS .................................................................................................................. 84

3
6. LOGISTICS ............................................................................................................................................. 84
6.1 Mode of transport .............................................................................................................................. 84
6.2 Cold chain management ................................................................................................................... 85
6.3 Packaging ......................................................................................................................................... 85
7. MARKET VALUE CHAIN ........................................................................................................................ 85
7.1 Domestic and export markets ............................................................................................................ 87
7.2 Processing industry ........................................................................................................................... 88
7.3 Global retail chains ............................................................................................................................ 88
7.4 Final consumer .................................................................................................................................. 88
8. ORGANIZATIONAL ANALYSIS ............................................................................................................. 89
8.1 Producer and associated organizations ............................................................................................ 89
8.2 Strengths, Weaknesses, Opportunities and Threat analysis ............................................................. 89
9. EMPOWERMENT ISSUES AND TRANSFORMATION OF THE AGRICULTURE SECTOR ................. 91
9.1 Youth in citrus.................................................................................................................................... 91
9.2 Mentorship ........................................................................................................................................ 91
9.3 Extension .......................................................................................................................................... 91
10. BUSINESS OPPORTUNITIES AND CHALLENGES ............................................................................ 91
10.1 Business opportunities .................................................................................................................... 91
10.2 Challenges ...................................................................................................................................... 92
11. ACKNOWLEDGEMENTS ..................................................................................................................... 92

4
1. DESCRIPTION OF THE INDUSTRY In terms of gross value, the citrus industry is the third largest horticultural industry after deciduous fruits and vegetables. During the 2010/11 production season the industry contributed R6.9 billion to total gross value of South African agricultural production. This represented 19% of the total gross value (R36.4 billion) of horticulture during the same period. The industry is also an important foreign exchange earner and comprises of four broad categories, namely oranges, easy peelers (soft citrus), grapefruit, and lemons and limes. Gross value of citrus production for the past decade is shown in Figure 1.
Source: Citrus Growers’ Association (CGA), 2012 and DAFF, 2012
As depicted on Figure 1 on average, the gross value of production (GVP) for citrus has been increasing over the past ten years. The industry experienced three successive good years starting from 2002 to 2004 and again in 2006 until 2008. The increase was mainly due to amongst others increased exports and the weakening of the Rand against the major currencies of South Africa’s trading partners. However, there were exceptions in 2005 and 2009 seasons where there were decreases of 33% and 21% respectively. The primary cause of the decreases may have been due to less quantity of citrus exported, owing to floods, which affected the quality and the size of the crop. The total gross value of all citrus products increased by 6% between the years 2010 and 2011 and by 156% between 2002 and 2011. The biggest contributor to total citrus gross value is oranges, which accounted for 62% in 2011. The other three categories of citrus products accounted for less than R1 billion each during the same period, with lemons and limes accounting for close to R1 billion (R987 301.00). The total gross value is driven by among other things the volume of production, volume of exports, the exchange rate, international prices, etc.
2 700 369
6 456 912 6 889 742
0
1 000 000
2 000 000
3 000 000
4 000 000
5 000 000
6 000 000
7 000 000
8 000 000
2002 2003 2004 2005 2006 2007 2008 2009 2010 2011
Gro
ss v
alu
e (R
1 00
0)
Year
Figure 1: Gross value of production for citrus products, 2002 - 2011
Oranges Soft citrus Grapefruit Lemons and limes Total gross value
5
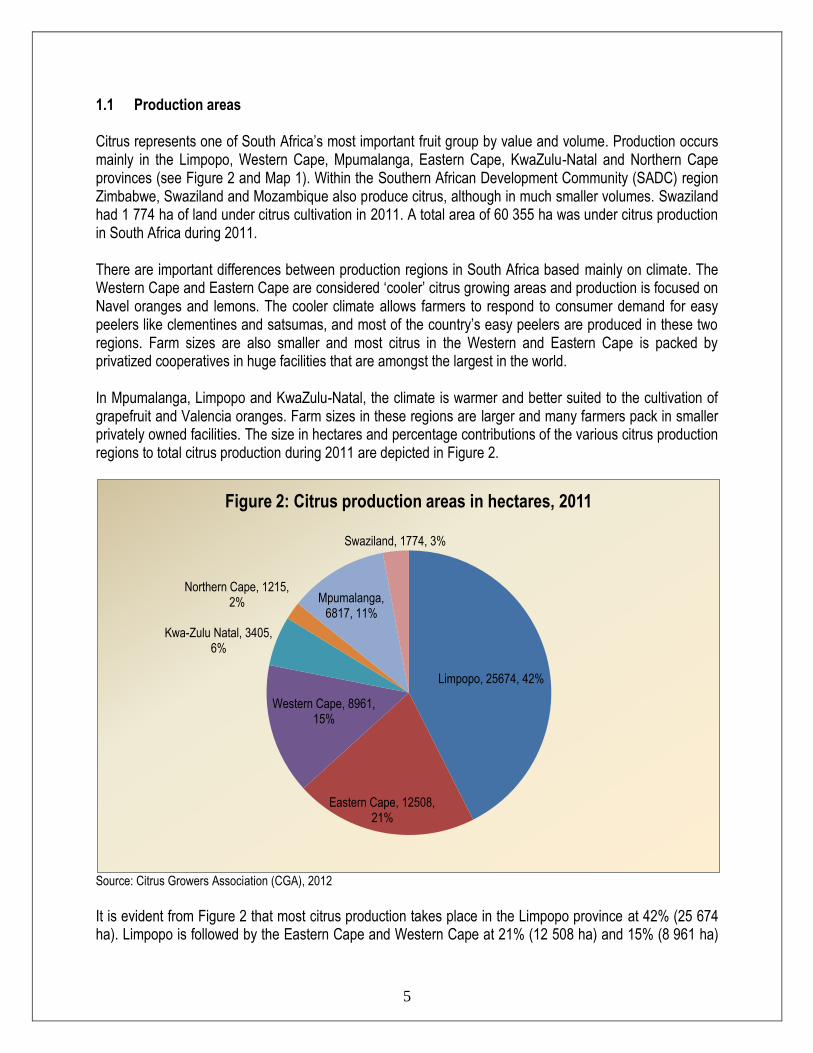
1.1 Production areas Citrus represents one of South Africa’s most important fruit group by value and volume. Production occurs mainly in the Limpopo, Western Cape, Mpumalanga, Eastern Cape, KwaZulu-Natal and Northern Cape provinces (see Figure 2 and Map 1). Within the Southern African Development Community (SADC) region Zimbabwe, Swaziland and Mozambique also produce citrus, although in much smaller volumes. Swaziland had 1 774 ha of land under citrus cultivation in 2011. A total area of 60 355 ha was under citrus production in South Africa during 2011. There are important differences between production regions in South Africa based mainly on climate. The Western Cape and Eastern Cape are considered ‘cooler’ citrus growing areas and production is focused on Navel oranges and lemons. The cooler climate allows farmers to respond to consumer demand for easy peelers like clementines and satsumas, and most of the country’s easy peelers are produced in these two regions. Farm sizes are also smaller and most citrus in the Western and Eastern Cape is packed by privatized cooperatives in huge facilities that are amongst the largest in the world. In Mpumalanga, Limpopo and KwaZulu-Natal, the climate is warmer and better suited to the cultivation of grapefruit and Valencia oranges. Farm sizes in these regions are larger and many farmers pack in smaller privately owned facilities. The size in hectares and percentage contributions of the various citrus production regions to total citrus production during 2011 are depicted in Figure 2.
Source: Citrus Growers Association (CGA), 2012 It is evident from Figure 2 that most citrus production takes place in the Limpopo province at 42% (25 674 ha). Limpopo is followed by the Eastern Cape and Western Cape at 21% (12 508 ha) and 15% (8 961 ha)
Limpopo, 25674, 42%
Eastern Cape, 12508, 21%
Western Cape, 8961, 15%
Kwa-Zulu Natal, 3405, 6%
Northern Cape, 1215, 2% Mpumalanga,
6817, 11%
Swaziland, 1774, 3%
Figure 2: Citrus production areas in hectares, 2011
6
respectively. The fourth largest producer of citrus products in terms of size in 2011 was the Mpumalanga province at 11% (6 817 ha). Kwazulu Natal contributed 6% (3 405 ha) during the same period while the Northern Cape accounted to 2% (1 215 ha). The major citrus production areas in Kwazulu Natal are Pongola, Nkwalini and Kwazulu Natal Midlands (see Map 1). In the Eastern Cape, the major citrus production areas are the Eastern Cape Midlands, Sundays River Valley and Patensie. The Boland region and Ceres region are the main citrus production areas in the Western Cape. Onderberg, Nelspruit and Senwes are the main citrus production areas in Mpumalanga while the major areas in Limpopo are Hoedspruit, Letsitele and Vhembe.

7
Map 1: Citrus producing regions of South Africa
Source: Citrus Growers Association (CGA), 2012
8
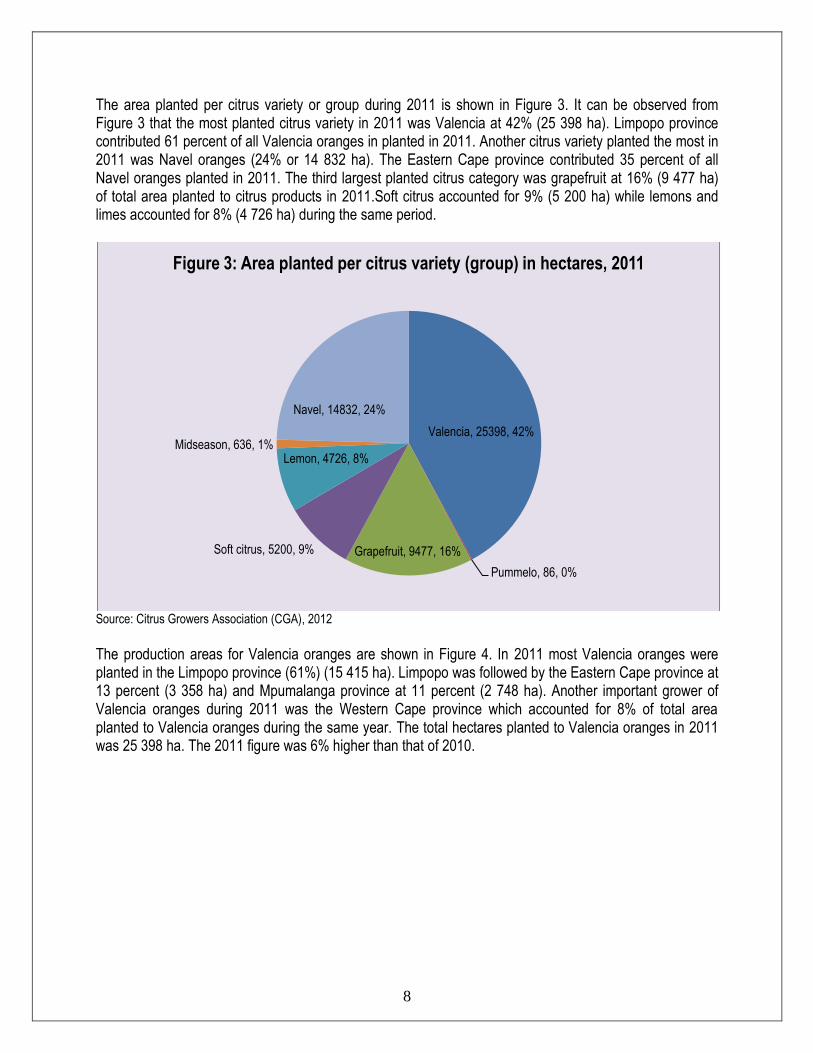
The area planted per citrus variety or group during 2011 is shown in Figure 3. It can be observed from Figure 3 that the most planted citrus variety in 2011 was Valencia at 42% (25 398 ha). Limpopo province contributed 61 percent of all Valencia oranges in planted in 2011. Another citrus variety planted the most in 2011 was Navel oranges (24% or 14 832 ha). The Eastern Cape province contributed 35 percent of all Navel oranges planted in 2011. The third largest planted citrus category was grapefruit at 16% (9 477 ha) of total area planted to citrus products in 2011.Soft citrus accounted for 9% (5 200 ha) while lemons and limes accounted for 8% (4 726 ha) during the same period.
Source: Citrus Growers Association (CGA), 2012
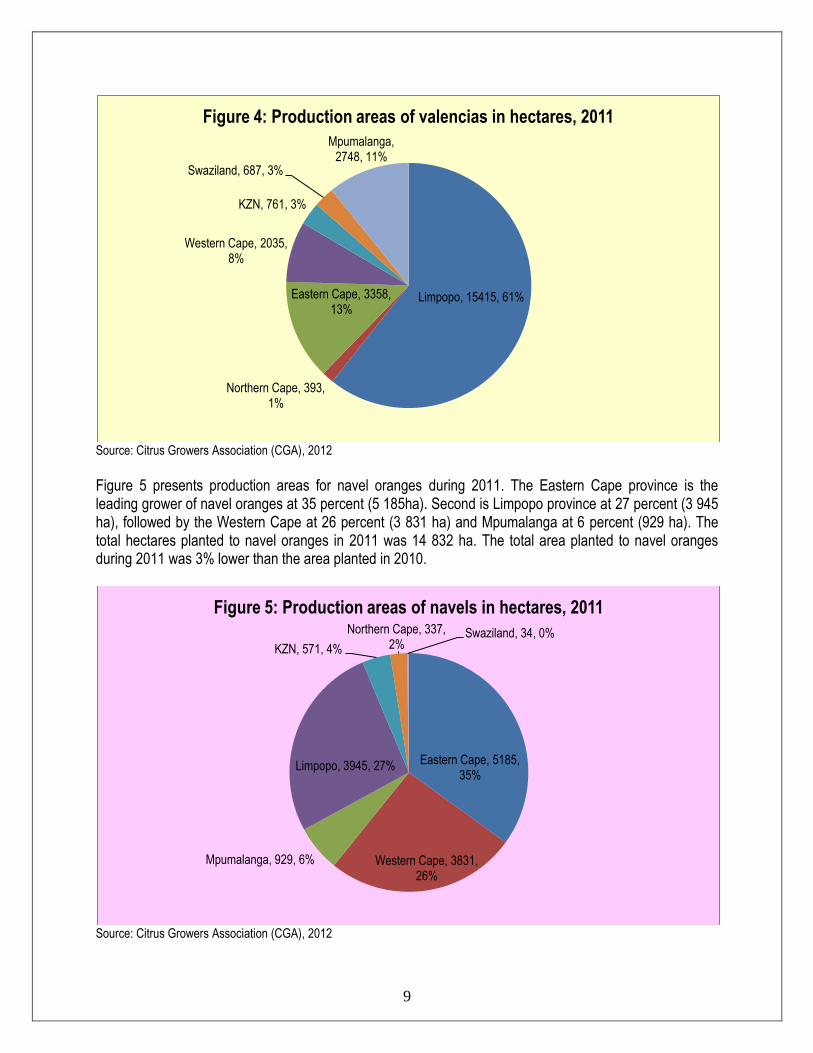
The production areas for Valencia oranges are shown in Figure 4. In 2011 most Valencia oranges were planted in the Limpopo province (61%) (15 415 ha). Limpopo was followed by the Eastern Cape province at 13 percent (3 358 ha) and Mpumalanga province at 11 percent (2 748 ha). Another important grower of Valencia oranges during 2011 was the Western Cape province which accounted for 8% of total area planted to Valencia oranges during the same year. The total hectares planted to Valencia oranges in 2011 was 25 398 ha. The 2011 figure was 6% higher than that of 2010.
Valencia, 25398, 42%
Pummelo, 86, 0%
Grapefruit, 9477, 16% Soft citrus, 5200, 9%
Lemon, 4726, 8% Midseason, 636, 1%
Navel, 14832, 24%
Figure 3: Area planted per citrus variety (group) in hectares, 2011
9
Source: Citrus Growers Association (CGA), 2012
Figure 5 presents production areas for navel oranges during 2011. The Eastern Cape province is the leading grower of navel oranges at 35 percent (5 185ha). Second is Limpopo province at 27 percent (3 945 ha), followed by the Western Cape at 26 percent (3 831 ha) and Mpumalanga at 6 percent (929 ha). The total hectares planted to navel oranges in 2011 was 14 832 ha. The total area planted to navel oranges during 2011 was 3% lower than the area planted in 2010.
Source: Citrus Growers Association (CGA), 2012
Limpopo, 15415, 61%
Northern Cape, 393, 1%
Eastern Cape, 3358, 13%
Western Cape, 2035, 8%
KZN, 761, 3%
Swaziland, 687, 3%
Mpumalanga, 2748, 11%
Figure 4: Production areas of valencias in hectares, 2011
Eastern Cape, 5185, 35%
Western Cape, 3831, 26%
Mpumalanga, 929, 6%
Limpopo, 3945, 27%
KZN, 571, 4%
Northern Cape, 337, 2%
Swaziland, 34, 0%
Figure 5: Production areas of navels in hectares, 2011
10
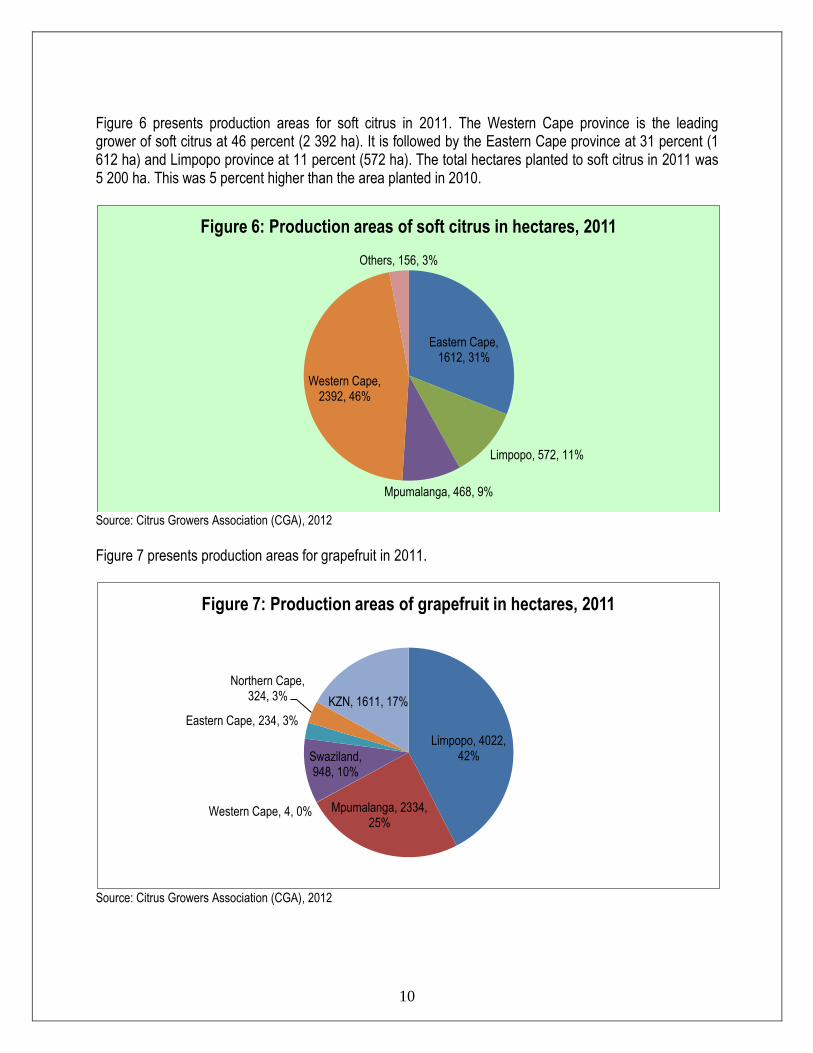
Figure 6 presents production areas for soft citrus in 2011. The Western Cape province is the leading grower of soft citrus at 46 percent (2 392 ha). It is followed by the Eastern Cape province at 31 percent (1 612 ha) and Limpopo province at 11 percent (572 ha). The total hectares planted to soft citrus in 2011 was 5 200 ha. This was 5 percent higher than the area planted in 2010.
Source: Citrus Growers Association (CGA), 2012
Figure 7 presents production areas for grapefruit in 2011.
Source: Citrus Growers Association (CGA), 2012
Eastern Cape, 1612, 31%
Limpopo, 572, 11%
Mpumalanga, 468, 9%
Western Cape, 2392, 46%
Others, 156, 3%
Figure 6: Production areas of soft citrus in hectares, 2011
Limpopo, 4022, 42%
Mpumalanga, 2334, 25%
Western Cape, 4, 0%
Swaziland, 948, 10%
Eastern Cape, 234, 3%
Northern Cape, 324, 3% KZN, 1611, 17%
Figure 7: Production areas of grapefruit in hectares, 2011
11
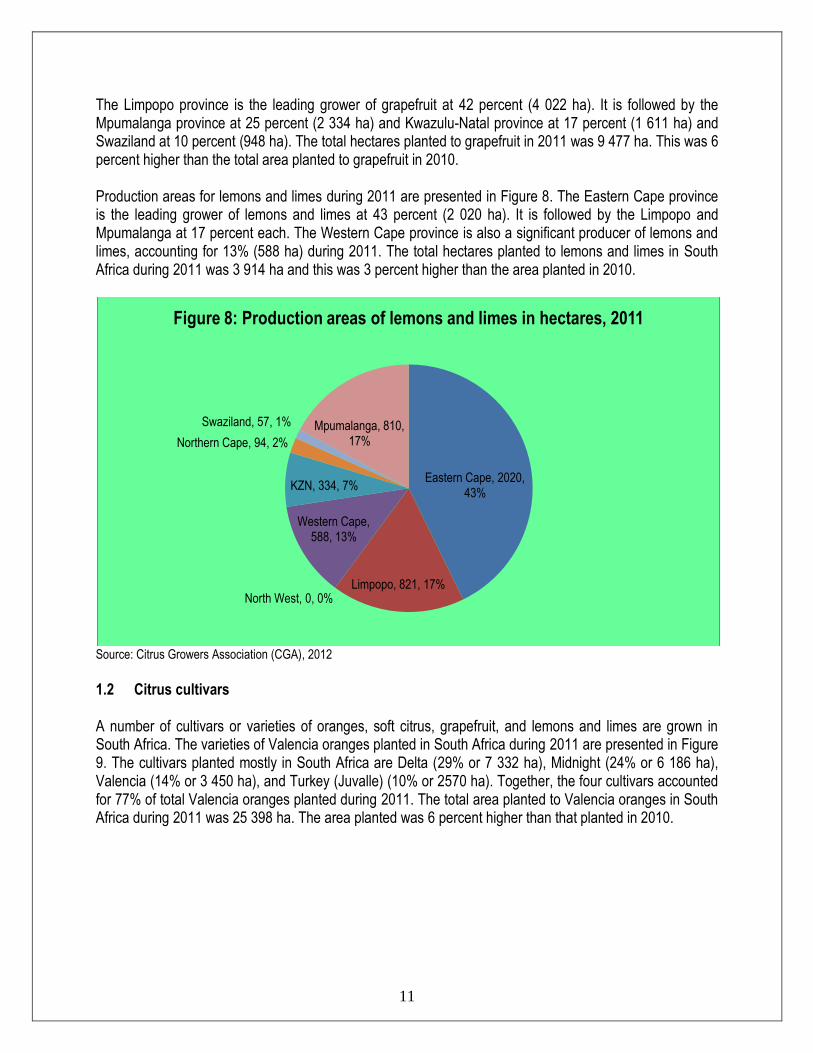
The Limpopo province is the leading grower of grapefruit at 42 percent (4 022 ha). It is followed by the Mpumalanga province at 25 percent (2 334 ha) and Kwazulu-Natal province at 17 percent (1 611 ha) and Swaziland at 10 percent (948 ha). The total hectares planted to grapefruit in 2011 was 9 477 ha. This was 6 percent higher than the total area planted to grapefruit in 2010. Production areas for lemons and limes during 2011 are presented in Figure 8. The Eastern Cape province is the leading grower of lemons and limes at 43 percent (2 020 ha). It is followed by the Limpopo and Mpumalanga at 17 percent each. The Western Cape province is also a significant producer of lemons and limes, accounting for 13% (588 ha) during 2011. The total hectares planted to lemons and limes in South Africa during 2011 was 3 914 ha and this was 3 percent higher than the area planted in 2010.
Source: Citrus Growers Association (CGA), 2012
1.2 Citrus cultivars A number of cultivars or varieties of oranges, soft citrus, grapefruit, and lemons and limes are grown in South Africa. The varieties of Valencia oranges planted in South Africa during 2011 are presented in Figure 9. The cultivars planted mostly in South Africa are Delta (29% or 7 332 ha), Midnight (24% or 6 186 ha), Valencia (14% or 3 450 ha), and Turkey (Juvalle) (10% or 2570 ha). Together, the four cultivars accounted for 77% of total Valencia oranges planted during 2011. The total area planted to Valencia oranges in South Africa during 2011 was 25 398 ha. The area planted was 6 percent higher than that planted in 2010.
Eastern Cape, 2020, 43%
Limpopo, 821, 17% North West, 0, 0%
Western Cape, 588, 13%
KZN, 334, 7%
Northern Cape, 94, 2%
Swaziland, 57, 1% Mpumalanga, 810, 17%
Figure 8: Production areas of lemons and limes in hectares, 2011

12
Source: Citrus Growers Association (CGA), 2012
The cultivars of navel oranges cultivated in South Africa during 2011 are illustrated in Figure 10.
Source: Citrus Growers Association (CGA), 2012
The major cultivar of navel oranges planted in South Africa is Palmer, with 4 183 ha of land planted to it in 2011. This represented 28% of total area planted to navel oranges in 2011. Palmer is followed by Bahianinha at 15% (2 186 ha), Nave at 11% (1 594 ha) and Washington also at 11% (1 584 ha). Other cultivars accounted for 28% (4 216 ha) of total area planted to navel oranges in 2011. The total area planted to Navel oranges during 2011 was 14 832 ha.
Delta, 7332, 29%
Midnight, 6186, 24%
Valencia, 3450, 14%
Turkey (Juvalle), 2570, 10%
Oukloon, 1648, 6%
Du Roi, 1651, 7% Other, 2561, 10%
Figure 9: Valencia (oranges) cultivars planted in 2011 (ha)
Palmer, 4183, 28%
Navel, 1594, 11%
Bahianinha, 2186, 15%
Washington, 1584, 11%
Robyn, 1069, 7%
Other, 4216, 28%
Figure 10: Navel (oranges) cultivars planted in 2011 (ha)
13
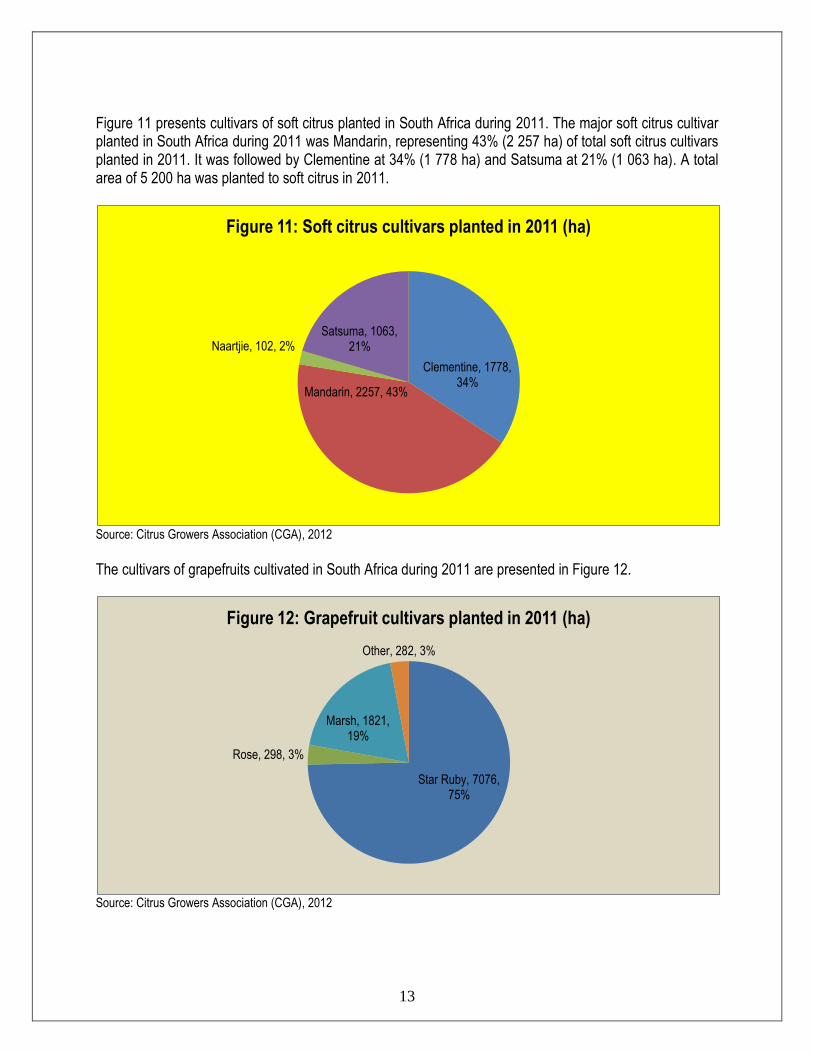
Figure 11 presents cultivars of soft citrus planted in South Africa during 2011. The major soft citrus cultivar planted in South Africa during 2011 was Mandarin, representing 43% (2 257 ha) of total soft citrus cultivars planted in 2011. It was followed by Clementine at 34% (1 778 ha) and Satsuma at 21% (1 063 ha). A total area of 5 200 ha was planted to soft citrus in 2011.
Source: Citrus Growers Association (CGA), 2012
The cultivars of grapefruits cultivated in South Africa during 2011 are presented in Figure 12.
Source: Citrus Growers Association (CGA), 2012
Clementine, 1778, 34%
Mandarin, 2257, 43%
Naartjie, 102, 2% Satsuma, 1063,
21%
Figure 11: Soft citrus cultivars planted in 2011 (ha)
Star Ruby, 7076, 75%
Rose, 298, 3%
Marsh, 1821, 19%
Other, 282, 3%
Figure 12: Grapefruit cultivars planted in 2011 (ha)

14
During 2011, Star Ruby accounted for over two-thirds (75% or 7 076 ha) of the total grapefruit cultivars planted in South Africa. It was followed by Marsh at 19% (1 821 ha) and Rose at 3% (298 ha). A total area of 9477 ha was planted to grapefruits in 2011. The cultivars of lemons and limes planted in South Africa in 2011 are presented in Figure 13.
Source: Citrus Growers Association (CGA), 2012
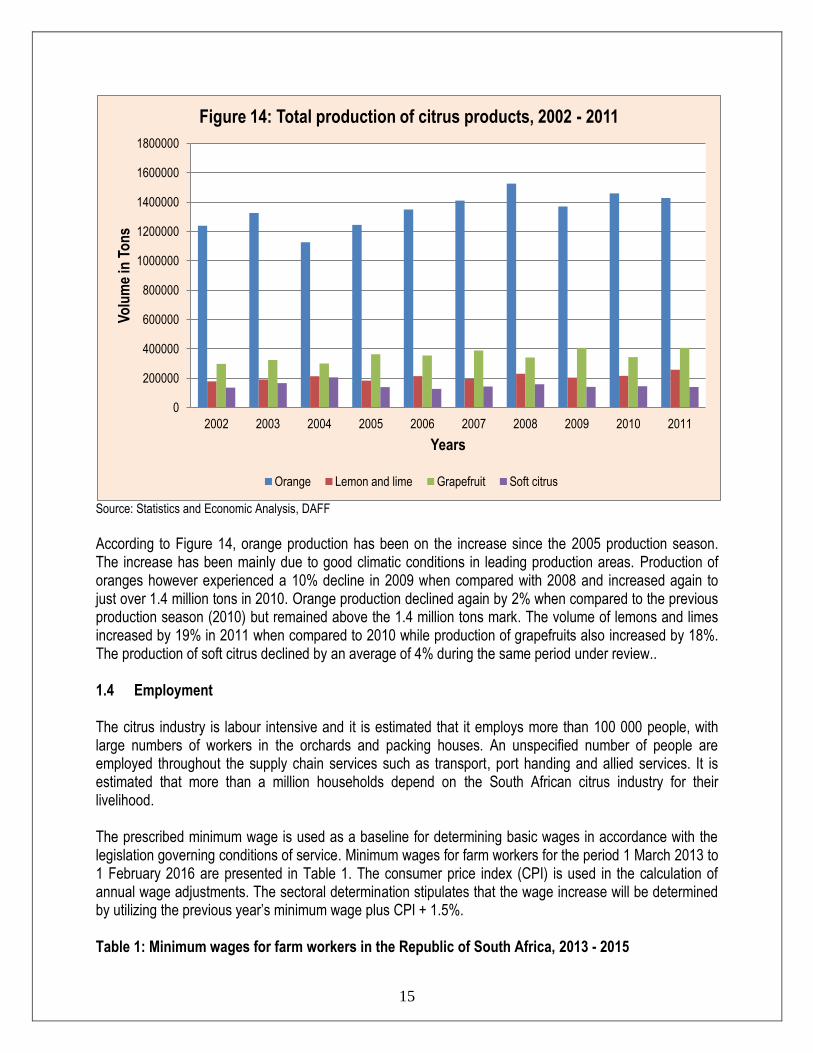
The most important cultivar of lemons and limes planted in South Africa is Eureka. Figure 13 indicates that Eureka was planted on a total area of 3 555 hectares, representing 75% of the total area planted to lemons and limes in 2011. Eureka was followed by Eureka SL at 9% (428 ha) and Lisbon at 4% (203 ha). A total area of 4 724 ha was planted to lemons and limes in 2011. 1.3 Production Citrus production has over the past ten years has been fairly stable (see Figure 14). In 2011 oranges contributed 64 percent of total citrus production. It was followed by grapefruit at 18%, lemons and limes at 12% and soft citrus at 6%.
Eureka, 3555, 75%
Eureka SL, 428, 9%
Lisbon, 203, 4%
Unspecified, 220, 5%
Genoa, 126, 3% Limoneira, 192, 4%
Figure 13: Lemons and limes cultivars planted in 2011 (ha)
15
Source: Statistics and Economic Analysis, DAFF
According to Figure 14, orange production has been on the increase since the 2005 production season. The increase has been mainly due to good climatic conditions in leading production areas. Production of oranges however experienced a 10% decline in 2009 when compared with 2008 and increased again to just over 1.4 million tons in 2010. Orange production declined again by 2% when compared to the previous production season (2010) but remained above the 1.4 million tons mark. The volume of lemons and limes increased by 19% in 2011 when compared to 2010 while production of grapefruits also increased by 18%. The production of soft citrus declined by an average of 4% during the same period under review.. 1.4 Employment The citrus industry is labour intensive and it is estimated that it employs more than 100 000 people, with large numbers of workers in the orchards and packing houses. An unspecified number of people are employed throughout the supply chain services such as transport, port handing and allied services. It is estimated that more than a million households depend on the South African citrus industry for their livelihood. The prescribed minimum wage is used as a baseline for determining basic wages in accordance with the legislation governing conditions of service. Minimum wages for farm workers for the period 1 March 2013 to 1 February 2016 are presented in Table 1. The consumer price index (CPI) is used in the calculation of annual wage adjustments. The sectoral determination stipulates that the wage increase will be determined by utilizing the previous year’s minimum wage plus CPI + 1.5%. Table 1: Minimum wages for farm workers in the Republic of South Africa, 2013 - 2015
0
200000
400000
600000
800000
1000000
1200000
1400000
1600000
1800000
2002 2003 2004 2005 2006 2007 2008 2009 2010 2011
Vo
lum
e in
To
ns
Years
Figure 14: Total production of citrus products, 2002 - 2011
Orange Lemon and lime Grapefruit Soft citrus

16
Minimum rate for the period Minimum rate for the period Minimum rate for the period
1 March 2013 to 28 February 2014 1 March 2014 to 28 February 2015
1 March 2015 to 28 February 2016
Monthly Weekly Daily Hourly Monthly Weekly Hourly Monthly Weekly Hourly
R2273.52 R524.70 R105.001 R11.66 Previous year’s minimum wage + CPI2 + 1.5%
Previous year’s minimum wage + CPI + 1.5%
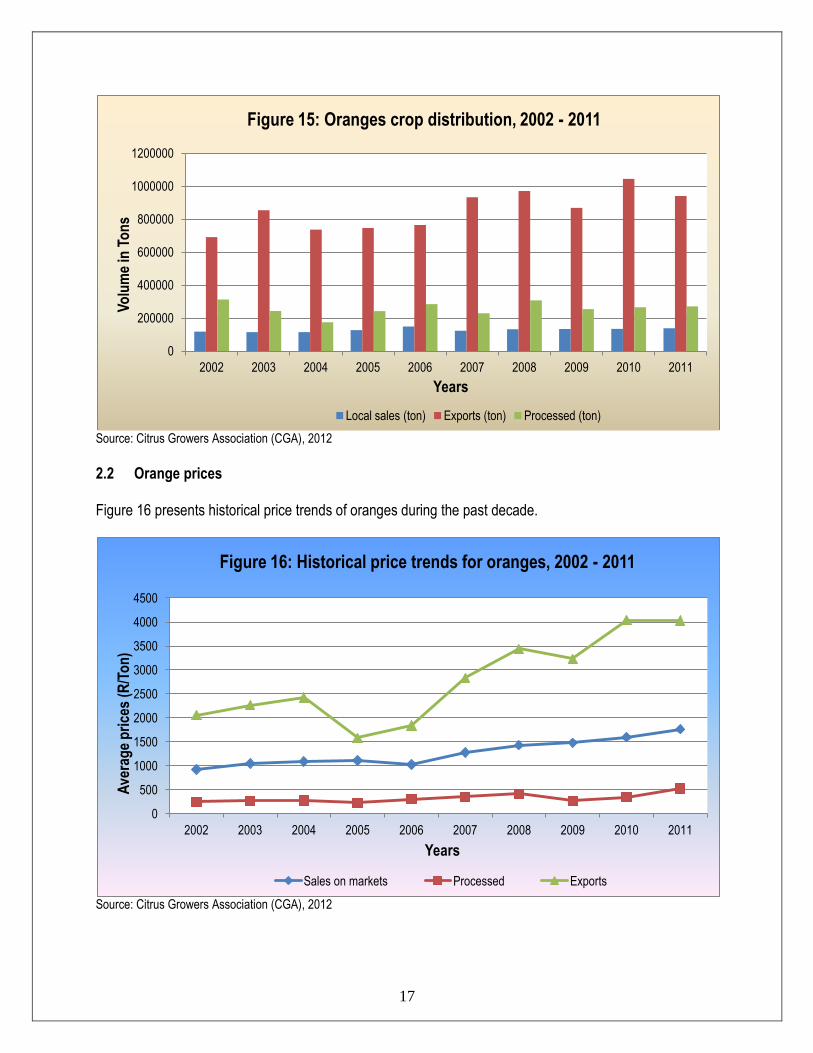
Source: Department of Labour 2. MARKET STRUCTURE Citrus production in South Africa is mainly aimed at the export market. Locally, citrus produce is sold though different marketing channels such as National Fresh Produce Markets (NFPMs), informal markets (street hawkers and bakkie traders), and directly to processors for juice making and dried fruit production. The fruits are also sold directly to wholesalers and retailers through direct supply contracts. The annual crop distribution and prices of the different citrus products are presented below. 2.1 Orange crop distribution The annual distribution of oranges to the different markets is presented in Figure 15. In 2011, 69% (984 116 tons) of all oranges produced (1 428 027 tons) was exported. This indicates the importance of export markets to South Africa’s production of oranges. The second most important market for South African oranges is the processing sector. The sector absorbed 19% (270 607 tons) of total orange production in 2011 while the remaining 15% (137 841 tons) was sold through the local markets. The total volume of oranges that were exported during 2011 was 10% lower than that exported in 2010 while the volumes sold through the local markets and those sent to the processing sector increased by 3% and 2% respectively during the same period.
1 For an employee who works 9 hours per day
2 The CPI to be utilised is the available CPI for the lowest quintile as released by Statistics South Africa six weeks prior to the increment date.
17
Source: Citrus Growers Association (CGA), 2012
2.2 Orange prices Figure 16 presents historical price trends of oranges during the past decade.
Source: Citrus Growers Association (CGA), 2012
0
200000
400000
600000
800000
1000000
1200000
2002 2003 2004 2005 2006 2007 2008 2009 2010 2011
Vo
lum
e in
To
ns
Years
Figure 15: Oranges crop distribution, 2002 - 2011
Local sales (ton) Exports (ton) Processed (ton)
0
500
1000
1500
2000
2500
3000
3500
4000
4500
2002 2003 2004 2005 2006 2007 2008 2009 2010 2011
Ave
rag
e p
rice
s (R
/To
n)
Years
Figure 16: Historical price trends for oranges, 2002 - 2011
Sales on markets Processed Exports

18
As can be seen in Figure 16 oranges fetch higher returns in the export markets. The average price per ton in the export markets during 2011 was R4 030.00. This was 0.1% lower than the average export price during the previous year. Oranges sold in the local markets in 2011 fetched an average price of R1 762.00 per ton while those absorbed by the processing sector fetched the lowest price at R529.00 per ton. 2.3 Soft citrus crop distribution The annual soft citrus crop distribution for the past ten years is presented in Figure 17. The majority of the South African annual soft citrus crop is absorbed by the export market. A total volume of 107 945 tons of soft citrus was exported in 2011. This represented 74% of the total production (139 540 tons) of soft citrus in 2011. The processing sector is the second most important market for soft citrus in South Africa, absorbing approximately 12% (16 212 tons) of the total crop in 2011.
Source: Citrus Growers Association (CGA), 2012
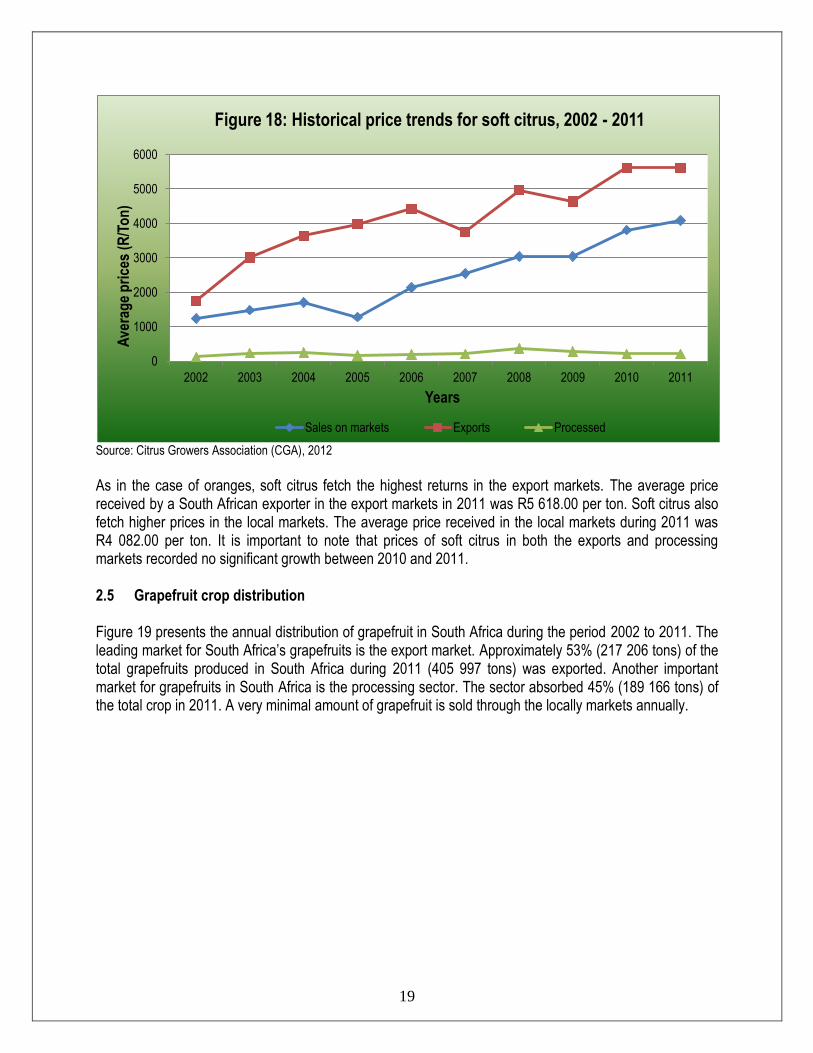
2.4 Soft citrus prices Historical price trends for soft citrus for the past ten years are presented in Figure 18.
0
20000
40000
60000
80000
100000
120000
140000
160000
2002 2003 2004 2005 2006 2007 2008 2009 2010 2011
Vo
lum
e in
To
ns
Years
Figure 17: Soft citrus crop distribution, 2002 - 2011
Local sales (ton) Exports (ton) Processed (ton)
19
Source: Citrus Growers Association (CGA), 2012
As in the case of oranges, soft citrus fetch the highest returns in the export markets. The average price received by a South African exporter in the export markets in 2011 was R5 618.00 per ton. Soft citrus also fetch higher prices in the local markets. The average price received in the local markets during 2011 was R4 082.00 per ton. It is important to note that prices of soft citrus in both the exports and processing markets recorded no significant growth between 2010 and 2011. 2.5 Grapefruit crop distribution Figure 19 presents the annual distribution of grapefruit in South Africa during the period 2002 to 2011. The leading market for South Africa’s grapefruits is the export market. Approximately 53% (217 206 tons) of the total grapefruits produced in South Africa during 2011 (405 997 tons) was exported. Another important market for grapefruits in South Africa is the processing sector. The sector absorbed 45% (189 166 tons) of the total crop in 2011. A very minimal amount of grapefruit is sold through the locally markets annually.
0
1000
2000
3000
4000
5000
6000
2002 2003 2004 2005 2006 2007 2008 2009 2010 2011
Ave
rag
e p
rice
s (R
/To
n)
Years
Figure 18: Historical price trends for soft citrus, 2002 - 2011
Sales on markets Exports Processed

20
Source: Citrus Growers Association (CGA), 2012
2.6 Grapefruit prices Figure 20 illustrates historical price trends for grapefruits during the past ten years.
Source: Citrus Growers Association (CGA), 2012
0
50000
100000
150000
200000
250000
300000
2002 2003 2004 2005 2006 2007 2008 2009 2010 2011
Vo
lum
e in
To
ns
Years
Figure 19: Grapefruit crop distribution, 2002 - 2011
Local sales (ton) Exports (ton) Processed (ton)
0
500
1000
1500
2000
2500
3000
3500
4000
2002 2003 2004 2005 2006 2007 2008 2009 2010 2011
Ave
rag
e p
rice
s (R
/To
n)
Years
Figure 20: Historical price trends for grapefruit, 2002 - 2011
Sales on markets Exports Processed
21
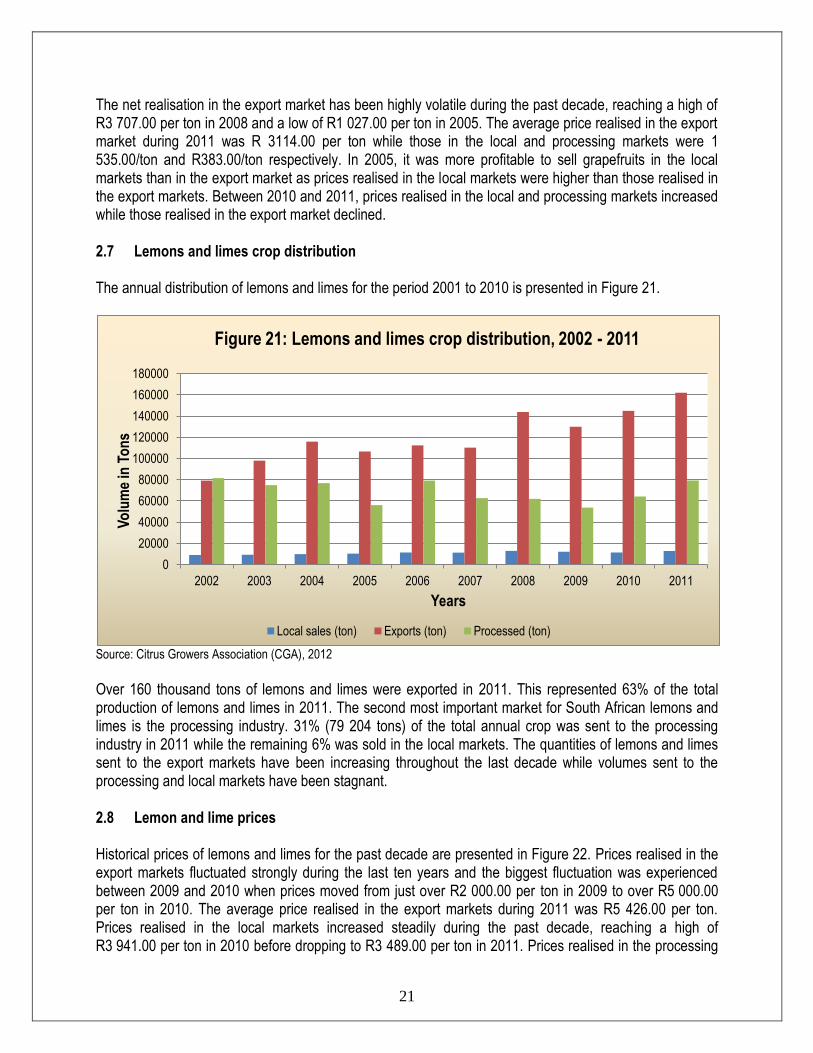
The net realisation in the export market has been highly volatile during the past decade, reaching a high of R3 707.00 per ton in 2008 and a low of R1 027.00 per ton in 2005. The average price realised in the export market during 2011 was R 3114.00 per ton while those in the local and processing markets were 1 535.00/ton and R383.00/ton respectively. In 2005, it was more profitable to sell grapefruits in the local markets than in the export market as prices realised in the local markets were higher than those realised in the export markets. Between 2010 and 2011, prices realised in the local and processing markets increased while those realised in the export market declined. 2.7 Lemons and limes crop distribution The annual distribution of lemons and limes for the period 2001 to 2010 is presented in Figure 21.
Source: Citrus Growers Association (CGA), 2012
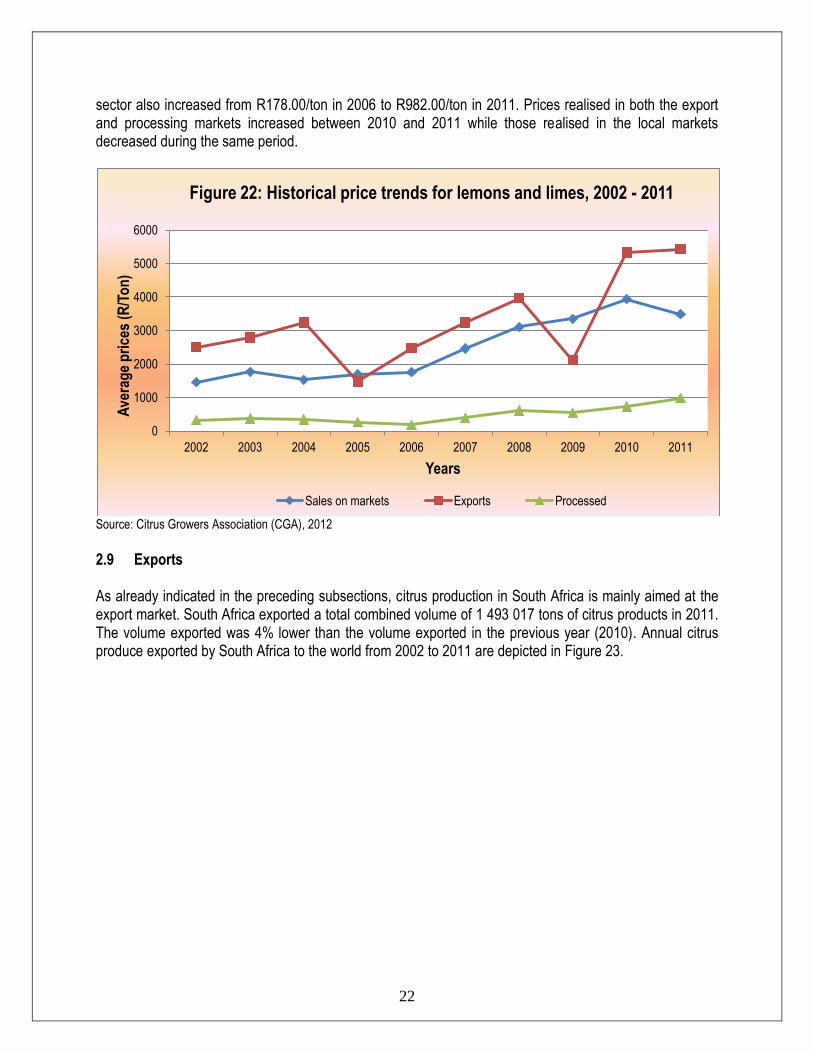
Over 160 thousand tons of lemons and limes were exported in 2011. This represented 63% of the total production of lemons and limes in 2011. The second most important market for South African lemons and limes is the processing industry. 31% (79 204 tons) of the total annual crop was sent to the processing industry in 2011 while the remaining 6% was sold in the local markets. The quantities of lemons and limes sent to the export markets have been increasing throughout the last decade while volumes sent to the processing and local markets have been stagnant. 2.8 Lemon and lime prices Historical prices of lemons and limes for the past decade are presented in Figure 22. Prices realised in the export markets fluctuated strongly during the last ten years and the biggest fluctuation was experienced between 2009 and 2010 when prices moved from just over R2 000.00 per ton in 2009 to over R5 000.00 per ton in 2010. The average price realised in the export markets during 2011 was R5 426.00 per ton. Prices realised in the local markets increased steadily during the past decade, reaching a high of R3 941.00 per ton in 2010 before dropping to R3 489.00 per ton in 2011. Prices realised in the processing
0
20000
40000
60000
80000
100000
120000
140000
160000
180000
2002 2003 2004 2005 2006 2007 2008 2009 2010 2011
Vo
lum
e in
To
ns
Years
Figure 21: Lemons and limes crop distribution, 2002 - 2011
Local sales (ton) Exports (ton) Processed (ton)
22
sector also increased from R178.00/ton in 2006 to R982.00/ton in 2011. Prices realised in both the export and processing markets increased between 2010 and 2011 while those realised in the local markets decreased during the same period.
Source: Citrus Growers Association (CGA), 2012
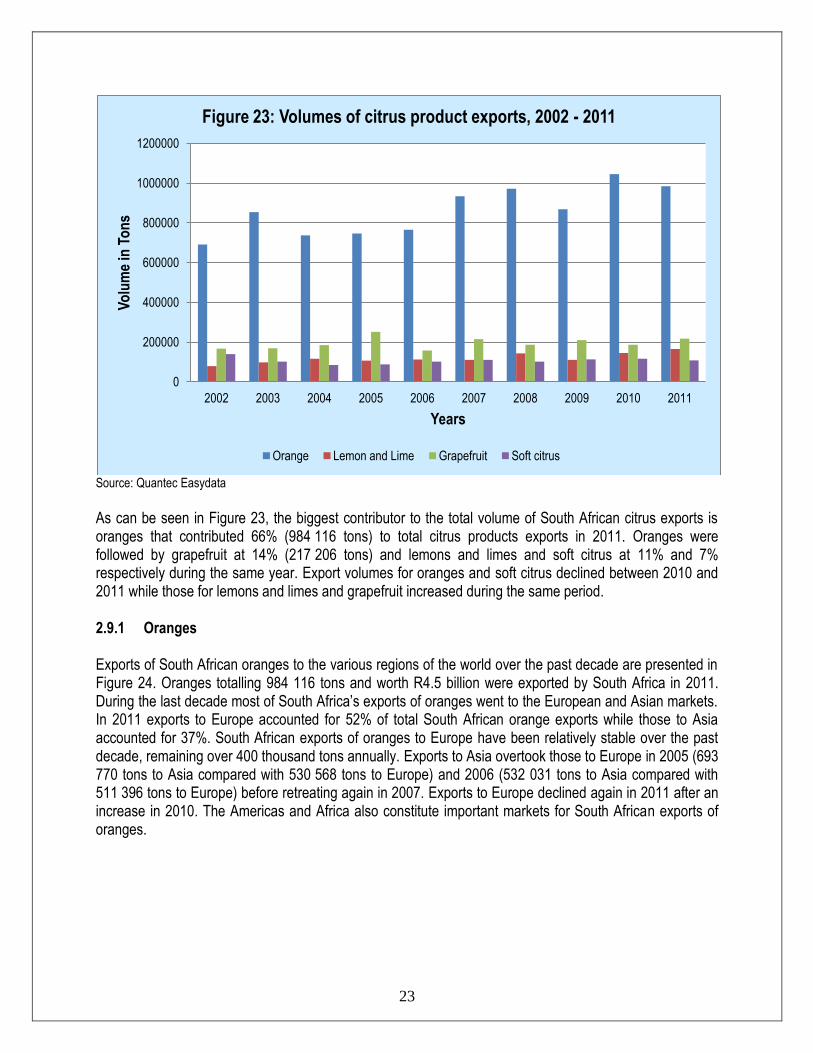
2.9 Exports As already indicated in the preceding subsections, citrus production in South Africa is mainly aimed at the export market. South Africa exported a total combined volume of 1 493 017 tons of citrus products in 2011. The volume exported was 4% lower than the volume exported in the previous year (2010). Annual citrus produce exported by South Africa to the world from 2002 to 2011 are depicted in Figure 23.
0
1000
2000
3000
4000
5000
6000
2002 2003 2004 2005 2006 2007 2008 2009 2010 2011
Ave
rag
e p
rice
s (R
/To
n)
Years
Figure 22: Historical price trends for lemons and limes, 2002 - 2011
Sales on markets Exports Processed
23
Source: Quantec Easydata
As can be seen in Figure 23, the biggest contributor to the total volume of South African citrus exports is oranges that contributed 66% (984 116 tons) to total citrus products exports in 2011. Oranges were followed by grapefruit at 14% (217 206 tons) and lemons and limes and soft citrus at 11% and 7% respectively during the same year. Export volumes for oranges and soft citrus declined between 2010 and 2011 while those for lemons and limes and grapefruit increased during the same period. 2.9.1 Oranges Exports of South African oranges to the various regions of the world over the past decade are presented in Figure 24. Oranges totalling 984 116 tons and worth R4.5 billion were exported by South Africa in 2011. During the last decade most of South Africa’s exports of oranges went to the European and Asian markets. In 2011 exports to Europe accounted for 52% of total South African orange exports while those to Asia accounted for 37%. South African exports of oranges to Europe have been relatively stable over the past decade, remaining over 400 thousand tons annually. Exports to Asia overtook those to Europe in 2005 (693 770 tons to Asia compared with 530 568 tons to Europe) and 2006 (532 031 tons to Asia compared with 511 396 tons to Europe) before retreating again in 2007. Exports to Europe declined again in 2011 after an increase in 2010. The Americas and Africa also constitute important markets for South African exports of oranges.
0
200000
400000
600000
800000
1000000
1200000
2002 2003 2004 2005 2006 2007 2008 2009 2010 2011
Vo
lum
e in
To
ns
Years
Figure 23: Volumes of citrus product exports, 2002 - 2011
Orange Lemon and Lime Grapefruit Soft citrus

24
Source: Quantec Easydata
Due to their relative importance to exports of South African oranges, the European and Asian markets are further analysed below. Volumes of South African orange exports to the various regions of Europe from 2002 to 2011 are presented in Figure 25. In Europe, the bulk of South African exports of oranges go to the European Union. 72% of all South African exports of oranges to Europe in 2011 were absorbed by the European Union. The EU was followed by Eastern Europe at 27% while the remaining 1% went to Northern, Southern and Western Europe. Exports to Europe peaked at 606 403 tons in 2007. The exports of South African oranges to the European Union and Eastern Europe declined by 16% and 11% respectively between 2010 and 2011. Exports to Europe as a whole also declined by 15% between the years 2010 and 2011.
2002 2003 2004 2005 2006 2007 2008 2009 2010 2011
World 704161 725749 717459 1376514 1171068 1015242 1077205 1033960 1109127 984116
Africa 53809 63861 57530 8224 47846 63541 60108 49841 66523 38029
Americas 42751 50973 51941 143753 79355 53596 64319 73395 61901 69699
Asia 202865 194100 167750 693770 532031 288300 368809 393219 382714 367436
Europe 404648 416815 440162 530568 511396 606403 583723 516792 597622 508918
Oceania 88 0 59 24 274 189 50 434 168 25
Not allocated 0 0 16 176 166 3212 196 279 199 9
0
200000
400000
600000
800000
1000000
1200000
1400000
1600000
Vo
lum
e in
To
ns
Years
Figure 24: Volumes of oranges exported to the various regions, 2002 - 2011

25
Source: Quantec Easydata
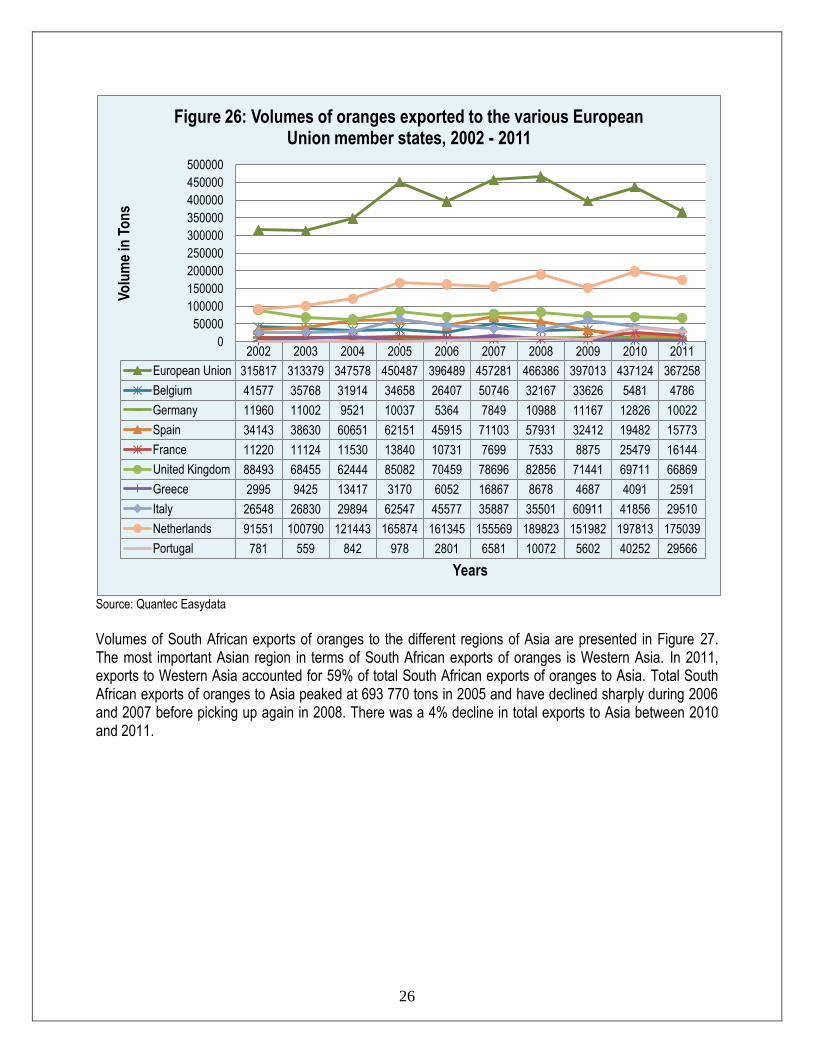
Due to its significance to South African exports of oranges the European Union market is further disaggregated in Figure 26. It is important to note that only those countries whose orange imports from South Africa were at least 10 000 tons in at least one year during the period under review are shown in Figure 26. The major importers of South African oranges in the European Union are the Netherlands, the United Kingdom and Italy. In 2011, the three countries accounted for 74% of all South African orange exports to the European Union (367 258 tons), with the Netherlands accounting for 48% and the United Kingdom and Italy contributing 18% and 8% respectively. Between 2010 and 2011, exports to the Netherlands declined by 12% while those to Italy and the United Kingdom also went down by 29% and 4% respectively.
2002 2003 2004 2005 2006 2007 2008 2009 2010 2011
Europe 404648 416815 440162 530568 511396 606403 583723 516792 597622 508918
Eastern Europe 87374 102730 89422 72064 112438 147350 114949 110623 154967 137811
Northern Europe 260 562 746 2085 963 813 1048 5272 2366 2246
Southern Europe 0 49 918 0 798 304 1127 915 2702 983
Western Europe 1197 94 1499 5932 708 655 214 2971 463 621
European Union 315817 313379 347578 450487 396489 457281 466386 397013 437124 367258
0
100000
200000
300000
400000
500000
600000
700000
Vo
lum
e in
To
ns
Years
Figure 25: Volumes of oranges exported to different regions of Europe, 2002 - 2011
26
Source: Quantec Easydata
Volumes of South African exports of oranges to the different regions of Asia are presented in Figure 27. The most important Asian region in terms of South African exports of oranges is Western Asia. In 2011, exports to Western Asia accounted for 59% of total South African exports of oranges to Asia. Total South African exports of oranges to Asia peaked at 693 770 tons in 2005 and have declined sharply during 2006 and 2007 before picking up again in 2008. There was a 4% decline in total exports to Asia between 2010 and 2011.
2002 2003 2004 2005 2006 2007 2008 2009 2010 2011
European Union 315817 313379 347578 450487 396489 457281 466386 397013 437124 367258
Belgium 41577 35768 31914 34658 26407 50746 32167 33626 5481 4786
Germany 11960 11002 9521 10037 5364 7849 10988 11167 12826 10022
Spain 34143 38630 60651 62151 45915 71103 57931 32412 19482 15773
France 11220 11124 11530 13840 10731 7699 7533 8875 25479 16144
United Kingdom 88493 68455 62444 85082 70459 78696 82856 71441 69711 66869
Greece 2995 9425 13417 3170 6052 16867 8678 4687 4091 2591
Italy 26548 26830 29894 62547 45577 35887 35501 60911 41856 29510
Netherlands 91551 100790 121443 165874 161345 155569 189823 151982 197813 175039
Portugal 781 559 842 978 2801 6581 10072 5602 40252 29566
0
50000
100000
150000
200000
250000
300000
350000
400000
450000
500000
Vo
lum
e in
To
ns
Years
Figure 26: Volumes of oranges exported to the various European Union member states, 2002 - 2011

27
Source: Quantec Easydata
Volumes of South African orange exports to the different countries in Western Asia during the last decade are presented in Figure 28.
Source: Quantec Easydata
2002 2003 2004 2005 2006 2007 2008 2009 2010 2011
Asia 202865 194100 167750 693770 532031 288300 368809 393219 382714 367436
Eastern Asia 77094 63267 58392 158594 167236 67261 55516 60799 60407 72343
South-central Asia 1001 1640 1116 360221 42468 17938 17272 72930 39373 44998
South-eastern Asia 12838 21499 18403 36345 41394 38980 27532 35538 33483 32176
Western Asia 111933 107694 89840 138610 280933 164120 268489 223952 249451 217918
0
100000
200000
300000
400000
500000
600000
700000
800000
Vo
lum
e in
To
ns
Years
Figure 27: Volumes of oranges exported to various Asian regions, 2002 - 2011
2002 2003 2004 2005 2006 2007 2008 2009 2010 2011
Western Asia 111933 107694 89840 138610 280933 164120 268489 223952 249451 217918
United Arab Emirates 30302 37675 30194 70336 85123 69868 79849 100743 104064 78659
Bahrain 1067 2010 1778 7160 13028 2829 5193 3722 3543 3884
Israel 24 16 107 0 0 293 1247 0 0 0
Kuwait 1039 487 2874 2402 43112 7388 26292 23541 35366 30323
Oman 6542 8676 6665 2881 7708 7811 11973 19238 13936 9126
Qatar 705 1060 1131 10445 1374 2764 4000 3753 2771 4686
Saudi Arabia 71280 57409 46305 45374 129718 72482 138308 72204 88746 89456
0
50000
100000
150000
200000
250000
300000
Vo
lum
e in
To
ns
Years
Figure 28: Volumes of oranges exported to different countries in Western Asia, 2002 - 2011

28
Note that only those countries whose orange imports from South Africa were at least 100 tons in at least one year during the period under review are shown in Figure 28. The major importers of South African oranges in Western Asia are the United Arab Emirates and Saudi Arabia. In 2011 the United Arab Emirates imported 78 659 tons of oranges from South Africa while Saudi Arabia imported 89 456 tons from South Africa. Between 2010 and 2011, South African exports of oranges to Saudi Arabia increased by 0.8% while those to the United Arab Emirates declined by 24%. 2.9.2 Lemons and limes Exports of South African lemons and limes to the various regions of the world over the past decade are presented in Figure 29. Lemons and limes totalling 165 221 tons were exported by South Africa in 2011. Between 2009 and 2010 the total volume of lemons and limes exported by South Africa declined by 62%. The total volume of exports however recorded an increase of 10% between 2010 and 2011. During the last decade most of South Africa’s exports of lemons and limes went mainly to the European and Asian markets. In 2011 exports to Asia accounted for 47% of total South African lemons and limes exports while those to Europe accounted for 50%. It can be observed in Figure 29 that total South African exports of lemons and limes are predominantly determined by quantities absorbed by the Asian market. Total South African exports of lemons and limes to the world peaked in 2009 at 396 945 tons while those to Asia peaked at 287 644 tons during the same year. Africa and the Americas also constitute important markets for South African lemons and limes.
Source: Quantec Easydata
2002 2003 2004 2005 2006 2007 2008 2009 2010 2011
World 79732 131189 115301 339195 143870 121999 165657 396945 150606 165221
Africa 1702 1958 2489 2043 1990 2129 1883 13979 2451 2699
Americas 431 1293 601 671 629 2138 2216 637 1697 2809
Asia 45091 61095 58007 257843 81059 78951 75789 287644 70248 77671
Europe 32507 66842 54096 78572 57555 38575 85711 94520 76051 82038
0
50000
100000
150000
200000
250000
300000
350000
400000
450000
Vo
lum
es in
To
ns
Years
Figure 29: Volumes of lemons and limes exported to the the various regions of the world, 2002-2011
29
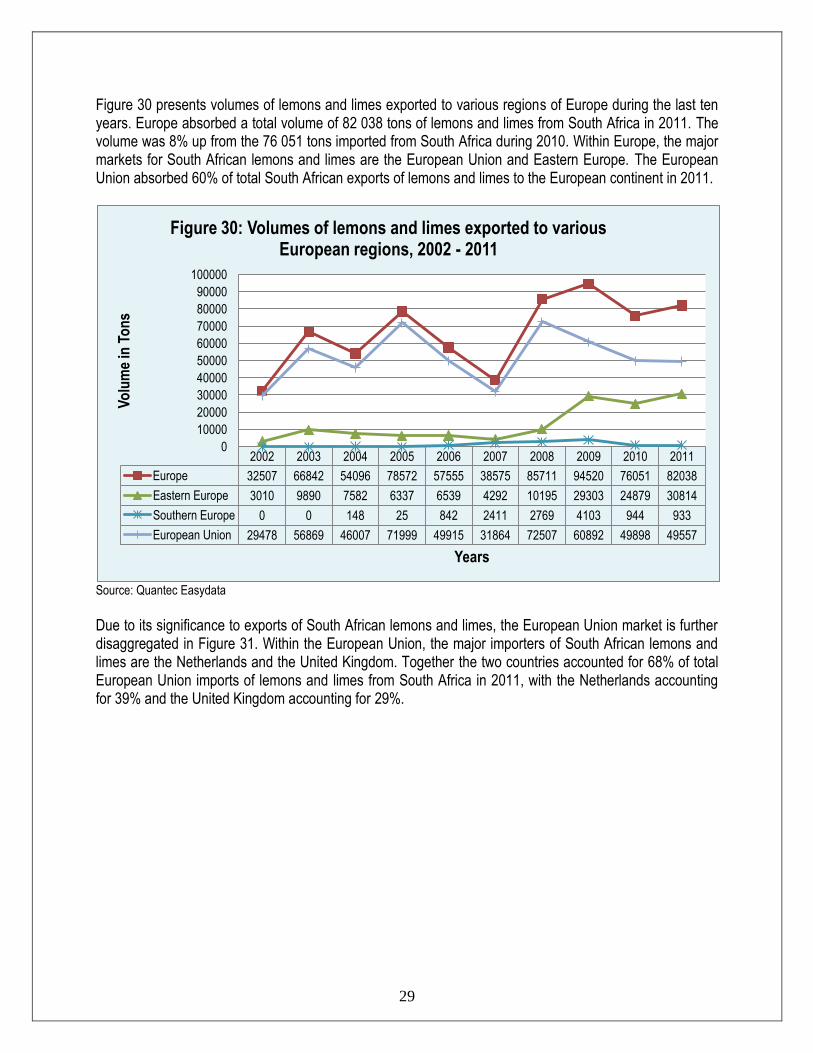
Figure 30 presents volumes of lemons and limes exported to various regions of Europe during the last ten years. Europe absorbed a total volume of 82 038 tons of lemons and limes from South Africa in 2011. The volume was 8% up from the 76 051 tons imported from South Africa during 2010. Within Europe, the major markets for South African lemons and limes are the European Union and Eastern Europe. The European Union absorbed 60% of total South African exports of lemons and limes to the European continent in 2011.
Source: Quantec Easydata
Due to its significance to exports of South African lemons and limes, the European Union market is further disaggregated in Figure 31. Within the European Union, the major importers of South African lemons and limes are the Netherlands and the United Kingdom. Together the two countries accounted for 68% of total European Union imports of lemons and limes from South Africa in 2011, with the Netherlands accounting for 39% and the United Kingdom accounting for 29%.
2002 2003 2004 2005 2006 2007 2008 2009 2010 2011
Europe 32507 66842 54096 78572 57555 38575 85711 94520 76051 82038
Eastern Europe 3010 9890 7582 6337 6539 4292 10195 29303 24879 30814
Southern Europe 0 0 148 25 842 2411 2769 4103 944 933
European Union 29478 56869 46007 71999 49915 31864 72507 60892 49898 49557
0
10000
20000
30000
40000
50000
60000
70000
80000
90000
100000
Vo
lum
e in
To
ns
Years
Figure 30: Volumes of lemons and limes exported to various European regions, 2002 - 2011

30
Source: Quantec Easydata
Volumes of lemons and limes exported by South Africa to the various regions of Asia are presented in Figure 32. It is evident that the majority of South African exports of lemons and limes that went to Asia during the last decade were destined for Western Asia. Approximately 76% of all South African exports of lemons and limes to Asia in 2011 were absorbed by Western Asia. The remainder went to Eastern Asia (14%), South-Eastern Asia (8%) and South-Central Asia (1%).
2002 2003 2004 2005 2006 2007 2008 2009 2010 2011
European Union 29478 56869 46007 71999 49915 31864 72507 60892 49898 49557
Belgium 6209 17169 5361 5234 5090 2006 6209 4060 94 214
Germany 1706 1419 3859 2838 1511 911 2152 1755 1961 1349
Spain 870 4320 1125 4241 2243 961 1774 169 135 389
France 159 984 643 1009 612 359 461 3157 981 1197
United Kingdom 9144 15733 10986 24596 18016 14152 23601 15889 17103 14316
Greece 247 0 2124 1297 2146 1106 1297 2410 616 1172
Italy 4107 7306 8423 7833 7113 3273 5318 16380 4479 7837
Netherlands 5077 5892 10027 21239 8265 6507 27073 13855 21186 19193
Slovenia 1175 2178 1527 2019 755 49 150 24 168 0
0
10000
20000
30000
40000
50000
60000
70000
80000
Vo
lum
es in
To
ns
Years
Figure 31: Volumes of lemons and limes exported to various European Union member states, 2002 - 2011

31
Source: Quantec Easydata
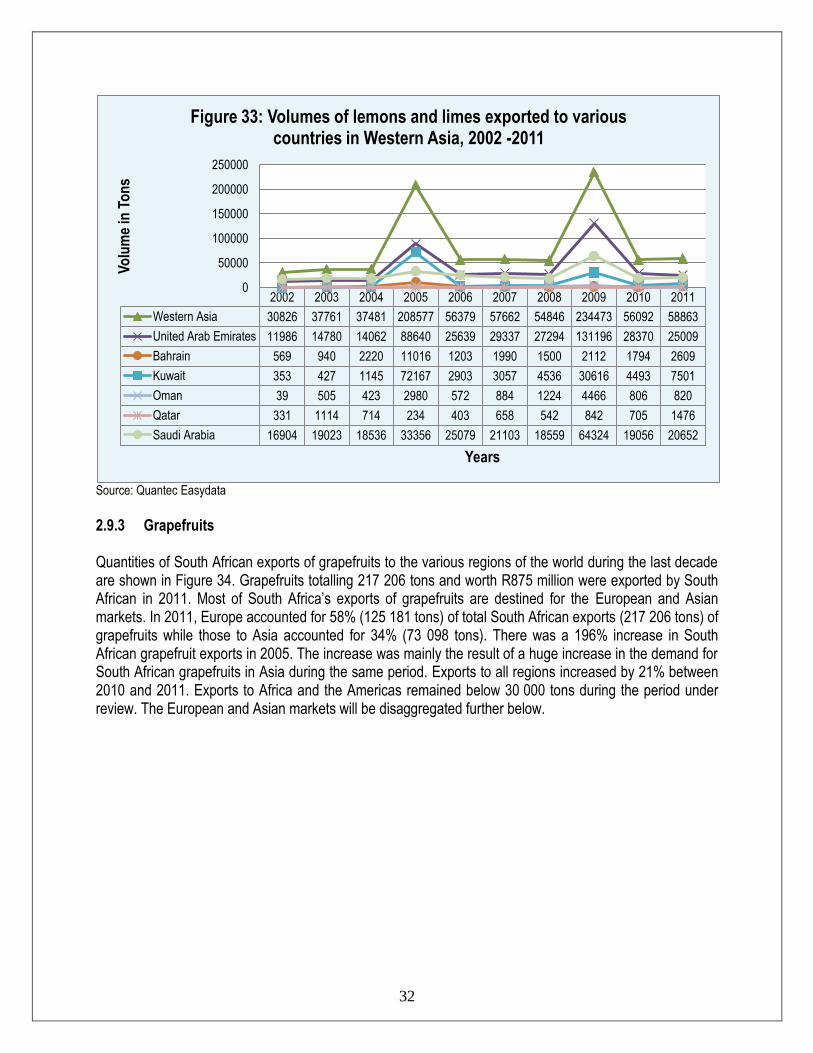
Volumes of South African exports of lemons and limes to the different countries within Western Asia during the last decade are presented in Figure 33. Note that only those countries whose imports of lemons and limes from South Africa were at least 1 000 tons in at least one year during the period under review are shown in Figure 33. It is evident that the major importers of South African lemons and limes in Western Asia are the United Arab Emirates and Saudi Arabia. In 2011 the two countries accounted for 76% of all South African exports of lemons to Western Asia, with the United Arab Emirates accounting for 42% and Saudi Arabia contributing 35%. Exports to the United Arab Emirates declined by 9% between 2010 and 2011 while those to Saudi Arabia increased by 8% during the same period.
2002 2003 2004 2005 2006 2007 2008 2009 2010 2011
Asia 45091 61095 58007 257843 81059 78951 75789 287644 70248 77671
Eastern Asia 12160 21727 18620 41630 19177 16336 17424 42650 9884 11017
South-central Asia 2 115 104 2283 1266 907 172 2280 322 1363
South-eastern Asia 2102 1492 1802 5353 4238 4045 3347 8241 3950 6427
Western Asia 30826 37761 37481 208577 56379 57662 54846 234473 56092 58863
0
50000
100000
150000
200000
250000
300000
350000
Vo
lum
e in
To
ns
Years
Figure 32: Volumes of lemons and limes exported to Asian regions, 2002 -2011
32
Source: Quantec Easydata
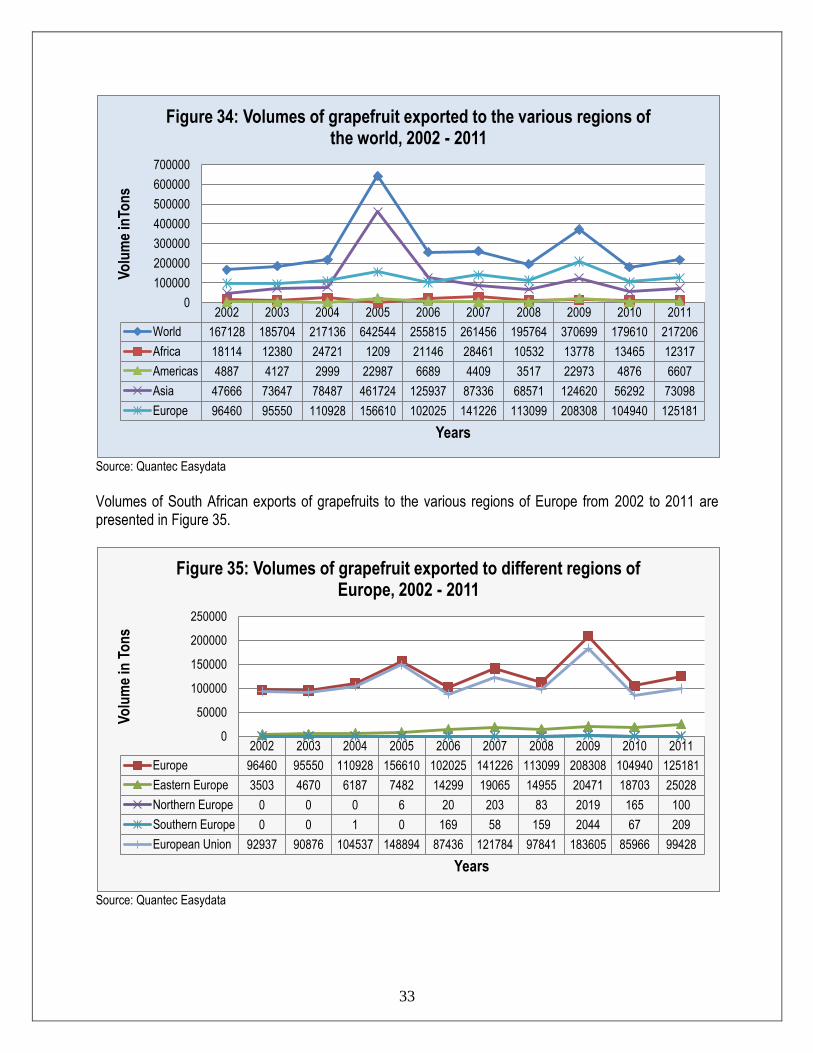
2.9.3 Grapefruits Quantities of South African exports of grapefruits to the various regions of the world during the last decade are shown in Figure 34. Grapefruits totalling 217 206 tons and worth R875 million were exported by South African in 2011. Most of South Africa’s exports of grapefruits are destined for the European and Asian markets. In 2011, Europe accounted for 58% (125 181 tons) of total South African exports (217 206 tons) of grapefruits while those to Asia accounted for 34% (73 098 tons). There was a 196% increase in South African grapefruit exports in 2005. The increase was mainly the result of a huge increase in the demand for South African grapefruits in Asia during the same period. Exports to all regions increased by 21% between 2010 and 2011. Exports to Africa and the Americas remained below 30 000 tons during the period under review. The European and Asian markets will be disaggregated further below.
2002 2003 2004 2005 2006 2007 2008 2009 2010 2011
Western Asia 30826 37761 37481 208577 56379 57662 54846 234473 56092 58863
United Arab Emirates 11986 14780 14062 88640 25639 29337 27294 131196 28370 25009
Bahrain 569 940 2220 11016 1203 1990 1500 2112 1794 2609
Kuwait 353 427 1145 72167 2903 3057 4536 30616 4493 7501
Oman 39 505 423 2980 572 884 1224 4466 806 820
Qatar 331 1114 714 234 403 658 542 842 705 1476
Saudi Arabia 16904 19023 18536 33356 25079 21103 18559 64324 19056 20652
0
50000
100000
150000
200000
250000
Vo
lum
e in
To
ns
Years
Figure 33: Volumes of lemons and limes exported to various countries in Western Asia, 2002 -2011
33
Source: Quantec Easydata
Volumes of South African exports of grapefruits to the various regions of Europe from 2002 to 2011 are presented in Figure 35.
Source: Quantec Easydata
2002 2003 2004 2005 2006 2007 2008 2009 2010 2011
World 167128 185704 217136 642544 255815 261456 195764 370699 179610 217206
Africa 18114 12380 24721 1209 21146 28461 10532 13778 13465 12317
Americas 4887 4127 2999 22987 6689 4409 3517 22973 4876 6607
Asia 47666 73647 78487 461724 125937 87336 68571 124620 56292 73098
Europe 96460 95550 110928 156610 102025 141226 113099 208308 104940 125181
0
100000
200000
300000
400000
500000
600000
700000
Vo
lum
e in
Ton
s
Years
Figure 34: Volumes of grapefruit exported to the various regions of the world, 2002 - 2011
2002 2003 2004 2005 2006 2007 2008 2009 2010 2011
Europe 96460 95550 110928 156610 102025 141226 113099 208308 104940 125181
Eastern Europe 3503 4670 6187 7482 14299 19065 14955 20471 18703 25028
Northern Europe 0 0 0 6 20 203 83 2019 165 100
Southern Europe 0 0 1 0 169 58 159 2044 67 209
European Union 92937 90876 104537 148894 87436 121784 97841 183605 85966 99428
0
50000
100000
150000
200000
250000
Vo
lum
e in
To
ns
Years
Figure 35: Volumes of grapefruit exported to different regions of Europe, 2002 - 2011
34
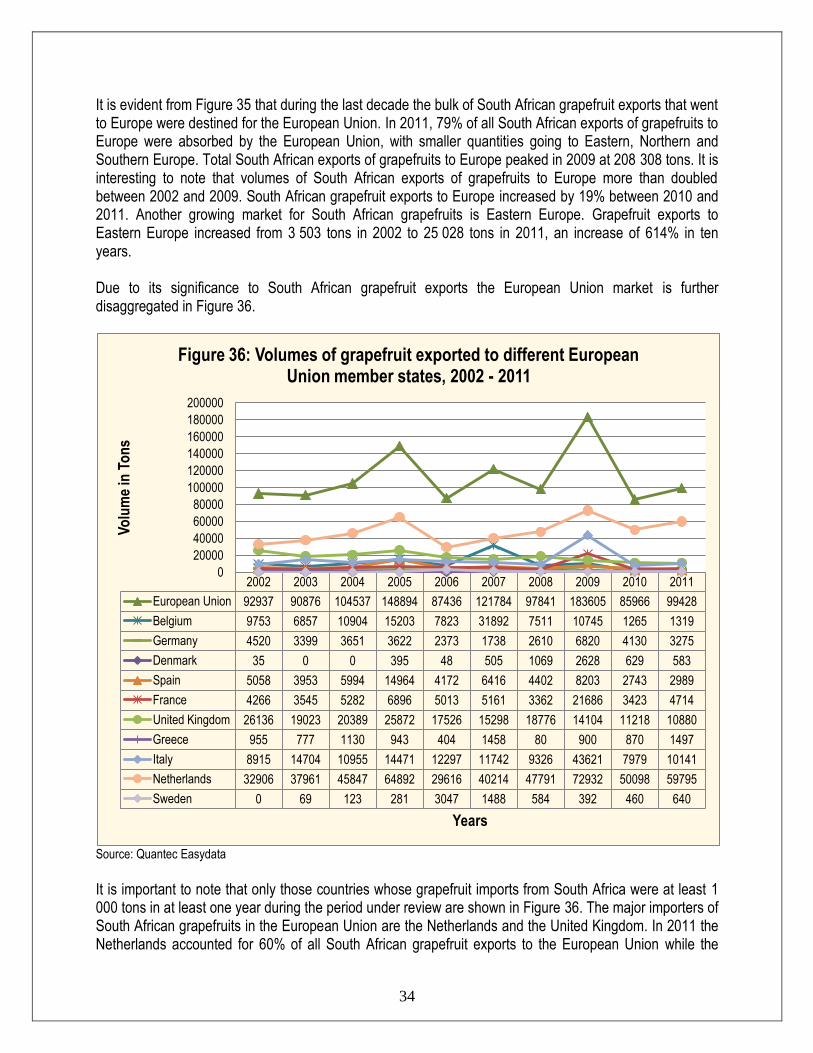
It is evident from Figure 35 that during the last decade the bulk of South African grapefruit exports that went to Europe were destined for the European Union. In 2011, 79% of all South African exports of grapefruits to Europe were absorbed by the European Union, with smaller quantities going to Eastern, Northern and Southern Europe. Total South African exports of grapefruits to Europe peaked in 2009 at 208 308 tons. It is interesting to note that volumes of South African exports of grapefruits to Europe more than doubled between 2002 and 2009. South African grapefruit exports to Europe increased by 19% between 2010 and 2011. Another growing market for South African grapefruits is Eastern Europe. Grapefruit exports to Eastern Europe increased from 3 503 tons in 2002 to 25 028 tons in 2011, an increase of 614% in ten years. Due to its significance to South African grapefruit exports the European Union market is further disaggregated in Figure 36.
Source: Quantec Easydata
It is important to note that only those countries whose grapefruit imports from South Africa were at least 1 000 tons in at least one year during the period under review are shown in Figure 36. The major importers of South African grapefruits in the European Union are the Netherlands and the United Kingdom. In 2011 the Netherlands accounted for 60% of all South African grapefruit exports to the European Union while the
2002 2003 2004 2005 2006 2007 2008 2009 2010 2011
European Union 92937 90876 104537 148894 87436 121784 97841 183605 85966 99428
Belgium 9753 6857 10904 15203 7823 31892 7511 10745 1265 1319
Germany 4520 3399 3651 3622 2373 1738 2610 6820 4130 3275
Denmark 35 0 0 395 48 505 1069 2628 629 583
Spain 5058 3953 5994 14964 4172 6416 4402 8203 2743 2989
France 4266 3545 5282 6896 5013 5161 3362 21686 3423 4714
United Kingdom 26136 19023 20389 25872 17526 15298 18776 14104 11218 10880
Greece 955 777 1130 943 404 1458 80 900 870 1497
Italy 8915 14704 10955 14471 12297 11742 9326 43621 7979 10141
Netherlands 32906 37961 45847 64892 29616 40214 47791 72932 50098 59795
Sweden 0 69 123 281 3047 1488 584 392 460 640
0
20000
40000
60000
80000
100000
120000
140000
160000
180000
200000
Vo
lum
e in
To
ns
Years
Figure 36: Volumes of grapefruit exported to different European Union member states, 2002 - 2011

35
United Kingdom accounted for 11% during the same year. Other important players in 2011 included Italy (10%) and France (5%). Grapefruit exports to the European Union as a whole increased by 16% between 2010 and 2011. Figure 37 presents volumes of South African exports of grapefruits to the different regions of Asia. The major Asian region in terms of South African grapefruit exports is Eastern Asia. The region absorbed 90% of the total South African exports of grapefruits to Asia in 2011. The total South African grapefruit exports to Asia peaked at 461 724 tons in 2005. South African exports of grapefruits to Asia increased by 53% between 2002 and 2011 while those to Eastern Asia increased by 46% during the same period. South African exports of grapefruits declined from 124 620 tons in 2009 to 56 292 tons in 2010, representing a decline of 55% and increased again by 30% in 2011.
Source: Quantec Easydata
Volumes of South African grapefruit exports to the different countries in Eastern Asia during the last decade are presented in Figure 38. Note that only those countries whose grapefruit imports from South Africa were at least 1 000 tons in at least one year during the period under review are shown in Figure 38. The major importer of South African grapefruit in Eastern Asia is Japan. In 2011, Japan absorbed 85% of the total South African exports of grapefruits to Eastern Asia. South African exports of grapefruits to Japan decreased by 22% between 2010 and 2011. Other importers of South African grapefruit in Eastern Asia are China, Hong Kong and Taiwan.
2002 2003 2004 2005 2006 2007 2008 2009 2010 2011
Asia 47666 73647 78487 461724 125937 87336 68571 124620 56292 73098
Eastern Asia 45072 70683 76449 452309 120767 74291 63257 104331 51353 65704
South-eastern Asia 1007 909 660 1299 827 1579 823 1036 1072 1463
Western Asia 1545 2053 1378 8051 4341 11466 4482 19035 3462 5654
0
50000
100000
150000
200000
250000
300000
350000
400000
450000
500000
Vo
lum
e in
To
ns
Years
Figure 37: Volumes of grapefruit exports to various Asian regions, 2002 - 2011

36
Source: Quantec Easydata
2.9.4 Soft citrus Figure 39 presents volumes of South African exports of soft citrus to the different regions of the world during the last decade.
Source: Quantec Easydata
2002 2003 2004 2005 2006 2007 2008 2009 2010 2011
Eastern Asia 45072 70683 76449 452309 120767 74291 63257 104331 51353 65704
China 142 87 19 169 90 126 100 295 331 1340
Hong Kong 3036 2192 739 9023 6234 3702 2212 8883 3476 5594
Japan 39149 64896 73896 416297 105008 66324 59580 91834 45553 55750
Taiwan 2744 3509 1796 26821 9021 4114 1366 3319 1993 3020
0 50000
100000 150000 200000 250000 300000 350000 400000 450000 500000
Vo
lum
e in
To
ns
Years
Figure 38: Volumes of grapefruit exports to various countries in Eastern Asia, 2002 - 2011
2002 2003 2004 2005 2006 2007 2008 2009 2010 2011
World 69197 73902 77595 85674 86797 106781 112249 127115 115878 107945
Africa 4203 1438 1260 1511 1527 1498 1664 3481 2238 2634
Americas 6617 10789 11791 14789 23799 11464 9408 15402 13148 9557
Asia 7475 5423 5947 6311 8435 10653 12890 18000 17465 19046
Europe 50902 56251 58596 63038 53014 82970 88261 90156 83015 76708
0
20000
40000
60000
80000
100000
120000
140000
Vo
lum
e in
To
ns
Years
Figure 39: Volumes of soft citrus exported to various regions of the world, 2002 - 2011

37
Most of South Africa’s exports of soft citrus during the past ten years went to Europe. The continent absorbed 71% of the total South African exports of soft citrus in 2011. South African exports of soft citrus to the world declined by 7% between 2010 and 2011. The second most important continent for South African exports of soft citrus in 2011 was Asia, which absorbed 19 046 tons during the same year. Exports to Africa and the Americas have been stable over the last decade, remaining below the 20 000 tons mark. Export volumes for South African soft citrus to the various regions of Europe for the period 2002 to 2011 are presented in Figure 40. It is evident that during the last decade the European Union absorbed the bulk of South African exports of soft citrus that went to Europe. The European Union accounted for 83% of the total South African exports of soft citrus in 2011. The remaining 17% went to Eastern and Southern Europe. Exports to Europe declined by 8% between 2010 and 2011. It is interesting to note that while exports to the European Union declined between 2010 and 2011, exports to Eastern Europe have been increasing during the ten years under review.
Source: Quantec Easydata
Due to its relative importance to exports of South African soft citrus the European Union market is further disaggregated below. Volumes of South African exports of soft citrus to the different European Union member states during the last decade are presented in Figure 41. Only those countries whose imports of soft citrus from South Africa were at least 1 000 tons in at least one year during the period under review are shown in Figure 41. The major importers of soft citrus from South Africa are the United Kingdom and the Netherlands. In 2011, the two countries accounted for 92% of the total South African exports of soft citrus to the European Union, with the United Kingdom accounting for 64% and the Netherlands contributing 28%. Between 2010 and 2011, exports to the United Kingdom declined by 10% while those to the Netherlands also declined by 6%.
2002 2003 2004 2005 2006 2007 2008 2009 2010 2011
Europe 50902 56251 58596 63038 53014 82970 88261 90156 83015 76708
Eastern Europe 1294 2766 6778 4699 5575 5944 13368 8538 13013 12782
Southern Europe 0 0 44 0 0 43 10 2204 242 132
European Union 49555 53483 51774 58277 47398 76874 74705 79207 69747 63747
0
10000
20000
30000
40000
50000
60000
70000
80000
90000
100000
Vo
lum
e in
To
ns
Years
Figure 40: Volumes of soft citrus exported to various regions of Europe, 2002 - 2011

38
Source: Quantec Easydata
2.10 Provincial and district export values of South African citrus Figure 40 below depicts the value of citrus exports from each province of South Africa during the last ten years. The figure presents an interesting but somewhat misleading view of the source of citrus products destined for the export markets. Firstly, the fact that approximately 73% of the citrus export value was derived from the Western Cape in 2011 does not mean that the province was the main producer of citrus. It only implies that the majority of registered exporters are based in the Western Cape. Secondly, the province (Western Cape) serves as exit point for citrus exports through the Cape Town harbour. Citrus products worth R7.1 billion were exports by South Africa in 2011. Following the Western Cape in terms of the value of citrus exports in 2011 were the Eastern Cape, Limpopo and Gauteng at 10%, 8% and 3% respectively.
2002 2003 2004 2005 2006 2007 2008 2009 2010 2011
European Union 49555 53483 51774 58277 47398 76874 74705 79207 69747 63747
Belgium 2503 2700 2425 2380 1495 3287 3282 2736 834 315
Spain 70 723 409 621 259 1967 759 670 181 465
United Kingdom 37023 37280 34876 43564 36794 53204 48207 55585 45266 40802
Ireland 53 103 26 51 653 2089 3523 3251 1808 1782
Italy 13 319 220 148 101 264 72 238 271 1211
Netherlands 9096 11646 12432 10742 7342 14958 17719 14798 18932 17879
0
10000
20000
30000
40000
50000
60000
70000
80000
90000
Vo
lum
e in
To
ns
Years
Figure 41: Volumes of soft citrus exported to various European Union member states, 2002 - 2011

39
Source: Quantec Easydata
The following figures (Figures 43 - 51) show the value of citrus exports from the various districts in the nine provinces of South Africa. Figure 43 illustrates values of citrus exports by the Eastern Cape province. It is clear from Figure 43 that citrus exports from the Eastern Cape are mainly from the Nelson Mandela, Cacadu and Amatole municipalities. High export values for the leading municipalities were recorded in 2011 (for Amatole, Nelson Mandela and Cacadu). The use of the Port Elizabeth harbour as an exit point may have played a major role in both Nelson Mandela and Cacadu municipalities being leaders in the export of citrus from the Eastern Cape. A total of R747 million worth of citrus products exports was recorded by the Eastern Cape in 2011. This was 67% higher than the value exported in 2010.
2002 2003 2004 2005 2006 2007 2008 2009 2010 2011
RSA 2291 2663 2972 3177 3525 4317 5643 5294 6574 7067
Western Cape 1641 1941 2218 2233 2411 3377 4356 3966 5013 5164
Eastern Cape 106 76 82 70 193 281 390 429 463 747
Northern Cape 2 3 8 11 16 11 35 34 28 36
Free State 0 1 0 0 1 2 1 1 0 0
Kwazulu-Natal 49 30 18 47 53 60 53 37 16 19
North West 3 14 0 2 2 0 4 0 1 10
Gauteng 405 431 388 437 444 107 112 104 164 182
Mpumalanga 14 26 149 173 119 176 227 232 368 279
Limpopo 72 141 109 203 285 303 466 490 521 629
0
1000
2000
3000
4000
5000
6000
7000
8000
Ran
ds
(R10
00 0
00)
Years
Figure 42: Value of citrus exports by provinces, 2002 – 2011

40
Source: Quantec Easydata
Values of citrus exports by the Limpopo province are shown in Figure 44.
Source: Quantec Easydata
2002 2003 2004 2005 2006 2007 2008 2009 2010 2011
Eastern Cape 106 76 82 70 193 281 390 429 463 747
Cacadu 48 16 11 14 77 81 129 143 111 186
Amatole 4 21 0 0 0 3 2 13 18 46
Chris Hani 0 0 0 0 0 0 0 0 0 31
O.R.Tambo 25 0 33 0 0 0 0 0 0 0
Nelson Mandela 28 39 38 56 116 197 258 273 335 484
0
100
200
300
400
500
600
700
800
Ran
ds
(R10
00 0
00)
Years
Figure 43: Value of citrus exports by the Eastern Cape province, 2002 – 2011
2002 2003 2004 2005 2006 2007 2008 2009 2010 2011
Limpopo 72 141 109 203 285 303 466 490 521 629
Mopani 57 116 82 142 226 149 312 283 330 482
Vhembe 0 0 0 0 0 8 22 66 42 73
Capricorn 0 1 1 11 25 80 9 9 1 3
Waterberg 0 1 1 1 6 4 6 1 0 0
Greater Sekhukhune 14 24 26 50 28 62 116 130 147 72
0
100
200
300
400
500
600
700
Ran
ds
(R10
00 0
00)
Years
Figure 44: Value of citrus exports by Limpopo province, 2002 – 2011
41
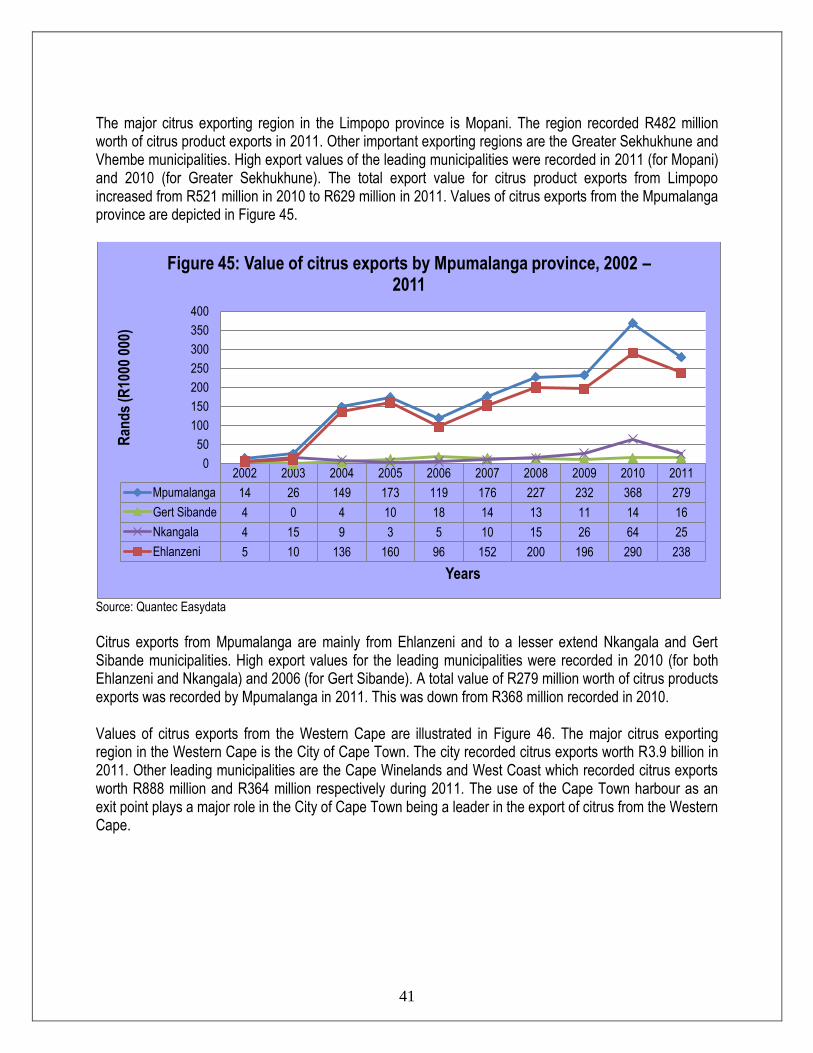
The major citrus exporting region in the Limpopo province is Mopani. The region recorded R482 million worth of citrus product exports in 2011. Other important exporting regions are the Greater Sekhukhune and Vhembe municipalities. High export values of the leading municipalities were recorded in 2011 (for Mopani) and 2010 (for Greater Sekhukhune). The total export value for citrus product exports from Limpopo increased from R521 million in 2010 to R629 million in 2011. Values of citrus exports from the Mpumalanga province are depicted in Figure 45.
Source: Quantec Easydata
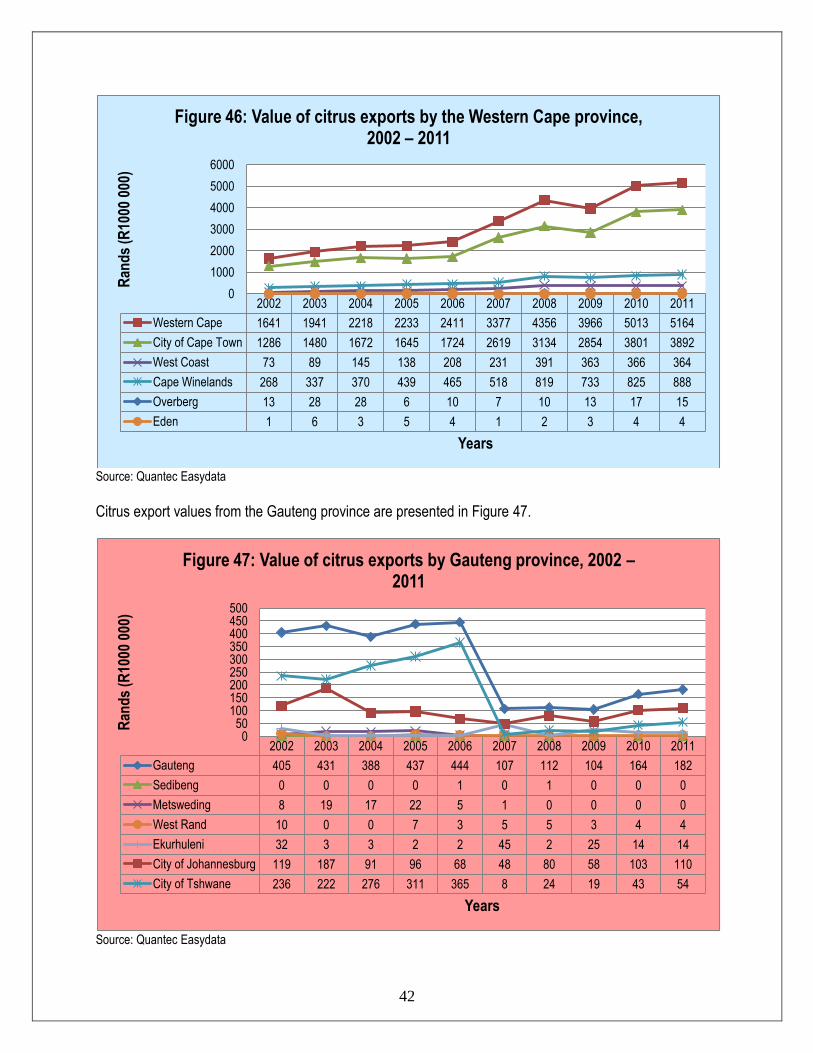
Citrus exports from Mpumalanga are mainly from Ehlanzeni and to a lesser extend Nkangala and Gert Sibande municipalities. High export values for the leading municipalities were recorded in 2010 (for both Ehlanzeni and Nkangala) and 2006 (for Gert Sibande). A total value of R279 million worth of citrus products exports was recorded by Mpumalanga in 2011. This was down from R368 million recorded in 2010. Values of citrus exports from the Western Cape are illustrated in Figure 46. The major citrus exporting region in the Western Cape is the City of Cape Town. The city recorded citrus exports worth R3.9 billion in 2011. Other leading municipalities are the Cape Winelands and West Coast which recorded citrus exports worth R888 million and R364 million respectively during 2011. The use of the Cape Town harbour as an exit point plays a major role in the City of Cape Town being a leader in the export of citrus from the Western Cape.
2002 2003 2004 2005 2006 2007 2008 2009 2010 2011
Mpumalanga 14 26 149 173 119 176 227 232 368 279
Gert Sibande 4 0 4 10 18 14 13 11 14 16
Nkangala 4 15 9 3 5 10 15 26 64 25
Ehlanzeni 5 10 136 160 96 152 200 196 290 238
0
50
100
150
200
250
300
350
400
Ran
ds
(R10
00 0
00)
Years
Figure 45: Value of citrus exports by Mpumalanga province, 2002 – 2011
42
Source: Quantec Easydata
Citrus export values from the Gauteng province are presented in Figure 47.
Source: Quantec Easydata
2002 2003 2004 2005 2006 2007 2008 2009 2010 2011
Western Cape 1641 1941 2218 2233 2411 3377 4356 3966 5013 5164
City of Cape Town 1286 1480 1672 1645 1724 2619 3134 2854 3801 3892
West Coast 73 89 145 138 208 231 391 363 366 364
Cape Winelands 268 337 370 439 465 518 819 733 825 888
Overberg 13 28 28 6 10 7 10 13 17 15
Eden 1 6 3 5 4 1 2 3 4 4
0
1000
2000
3000
4000
5000
6000
Ran
ds
(R10
00 0
00)
Years
Figure 46: Value of citrus exports by the Western Cape province, 2002 – 2011
2002 2003 2004 2005 2006 2007 2008 2009 2010 2011
Gauteng 405 431 388 437 444 107 112 104 164 182
Sedibeng 0 0 0 0 1 0 1 0 0 0
Metsweding 8 19 17 22 5 1 0 0 0 0
West Rand 10 0 0 7 3 5 5 3 4 4
Ekurhuleni 32 3 3 2 2 45 2 25 14 14
City of Johannesburg 119 187 91 96 68 48 80 58 103 110
City of Tshwane 236 222 276 311 365 8 24 19 43 54
0 50
100 150 200 250 300 350 400 450 500
Ran
ds
(R10
00 0
00)
Years
Figure 47: Value of citrus exports by Gauteng province, 2002 – 2011
43
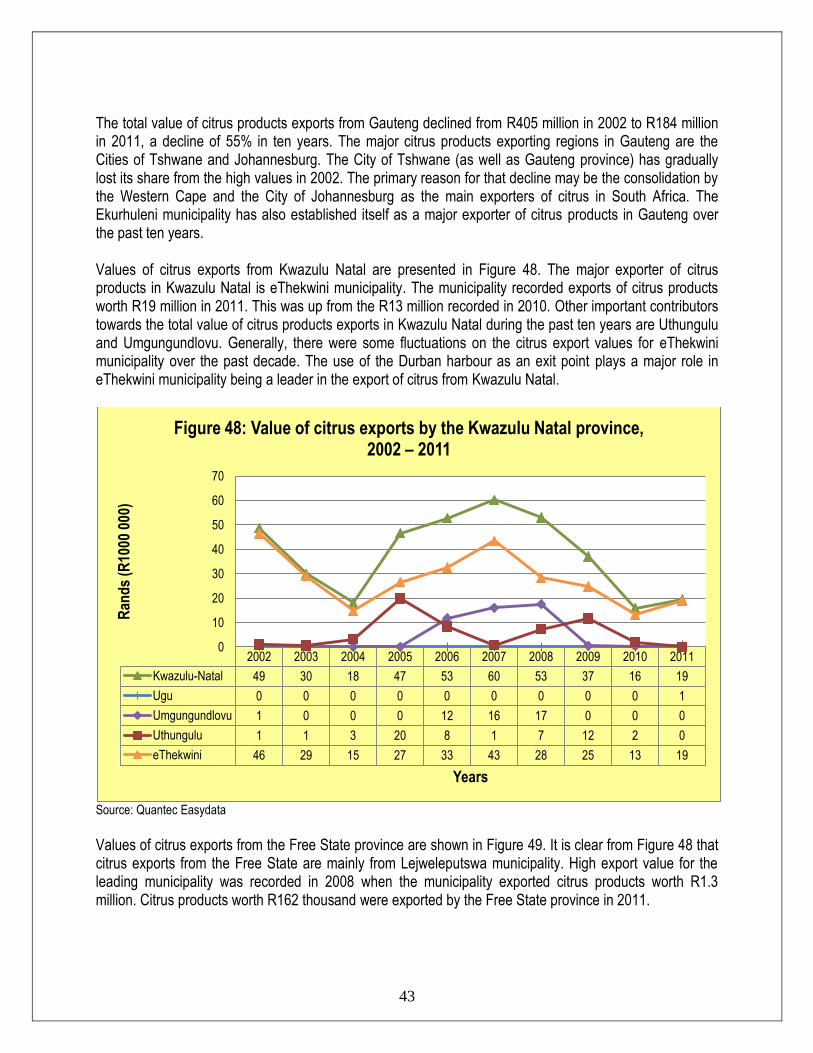
The total value of citrus products exports from Gauteng declined from R405 million in 2002 to R184 million in 2011, a decline of 55% in ten years. The major citrus products exporting regions in Gauteng are the Cities of Tshwane and Johannesburg. The City of Tshwane (as well as Gauteng province) has gradually lost its share from the high values in 2002. The primary reason for that decline may be the consolidation by the Western Cape and the City of Johannesburg as the main exporters of citrus in South Africa. The Ekurhuleni municipality has also established itself as a major exporter of citrus products in Gauteng over the past ten years. Values of citrus exports from Kwazulu Natal are presented in Figure 48. The major exporter of citrus products in Kwazulu Natal is eThekwini municipality. The municipality recorded exports of citrus products worth R19 million in 2011. This was up from the R13 million recorded in 2010. Other important contributors towards the total value of citrus products exports in Kwazulu Natal during the past ten years are Uthungulu and Umgungundlovu. Generally, there were some fluctuations on the citrus export values for eThekwini municipality over the past decade. The use of the Durban harbour as an exit point plays a major role in eThekwini municipality being a leader in the export of citrus from Kwazulu Natal.
Source: Quantec Easydata
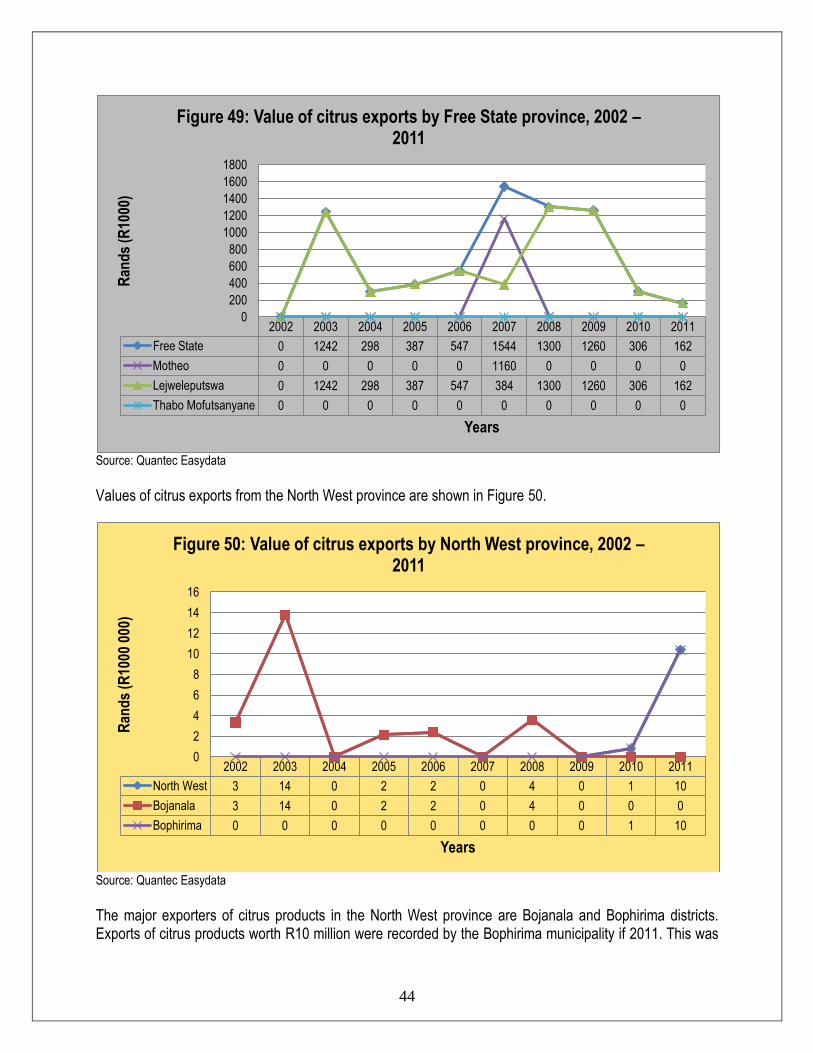
Values of citrus exports from the Free State province are shown in Figure 49. It is clear from Figure 48 that citrus exports from the Free State are mainly from Lejweleputswa municipality. High export value for the leading municipality was recorded in 2008 when the municipality exported citrus products worth R1.3 million. Citrus products worth R162 thousand were exported by the Free State province in 2011.
2002 2003 2004 2005 2006 2007 2008 2009 2010 2011
Kwazulu-Natal 49 30 18 47 53 60 53 37 16 19
Ugu 0 0 0 0 0 0 0 0 0 1
Umgungundlovu 1 0 0 0 12 16 17 0 0 0
Uthungulu 1 1 3 20 8 1 7 12 2 0
eThekwini 46 29 15 27 33 43 28 25 13 19
0
10
20
30
40
50
60
70
Ran
ds
(R10
00 0
00)
Years
Figure 48: Value of citrus exports by the Kwazulu Natal province, 2002 – 2011
44
Source: Quantec Easydata
Values of citrus exports from the North West province are shown in Figure 50.
Source: Quantec Easydata The major exporters of citrus products in the North West province are Bojanala and Bophirima districts. Exports of citrus products worth R10 million were recorded by the Bophirima municipality if 2011. This was
2002 2003 2004 2005 2006 2007 2008 2009 2010 2011
Free State 0 1242 298 387 547 1544 1300 1260 306 162
Motheo 0 0 0 0 0 1160 0 0 0 0
Lejweleputswa 0 1242 298 387 547 384 1300 1260 306 162
Thabo Mofutsanyane 0 0 0 0 0 0 0 0 0 0
0
200
400
600
800
1000
1200
1400
1600
1800
Ran
ds
(R10
00)
Years
Figure 49: Value of citrus exports by Free State province, 2002 – 2011
2002 2003 2004 2005 2006 2007 2008 2009 2010 2011
North West 3 14 0 2 2 0 4 0 1 10
Bojanala 3 14 0 2 2 0 4 0 0 0
Bophirima 0 0 0 0 0 0 0 0 1 10
0
2
4
6
8
10
12
14
16
Ran
ds
(R10
00 0
00)
Years
Figure 50: Value of citrus exports by North West province, 2002 – 2011
45
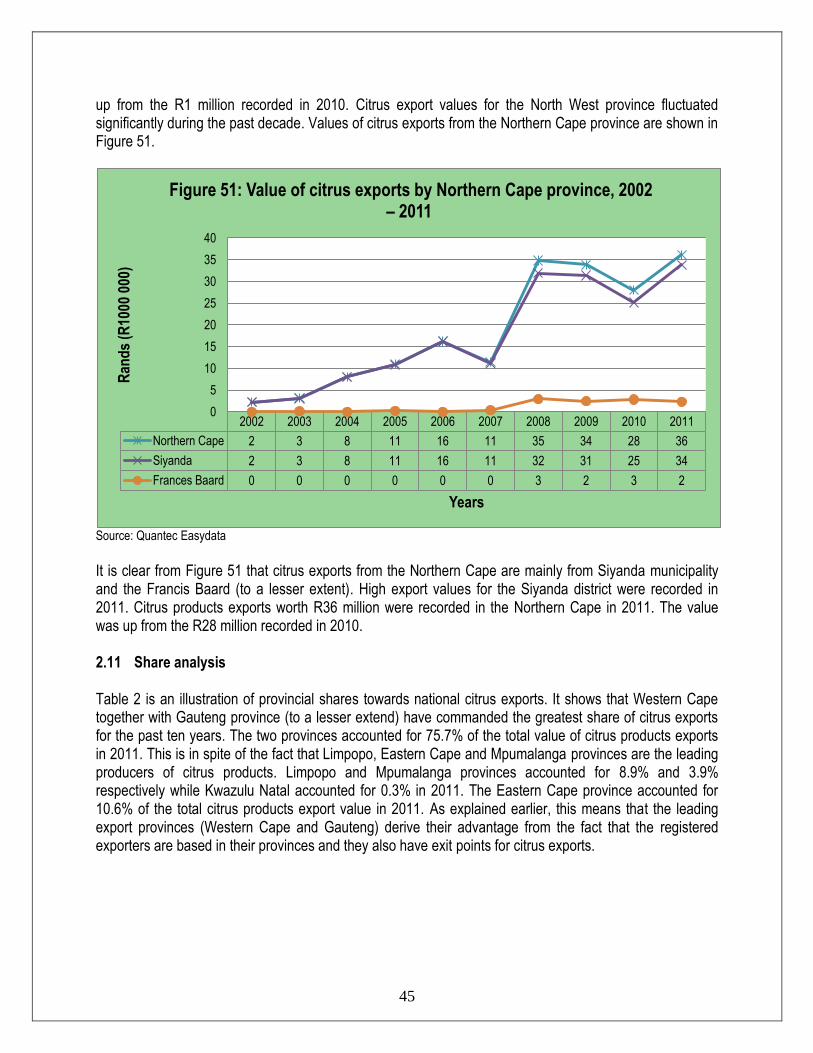
up from the R1 million recorded in 2010. Citrus export values for the North West province fluctuated significantly during the past decade. Values of citrus exports from the Northern Cape province are shown in Figure 51.
Source: Quantec Easydata
It is clear from Figure 51 that citrus exports from the Northern Cape are mainly from Siyanda municipality and the Francis Baard (to a lesser extent). High export values for the Siyanda district were recorded in 2011. Citrus products exports worth R36 million were recorded in the Northern Cape in 2011. The value was up from the R28 million recorded in 2010. 2.11 Share analysis Table 2 is an illustration of provincial shares towards national citrus exports. It shows that Western Cape together with Gauteng province (to a lesser extend) have commanded the greatest share of citrus exports for the past ten years. The two provinces accounted for 75.7% of the total value of citrus products exports in 2011. This is in spite of the fact that Limpopo, Eastern Cape and Mpumalanga provinces are the leading producers of citrus products. Limpopo and Mpumalanga provinces accounted for 8.9% and 3.9% respectively while Kwazulu Natal accounted for 0.3% in 2011. The Eastern Cape province accounted for 10.6% of the total citrus products export value in 2011. As explained earlier, this means that the leading export provinces (Western Cape and Gauteng) derive their advantage from the fact that the registered exporters are based in their provinces and they also have exit points for citrus exports.
2002 2003 2004 2005 2006 2007 2008 2009 2010 2011
Northern Cape 2 3 8 11 16 11 35 34 28 36
Siyanda 2 3 8 11 16 11 32 31 25 34
Frances Baard 0 0 0 0 0 0 3 2 3 2
0
5
10
15
20
25
30
35
40
Ran
ds
(R10
00 0
00)
Years
Figure 51: Value of citrus exports by Northern Cape province, 2002 – 2011

46
Table 2: Share of Provincial citrus exports to the total RSA citrus exports (%), 2002 – 2011 Years Province
2002 2003 2004 2005 2006 2007 2008 2009 2010 2011
RSA 100 100 100 100 100 100 100 100 100.0 100.0
Western Cape 71.6 72.9 74.6 70.3 68.4 78.2 77.2 74.9 76.3 73.1
Eastern Cape 4.6 2.8 2.7 2.2 5.5 6.5 6.9 8.1 7.0 10.6
Northern Cape 0.1 0.1 0.3 0.3 0.5 0.3 0.6 0.6 0.4 0.5
Free State - 0.0 0.0 0.0 0.0 0.0 0.0 0.0 0.0 0.0
Kwazulu-Natal 2.1 1.1 0.6 1.5 1.5 1.4 0.9 0.7 0.2 0.3
North West 0.1 0.5 - 0.1 0.1 - 0.1 0.0 0.0 0.1
Gauteng 17.7 16.2 13.0 13.8 12.6 2.5 2.0 2.0 2.5 2.6
Mpumalanga 0.6 1.0 5.0 5.4 3.4 4.1 4.0 4.4 5.6 3.9
Limpopo 3.1 5.3 3.7 6.4 8.1 7.0 8.3 9.3 7.9 8.9 Source: Calculated from Quantec Easydata
Tables 3 to 11 show shares of the various districts’ citrus exports to the various provincial citrus exports. Table 3 presents the shares of district citrus exports to the total Eastern Cape provincial citrus exports for the years 2002 to 2011. The leading citrus export district in the Eastern Cape is Nelson Mandela. The district contributed almost two-thirds (64.8%) to total Eastern Cape citrus exports in 2011. It was followed by the Cacadu, Amatole and Chris Hani districts with 24.9%, 6.1% and 4.2% respectively in 2011. Table 3: Share of districts’ citrus exports to total Eastern Cape provincial citrus exports (%), 2002 – 2011 Years District
2002 2003 2004 2005 2006 2007 2008 2009 2010 2011
Eastern Cape 100.0 100.0 100.0 100.0 100.0 100.0 100.0 100.0 100.0 100.0
Cacadu 45.6 20.6 13.4 19.8 39.7 28.9 33.1 33.3 23.9 24.9
Amatole 4.2 28.0 0.0 0.1 0.1 1.0 0.5 3.1 3.8 6.1
Chris Hani 0.0 0.0 0.0 0.0 0.0 0.0 0.0 0.0 0.0 4.2
O.R.Tambo 23.9 0.0 39.8 0.0 0.0 0.0 0.0 0.0 0.0 0.0
Nelson Mandela 26.3 51.3 46.7 80.0 60.1 70.1 66.3 63.6 72.3 64.8 Source: Calculated from Quantec Easydata
The shares of district citrus exports to the Mpumalanga provincial citrus exports are presented in Table 4. The leading contributor to provincial citrus exports in 2011 was the Ehlanzeni district (85.3%). It was followed by Nkangala at 9% and Gert Sibande at 5.7%. Table 4: Share of districts’ citrus exports to total Mpumalanga provincial citrus exports (%), 2002 - 2011 Years District
2002 2003 2004 2005 2006 2007 2008 2009 2010 2011
Mpumalanga 100.0 100.0 100.0 100.0 100.0 100.0 100.0 100.0 100.0 100.0
Gert Sibande 30.9 0.0 3.0 6.0 14.8 7.9 5.6 4.6 3.9 5.7
Nkangala 30.1 60.0 5.9 1.6 4.4 5.4 6.5 11.1 17.4 9.0

47
Years District
2002 2003 2004 2005 2006 2007 2008 2009 2010 2011
Ehlanzeni 39.0 40.0 91.1 92.5 80.7 86.7 88.0 84.3 78.7 85.3 Source: Calculated from Quantec Easydata
In the Limpopo province, the contributions of the various districts to total provincial citrus exports are distributed between two main districts (see Table 5). In 2011 the leading district was Mopani with 76.5% share. It was followed by Vhembe and Greater Sekhukhune at 11.6% and 11.4%, respectively. Table 5: Share of districts’ citrus exports to total Limpopo provincial citrus exports (%), 2002 - 2011 Years District
2002 2003 2004 2005 2006 2007 2008 2009 2010 2011
Limpopo 100.0 100.0 100.0 100.0 100.0 100.0 100.0 100.0 100.0 100.0
Mopani 79.5 82.0 75.2 69.7 79.2 48.9 67.0 57.8 63.3 76.5
Vhembe 0.4 0.0 0.0 0.0 0.0 2.6 4.8 13.5 8.1 11.6
Capricorn 0.0 0.4 0.5 5.4 8.7 26.7 2.0 1.9 0.3 0.5
Waterberg 0.5 0.5 0.5 0.3 2.2 1.2 1.3 0.3 0.0 0.0
Greater Sekhukhune
19.7 17.2 23.8 24.7 9.9 20.7 24.9 26.6 28.3 11.4
Source: Calculated from Quantec Easydata
Between 2008 and 2011, all exports of citrus products recorded in the Free State province were from the Lejweleputswa district (see Table 6). Table 6: Share of districts’ citrus exports to total Free State provincial citrus exports (%), 2002 - 2011 Years District
2002 2003 2004 2005 2006 2007 2008 2009 2010 2011
Free State 0 100.0 100.0 100.0 100.0 100.0 100.0 100.0 100.0 100.0
Motheo 0 0.0 0.0 0.0 0.0 75.1 0.0 0.0 0.0 0.0
Lejweleputswa 0 100.0 100.0 100.0 100.0 24.9 100.0 100.0 100.0 100.0 Source: Calculated from Quantec Easydata
In the Northern Cape, the majority of citrus exports recorded in 2011 were from the Siyanda district (93.6%). The remaining 6.4% were from the Francis Baard district (see Table 7). Table 7: Share of districts’ citrus exports to total Northern Cape provincial citrus exports (%), 2002 - 2011
Years District
2002 2003 2004 2005 2006 2007 2008 2009 2010 2011
Northern Cape 0 100.0 100.0 100.0 100.0 100.0 100.0 100.0 100.0 100.0
Siyanda 100.0 97.0 100.0 98.2 100.0 97.0 91.6 92.7 90.0 93.6
Frances Baard 0.0 3.0 0.0 1.8 0.0 3.0 8.4 7.3 10.0 6.4 Source: Calculated from Quantec Easydata
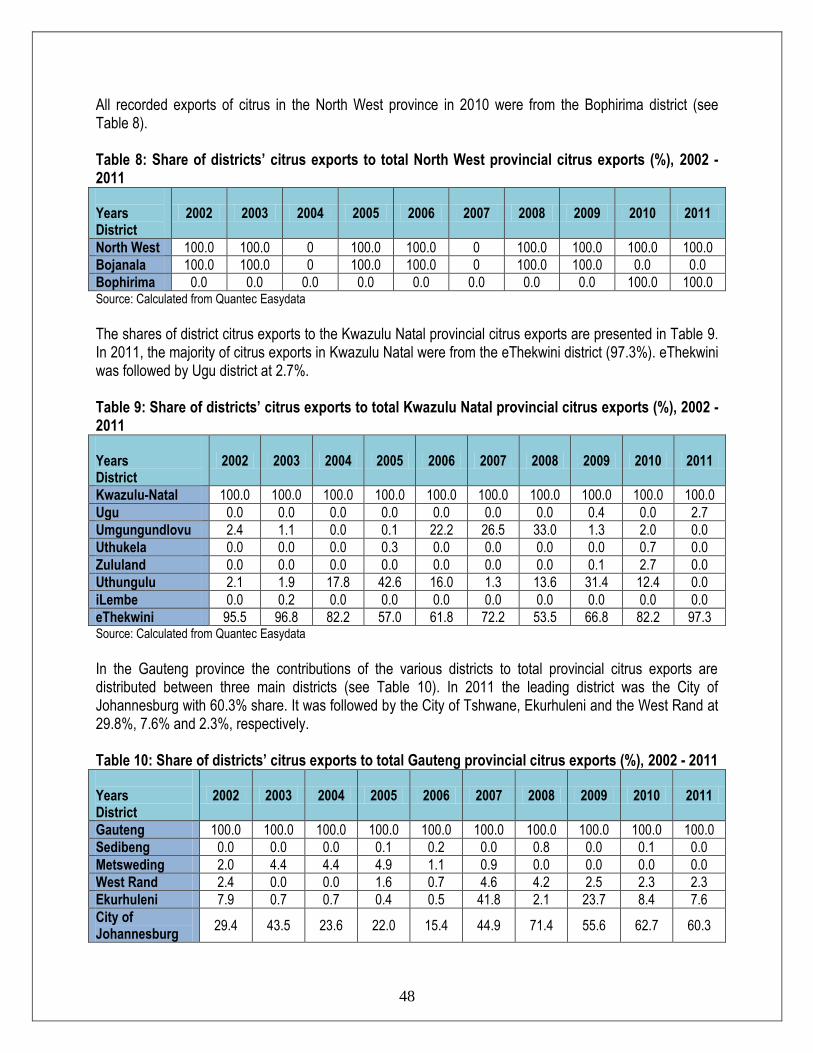
48
All recorded exports of citrus in the North West province in 2010 were from the Bophirima district (see Table 8). Table 8: Share of districts’ citrus exports to total North West provincial citrus exports (%), 2002 - 2011 Years District
2002 2003 2004 2005 2006 2007 2008 2009 2010 2011
North West 100.0 100.0 0 100.0 100.0 0 100.0 100.0 100.0 100.0
Bojanala 100.0 100.0 0 100.0 100.0 0 100.0 100.0 0.0 0.0
Bophirima 0.0 0.0 0.0 0.0 0.0 0.0 0.0 0.0 100.0 100.0 Source: Calculated from Quantec Easydata
The shares of district citrus exports to the Kwazulu Natal provincial citrus exports are presented in Table 9. In 2011, the majority of citrus exports in Kwazulu Natal were from the eThekwini district (97.3%). eThekwini was followed by Ugu district at 2.7%. Table 9: Share of districts’ citrus exports to total Kwazulu Natal provincial citrus exports (%), 2002 - 2011 Years District
2002 2003 2004 2005 2006 2007 2008 2009 2010 2011
Kwazulu-Natal 100.0 100.0 100.0 100.0 100.0 100.0 100.0 100.0 100.0 100.0
Ugu 0.0 0.0 0.0 0.0 0.0 0.0 0.0 0.4 0.0 2.7
Umgungundlovu 2.4 1.1 0.0 0.1 22.2 26.5 33.0 1.3 2.0 0.0
Uthukela 0.0 0.0 0.0 0.3 0.0 0.0 0.0 0.0 0.7 0.0
Zululand 0.0 0.0 0.0 0.0 0.0 0.0 0.0 0.1 2.7 0.0
Uthungulu 2.1 1.9 17.8 42.6 16.0 1.3 13.6 31.4 12.4 0.0
iLembe 0.0 0.2 0.0 0.0 0.0 0.0 0.0 0.0 0.0 0.0
eThekwini 95.5 96.8 82.2 57.0 61.8 72.2 53.5 66.8 82.2 97.3 Source: Calculated from Quantec Easydata
In the Gauteng province the contributions of the various districts to total provincial citrus exports are distributed between three main districts (see Table 10). In 2011 the leading district was the City of Johannesburg with 60.3% share. It was followed by the City of Tshwane, Ekurhuleni and the West Rand at 29.8%, 7.6% and 2.3%, respectively. Table 10: Share of districts’ citrus exports to total Gauteng provincial citrus exports (%), 2002 - 2011 Years District
2002 2003 2004 2005 2006 2007 2008 2009 2010 2011
Gauteng 100.0 100.0 100.0 100.0 100.0 100.0 100.0 100.0 100.0 100.0
Sedibeng 0.0 0.0 0.0 0.1 0.2 0.0 0.8 0.0 0.1 0.0
Metsweding 2.0 4.4 4.4 4.9 1.1 0.9 0.0 0.0 0.0 0.0
West Rand 2.4 0.0 0.0 1.6 0.7 4.6 4.2 2.5 2.3 2.3
Ekurhuleni 7.9 0.7 0.7 0.4 0.5 41.8 2.1 23.7 8.4 7.6
City of Johannesburg
29.4 43.5 23.6 22.0 15.4 44.9 71.4 55.6 62.7 60.3

49
Years District
2002 2003 2004 2005 2006 2007 2008 2009 2010 2011
City of Tshwane 58.3 51.4 71.3 71.0 82.1 7.8 21.4 18.3 26.5 29.8 Source: Calculated from Quantec Easydata
The shares of district citrus exports to the total Western Cape provincial citrus exports are presented in Table 11. The leading citrus export districts in the Western Cape in 2011 were the City of Cape Town (75.4%) and the Cape Winelands (17.2%). The West Coast, Overberg and Eden districts followed at 7.1%, 0.3% and 0.1% respectively. Table 11: Share of districts’ citrus exports to total Western Cape provincial citrus exports (%), 2002 - 2011 Years District
2002 2003 2004 2005 2006 2007 2008 2009 2010 2011
Western Cape 100.0 100.0 100.0 100.0 100.0 100.0 100.0 100.0 100.0 100.0
City of Cape Town 78.3 76.3 75.4 73.7 71.5 77.6 72.0 72.0 75.8 75.4
West Coast 4.5 4.6 6.5 6.2 8.6 6.8 9.0 9.2 7.3 7.1
Cape Winelands 16.3 17.4 16.7 19.6 19.3 15.4 18.8 18.5 16.5 17.2
Overberg 0.8 1.4 1.3 0.3 0.4 0.2 0.2 0.3 0.3 0.3
Eden 0.1 0.3 0.1 0.2 0.1 0.0 0.0 0.1 0.1 0.1 Source: Calculated from Quantec Easydata
2.12 Imports South Africa is a net exporter of all citrus products. As will be illustrated in the subsections that follow, South Africa annually imports relatively little citrus products from the rest of the world. 2.12.1 Orange During 2011, South Africa imported a total volume of 808 tons of oranges worth US$308 thousands. Of the total tonnages imported in 2011, 53% (429 tons) came from Zimbabwe, 19% (152 tons) from Spain, 13% (107 tons) from Israel while the remaining 5% (48 tons) came from Egypt. South Africa’s imports of oranges in 2011 represented 0.01% of world orange imports and its ranking in the world was number 125. 2.12.2 Grapefruit A total volume of 645 tons with a value of US$326 thousands was imported by South Africa in 2011. Israel contributed 36% (234 tons) to total South African grapefruit imports in 2011. Another major source of South Africa’s grapefruit imports in 2011 was Zimbabwe. The country accounted for 33% (210 tons) to total South African imports of grapefruits during the same year. Spain also exported 138 tons (21%) to South African in 2011. During 2011 South Africa’s imports of grapefruits represented 0.03% of world grapefruit imports and its ranking in the world was number 62.

50
2.12.3 Lemons and limes South Africa imported a total volume of 235 tons of lemons and limes worth US$61 thousands in 2011. Of the total imported volume, 154 tons (65%) came from Zimbabwe, 79 tons (34%) came from El Salvador, while 2 tons came from Egypt. In 2011, South Africa’s imports of lemons and limes represented 0.00% of world imports and its ranking in the world was 114. 2.12.4 Soft citrus During 2011, South Africa imported a total volume of 846 tons of soft citrus valued at US$1 028 thousands. 68% (574 tons) came from Israel while the remaining 272 tons (32%). South Africa’s imports of soft citrus represented 0.02% of world soft citrus imports and its ranking in the world was number 76. 2.13 Processing The volumes of citrus available for processing in South Africa fluctuate yearly, depending on the crop size and the percentages of exportable fruit. In 2009/10, the processing industries absorbed approximately 25% (555 189 tons) of all citrus production (2 230 187 tons). That represents direct purchases from growers and quantities of citrus purchased from the NFPMs. The quantities of citrus purchased for processing are presented in Figure 52.
Source: CGA, 2012
It is clear from Figure 52 that oranges constitute the majority of citrus purchased for processing. In terms of the total citrus purchased for processing in 2010/11, oranges constituted 49%, followed by grapefruit and
270607
16212
79204
189166
0
50000
100000
150000
200000
250000
300000
350000
Vo
lum
e in
To
ns
Years
Figure 52: Citrus products purchased for processing, 2002 to 2011
Oranges Soft citrus Lemons and limes Grapefruit
51
lemons and limes at 34% and 14% respectively. Most citrus products processed are converted into juice and can be presented in different forms such as frozen, concentrate and freshly-squeezed juice. 2.13.1 Orange Oranges are commonly peeled and eaten fresh, or squeezed for juice. It has a thick bitter rind that is usually discarded, but can be processed into animal feed by removing water, using pressure and heat. It is also used in certain recipes as flavouring or a garnish. The outer most layer of the rind is grated or thinly veneered with a tool called a zester, to produce orange zest, popular in cooking because it has a flavour similar to the fleshy inner part of the orange. The white part of the rind called the pericarp with the pith, is a source of pectin and has nearly the same amount of vitamin C as the flesh. Products made from the orange include:
Orange juice,
Sweet orange oil, a by-product of the juice industry is produced by pressing the peel.
Orange blossom. The petals of orange blossoms can be made into delicately citrus scented version of rosewater. Orange blossom water is a common part of the Middle Eastern cuisine. Fallen blossoms can be dried and be used to make tea.
Orange blossom honey or citrus honey is produced by putting beehives in the citrus groves during bloom, which also pollinates seeded citrus varieties. Orange blossom honey is highly priced, and tastes much like orange.
Marmalade. All parts of the orange are used to make marmalade: the pith and the pips are separated and typically placed in a muslin bag where they are boiled in the juice (and sliced peel) to extract their pectin, aiding the setting process.
Orange peel is used by gardeners as a slug repellent. 2.13.2 Lemon Slices of lemon are served as a garnish on fish or meat or with iced or hot tea, to be squeezed for the flavourful juice. Lemon soup is made by adding slices of lemon to dry bread roll that has been sautéed in shortening until soft and then sieved. Sugar and a cup of wine are added and the mixture brought to a boil, and then served. Lemon juice, fresh, canned, concentrated and frozen, or dehydrated and powdered, is primarily used for lemonade, in carbonated beverages, or other drinks. It is also used for making pies and tarts, as a flavouring for cakes, cookies, cake icings, puddings, sherbet, confectionery, preserves and pharmaceutical products. A few drops of lemon juice, added to cream before whipping, gives stability to the whipped cream. Lemon peel can be candied at home and is preserved in brine and supplied to manufacturers of confectionery and baked goods. It is the source of lemon oil, pectin and citric acid. Lemon oil, often with terpenes and sesquiterpenes removed, is added to frozen or otherwise processed lemon juice to enrich the flavour. It is much employed as flavouring for hard candies.

52
2.13.3 Lime Lime fruit particularly their juices are used in beverages, such as limeade (akin to lemonade). Alcoholic beverages prepared with lime include cocktails such as gin and tonic, margarita and Cuba libre, as well a many drinks that may be garnished with thins slice of the fruit or corkscrew strip of the peel (twist). 2.13.4 Grapefruit Grapefruit is customarily a breakfast fruit, chilled, cut in half, the sections loosened from the peel and each other by a special curved knife, and the pulp spooned from the "half-shell". Some consumers sweeten it with white or brown sugar, or a bit of honey. Some add cinnamon, nutmeg or cloves. As an appetizer before dinner, grapefruit halves may be similarly sweetened, lightly broiled, and served hot, often topped with a maraschino cherry. The sections are commonly used in fruit cups or fruit salads, in gelatines or puddings and tarts. They are commercially canned in syrup. In countries like Australia, grapefruit is commercially processed as marmalade. It may also be made into jelly. The juice is marketed as a beverage fresh, canned, or dehydrated as powder, or concentrated and frozen. It can be made into excellent vinegar or carefully fermented as wine. Grapefruit peel is candied and is an important source of pectin for the preservation of other fruits. The peel oil, expressed or distilled, is commonly employed in soft-drink flavouring, after the removal of 50% of the monoterpenes. The main ingredient in the outer peel oil is nookatone. Extracted nookatone, added to grapefruit juice powder, enhances the flavour of the reconstituted juice. Naringin, extracted from the inner peel (albedo), is used as a bitter in "tonic" beverages, bitter chocolate, ice cream and ices. It is chemically converted into a sweetener about 1,500 times sweeter than sugar. After the extraction of naringin, the albedo can be reprocessed to recover pectin. Grapefruit seed oil is dark and exceedingly bitter but, bleached and refined, it is pale-yellow, blend, much like olive oil in flavour, and can be used similarly. Because it is an unsaturated fat, its production has greatly increased since 1960. 3. MARKET INTELIGENCE 3.1 Competitiveness of South African citrus products Competitiveness is described as an industry’s capacity to create superior value for its customers and improved profits for the stakeholders in the value chain. The driving force in sustaining a competitive position is productivity that is output efficiency in relation to specific inputs with regard to human, capital and natural resources. In 2011, South African orange exports represented 12.39% of world exports and its ranking in the world exports was number 3. South African lemon and lime exports represented 6.62% of world exports and its ranking on the world exports was number 7. South African grapefruit exports represented 13.32% of world exports and its ranking on the world exports was number 3. South African naartjie exports represented 2.39% of world exports and its ranking on the world exports was number 6.

53
As depicted on Figure 53 below, South African orange exports are growing faster than the world imports in Bangladesh, Portugal, Kuwait, China, and Saudi Arabia markets. South Africa’s performance in those markets can be regarded as gains in dynamic markets. South African orange exports are growing while the world imports are declining in France, Germany, Netherlands, United States of America, United Kingdom, Italy, and Canada markets. South Africa’s performance in those markets can be regarded as gains in declining markets and should be viewed as achievement in adversity. South African orange exports have declined faster than world imports in Spain and Singapore markets. South Africa’s performance into those markets can be regarded as losses in declining markets. South African orange exports are declining while the world imports are growing in the United Arab Emirates, Ukraine and Malaysia markets. South Africa’s performance in those markets can be regarded as losses in dynamic markets and should be viewed as an underachievement.
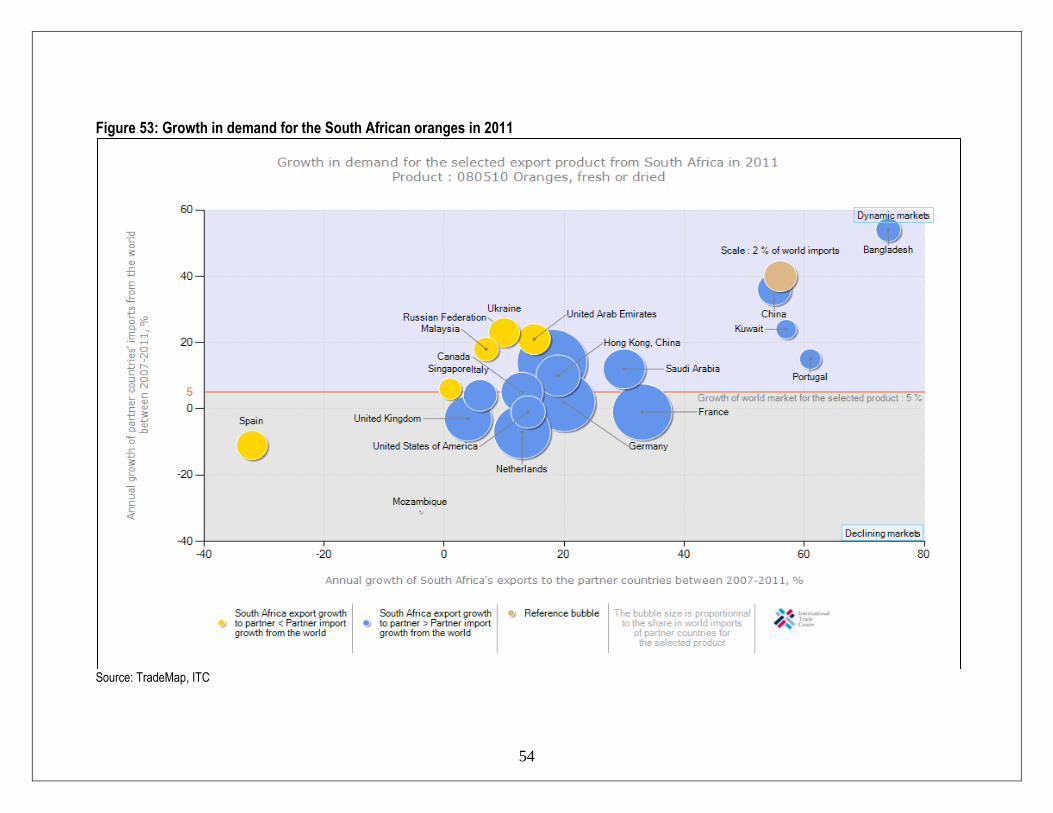
54
Figure 53: Growth in demand for the South African oranges in 2011
Source: TradeMap, ITC
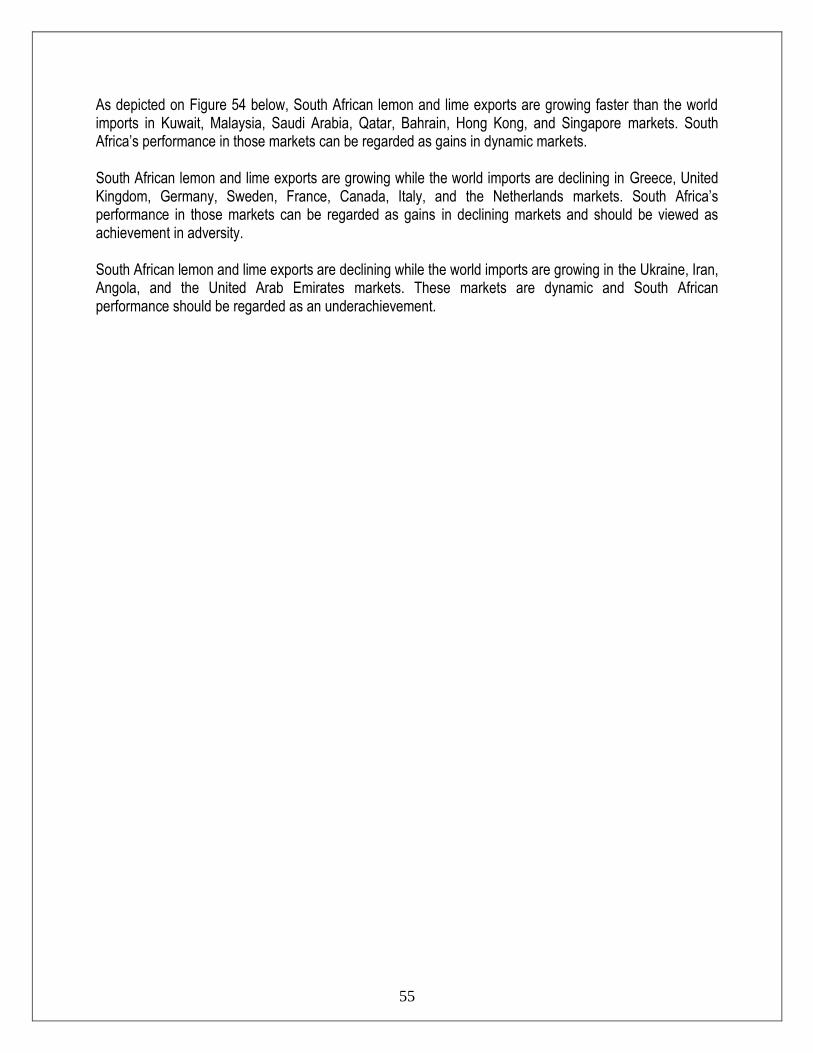
55
As depicted on Figure 54 below, South African lemon and lime exports are growing faster than the world imports in Kuwait, Malaysia, Saudi Arabia, Qatar, Bahrain, Hong Kong, and Singapore markets. South Africa’s performance in those markets can be regarded as gains in dynamic markets. South African lemon and lime exports are growing while the world imports are declining in Greece, United Kingdom, Germany, Sweden, France, Canada, Italy, and the Netherlands markets. South Africa’s performance in those markets can be regarded as gains in declining markets and should be viewed as achievement in adversity. South African lemon and lime exports are declining while the world imports are growing in the Ukraine, Iran, Angola, and the United Arab Emirates markets. These markets are dynamic and South African performance should be regarded as an underachievement.
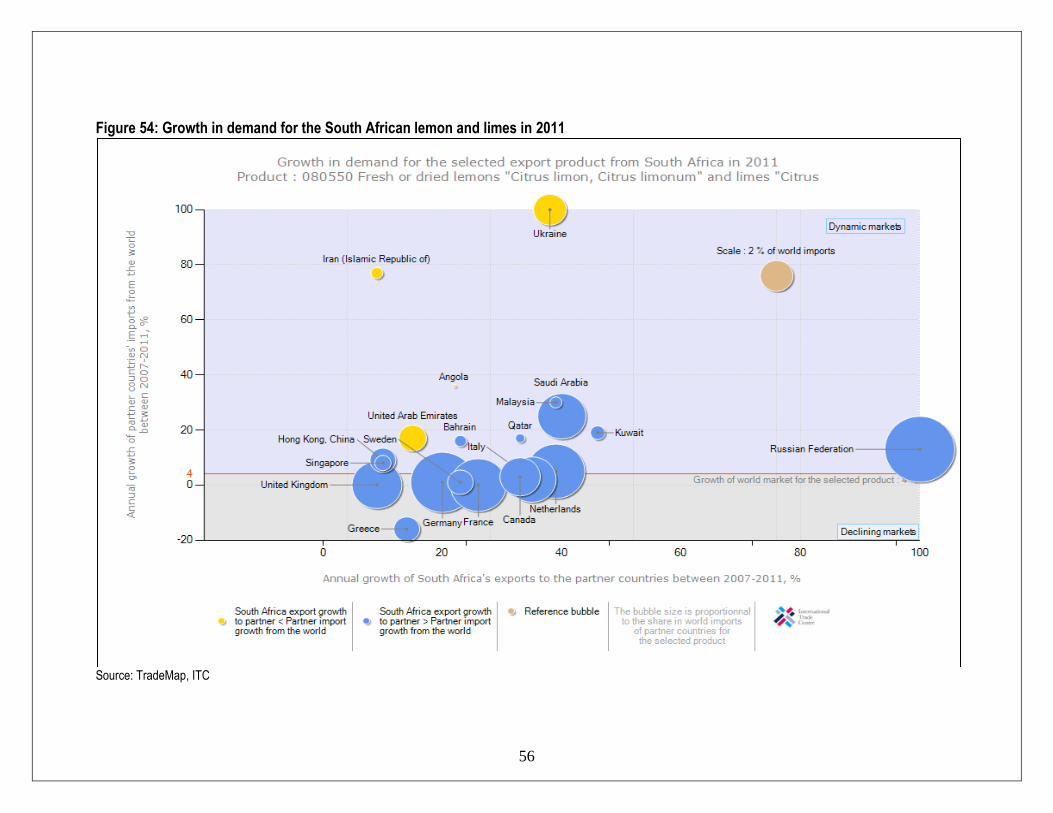
56
Figure 54: Growth in demand for the South African lemon and limes in 2011
Source: TradeMap, ITC
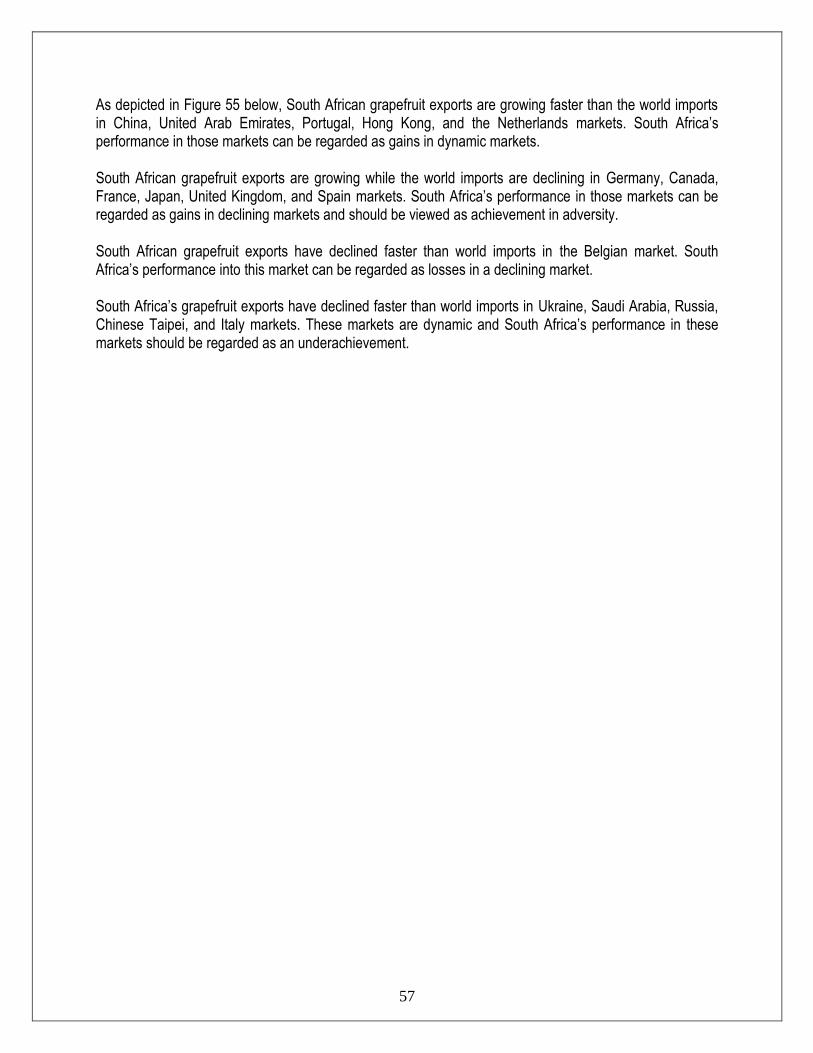
57
As depicted in Figure 55 below, South African grapefruit exports are growing faster than the world imports in China, United Arab Emirates, Portugal, Hong Kong, and the Netherlands markets. South Africa’s performance in those markets can be regarded as gains in dynamic markets. South African grapefruit exports are growing while the world imports are declining in Germany, Canada, France, Japan, United Kingdom, and Spain markets. South Africa’s performance in those markets can be regarded as gains in declining markets and should be viewed as achievement in adversity. South African grapefruit exports have declined faster than world imports in the Belgian market. South Africa’s performance into this market can be regarded as losses in a declining market. South Africa’s grapefruit exports have declined faster than world imports in Ukraine, Saudi Arabia, Russia, Chinese Taipei, and Italy markets. These markets are dynamic and South Africa’s performance in these markets should be regarded as an underachievement.
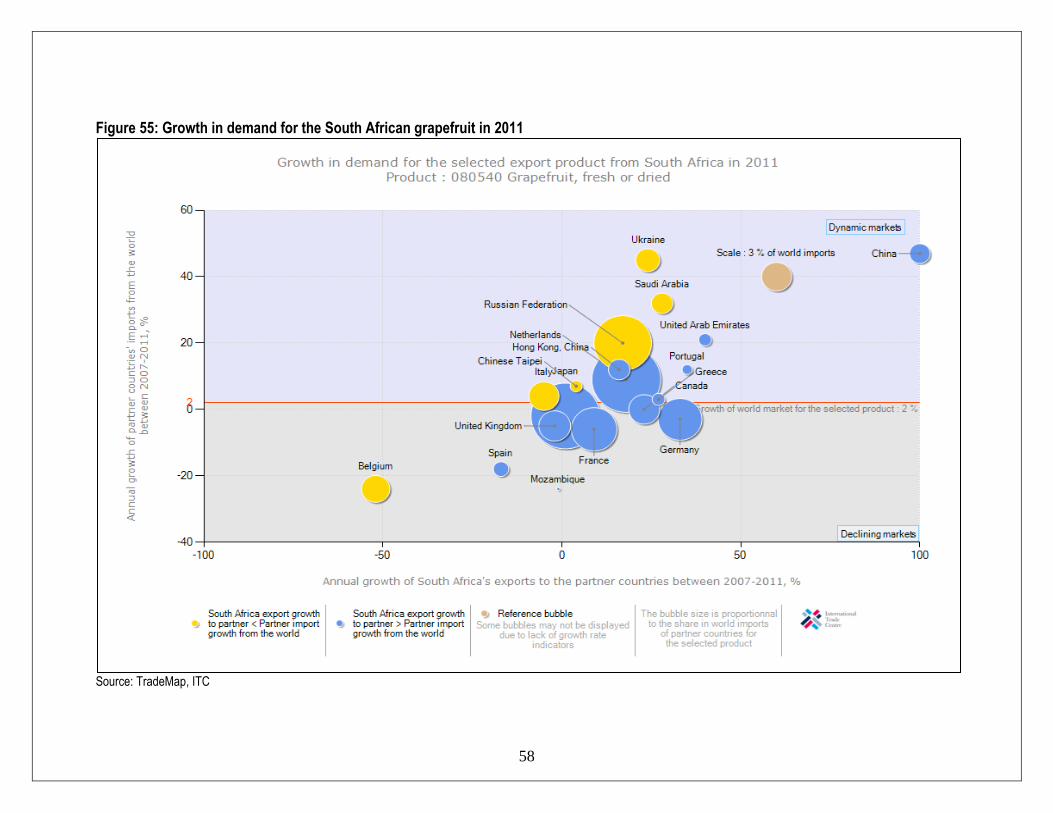
58
Figure 55: Growth in demand for the South African grapefruit in 2011
Source: TradeMap, ITC
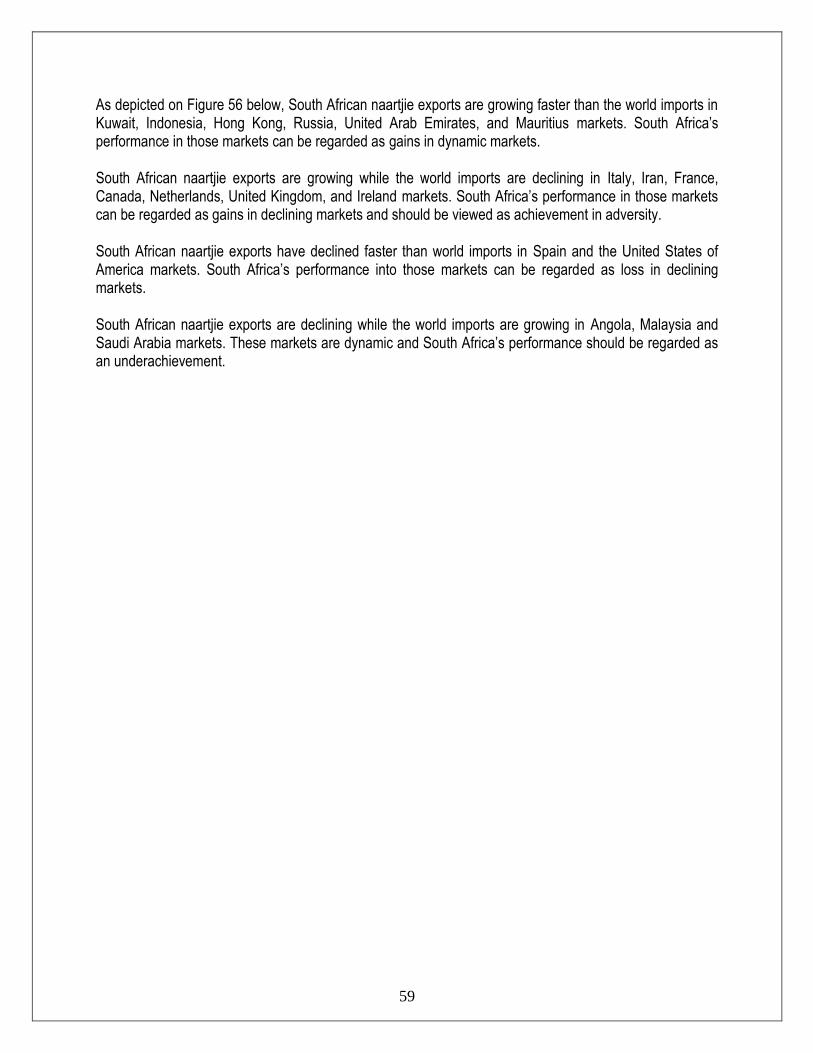
59
As depicted on Figure 56 below, South African naartjie exports are growing faster than the world imports in Kuwait, Indonesia, Hong Kong, Russia, United Arab Emirates, and Mauritius markets. South Africa’s performance in those markets can be regarded as gains in dynamic markets. South African naartjie exports are growing while the world imports are declining in Italy, Iran, France, Canada, Netherlands, United Kingdom, and Ireland markets. South Africa’s performance in those markets can be regarded as gains in declining markets and should be viewed as achievement in adversity. South African naartjie exports have declined faster than world imports in Spain and the United States of America markets. South Africa’s performance into those markets can be regarded as loss in declining markets. South African naartjie exports are declining while the world imports are growing in Angola, Malaysia and Saudi Arabia markets. These markets are dynamic and South Africa’s performance should be regarded as an underachievement.
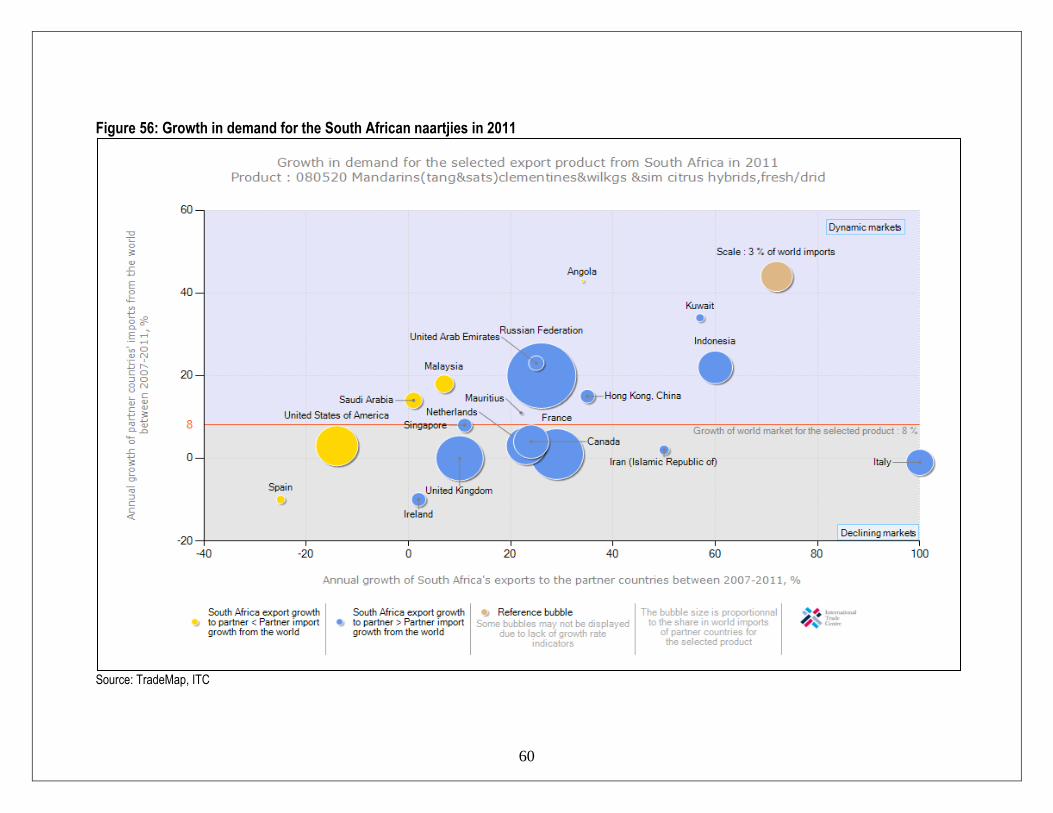
60
Figure 56: Growth in demand for the South African naartjies in 2011
Source: TradeMap, ITC

61
Figure 57 below illustrates prospects for market diversification by South African exporters of oranges in 2011. Netherlands, Russia, United Arab Emirates, and Saudi Arabia hold a bigger market share of South African orange exports. In terms of market size, Russia was the largest orange importer in 2011 with just over US$513 million (568 339 tons) worth of orange imports, or roughly 10.3% of the world orange market. Second was Germany with just over US$401 million (482 948 tons) worth of orange imports, or roughly 8.1% market share followed by France with just over US$367 million (410 600 tons) worth of orange imports, or roughly 7.4% market share. Whilst three countries dominate world orange imports, it is interesting to note that countries like Bangladesh, together with China and Kuwait have experienced higher annual growth rates in terms of orange imports from 2007 – 2011. In terms of growth in value, Bangladesh experienced an annual growth rate of 54%. Second was China with 36% annual growth rate followed by Kuwait at 24%. It is important to note that growth by all these mentioned countries has been from a relatively low base. These countries represent possible lucrative markets for South African orange producers. It is also important to note that orange imports from the world to countries such as the Mozambique and Spain have declined from 2007 – 2011 and as a result those countries recorded negative growth rates in orange imports.

62
Figure 57: South African oranges’ prospect for market diversification in 2011
Source: TradeMap, ITC

63
Figure 58 below illustrates prospects for market diversification by South African exporters of lemon and limes in 2011. Saudi Arabia, Russia, United Arab Emirates, Netherlands, and United Kingdom hold a bigger market share of South African lemon and lime exports. In terms of market size, USA was the largest lemon and lime importer in 2011 with just over US$261 million (419 935 tons) worth of lemon and lime imports, or roughly 11.9% of the world lemon and lime market. Second was Russia with just over US$220 million (226 621 tons) worth of lemon and lime imports, or roughly 10.1% market share followed by Germany with just over US$185 million worth of lemon and lime imports, or roughly 8.5% market share. Whilst three countries dominate world lemon and lime imports, it is interesting to note that countries like Ukraine, together with Iran and Angola have experienced higher annual growth rate in terms of lemon and lime imports from 2007 – 2011. Ukraine experienced an annual growth rate of 202%. Second was Iran at 77% annual growth rate followed by Angola at 36 percent. It is important to note that growth by all these mentioned countries has been off a relatively low base. These countries represent possible lucrative markets for South African lemon and lime producers. It is also important to note from Figure 58 that lemon and lime imports from the world to countries such as Greece have declined from 2007 – 2011 and as a result those countries recorded negative growth rates in lemon and lime imports.
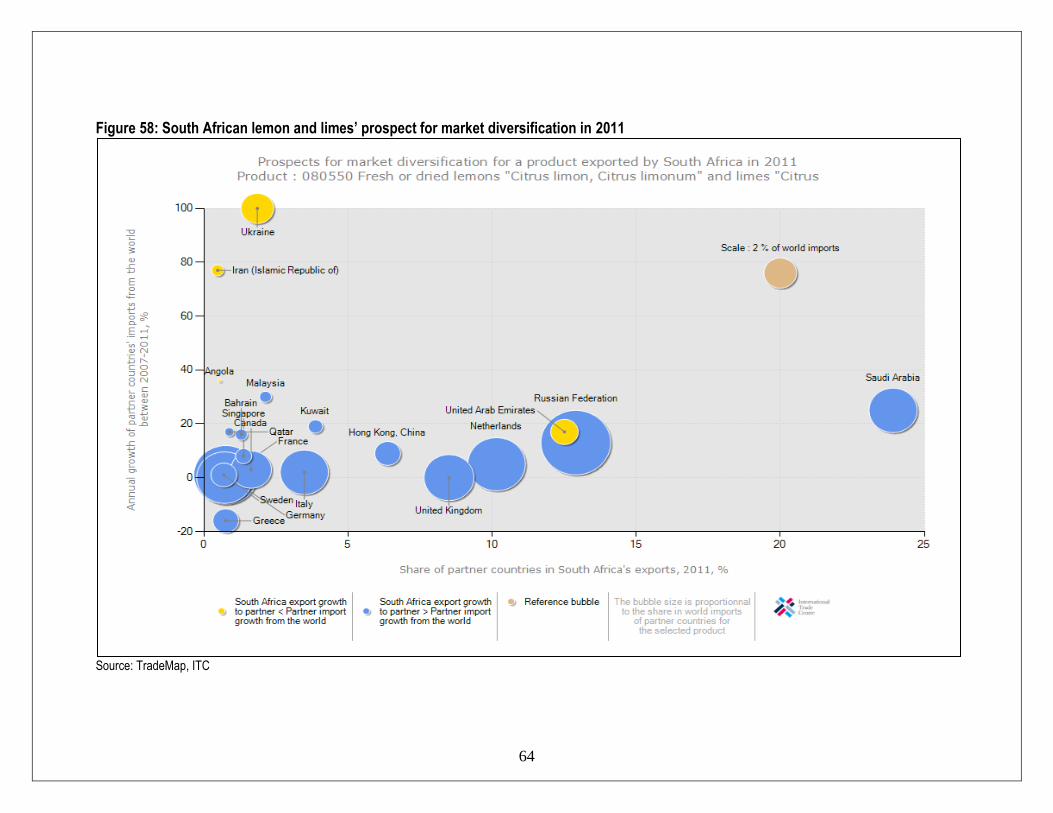
64
Figure 58: South African lemon and limes’ prospect for market diversification in 2011
Source: TradeMap, ITC

65
Figure 59 below illustrates prospects for market diversification by South African exporters of grapefruit in 2011. Japan, Netherlands and Russia hold a bigger market share of South African grapefruit exports. In terms of market size, the Netherlands was the largest grapefruit importer in 2011 with just over US$177 million (172 812 tons) worth of grapefruit imports, or roughly 17.4% of the world grapefruit market. Second was Japan with just over US$177 million (160 004 tons) worth of grapefruit imports, or roughly 17.4% market share followed by Russia with just over US$120 million (122 478 tons) worth of grapefruit imports, or roughly 11.8% market share. Whilst three countries dominate world grapefruit imports, it is interesting to note that countries like China, together with Ukraine and Saudi Arabia have experienced higher annual growth rate in terms of grapefruit imports from 2007 – 2011. China experienced an annual growth rate of 47%. Second was Ukraine with 45% annual growth rate followed by Saudi Arabia at 32 percent. It is important to note that growth by all these mentioned countries has been from a relatively low base. These countries represent possible lucrative markets for South African grapefruit producers. It is also important to note that grapefruit imports from the world to countries such as the Mozambique, Belgium, Spain, France, Germany, and the United Kingdom have declined from 2007 – 2011 and as a result those countries recorded negative growth rates in grapefruit imports.

66
Figure 59: South African grapefruits’ prospect for market diversification in 2011
Source: TradeMap, ITC

67
Figure 60 below illustrates prospects for market diversification by South African exporters of naartjies in 2011. The United Kingdom, Netherlands and Russia hold a bigger market share of South African naartjie exports. In terms of market size, Russia was the largest naartjie importer in 2011 with just over $716 million (739 504 tons) worth of naartjie imports, or roughly 16.2% of the world naartjie market. Second was Germany with just over $435 million (382 204 tons) worth of naartjie imports, or roughly 9.8% market share followed by France with just over $418 million (335 685 tons) worth of naartjie imports, or roughly 9.5% market share. Whilst three countries dominate world lemon and lime imports, it is interesting to note that countries like Angola, together with Kuwait and Indonesia have experienced higher annual growth rates in terms of naartjie imports from 2007 – 2011. Angola experienced an annual growth rate of 43%. Second was Kuwait with 34% annual growth rate followed by Indonesia at 22 percent. It is important to note that growth by all these mentioned countries has been from a relatively low base. These countries represent possible lucrative markets for South African naartjie producers. It is also important to note that naartjie imports from the world to countries such as Spain and Ireland have declined from 2007 – 2011 and as a result those countries recorded negative growth rates in naartjie imports.
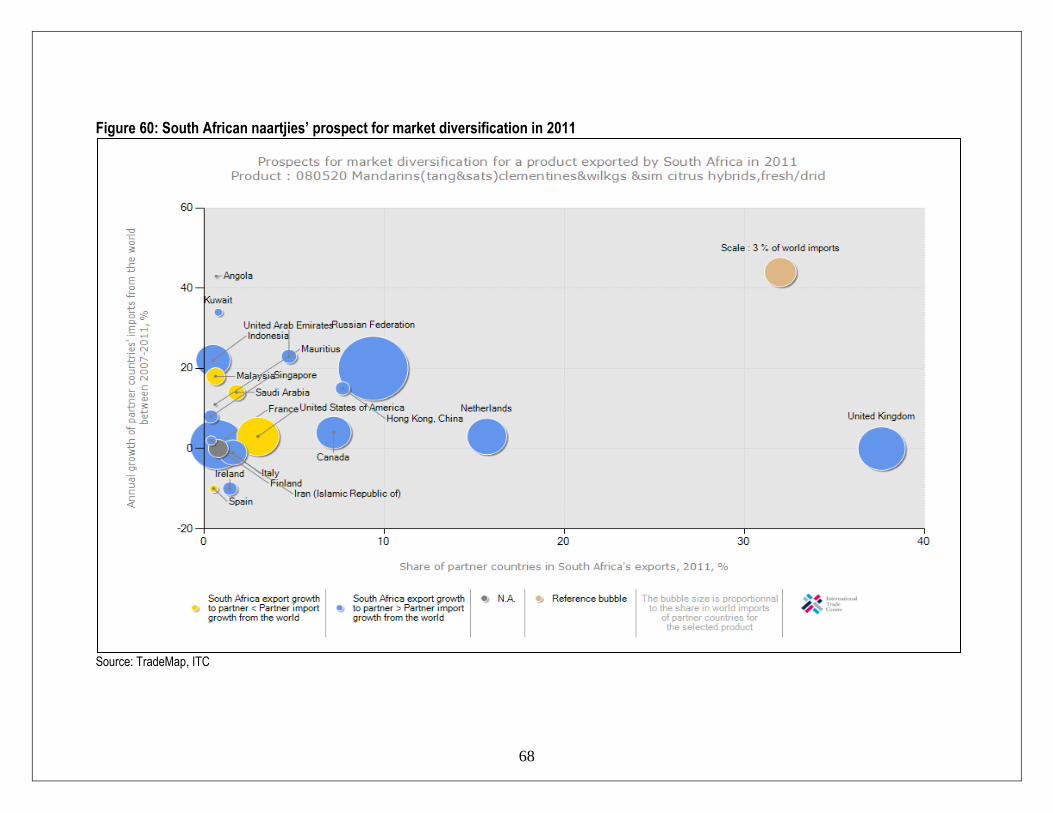
68
Figure 60: South African naartjies’ prospect for market diversification in 2011
Source: TradeMap, ITC
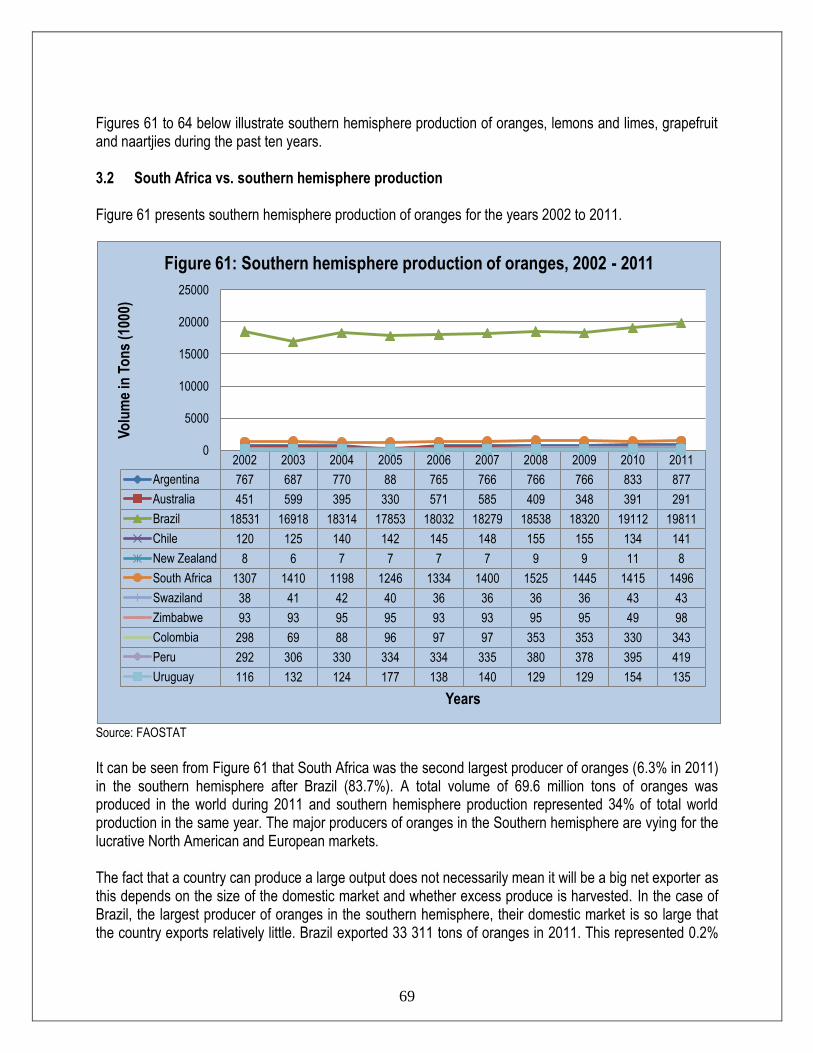
69
Figures 61 to 64 below illustrate southern hemisphere production of oranges, lemons and limes, grapefruit and naartjies during the past ten years.
3.2 South Africa vs. southern hemisphere production Figure 61 presents southern hemisphere production of oranges for the years 2002 to 2011.
Source: FAOSTAT
It can be seen from Figure 61 that South Africa was the second largest producer of oranges (6.3% in 2011) in the southern hemisphere after Brazil (83.7%). A total volume of 69.6 million tons of oranges was produced in the world during 2011 and southern hemisphere production represented 34% of total world production in the same year. The major producers of oranges in the Southern hemisphere are vying for the lucrative North American and European markets. The fact that a country can produce a large output does not necessarily mean it will be a big net exporter as this depends on the size of the domestic market and whether excess produce is harvested. In the case of Brazil, the largest producer of oranges in the southern hemisphere, their domestic market is so large that the country exports relatively little. Brazil exported 33 311 tons of oranges in 2011. This represented 0.2%
2002 2003 2004 2005 2006 2007 2008 2009 2010 2011
Argentina 767 687 770 88 765 766 766 766 833 877
Australia 451 599 395 330 571 585 409 348 391 291
Brazil 18531 16918 18314 17853 18032 18279 18538 18320 19112 19811
Chile 120 125 140 142 145 148 155 155 134 141
New Zealand 8 6 7 7 7 7 9 9 11 8
South Africa 1307 1410 1198 1246 1334 1400 1525 1445 1415 1496
Swaziland 38 41 42 40 36 36 36 36 43 43
Zimbabwe 93 93 95 95 93 93 95 95 49 98
Colombia 298 69 88 96 97 97 353 353 330 343
Peru 292 306 330 334 334 335 380 378 395 419
Uruguay 116 132 124 177 138 140 129 129 154 135
0
5000
10000
15000
20000
25000
Vo
lum
e in
To
ns
(100
0)
Years
Figure 61: Southern hemisphere production of oranges, 2002 - 2011
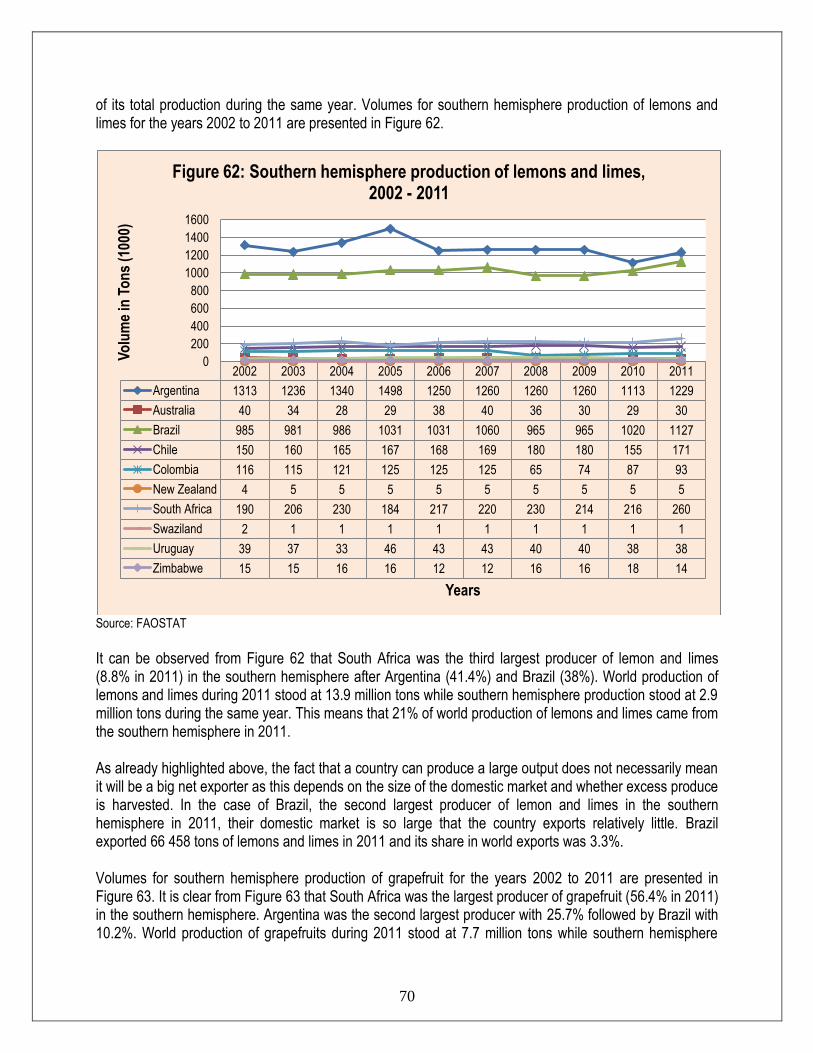
70
of its total production during the same year. Volumes for southern hemisphere production of lemons and limes for the years 2002 to 2011 are presented in Figure 62.
Source: FAOSTAT
It can be observed from Figure 62 that South Africa was the third largest producer of lemon and limes (8.8% in 2011) in the southern hemisphere after Argentina (41.4%) and Brazil (38%). World production of lemons and limes during 2011 stood at 13.9 million tons while southern hemisphere production stood at 2.9 million tons during the same year. This means that 21% of world production of lemons and limes came from the southern hemisphere in 2011. As already highlighted above, the fact that a country can produce a large output does not necessarily mean it will be a big net exporter as this depends on the size of the domestic market and whether excess produce is harvested. In the case of Brazil, the second largest producer of lemon and limes in the southern hemisphere in 2011, their domestic market is so large that the country exports relatively little. Brazil exported 66 458 tons of lemons and limes in 2011 and its share in world exports was 3.3%. Volumes for southern hemisphere production of grapefruit for the years 2002 to 2011 are presented in Figure 63. It is clear from Figure 63 that South Africa was the largest producer of grapefruit (56.4% in 2011) in the southern hemisphere. Argentina was the second largest producer with 25.7% followed by Brazil with 10.2%. World production of grapefruits during 2011 stood at 7.7 million tons while southern hemisphere
2002 2003 2004 2005 2006 2007 2008 2009 2010 2011
Argentina 1313 1236 1340 1498 1250 1260 1260 1260 1113 1229
Australia 40 34 28 29 38 40 36 30 29 30
Brazil 985 981 986 1031 1031 1060 965 965 1020 1127
Chile 150 160 165 167 168 169 180 180 155 171
Colombia 116 115 121 125 125 125 65 74 87 93
New Zealand 4 5 5 5 5 5 5 5 5 5
South Africa 190 206 230 184 217 220 230 214 216 260
Swaziland 2 1 1 1 1 1 1 1 1 1
Uruguay 39 37 33 46 43 43 40 40 38 38
Zimbabwe 15 15 16 16 12 12 16 16 18 14
0
200
400
600
800
1000
1200
1400
1600
Vo
lum
e in
To
ns
(100
0)
Years
Figure 62: Southern hemisphere production of lemons and limes, 2002 - 2011

71
production stood at 0.7 million tons during the same year. This means that 9% of world production of lemons and limes came from the southern hemisphere in 2011.
Source: FAOSTAT
Volumes of southern hemisphere production of naartjies for the past ten years are presented in Figure 64. It can be seen from Figure 62 that South Africa was the fourth largest producer of naartjies (7.4% in 2011) in the southern hemisphere after Brazil (50.2%), Argentina (20%) and Peru (11.8%). The fact that a country can produce a large output does not necessarily mean it will be a big net exporter as this depends on the size of the domestic market and whether excess produce is harvested. In the case of Brazil, the largest producer of naartjies in the southern hemisphere, their domestic market is so large that the country exports relatively little. Brazil exported 921 tons of naartjies in 2011 and its share in world exports was 0.0%. Total world production of naartjies during 2011 stood at 24.6 million tons while southern hemisphere production stood at 2 million tons during the same period.
2002 2003 2004 2005 2006 2007 2008 2009 2010 2011
Argentina 205 184 177 273 175 176 180 180 189 189
Australia 14 18 15 20 11 12 10 11 10 9
Brazil 67 67 68 68 71 72 72 72 72 75
New Zealand 2 2 2 1 1 1 1 1 1 1
South Africa 286 312 288 363 415 430 341 370 343 416
Swaziland 38 41 41 40 37 37 37 37 37 37
Zimbabwe 8 8 8 8 8 8 8 8 8 9
0 50
100 150 200 250 300 350 400 450 500
Vo
lum
e in
To
ns
(100
0)
Years
Figure 63: Southern hemisphere production of grapefruit, 2002 - 2011
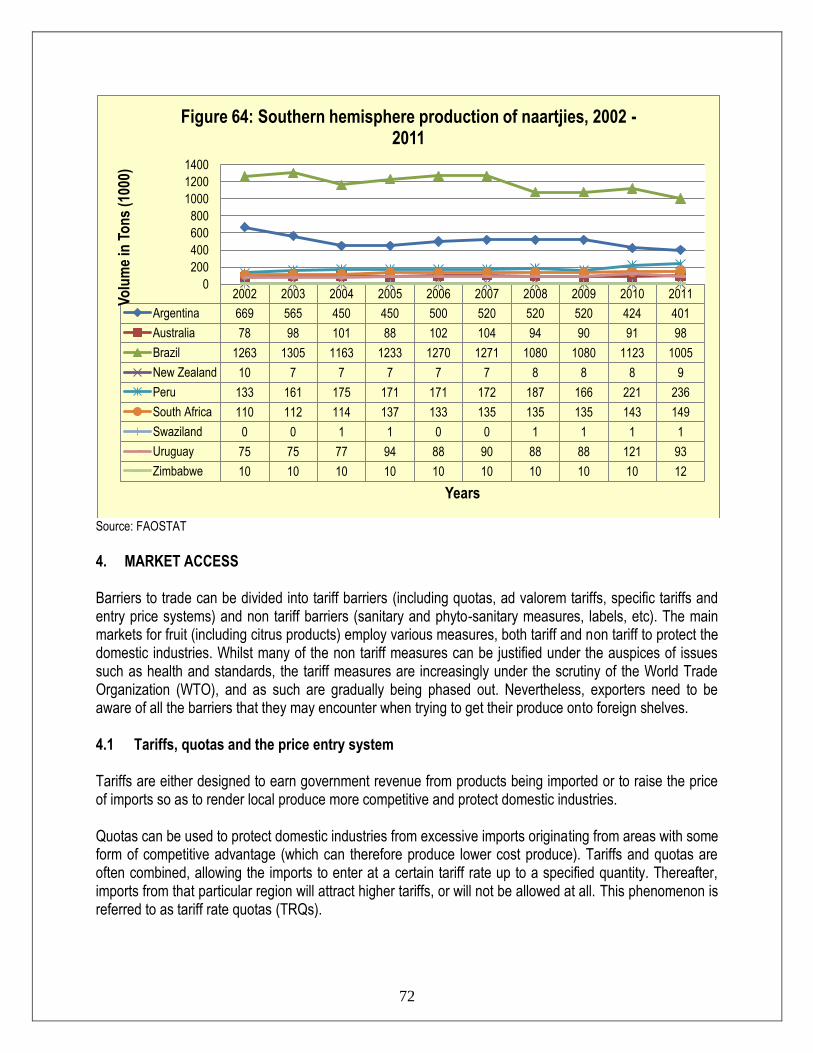
72
Source: FAOSTAT
4. MARKET ACCESS Barriers to trade can be divided into tariff barriers (including quotas, ad valorem tariffs, specific tariffs and entry price systems) and non tariff barriers (sanitary and phyto-sanitary measures, labels, etc). The main markets for fruit (including citrus products) employ various measures, both tariff and non tariff to protect the domestic industries. Whilst many of the non tariff measures can be justified under the auspices of issues such as health and standards, the tariff measures are increasingly under the scrutiny of the World Trade Organization (WTO), and as such are gradually being phased out. Nevertheless, exporters need to be aware of all the barriers that they may encounter when trying to get their produce onto foreign shelves. 4.1 Tariffs, quotas and the price entry system Tariffs are either designed to earn government revenue from products being imported or to raise the price of imports so as to render local produce more competitive and protect domestic industries. Quotas can be used to protect domestic industries from excessive imports originating from areas with some form of competitive advantage (which can therefore produce lower cost produce). Tariffs and quotas are often combined, allowing the imports to enter at a certain tariff rate up to a specified quantity. Thereafter, imports from that particular region will attract higher tariffs, or will not be allowed at all. This phenomenon is referred to as tariff rate quotas (TRQs).
2002 2003 2004 2005 2006 2007 2008 2009 2010 2011
Argentina 669 565 450 450 500 520 520 520 424 401
Australia 78 98 101 88 102 104 94 90 91 98
Brazil 1263 1305 1163 1233 1270 1271 1080 1080 1123 1005
New Zealand 10 7 7 7 7 7 8 8 8 9
Peru 133 161 175 171 171 172 187 166 221 236
South Africa 110 112 114 137 133 135 135 135 143 149
Swaziland 0 0 1 1 0 0 1 1 1 1
Uruguay 75 75 77 94 88 90 88 88 121 93
Zimbabwe 10 10 10 10 10 10 10 10 10 12
0
200
400
600
800
1000
1200
1400
Vo
lum
e in
To
ns
(100
0)
Years
Figure 64: Southern hemisphere production of naartjies, 2002 - 2011
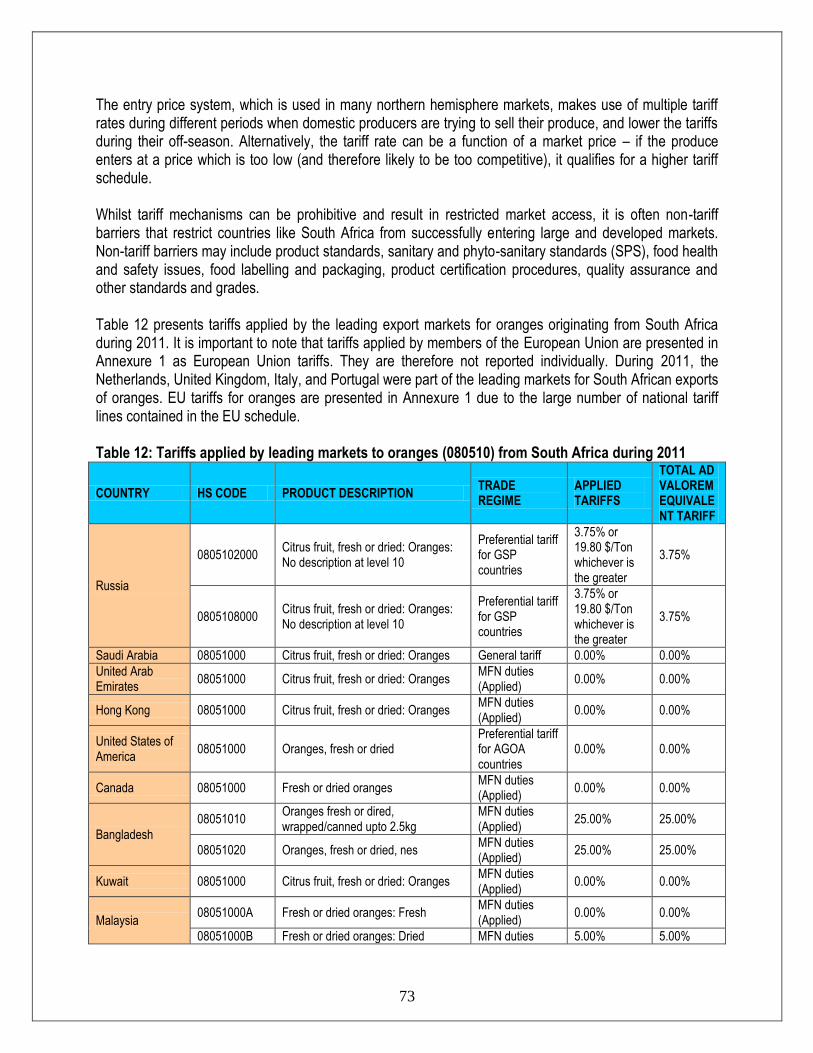
73
The entry price system, which is used in many northern hemisphere markets, makes use of multiple tariff rates during different periods when domestic producers are trying to sell their produce, and lower the tariffs during their off-season. Alternatively, the tariff rate can be a function of a market price – if the produce enters at a price which is too low (and therefore likely to be too competitive), it qualifies for a higher tariff schedule. Whilst tariff mechanisms can be prohibitive and result in restricted market access, it is often non-tariff barriers that restrict countries like South Africa from successfully entering large and developed markets. Non-tariff barriers may include product standards, sanitary and phyto-sanitary standards (SPS), food health and safety issues, food labelling and packaging, product certification procedures, quality assurance and other standards and grades. Table 12 presents tariffs applied by the leading export markets for oranges originating from South Africa during 2011. It is important to note that tariffs applied by members of the European Union are presented in Annexure 1 as European Union tariffs. They are therefore not reported individually. During 2011, the Netherlands, United Kingdom, Italy, and Portugal were part of the leading markets for South African exports of oranges. EU tariffs for oranges are presented in Annexure 1 due to the large number of national tariff lines contained in the EU schedule. Table 12: Tariffs applied by leading markets to oranges (080510) from South Africa during 2011
COUNTRY HS CODE PRODUCT DESCRIPTION TRADE REGIME
APPLIED TARIFFS
TOTAL AD VALOREM EQUIVALENT TARIFF
Russia
0805102000 Citrus fruit, fresh or dried: Oranges: No description at level 10
Preferential tariff for GSP countries
3.75% or 19.80 $/Ton whichever is the greater
3.75%
0805108000 Citrus fruit, fresh or dried: Oranges: No description at level 10
Preferential tariff for GSP countries
3.75% or 19.80 $/Ton whichever is the greater
3.75%
Saudi Arabia 08051000 Citrus fruit, fresh or dried: Oranges General tariff 0.00% 0.00%
United Arab Emirates
08051000 Citrus fruit, fresh or dried: Oranges MFN duties (Applied)
0.00% 0.00%
Hong Kong 08051000 Citrus fruit, fresh or dried: Oranges MFN duties (Applied)
0.00% 0.00%
United States of America
08051000 Oranges, fresh or dried Preferential tariff for AGOA countries
0.00% 0.00%
Canada 08051000 Fresh or dried oranges MFN duties (Applied)
0.00% 0.00%
Bangladesh
08051010 Oranges fresh or dired, wrapped/canned upto 2.5kg
MFN duties (Applied)
25.00% 25.00%
08051020 Oranges, fresh or dried, nes MFN duties (Applied)
25.00% 25.00%
Kuwait 08051000 Citrus fruit, fresh or dried: Oranges MFN duties (Applied)
0.00% 0.00%
Malaysia 08051000A Fresh or dried oranges: Fresh
MFN duties (Applied)
0.00% 0.00%
08051000B Fresh or dried oranges: Dried MFN duties 5.00% 5.00%
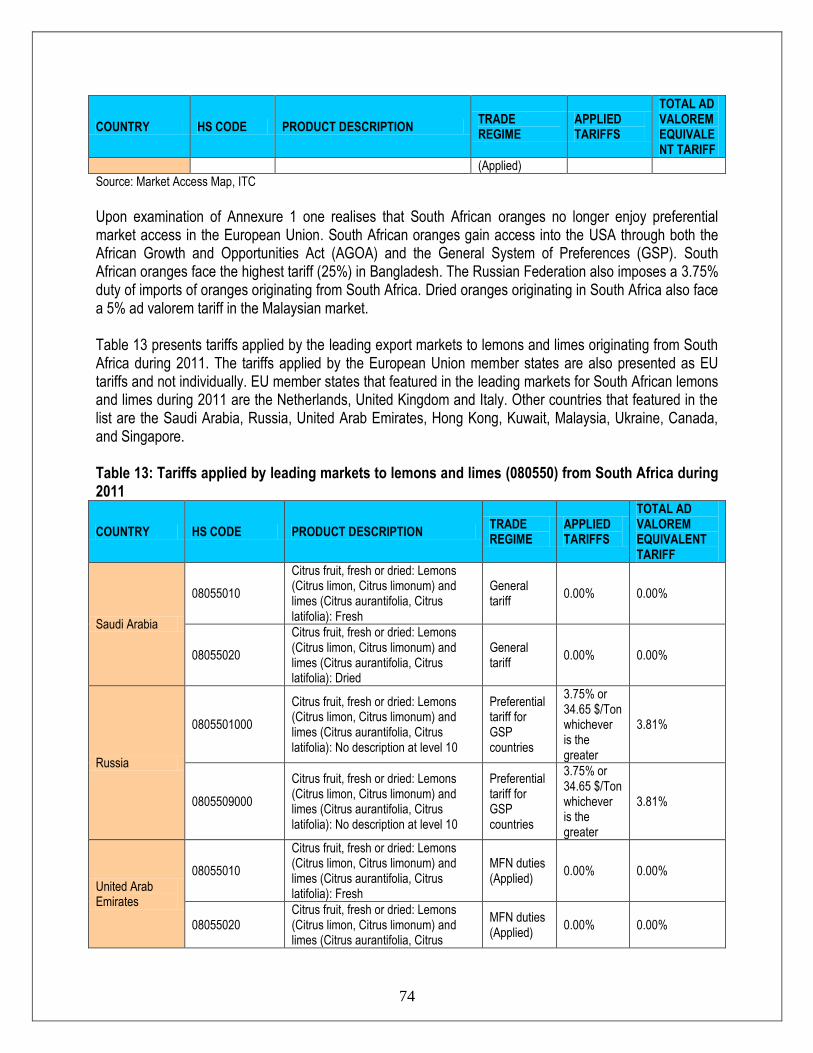
74
COUNTRY HS CODE PRODUCT DESCRIPTION TRADE REGIME
APPLIED TARIFFS
TOTAL AD VALOREM EQUIVALENT TARIFF
(Applied)
Source: Market Access Map, ITC
Upon examination of Annexure 1 one realises that South African oranges no longer enjoy preferential market access in the European Union. South African oranges gain access into the USA through both the African Growth and Opportunities Act (AGOA) and the General System of Preferences (GSP). South African oranges face the highest tariff (25%) in Bangladesh. The Russian Federation also imposes a 3.75% duty of imports of oranges originating from South Africa. Dried oranges originating in South Africa also face a 5% ad valorem tariff in the Malaysian market. Table 13 presents tariffs applied by the leading export markets to lemons and limes originating from South Africa during 2011. The tariffs applied by the European Union member states are also presented as EU tariffs and not individually. EU member states that featured in the leading markets for South African lemons and limes during 2011 are the Netherlands, United Kingdom and Italy. Other countries that featured in the list are the Saudi Arabia, Russia, United Arab Emirates, Hong Kong, Kuwait, Malaysia, Ukraine, Canada, and Singapore. Table 13: Tariffs applied by leading markets to lemons and limes (080550) from South Africa during 2011
COUNTRY HS CODE PRODUCT DESCRIPTION TRADE REGIME
APPLIED TARIFFS
TOTAL AD VALOREM EQUIVALENT TARIFF
Saudi Arabia
08055010
Citrus fruit, fresh or dried: Lemons (Citrus limon, Citrus limonum) and limes (Citrus aurantifolia, Citrus latifolia): Fresh
General tariff
0.00% 0.00%
08055020
Citrus fruit, fresh or dried: Lemons (Citrus limon, Citrus limonum) and limes (Citrus aurantifolia, Citrus latifolia): Dried
General tariff
0.00% 0.00%
Russia
0805501000
Citrus fruit, fresh or dried: Lemons (Citrus limon, Citrus limonum) and limes (Citrus aurantifolia, Citrus latifolia): No description at level 10
Preferential tariff for GSP countries
3.75% or 34.65 $/Ton whichever is the greater
3.81%
0805509000
Citrus fruit, fresh or dried: Lemons (Citrus limon, Citrus limonum) and limes (Citrus aurantifolia, Citrus latifolia): No description at level 10
Preferential tariff for GSP countries
3.75% or 34.65 $/Ton whichever is the greater
3.81%
United Arab Emirates
08055010
Citrus fruit, fresh or dried: Lemons (Citrus limon, Citrus limonum) and limes (Citrus aurantifolia, Citrus latifolia): Fresh
MFN duties (Applied)
0.00% 0.00%
08055020 Citrus fruit, fresh or dried: Lemons (Citrus limon, Citrus limonum) and limes (Citrus aurantifolia, Citrus
MFN duties (Applied)
0.00% 0.00%

75
COUNTRY HS CODE PRODUCT DESCRIPTION TRADE REGIME
APPLIED TARIFFS
TOTAL AD VALOREM EQUIVALENT TARIFF
latifolia): Dried
European Union
080550101001
Fresh or dried lemons "Citrus limon, Citrus limonum" : Fresh. If the declared price is higher than or equal to 46.2 EUR/100 kg
MFN duties (Applied)
6.40% 6.40%
080550101002
Fresh or dried lemons "Citrus limon, Citrus limonum" : Fresh. If the declared price is higher than or equal to 45.3 EUR/100 kg
MFN duties (Applied)
6.40% + 11.88 $/Ton
7.43%
080550101003
Fresh or dried lemons "Citrus limon, Citrus limonum" : Fresh. If the declared price is higher than or equal to 44.4 EUR/100 kg
MFN duties (Applied)
6.40% + 23.76 $/Ton
8.45%
080550101004
Fresh or dried lemons "Citrus limon, Citrus limonum" : Fresh. If the declared price is higher than or equal to 43.4 EUR/100 kg
MFN duties (Applied)
6.40% + 36.96 $/Ton
9.59%
080550101005
Fresh or dried lemons "Citrus limon, Citrus limonum" : Fresh. If the declared price is higher than or equal to 42.5 EUR/100 kg
MFN duties (Applied)
6.40% + 48.84 $/Ton
10.62%
080550101006
Fresh or dried lemons "Citrus limon, Citrus limonum" : Fresh. If the declared price is higher than or equal to 0 EUR/100 kg
MFN duties (Applied)
6.40% + 337.92 $/Ton
35.58%
080550109001
Fresh or dried lemons "Citrus limon, Citrus limonum" : Other. If the declared price is higher than or equal to 46.2 EUR/100 kg
MFN duties (Applied)
6.40% 6.40%
080550109002
Fresh or dried lemons "Citrus limon, Citrus limonum" : Other. If the declared price is higher than or equal to 45.3 EUR/100 kg
MFN duties (Applied)
6.40% + 11.88 $/Ton
7.43%
080550109003
Fresh or dried lemons "Citrus limon, Citrus limonum" : Other. If the declared price is higher than or equal to 44.4 EUR/100 kg
MFN duties (Applied)
6.40% + 23.76 $/Ton
8.45%
080550109004
Fresh or dried lemons "Citrus limon, Citrus limonum" : Other. If the declared price is higher than or equal to 43.4 EUR/100 kg
MFN duties (Applied)
6.40% + 36.96 $/Ton
9.59%
080550109005
Fresh or dried lemons "Citrus limon, Citrus limonum" : Other. If the declared price is higher than or equal to 42.5 EUR/100 kg
MFN duties (Applied)
6.40% + 48.84 $/Ton
10.62%
080550109006
Fresh or dried lemons "Citrus limon, Citrus limonum" : Other. If the declared price is higher than or equal to 0 EUR/100 kg
MFN duties (Applied)
6.40% + 337.92 $/Ton
35.58%
0805509011 Fresh or dried limes "Citrus aurantifolia, Citrus latifolia" : Fresh
Preferential tariff for
0.00% 0.00%

76
COUNTRY HS CODE PRODUCT DESCRIPTION TRADE REGIME
APPLIED TARIFFS
TOTAL AD VALOREM EQUIVALENT TARIFF
Limes (Citrus latifolia) South Africa
0805509019 Fresh or dried limes "Citrus aurantifolia, Citrus latifolia" : Fresh Other
Preferential tariff for South Africa
0.00% 0.00%
0805509091 Fresh or dried limes "Citrus aurantifolia, Citrus latifolia" : Other : Limes (Citrus latifolia)
Preferential tariff for South Africa
0.00% 0.00%
0805509099 Fresh or dried limes "Citrus aurantifolia, Citrus latifolia" : Other Other
Preferential tariff for South Africa
0.00% 0.00%
0805900000
Fresh or dried citrus fruit (excl. oranges, lemons "Citrus limon, Citrus limonum", limes "Citrus aurantifolia, Citrus latifolia", grapefruit, mandarins, incl. tangerines and satsumas, clementines, wilkings and similar citrus hybrids)
Preferential tariff for South Africa
0.00% 0.00%
Hong Kong 08055000
Citrus fruit, fresh or dried: Lemons (Citrus limon, Citrus limonum) and limes (Citrus aurantifolia, Citrus latifolia)
MFN duties (Applied)
0.00% 0.00%
Kuwait
08055010
Citrus fruit, fresh or dried: Lemons (Citrus limon, Citrus limonum) and limes (Citrus aurantifolia, Citrus latifolia): Fresh
MFN duties (Applied)
0.00% 0.00%
08055020
Citrus fruit, fresh or dried: Lemons (Citrus limon, Citrus limonum) and limes (Citrus aurantifolia, Citrus latifolia): Dried
MFN duties (Applied)
0.00% 0.00%
Malaysia 08055000 Fresh or dried lemons `Citrus limon, Citrus limonum` and limes `Citrus aurantifolia, Citrus latifolia`
MFN duties (Applied)
5.00% 5.00%
Canada 08055000 Fresh or dried lemons Citrus limon, Citrus limonum and limes Citrus aurantifolia, Citrus latifolia
MFN duties (Applied)
0.00% 0.00%
Singapore 08055000 LEMONS & LIMES FRESH OR DRIED (TNE)
MFN duties (Applied)
0.00% 0.00%
Source: Market Access Map, ITC
Table 13 indicates that South African lemons do not have preferential access into the European markets. This is an indication that lemons did not form part of the list of products whose tariffs were to be reduced when the TDCA came into effect. They may have been on the list that the European Union member states classified at sensitive products and therefore did not form part of the negotiations. Limes however enter the European Union through preferential tariffs for South Africa. South African lemons and limes face 0% duties in Saudi Arabia, United Arab Emirates, Hong Kong, Kuwait, Canada, and Singapore markets. Russia imposes an import duty of 3.81% on lemons and limes while lemons and limes entering Malaysia faces a 5% MFN duty.
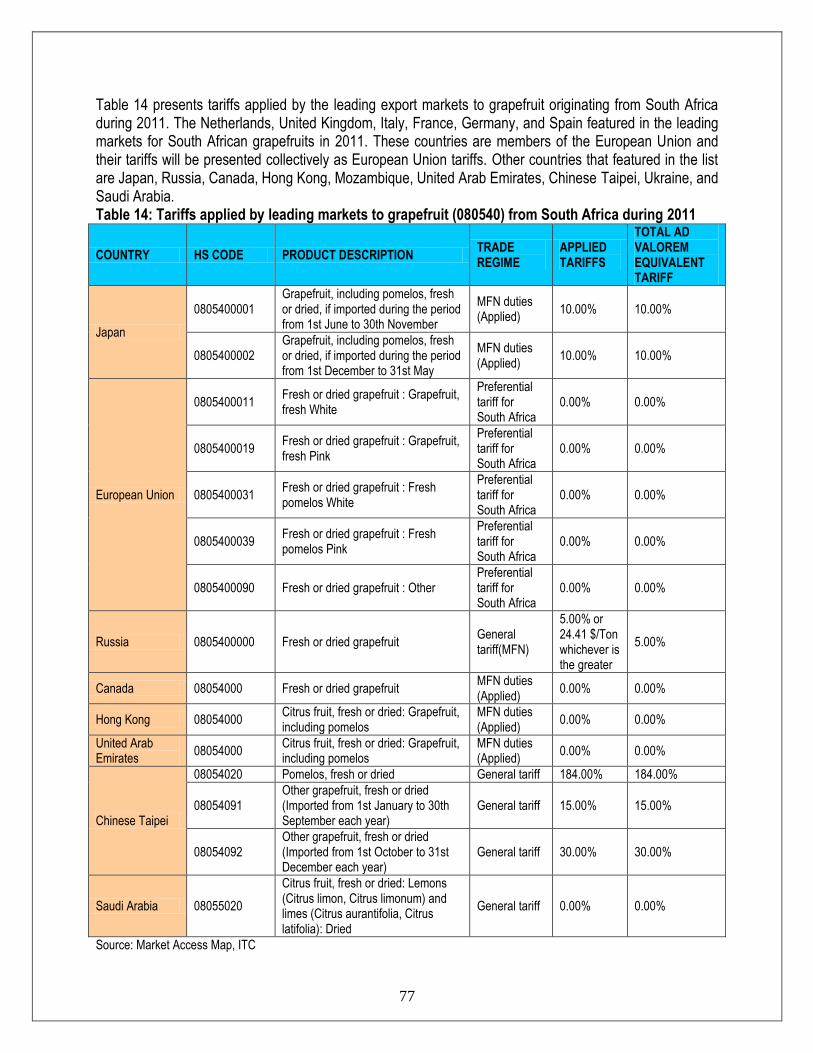
77
Table 14 presents tariffs applied by the leading export markets to grapefruit originating from South Africa during 2011. The Netherlands, United Kingdom, Italy, France, Germany, and Spain featured in the leading markets for South African grapefruits in 2011. These countries are members of the European Union and their tariffs will be presented collectively as European Union tariffs. Other countries that featured in the list are Japan, Russia, Canada, Hong Kong, Mozambique, United Arab Emirates, Chinese Taipei, Ukraine, and Saudi Arabia. Table 14: Tariffs applied by leading markets to grapefruit (080540) from South Africa during 2011
COUNTRY HS CODE PRODUCT DESCRIPTION TRADE REGIME
APPLIED TARIFFS
TOTAL AD VALOREM EQUIVALENT TARIFF
Japan
0805400001 Grapefruit, including pomelos, fresh or dried, if imported during the period from 1st June to 30th November
MFN duties (Applied)
10.00% 10.00%
0805400002 Grapefruit, including pomelos, fresh or dried, if imported during the period from 1st December to 31st May
MFN duties (Applied)
10.00% 10.00%
European Union
0805400011 Fresh or dried grapefruit : Grapefruit, fresh White
Preferential tariff for South Africa
0.00% 0.00%
0805400019 Fresh or dried grapefruit : Grapefruit, fresh Pink
Preferential tariff for South Africa
0.00% 0.00%
0805400031 Fresh or dried grapefruit : Fresh pomelos White
Preferential tariff for South Africa
0.00% 0.00%
0805400039 Fresh or dried grapefruit : Fresh pomelos Pink
Preferential tariff for South Africa
0.00% 0.00%
0805400090 Fresh or dried grapefruit : Other Preferential tariff for South Africa
0.00% 0.00%
Russia 0805400000 Fresh or dried grapefruit General tariff(MFN)
5.00% or 24.41 $/Ton whichever is the greater
5.00%
Canada 08054000 Fresh or dried grapefruit MFN duties (Applied)
0.00% 0.00%
Hong Kong 08054000 Citrus fruit, fresh or dried: Grapefruit, including pomelos
MFN duties (Applied)
0.00% 0.00%
United Arab Emirates
08054000 Citrus fruit, fresh or dried: Grapefruit, including pomelos
MFN duties (Applied)
0.00% 0.00%
Chinese Taipei
08054020 Pomelos, fresh or dried General tariff 184.00% 184.00%
08054091 Other grapefruit, fresh or dried (Imported from 1st January to 30th September each year)
General tariff 15.00% 15.00%
08054092 Other grapefruit, fresh or dried (Imported from 1st October to 31st December each year)
General tariff 30.00% 30.00%
Saudi Arabia 08055020
Citrus fruit, fresh or dried: Lemons (Citrus limon, Citrus limonum) and limes (Citrus aurantifolia, Citrus latifolia): Dried
General tariff 0.00% 0.00%
Source: Market Access Map, ITC

78
South African grapefruits enter European Union member states markets duty-free through a preferential tariff for South Africa while Japan imposes a 10% MFN duty on grapefruit originating from South Africa. Russia imposes a 5% or 24.41 $/ton (whichever is the greater) while Canada, Hong Kong, UAE, and Saudi Arabia apply a 0% MFN tariff on South African grapefruit exports. The Chinese Taipei imposes duties ranging from 15% to as high as 184% to grapefruits originating from South Africa. Table 15 presents tariffs applied by the leading export markets for naartjies originating from South Africa during 2011. Tariffs for European Union member states are presented together as EU tariffs and not individually. During 2011, EU members that featured in the leading markets for South African naartjies were the United Kingdom, Netherlands, Italy, Ireland, Finland, and France. Other countries that featured in the list are Russia, Hong Kong, Canada, United Arab Emirates, United States of America, Saudi Arabia, Kuwait, Angola, and Malaysia. Table 15: Tariffs applied by leading markets to naartjies (080520) from South Africa during 2011
COUNTRY HS CODE PRODUCT DESCRIPTION TRADE REGIME APPLIED TARIFFS
TOTAL AD VALOREM EQUIVALENT TARIFF
European Union
0805201005 Fresh or dried clementines : Fresh Preferential tariff for South Africa
0.00% 0.00%
0805201099 Fresh or dried clementines : Other Preferential tariff for South Africa
0.00% 0.00%
0805203005 Fresh or dried monreales and satsumas : Fresh
Preferential tariff for South Africa
0.00% 0.00%
0805203099 Fresh or dried monreales and satsumas : Other
Preferential tariff for South Africa
0.00% 0.00%
0805205007 Fresh or dried mandarins and wilkings : Mandarins Fresh
Preferential tariff for South Africa
0.00% 0.00%
0805205029 Fresh or dried mandarins and wilkings : Other
Preferential tariff for South Africa
0.00% 0.00%
0805205037 Fresh or dried mandarins and wilkings : Wilkings Fresh
Preferential tariff for South Africa
0.00% 0.00%
0805205089 Fresh or dried mandarins and wilkings : Other
Preferential tariff for South Africa
0.00% 0.00%
0805207005 Fresh or dried tangerines : Fresh Preferential tariff for South Africa
0.00% 0.00%
0805207099 Fresh or dried tangerines : Other Preferential tariff for South Africa
0.00% 0.00%
0805209005
Fresh or dried tangelos, ortaniques, malaquinas and similar citrus hybrids (excl. clementines, monreales, satsumas, mandarins, wilkings and tangerines) : Fresh Citrus hybrids known as `minneolas`
Preferential tariff for South Africa
0.00% 0.00%
0805209009
Fresh or dried tangelos, ortaniques, malaquinas and similar citrus hybrids (excl. clementines, monreales, satsumas, mandarins, wilkings and tangerines) : Fresh Other
Preferential tariff for South Africa
0.00% 0.00%
0805209091 Fresh or dried tangelos, ortaniques, malaquinas and similar citrus hybrids
Preferential tariff for South Africa
0.00% 0.00%
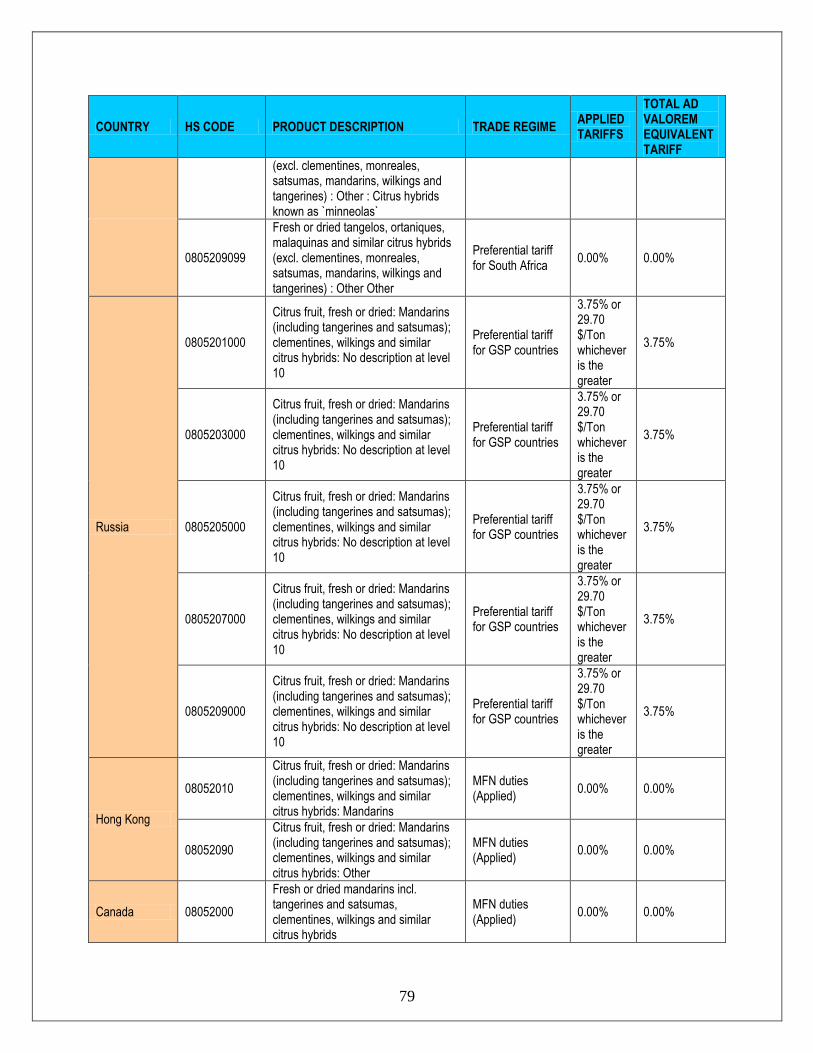
79
COUNTRY HS CODE PRODUCT DESCRIPTION TRADE REGIME APPLIED TARIFFS
TOTAL AD VALOREM EQUIVALENT TARIFF
(excl. clementines, monreales, satsumas, mandarins, wilkings and tangerines) : Other : Citrus hybrids known as `minneolas`
0805209099
Fresh or dried tangelos, ortaniques, malaquinas and similar citrus hybrids (excl. clementines, monreales, satsumas, mandarins, wilkings and tangerines) : Other Other
Preferential tariff for South Africa
0.00% 0.00%
Russia
0805201000
Citrus fruit, fresh or dried: Mandarins (including tangerines and satsumas); clementines, wilkings and similar citrus hybrids: No description at level 10
Preferential tariff for GSP countries
3.75% or 29.70 $/Ton whichever is the greater
3.75%
0805203000
Citrus fruit, fresh or dried: Mandarins (including tangerines and satsumas); clementines, wilkings and similar citrus hybrids: No description at level 10
Preferential tariff for GSP countries
3.75% or 29.70 $/Ton whichever is the greater
3.75%
0805205000
Citrus fruit, fresh or dried: Mandarins (including tangerines and satsumas); clementines, wilkings and similar citrus hybrids: No description at level 10
Preferential tariff for GSP countries
3.75% or 29.70 $/Ton whichever is the greater
3.75%
0805207000
Citrus fruit, fresh or dried: Mandarins (including tangerines and satsumas); clementines, wilkings and similar citrus hybrids: No description at level 10
Preferential tariff for GSP countries
3.75% or 29.70 $/Ton whichever is the greater
3.75%
0805209000
Citrus fruit, fresh or dried: Mandarins (including tangerines and satsumas); clementines, wilkings and similar citrus hybrids: No description at level 10
Preferential tariff for GSP countries
3.75% or 29.70 $/Ton whichever is the greater
3.75%
Hong Kong
08052010
Citrus fruit, fresh or dried: Mandarins (including tangerines and satsumas); clementines, wilkings and similar citrus hybrids: Mandarins
MFN duties (Applied)
0.00% 0.00%
08052090
Citrus fruit, fresh or dried: Mandarins (including tangerines and satsumas); clementines, wilkings and similar citrus hybrids: Other
MFN duties (Applied)
0.00% 0.00%
Canada 08052000
Fresh or dried mandarins incl. tangerines and satsumas, clementines, wilkings and similar citrus hybrids
MFN duties (Applied)
0.00% 0.00%
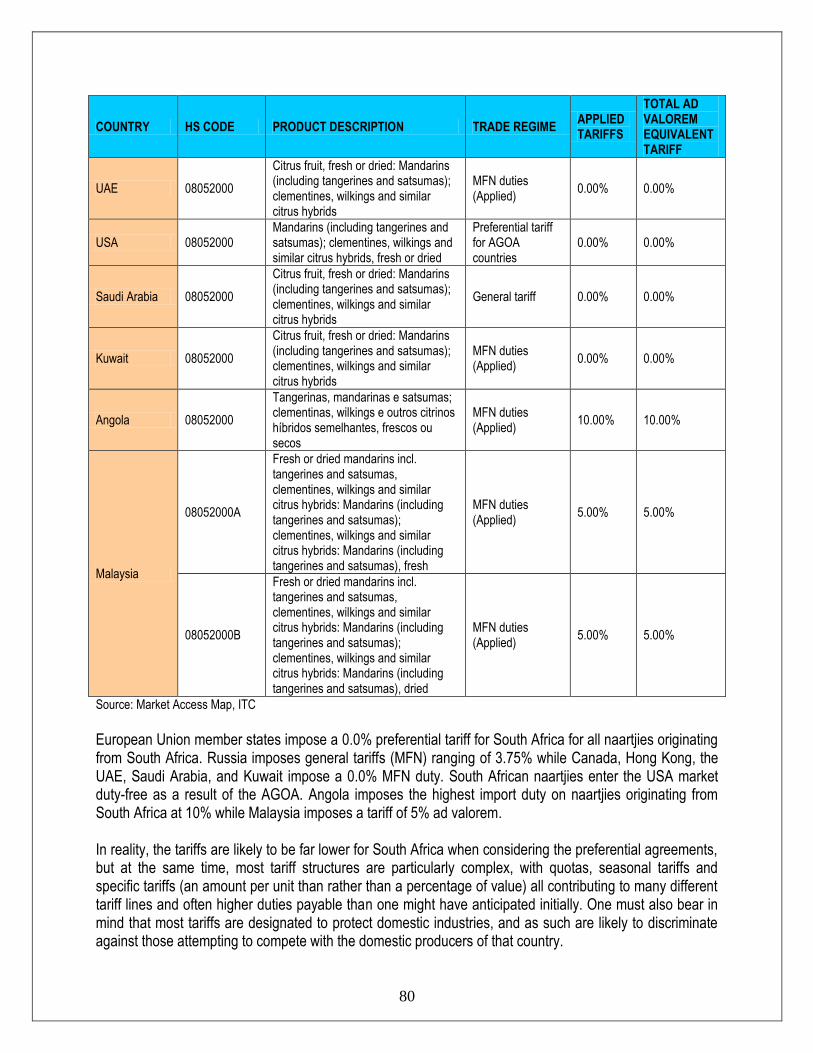
80
COUNTRY HS CODE PRODUCT DESCRIPTION TRADE REGIME APPLIED TARIFFS
TOTAL AD VALOREM EQUIVALENT TARIFF
UAE 08052000
Citrus fruit, fresh or dried: Mandarins (including tangerines and satsumas); clementines, wilkings and similar citrus hybrids
MFN duties (Applied)
0.00% 0.00%
USA 08052000 Mandarins (including tangerines and satsumas); clementines, wilkings and similar citrus hybrids, fresh or dried
Preferential tariff for AGOA countries
0.00% 0.00%
Saudi Arabia 08052000
Citrus fruit, fresh or dried: Mandarins (including tangerines and satsumas); clementines, wilkings and similar citrus hybrids
General tariff 0.00% 0.00%
Kuwait 08052000
Citrus fruit, fresh or dried: Mandarins (including tangerines and satsumas); clementines, wilkings and similar citrus hybrids
MFN duties (Applied)
0.00% 0.00%
Angola 08052000
Tangerinas, mandarinas e satsumas; clementinas, wilkings e outros citrinos híbridos semelhantes, frescos ou secos
MFN duties (Applied)
10.00% 10.00%
Malaysia
08052000A
Fresh or dried mandarins incl. tangerines and satsumas, clementines, wilkings and similar citrus hybrids: Mandarins (including tangerines and satsumas); clementines, wilkings and similar citrus hybrids: Mandarins (including tangerines and satsumas), fresh
MFN duties (Applied)
5.00% 5.00%
08052000B
Fresh or dried mandarins incl. tangerines and satsumas, clementines, wilkings and similar citrus hybrids: Mandarins (including tangerines and satsumas); clementines, wilkings and similar citrus hybrids: Mandarins (including tangerines and satsumas), dried
MFN duties (Applied)
5.00% 5.00%
Source: Market Access Map, ITC
European Union member states impose a 0.0% preferential tariff for South Africa for all naartjies originating from South Africa. Russia imposes general tariffs (MFN) ranging of 3.75% while Canada, Hong Kong, the UAE, Saudi Arabia, and Kuwait impose a 0.0% MFN duty. South African naartjies enter the USA market duty-free as a result of the AGOA. Angola imposes the highest import duty on naartjies originating from South Africa at 10% while Malaysia imposes a tariff of 5% ad valorem. In reality, the tariffs are likely to be far lower for South Africa when considering the preferential agreements, but at the same time, most tariff structures are particularly complex, with quotas, seasonal tariffs and specific tariffs (an amount per unit than rather than a percentage of value) all contributing to many different tariff lines and often higher duties payable than one might have anticipated initially. One must also bear in mind that most tariffs are designated to protect domestic industries, and as such are likely to discriminate against those attempting to compete with the domestic producers of that country.
81
4.2 Non tariff barriers 4.2.1 Quality standards The procedure for setting standards was followed again in 2009 and the different variety focus groups (VFGs) once again assisted the DAFF by making recommendations on the different quality standards. 4.2.2 Bio-security South Africa continued to monitor the movement of Bactrocera Invadens (BI) to the North. Traps have been set up along all northern borders and are being continuously monitored. To date no BI have been found. A focussed BI steering committee has been established consisting of government and fruit industry representatives. The stockpile of chemicals has been renewed and is available for eradication purposes should BI be found. 4.2.3 Plant Protection Product (PPP) database Being able to comply with PPP Maximum Residue Levels (MRLs) remains the cornerstone to official and private food safety standards. CGA’s PPP database was created to become a web-based tool to store, manage and share the mounting volume of technical and commercial data relating to PPPs and MRLs used on export citrus in southern Africa. Further developments to the system in 2008/9 included: The ability to record reasons for MRL changes; functionality to track the “history” of an active and MRLs over time; making the system more user-friendly. In the near future the PPP database will go “live” for use by producers, agrochemical supply companies and general users, whereas to date it has been for internal CGA/CRI use only. 4.3 European Union (EU) The interceptions of South African fruit with Citrus Black Spot (CBS) in Europe declined considerably in 2009, dropping by 75%. During 2009 a delegation from the Food and Veterinary Office (FVO) of the EU visited South Africa as a follow up to the European Food Safety Authorities (EFSA) report. The FVO delegation found that the South African citrus industry is largely complaint with all requirements. Landmark Europe continues to represent the CGA in Brussels and continues to assist the CGA in monitoring the CBS issue, keeping the CGA abreast of developments, and keeping EU officials informed of developments from a South African point of view. 4.4 Consumer health and safety requirements Increasing consumer conscience about health and safety issues has prompted a number of safety initiatives in Europe, such as GLOBAL-GAP on good agricultural practices (GAP) by the main European retailers, the international management system of HACCP, which is independently certified and required by legislation for European producers as well as food imported into Europe (EC 852/2004), and the ISO 9000 management standards system (for producers and working methods) which is certified by the International Standards Organization (ISO).

82
The development of public and private standards involves interventions at multiple points along the value chain. An illustration of the multiple points and multiple standards that are applied for fresh fruit and vegetables and for fish is shown in Figure 65. There are controls by different agents carried out in different ways at different points along the value chain in response to the requirements of private sector companies, coalitions of private-sector standards setters and public agencies. Standards in agribusiness value chains operate, by definition, at multiple points. They are created, adopted, applied and verified by different actors (enterprises and institutions) at different points in the value chain.

83
Figure 65: Food safety and quality control in the fruit and vegetable supply chains
Source: UNIDO
4.5 Japan The Grapefruit Focus Group (GFG) decided to continue with co-ordination of shipments of grapefruit into Japan. Coordinators were employed in both South Africa and Japan. Shipments were monitored and adjusted to ensure rateable delivery to Japan and to keep stocks at acceptable levels (three weeks of sales). This initiative was deemed a success. Growers considered the recommendations with regard to promotions in Japan. It was agreed that any promotions would need to be accompanied by good quality fruit and co-ordinated shipping. The promotion of South African grapefruits in Japan is currently under. The initiative is funded through statutory levies paid by producers who export grapefruits to Japan. 4.6 United States of America During February 2010 the USA finalised the rule-making process for the inclusion of 16 new magisterial districts to export to the USA. This means that these magisterial districts situated in the Northern Cape,
84
Free State and North West can export to the USA from 2010. Given the fact that the magisterial districts are suitable for grapefruit production, this could mean that the full basket of citrus will now be offered from South Africa to the USA. 5. DISTRIBUTION CHANNELS There are roughly three distinct sales channels for exporting fruits. One can sell directly to an importer with or without the assistance of an agent. One can supply fruits combined, which will then contract out importers/marketers and try to take advantage of economies of scale and increased bargaining power. At the same time combined fruits might also supply large retail chains. One can also be a member of a private or cooperative export organization which will find agents or importers and market the produce collectively. Similar to combined fruits, an export organization can either supply wholesale market or retail chains, depending on particular circumstances. Export organizations will wash, sort and package the produce. They will also market the goods under their own name or on behalf of the member, which includes taking care of labelling, bar-coding, etc. Most of the time, export organizations will enter into a collective agreements with freight forwarders, negotiating better prices and services (more regular transport, lower peak season prices, etc). Some countries have institutions that handle all the produce (membership compulsory) and sell only to a restricted number of selected importers. Agents will establish contacts between producers/export organizations and buyers in the importing country, and will usually take between 2% and 3% commission. In contrast, an importer will buy and sell his/her own capacity, assuming the full risk (unless on consignment). They will also be responsible for clearing the produce through customs, packaging and assuring label/quality compliance and distribution of the produce. Their margins lie between 5% and 10%. The contract importers of fruit combines market and distribute the produce of the combines, clear it through customs and in some cases treat and package it. Only few exporters have long term contracts with wholesale grocers who deliver directly to retail shops, but with the increasing importance of standards (EUREGAP, etc) and the year round availability of fruit, the planning of long term contractual relationship is expected to increase. 6. LOGISTICS 6.1 Mode of transport The transport of fruits falls into two categories namely ocean cargo and air cargo. Ocean cargo takes much longer to reach the desired location but costing considerably less. The choice of transportation method depends, for most parts on the fragility of the produce and how long it can remain relatively fresh. With the advent of technology and container improvements, the feasibility, cost and attractiveness of sea transport have improved considerably. With the increased exports by South Africa, the number and the regularity of maritime routes have increased. These economies of scale could benefit South Africa if more producers were to become exporters and take advantage of the various ports which have special capabilities in handling fruit produce (Durban new fruit terminal).
85
6.2 Cold chain management Cold chain management is crucial when handling perishable products, from the initial packing houses to the refrigerated container trucks that transport the produce to the shipping terminals, through to the storage facilities at these terminals, onto actual shipping vessels and containers, and finally on to the importers and distributors that must clear the produce and transport it to the markets/retail outlets. For every 10 Degree Celsius increase above the recommended temperature, the rate of respiration and ripening of produce can increase twice or even thrice. Related to this are increasing important traceability standards which require an efficient controlled supply chain and internationally accepted business standards. 6.3 Packaging Packaging can also play an important role in ensuring safe and efficient transport of a product and conforming to handling requirements, uniformity recyclable material specifications, phytosanitary requirements, proper storage needs and even attractiveness for marketing purposes. The business panel of any carton (including printed carton labels) should comply with the requirements as established by the EU or any other regulations that are specified by a target market. Producers are advised to present their designs to the Perishable Products Export Control Board (PPECB) before they can order any cartons from a manufacturer. The following is normally required:
Class I or II
Fruit type
Carton depth
Country of Origin: “Produce of South Africa”
Complete address of exporter or producer
Name of variety
Content of carton: “14 x punnets or bags”
PUC or PHC code: Registered producer – or Pack House Code with DAFF
Date code
Food safety accreditation number: Global Gap, Nature’s Choice registration number, etc 7. MARKET VALUE CHAIN This analysis of the citrus marketing value chain is simplified because numerous interconnections were omitted and the size, levels of control and importance of each of the links and flows could not possibly be shown in a single diagram. In the citrus value chain, harvested fruit may go to the fresh fruit market, in order to be consumed fresh, or squeezed freshly at home to be consumed as juice, or it may enter the processing industry, in order to obtain juice (mainly in the form of Frozen Concentrated Orange Juice (FCOJ) for ease of transport in international trade) and other by-products. There is an increasing competition in this sector, with restructuring and changes in the marketing chain, in a context of globalization. The market is increasingly consumer driven. The following discussion will focus on the main segments of the citrus value chain namely: domestic and export markets, processing industry, global retail chains and consumers. The citrus value chain is
86
presented in Figure 64.
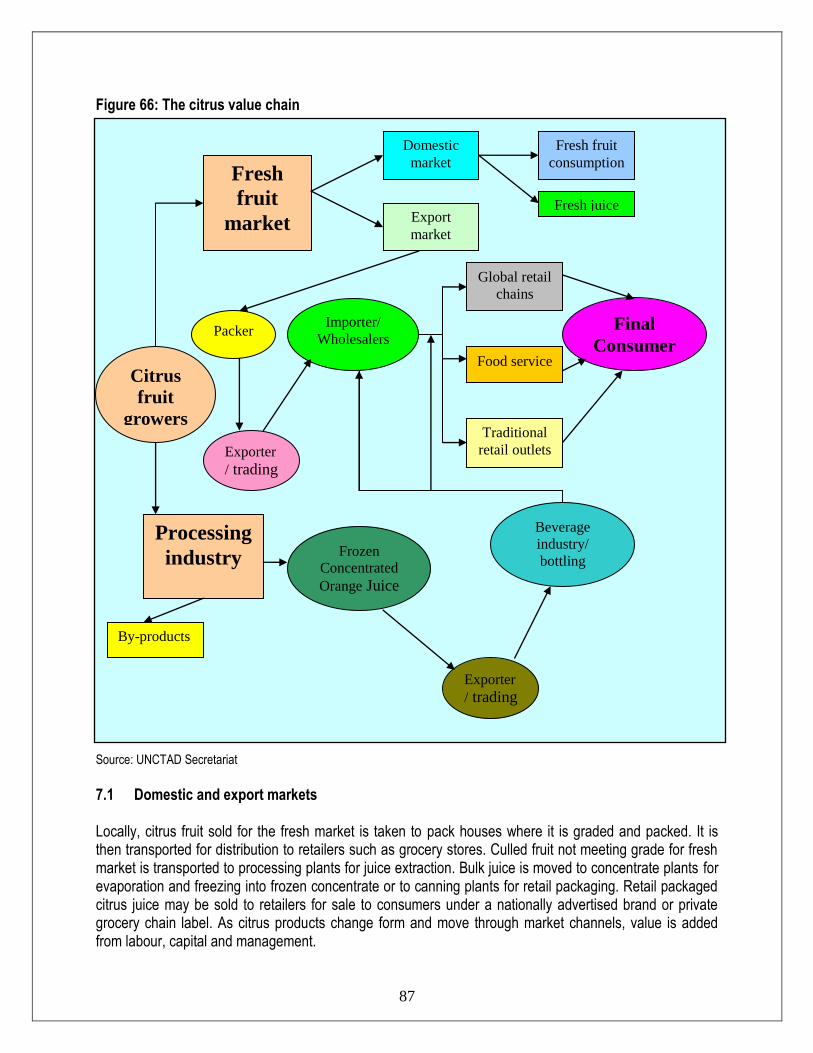
87
Figure 66: The citrus value chain Source: UNCTAD Secretariat
7.1 Domestic and export markets Locally, citrus fruit sold for the fresh market is taken to pack houses where it is graded and packed. It is then transported for distribution to retailers such as grocery stores. Culled fruit not meeting grade for fresh market is transported to processing plants for juice extraction. Bulk juice is moved to concentrate plants for evaporation and freezing into frozen concentrate or to canning plants for retail packaging. Retail packaged citrus juice may be sold to retailers for sale to consumers under a nationally advertised brand or private grocery chain label. As citrus products change form and move through market channels, value is added from labour, capital and management.
Citrus
fruit
growers
Fresh
fruit
market
Packer
Exporter
/ trading
Importer/
Wholesalers
Domestic
market
Export
market
Global retail
chains
Food service
Traditional
retail outlets
Final
Consumer
Processing
industry Frozen
Concentrated
Orange Juice
Exporter
/ trading
Beverage
industry/ bottling
Fresh fruit
consumption
Fresh juice
By-products

88
The industry is linked to input supply businesses that provide fertilizers, chemicals, orchard care services, packaging materials, transportation, etc. Labour for citrus production and processing is provided by labourers in farms and from surrounding towns. The export market is more important for the fresh citrus fruits from South Africa than for juice. 7.2 Processing industry There are two kinds of juice processors: bulk processors who produce most of the world’s orange juice and marketing processors who sell the packaged juice under their own brand name and often purchase additional juice from bulk processors. The beverage industry buys the juice concentrate in order to add the water and transform, bottle and market it. These bottlers have undergone a process of mergers and acquisitions (e.g. Coca Cola with Minute Maid and Pepsi Cola with Tropicana) 7.3 Global retail chains Global retail chains are playing an increasing role in the distribution of produce in South Africa and other developed countries (particularly in the EU and USA). This tendency is also developing in Latin America and Asia. Increasing concentration and consolidation in retail chains, as well as their global expansion has improved their position and augmented their buying power in the market. It allows them to influence the marketing chain in order to better control it. They impose more stringent requirements when determining conditions of production and distribution. Supermarkets demand higher quantities, better qualities and lower prices. This downstream shift of power in the produce marketing chain is leading to increased vertical coordination mainly through supply chain management practices. Supermarkets tend to build long-term relationships with preferred suppliers in order to guarantee continuous supply at the required levels of quality. The NFPMs’ importance has declined dramatically as long-term relationships between retailers and growers have developed. Following suit, some citrus fruits growers and citrus processing companies are reacting, shifting from their production orientation to a more market oriented approach, improving supply chain management, in order to better meet consumers’ demands. The new marketing and trade practices of retail chains also include slotting allowances and fees, in order to place the product on supermarket shelves, special packaging and other marketing and trade promotion services. 7.4 Final consumer Consumer preferences are changing and they are demanding more healthy and natural products (they are becoming increasingly aware of the health and nutritive benefits of eating more fresh fruit and fruit juices). Consumers are also more interested in dietary issues, in consuming more food low in fat and sugar, and this favours fruit consumption. Food safety has also become a very significant issue, particularly after the food scares in Europe. Consumers demand higher quality of the food they consume and they are interested in the taste, appearance or shape of the fruit. They want to be informed about the food they are consuming through appropriate labelling and tracking and traceability schemes. They are also interested in innovation, showing an increasing taste for variety and demanding the continuing presence of new products. At the same time, new lifestyles have led to increased preferences for quick and easy to prepare food. Convenience has become an important factor in produce demand. This favours particularly the consumption of juice and easy to peel fruit, such as clementines. In addition, consumers are also ever more
89
concerned about production conditions, both environmental and social, demanding more organic and fair-trade products. 8. ORGANIZATIONAL ANALYSIS 8.1 Producer and associated organizations
The main association responsible for the citrus industry in South Africa is the Citrus Growers Association of Southern Africa (CGA). Its objectives are as follows:
• Providing the industry with access to global markets, • Optimizing cost effective production of quality fruit, • Continual commitment to research, development and communication with all stakeholders, •Caring for the environment and the community within which the citrus farmers operate.
The CGA was established by citrus growers in the wake of deregulation. Growers were concerned that certain functions previously carried out by the Citrus Board could be discontinued or downsized. With the demise of a single channel marketing system there are often questions about “who represents the citrus grower?” The CGA believes that it is their role to fill this void. Growers’ interests are furthered through representation to citrus industry stakeholders – including government, exporters, research institutions and suppliers to the citrus industry The CGA represents the interests of the producers of export citrus. In total 1 400 growers throughout Southern Africa (including Zimbabwe and Swaziland) are members of the Association. 8.2 Strengths, Weaknesses, Opportunities and Threat analysis Some of the strengths, weaknesses, threats and opportunities of the citrus production sector in South Africa are presented in Figure 65.
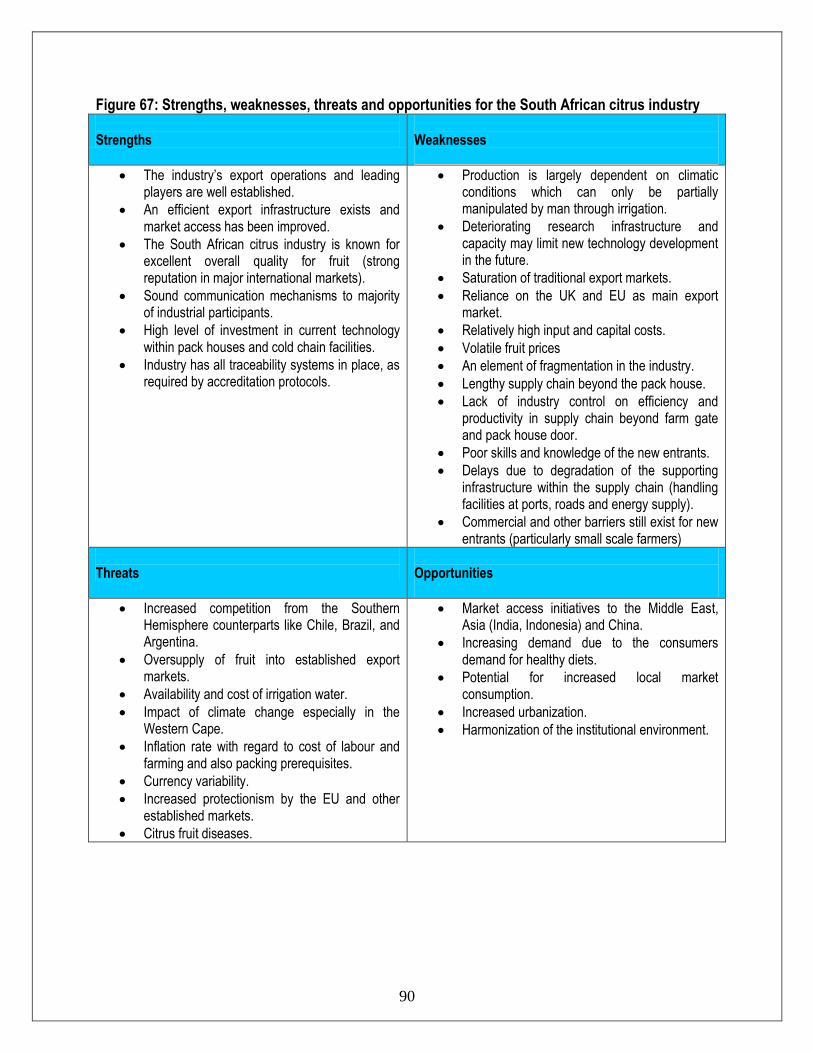
90
Figure 67: Strengths, weaknesses, threats and opportunities for the South African citrus industry Strengths
Weaknesses
The industry’s export operations and leading players are well established.
An efficient export infrastructure exists and market access has been improved.
The South African citrus industry is known for excellent overall quality for fruit (strong reputation in major international markets).
Sound communication mechanisms to majority of industrial participants.
High level of investment in current technology within pack houses and cold chain facilities.
Industry has all traceability systems in place, as required by accreditation protocols.
Production is largely dependent on climatic conditions which can only be partially manipulated by man through irrigation.
Deteriorating research infrastructure and capacity may limit new technology development in the future.
Saturation of traditional export markets.
Reliance on the UK and EU as main export market.
Relatively high input and capital costs.
Volatile fruit prices
An element of fragmentation in the industry.
Lengthy supply chain beyond the pack house.
Lack of industry control on efficiency and productivity in supply chain beyond farm gate and pack house door.
Poor skills and knowledge of the new entrants.
Delays due to degradation of the supporting infrastructure within the supply chain (handling facilities at ports, roads and energy supply).
Commercial and other barriers still exist for new entrants (particularly small scale farmers)
Threats
Opportunities
Increased competition from the Southern Hemisphere counterparts like Chile, Brazil, and Argentina.
Oversupply of fruit into established export markets.
Availability and cost of irrigation water.
Impact of climate change especially in the Western Cape.
Inflation rate with regard to cost of labour and farming and also packing prerequisites.
Currency variability.
Increased protectionism by the EU and other established markets.
Citrus fruit diseases.
Market access initiatives to the Middle East, Asia (India, Indonesia) and China.
Increasing demand due to the consumers demand for healthy diets.
Potential for increased local market consumption.
Increased urbanization.
Harmonization of the institutional environment.
91
9. EMPOWERMENT ISSUES AND TRANSFORMATION OF THE AGRICULTURE SECTOR 9.1 Youth in citrus The CGA has in the past few years published two publications under the transformation portfolio, namely ‘Our Citrus Transforms’ and ‘Women in Citrus’. Following the publication of those publications, the CGA has published ‘Youth in Citrus’ which highlight the importance of the youth in the citrus sector. The publication also aims to motivate the youth to be involved in agriculture in general and in the citrus industry in particular. 9.2 Mentorship The DAFF has joined with CGA in an initiative aimed at transferring skills from established citrus growers to new entrants in the industry. The DAFF has provided funding, while CGA has identified mentors and mentees, established agreements with these parties, and monitored progress on these farms. Dr Richard Bates was contracted by CGA to administer and monitor progress. Starting from 2010, the mentorship programme will be funded by provinces from the CASP fund. The CGA has established a manual that guides mentorship activities. This manual provides detail on the roles and responsibilities of all those involved in the mentorship programme. Detailed reports on the different mentorship initiatives are available from CGA. 9.3 Extension CGA has two extension personnel (seconded to CRI) dedicated to assist emerging growers from the north (Mpumalanga, Limpopo and Kwazulu Natal) and south region (Eastern Cape, Western Cape and Kwazulu Natal). The CGA has requested the provincial departments of agriculture and rural development to provide government extension personnel who will be trained as citrus specialists to provide support to growers. The CGA has already signed a memorandum of understanding (MoU) with the Limpopo department and is now in the process of signing other MoUs with the Eastern Cape and KZN provinces. 10. BUSINESS OPPORTUNITIES AND CHALLENGES 10.1 Business opportunities The formation of associations focusing on targeted markets, sharing logistics and coordinating marketing plans are becoming a norm. There is a greater maturity and an understanding for the need to coordinate without sacrificing enterprise. Prospects for growth and development in Southern African citrus industry depends on the availability of water and meeting the markets needs. The industry is export – driven, and the local market cannot sustain large volumes of the fruit as a result the challenge on South African farmers to acquire new markets with attractive prices to cover the cost of inputs. Export volumes have doubled over the past 30 years, from some 38 million cartons before deregulation to more than 70 million cartons in 2007. This was mainly due to more exporters discovering and developing

92
new markets. It means that citrus export volumes are distributed to a wider array of markets and as a result producers are less vulnerable to market collapses. The end of pooling system whereby all fruit would come through a single channel was good for growers. Regardless of quality, all growers would get an average price at the end of the day under the old system. Its abolishment has meant that growers are now properly compensated for good quality and costs are more transparent. As far as citrus exporting is concerned, members find it difficult to compete price- wise on the normally over supplied world markets against countries like Brazil and USA in terms of processed citrus (apart from acid content, which is low sugar/ acid ratios). SA valencia concentrates often necessitate local processors to trade at 5-10 % below the world prices, while the unit price is high. 10.2 Challenges The rising costs of production: With added requirements of food safety and traceability adding to the cost of administration burden, many smaller farming units are becoming unsustainable. Legislative requirements such as labour, water and environmental laws and skills development requirements are becoming cumbersome and making the business of citrus farming less profitable. Global harmonization of standards: without global harmonization of in food safety and good agricultural practice standards then the additional costs and administration will take their toll on grower returns and profitability. Retailers and other supply chain role players must work together to make harmonized standards a reality – inspected once, accepted everywhere must be a reality. Otherwise it will only be certification agencies that will prosper. Global warming: According to producers global warming is affecting western seaboards of the southern hemisphere countries, and the rising of the transport cost – which accounts for 30 – 40% of the price of getting a piece of fruit to the market. It is clear that the industry has some hurdles to overcome. Emerging sector: Despite all the support that was received through partnerships created, the environment under which emerging farmers operate continues to demand improvement on the following:
Use of title deeds as a form of collateral.
Capacity and capability of trust and Community Property Associations (CPA) to engage on commercial ventures.
Accessibility to support programs from the government and other role-players.
Credit policies of various financial institutions. 11. ACKNOWLEDGEDMENTS THE FOLLOWING INSTITUTIONS ARE ACKNOWLEDGED: 11.1 National Agricultural Marketing Council
Private Bag X 935

93
Pretoria 0001 Tel (012) 341 1115 Fax (012) 341 1811 Web: www.namc.co.za
11.2 Citrus Growers Association of Southern Africa P.O Box 461 Hillcrest 3650 Tel (031) 765 2514 Fax: (031) 765 8029 www.cga.co.za
11.3 Quantec
www.quantec.co.za 11.4 S. A Citrus Processor Association
P.O Box 4417 Tzaneen 0850 082 410 5252 Email [email protected]
11.5 National Department of Agriculture, Forestry and Fisheries
Directorate: Statistics and Economic Analysis Private X246 Pretoria 0001 Tel (012) 319 84 54 Fax (012) 319 8031 www.daff.gov.za
11.6 United Nations Conference on Trade and Development (UNCTAD) www.unctad.org 11.7 International Trade Centre (ITC) www.trademap.org; www.macmap.org

94
THE CITRUS PROCESSORS IN SOUTH AFRICA ARE AS FOLLOWS: 11.9 LG Juices (Pty) Ltd
P. O. Box 8 Cotrus Dal 7340 Tel (022) 921 3544 Fax (022) 921 3814
11.10 Granor-Passi (Pty) Ltd
P.O Box 584 Polokwane 0700 Tel (015) 298 6000 Fax (015) 298 8479
11.11 Valor Citrus Processors (Pty) Ltd
P.O Box 2071 North End Port Elizabeth 6056 Tel (041) 486 2146 Fax (041) 486 4112
11.12 Magalisberg Citrus Co-operative Ltd
Private Bag X 5094 Brits 0250 Tel (012) 256 6703 Fax (012) 256 6769
11.13 Riverside Processors
P.O Box 286 Malelane 1320
Tel (013) 790 3015 Fax (013) 790 0072 11.14 Onderberg Verwerkings Koporasie P.O Box 543
Malelane 1320 Tel (013) 790 1146 Fax (013) 790 1148
11.15 Letaba Citrus Processors (Pty) Ltd
Private Bag X 4019
95
Tzaneen 0850 Tel (015) 304 4000 Fax (015) 304 4230
11.16 Ceres Fruit Juices PO Box 337 Bedfordview 2008 Tel: 011 622 0001/5 Fax: 011 622 0012 www.ceres.co.za 11.17 Marble Hall Citrus Processors 838 Agaat Street Marble Hall Mpumalanga 0472 Tel: 013 2611 308 Disclaimer: This document and its contents have been compiled by the Department of Agriculture, Forestry and Fisheries for the purpose of detailing citrus industry. Anyone who uses this information does so at his/her own risk. The views expressed in this document are those of the Department of Agriculture, Forestry and Fisheries with regard to citrus industry, unless otherwise stated. The Department of Agriculture, Forestry and Fisheries therefore, accepts no liability that can be incurred resulting from the use of this information.
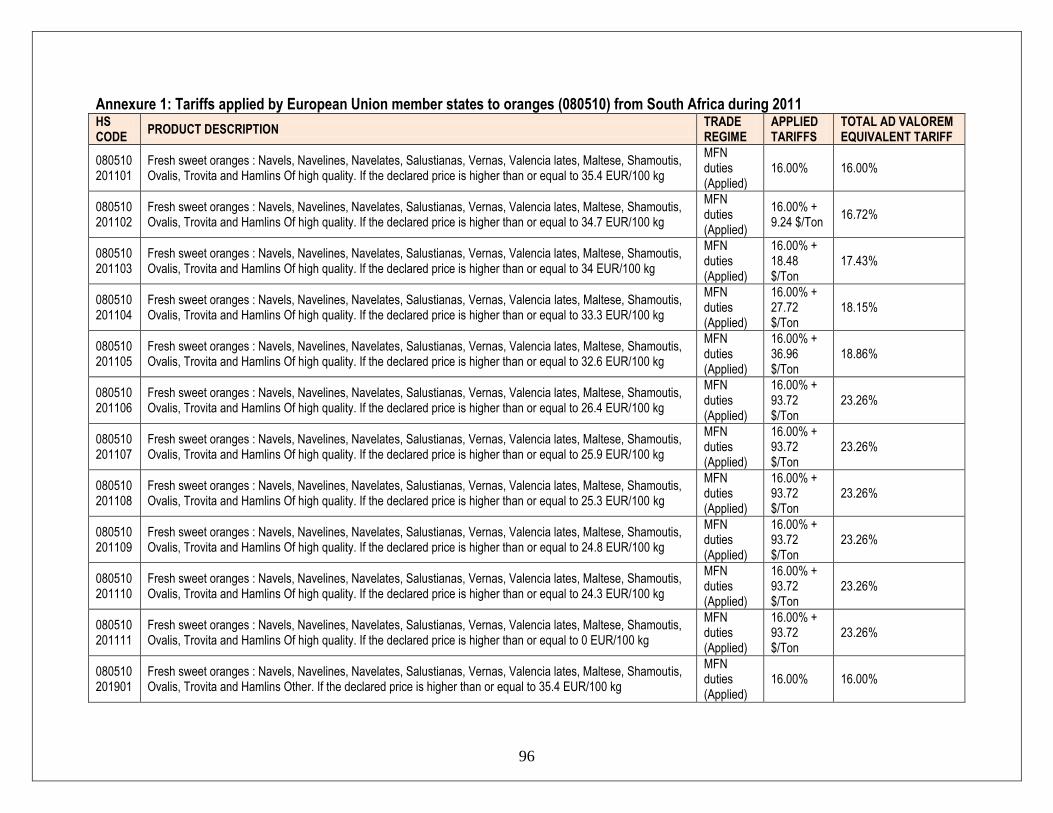
96
Annexure 1: Tariffs applied by European Union member states to oranges (080510) from South Africa during 2011 HS CODE
PRODUCT DESCRIPTION TRADE REGIME
APPLIED TARIFFS
TOTAL AD VALOREM EQUIVALENT TARIFF
080510201101
Fresh sweet oranges : Navels, Navelines, Navelates, Salustianas, Vernas, Valencia lates, Maltese, Shamoutis, Ovalis, Trovita and Hamlins Of high quality. If the declared price is higher than or equal to 35.4 EUR/100 kg
MFN duties (Applied)
16.00% 16.00%
080510201102
Fresh sweet oranges : Navels, Navelines, Navelates, Salustianas, Vernas, Valencia lates, Maltese, Shamoutis, Ovalis, Trovita and Hamlins Of high quality. If the declared price is higher than or equal to 34.7 EUR/100 kg
MFN duties (Applied)
16.00% + 9.24 $/Ton
16.72%
080510201103
Fresh sweet oranges : Navels, Navelines, Navelates, Salustianas, Vernas, Valencia lates, Maltese, Shamoutis, Ovalis, Trovita and Hamlins Of high quality. If the declared price is higher than or equal to 34 EUR/100 kg
MFN duties (Applied)
16.00% + 18.48 $/Ton
17.43%
080510201104
Fresh sweet oranges : Navels, Navelines, Navelates, Salustianas, Vernas, Valencia lates, Maltese, Shamoutis, Ovalis, Trovita and Hamlins Of high quality. If the declared price is higher than or equal to 33.3 EUR/100 kg
MFN duties (Applied)
16.00% + 27.72 $/Ton
18.15%
080510201105
Fresh sweet oranges : Navels, Navelines, Navelates, Salustianas, Vernas, Valencia lates, Maltese, Shamoutis, Ovalis, Trovita and Hamlins Of high quality. If the declared price is higher than or equal to 32.6 EUR/100 kg
MFN duties (Applied)
16.00% + 36.96 $/Ton
18.86%
080510201106
Fresh sweet oranges : Navels, Navelines, Navelates, Salustianas, Vernas, Valencia lates, Maltese, Shamoutis, Ovalis, Trovita and Hamlins Of high quality. If the declared price is higher than or equal to 26.4 EUR/100 kg
MFN duties (Applied)
16.00% + 93.72 $/Ton
23.26%
080510201107
Fresh sweet oranges : Navels, Navelines, Navelates, Salustianas, Vernas, Valencia lates, Maltese, Shamoutis, Ovalis, Trovita and Hamlins Of high quality. If the declared price is higher than or equal to 25.9 EUR/100 kg
MFN duties (Applied)
16.00% + 93.72 $/Ton
23.26%
080510201108
Fresh sweet oranges : Navels, Navelines, Navelates, Salustianas, Vernas, Valencia lates, Maltese, Shamoutis, Ovalis, Trovita and Hamlins Of high quality. If the declared price is higher than or equal to 25.3 EUR/100 kg
MFN duties (Applied)
16.00% + 93.72 $/Ton
23.26%
080510201109
Fresh sweet oranges : Navels, Navelines, Navelates, Salustianas, Vernas, Valencia lates, Maltese, Shamoutis, Ovalis, Trovita and Hamlins Of high quality. If the declared price is higher than or equal to 24.8 EUR/100 kg
MFN duties (Applied)
16.00% + 93.72 $/Ton
23.26%
080510201110
Fresh sweet oranges : Navels, Navelines, Navelates, Salustianas, Vernas, Valencia lates, Maltese, Shamoutis, Ovalis, Trovita and Hamlins Of high quality. If the declared price is higher than or equal to 24.3 EUR/100 kg
MFN duties (Applied)
16.00% + 93.72 $/Ton
23.26%
080510201111
Fresh sweet oranges : Navels, Navelines, Navelates, Salustianas, Vernas, Valencia lates, Maltese, Shamoutis, Ovalis, Trovita and Hamlins Of high quality. If the declared price is higher than or equal to 0 EUR/100 kg
MFN duties (Applied)
16.00% + 93.72 $/Ton
23.26%
080510201901
Fresh sweet oranges : Navels, Navelines, Navelates, Salustianas, Vernas, Valencia lates, Maltese, Shamoutis, Ovalis, Trovita and Hamlins Other. If the declared price is higher than or equal to 35.4 EUR/100 kg
MFN duties (Applied)
16.00% 16.00%

97
HS CODE
PRODUCT DESCRIPTION TRADE REGIME
APPLIED TARIFFS
TOTAL AD VALOREM EQUIVALENT TARIFF
080510201902
Fresh sweet oranges : Navels, Navelines, Navelates, Salustianas, Vernas, Valencia lates, Maltese, Shamoutis, Ovalis, Trovita and Hamlins Other. If the declared price is higher than or equal to 34.7 EUR/100 kg
MFN duties (Applied)
16.00% + 9.24 $/Ton
16.72%
080510201903
Fresh sweet oranges : Navels, Navelines, Navelates, Salustianas, Vernas, Valencia lates, Maltese, Shamoutis, Ovalis, Trovita and Hamlins Other. If the declared price is higher than or equal to 34 EUR/100 kg
MFN duties (Applied)
16.00% + 18.48 $/Ton
17.43%
080510201904
Fresh sweet oranges : Navels, Navelines, Navelates, Salustianas, Vernas, Valencia lates, Maltese, Shamoutis, Ovalis, Trovita and Hamlins Other. If the declared price is higher than or equal to 33.3 EUR/100 kg
MFN duties (Applied)
16.00% + 27.72 $/Ton
18.15%
080510201905
Fresh sweet oranges : Navels, Navelines, Navelates, Salustianas, Vernas, Valencia lates, Maltese, Shamoutis, Ovalis, Trovita and Hamlins Other. If the declared price is higher than or equal to 32.6 EUR/100 kg
MFN duties (Applied)
16.00% + 36.96 $/Ton
18.86%
080510201906
Fresh sweet oranges : Navels, Navelines, Navelates, Salustianas, Vernas, Valencia lates, Maltese, Shamoutis, Ovalis, Trovita and Hamlins Other. If the declared price is higher than or equal to 26.4 EUR/100 kg
MFN duties (Applied)
16.00% + 93.72 $/Ton
23.26%
080510201907
Fresh sweet oranges : Navels, Navelines, Navelates, Salustianas, Vernas, Valencia lates, Maltese, Shamoutis, Ovalis, Trovita and Hamlins Other. If the declared price is higher than or equal to 25.9 EUR/100 kg
MFN duties (Applied)
16.00% + 93.72 $/Ton
23.26%
080510201908
Fresh sweet oranges : Navels, Navelines, Navelates, Salustianas, Vernas, Valencia lates, Maltese, Shamoutis, Ovalis, Trovita and Hamlins Other. If the declared price is higher than or equal to 25.3 EUR/100 kg
MFN duties (Applied)
16.00% + 93.72 $/Ton
23.26%
080510201909
Fresh sweet oranges : Navels, Navelines, Navelates, Salustianas, Vernas, Valencia lates, Maltese, Shamoutis, Ovalis, Trovita and Hamlins Other. If the declared price is higher than or equal to 24.8 EUR/100 kg
MFN duties (Applied)
16.00% + 93.72 $/Ton
23.26%
080510201910
Fresh sweet oranges : Navels, Navelines, Navelates, Salustianas, Vernas, Valencia lates, Maltese, Shamoutis, Ovalis, Trovita and Hamlins Other. If the declared price is higher than or equal to 24.3 EUR/100 kg
MFN duties (Applied)
16.00% + 93.72 $/Ton
23.26%
080510201911
Fresh sweet oranges : Navels, Navelines, Navelates, Salustianas, Vernas, Valencia lates, Maltese, Shamoutis, Ovalis, Trovita and Hamlins Other. If the declared price is higher than or equal to 0 EUR/100 kg
MFN duties (Applied)
16.00% + 93.72 $/Ton
23.26%
080510209201
Fresh sweet oranges : Other : Sanguines and semi-sanguines Of high quality. If the declared price is higher than or equal to 35.4 EUR/100 kg
MFN duties (Applied)
16.00% 16.00%
080510209202
Fresh sweet oranges : Other : Sanguines and semi-sanguines Of high quality. If the declared price is higher than or equal to 34.7 EUR/100 kg
MFN duties (Applied)
16.00% + 9.24 $/Ton
16.72%
080510209203
Fresh sweet oranges : Other : Sanguines and semi-sanguines Of high quality. If the declared price is higher than or equal to 34 EUR/100 kg
MFN duties
16.00% + 18.48
17.43%

98
HS CODE
PRODUCT DESCRIPTION TRADE REGIME
APPLIED TARIFFS
TOTAL AD VALOREM EQUIVALENT TARIFF
(Applied) $/Ton
080510209204
Fresh sweet oranges : Other : Sanguines and semi-sanguines Of high quality. If the declared price is higher than or equal to 33.3 EUR/100 kg
MFN duties (Applied)
16.00% + 27.72 $/Ton
18.15%
080510209205
Fresh sweet oranges : Other : Sanguines and semi-sanguines Of high quality. If the declared price is higher than or equal to 32.6 EUR/100 kg
MFN duties (Applied)
16.00% + 36.96 $/Ton
18.86%
080510209206
Fresh sweet oranges : Other : Sanguines and semi-sanguines Of high quality. If the declared price is higher than or equal to 26.4 EUR/100 kg
MFN duties (Applied)
16.00% + 93.72 $/Ton
23.26%
080510209207
Fresh sweet oranges : Other : Sanguines and semi-sanguines Of high quality. If the declared price is higher than or equal to 25.9 EUR/100 kg
MFN duties (Applied)
16.00% + 93.72 $/Ton
23.26%
080510209208
Fresh sweet oranges : Other : Sanguines and semi-sanguines Of high quality. If the declared price is higher than or equal to 25.3 EUR/100 kg
MFN duties (Applied)
16.00% + 93.72 $/Ton
23.26%
080510209209
Fresh sweet oranges : Other : Sanguines and semi-sanguines Of high quality. If the declared price is higher than or equal to 24.8 EUR/100 kg
MFN duties (Applied)
16.00% + 93.72 $/Ton
23.26%
080510209210
Fresh sweet oranges : Other : Sanguines and semi-sanguines Of high quality. If the declared price is higher than or equal to 24.3 EUR/100 kg
MFN duties (Applied)
16.00% + 93.72 $/Ton
23.26%
080510209211
Fresh sweet oranges : Other : Sanguines and semi-sanguines Of high quality. If the declared price is higher than or equal to 0 EUR/100 kg
MFN duties (Applied)
16.00% + 93.72 $/Ton
23.26%
080510209401
Fresh sweet oranges : Other Other Sanguines and semi-sanguines Other. If the declared price is higher than or equal to 35.4 EUR/100 kg
MFN duties (Applied)
16.00% 16.00%
080510209402
Fresh sweet oranges : Other Other Sanguines and semi-sanguines Other. If the declared price is higher than or equal to 34.7 EUR/100 kg
MFN duties (Applied)
16.00% + 9.24 $/Ton
16.72%
080510209403
Fresh sweet oranges : Other Other Sanguines and semi-sanguines Other. If the declared price is higher than or equal to 34 EUR/100 kg
MFN duties (Applied)
16.00% + 18.48 $/Ton
17.43%
080510209404
Fresh sweet oranges : Other Other Sanguines and semi-sanguines Other. If the declared price is higher than or equal to 33.3 EUR/100 kg
MFN duties (Applied)
16.00% + 27.72 $/Ton
18.15%

99
HS CODE
PRODUCT DESCRIPTION TRADE REGIME
APPLIED TARIFFS
TOTAL AD VALOREM EQUIVALENT TARIFF
080510209405
Fresh sweet oranges : Other Other Sanguines and semi-sanguines Other. If the declared price is higher than or equal to 32.6 EUR/100 kg
MFN duties (Applied)
16.00% + 36.96 $/Ton
18.86%
080510209406
Fresh sweet oranges : Other Other Sanguines and semi-sanguines Other. If the declared price is higher than or equal to 26.4 EUR/100 kg
MFN duties (Applied)
16.00% + 93.72 $/Ton
23.26%
080510209407
Fresh sweet oranges : Other Other Sanguines and semi-sanguines Other. If the declared price is higher than or equal to 25.9 EUR/100 kg
MFN duties (Applied)
16.00% + 93.72 $/Ton
23.26%
080510209408
Fresh sweet oranges : Other Other Sanguines and semi-sanguines Other. If the declared price is higher than or equal to 25.3 EUR/100 kg
MFN duties (Applied)
16.00% + 93.72 $/Ton
23.26%
080510209409
Fresh sweet oranges : Other Other Sanguines and semi-sanguines Other. If the declared price is higher than or equal to 24.8 EUR/100 kg
MFN duties (Applied)
16.00% + 93.72 $/Ton
23.26%
080510209410
Fresh sweet oranges : Other Other Sanguines and semi-sanguines Other. If the declared price is higher than or equal to 24.3 EUR/100 kg
MFN duties (Applied)
16.00% + 93.72 $/Ton
23.26%
080510209411
Fresh sweet oranges : Other Other Sanguines and semi-sanguines Other. If the declared price is higher than or equal to 0 EUR/100 kg
MFN duties (Applied)
16.00% + 93.72 $/Ton
23.26%
080510209601
Fresh sweet oranges : Other : Of high quality. If the declared price is higher than or equal to 35.4 EUR/100 kg MFN duties (Applied)
16.00% 16.00%
080510209602
Fresh sweet oranges : Other : Of high quality. If the declared price is higher than or equal to 34.7 EUR/100 kg MFN duties (Applied)
16.00% + 9.24 $/Ton
16.72%
080510209603
Fresh sweet oranges : Other : Of high quality. If the declared price is higher than or equal to 34 EUR/100 kg MFN duties (Applied)
16.00% + 18.48 $/Ton
17.43%
080510209604
Fresh sweet oranges : Other : Of high quality. If the declared price is higher than or equal to 33.3 EUR/100 kg MFN duties (Applied)
16.00% + 27.72 $/Ton
18.15%
080510209605
Fresh sweet oranges : Other : Of high quality. If the declared price is higher than or equal to 32.6 EUR/100 kg MFN duties (Applied)
16.00% + 36.96 $/Ton
18.86%
080510209606
Fresh sweet oranges : Other : Of high quality. If the declared price is higher than or equal to 26.4 EUR/100 kg MFN duties
16.00% + 93.72
23.26%
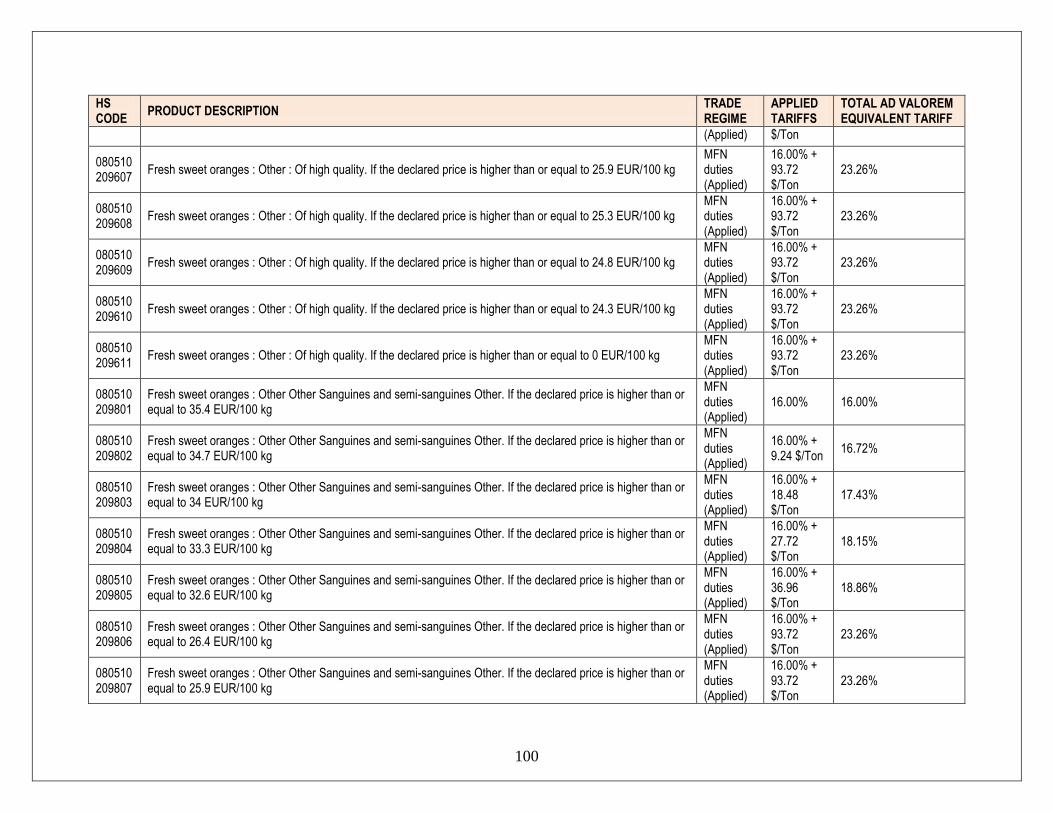
100
HS CODE
PRODUCT DESCRIPTION TRADE REGIME
APPLIED TARIFFS
TOTAL AD VALOREM EQUIVALENT TARIFF
(Applied) $/Ton
080510209607
Fresh sweet oranges : Other : Of high quality. If the declared price is higher than or equal to 25.9 EUR/100 kg MFN duties (Applied)
16.00% + 93.72 $/Ton
23.26%
080510209608
Fresh sweet oranges : Other : Of high quality. If the declared price is higher than or equal to 25.3 EUR/100 kg MFN duties (Applied)
16.00% + 93.72 $/Ton
23.26%
080510209609
Fresh sweet oranges : Other : Of high quality. If the declared price is higher than or equal to 24.8 EUR/100 kg MFN duties (Applied)
16.00% + 93.72 $/Ton
23.26%
080510209610
Fresh sweet oranges : Other : Of high quality. If the declared price is higher than or equal to 24.3 EUR/100 kg MFN duties (Applied)
16.00% + 93.72 $/Ton
23.26%
080510209611
Fresh sweet oranges : Other : Of high quality. If the declared price is higher than or equal to 0 EUR/100 kg MFN duties (Applied)
16.00% + 93.72 $/Ton
23.26%
080510209801
Fresh sweet oranges : Other Other Sanguines and semi-sanguines Other. If the declared price is higher than or equal to 35.4 EUR/100 kg
MFN duties (Applied)
16.00% 16.00%
080510209802
Fresh sweet oranges : Other Other Sanguines and semi-sanguines Other. If the declared price is higher than or equal to 34.7 EUR/100 kg
MFN duties (Applied)
16.00% + 9.24 $/Ton
16.72%
080510209803
Fresh sweet oranges : Other Other Sanguines and semi-sanguines Other. If the declared price is higher than or equal to 34 EUR/100 kg
MFN duties (Applied)
16.00% + 18.48 $/Ton
17.43%
080510209804
Fresh sweet oranges : Other Other Sanguines and semi-sanguines Other. If the declared price is higher than or equal to 33.3 EUR/100 kg
MFN duties (Applied)
16.00% + 27.72 $/Ton
18.15%
080510209805
Fresh sweet oranges : Other Other Sanguines and semi-sanguines Other. If the declared price is higher than or equal to 32.6 EUR/100 kg
MFN duties (Applied)
16.00% + 36.96 $/Ton
18.86%
080510209806
Fresh sweet oranges : Other Other Sanguines and semi-sanguines Other. If the declared price is higher than or equal to 26.4 EUR/100 kg
MFN duties (Applied)
16.00% + 93.72 $/Ton
23.26%
080510209807
Fresh sweet oranges : Other Other Sanguines and semi-sanguines Other. If the declared price is higher than or equal to 25.9 EUR/100 kg
MFN duties (Applied)
16.00% + 93.72 $/Ton
23.26%

101
HS CODE
PRODUCT DESCRIPTION TRADE REGIME
APPLIED TARIFFS
TOTAL AD VALOREM EQUIVALENT TARIFF
080510209808
Fresh sweet oranges : Other Other Sanguines and semi-sanguines Other. If the declared price is higher than or equal to 25.3 EUR/100 kg
MFN duties (Applied)
16.00% + 93.72 $/Ton
23.26%
080510209809
Fresh sweet oranges : Other Other Sanguines and semi-sanguines Other. If the declared price is higher than or equal to 24.8 EUR/100 kg
MFN duties (Applied)
16.00% + 93.72 $/Ton
23.26%
080510209810
Fresh sweet oranges : Other Other Sanguines and semi-sanguines Other. If the declared price is higher than or equal to 24.3 EUR/100 kg
MFN duties (Applied)
16.00% + 93.72 $/Ton
23.26%
080510209811
Fresh sweet oranges : Other Other Sanguines and semi-sanguines Other. If the declared price is higher than or equal to 0 EUR/100 kg
MFN duties (Applied)
16.00% + 93.72 $/Ton
23.26%
0805108010
Fresh or dried oranges (excl. fresh sweet oranges) : Fresh MFN duties (Applied)
16.00% 16.00%
0805108090
Fresh or dried oranges (excl. fresh sweet oranges) : Other MFN duties (Applied)
16.00% 16.00%
Source: MacMap, ITC