a profile of health among massachusetts adults, 2011 · web viewa profile of health among...
TRANSCRIPT

A Profile of Health Among Massachusetts
Adults, 2011Results from the Behavioral Risk Factor
Surveillance System
HEALTH SURVEY PROGRAMDIVISION OF RESEARCH AND EPIDEMIOLOGY
BUREAU FOR HEALTH INFORMATION, STATISTICS, RESEARCH, AND EVALUATION
MASSACHUSETTS DEPARTMENT OF PUBLIC HEALTH

January 2013

Health Survey Program
Division of Research and EpidemiologyBureau of Health Information, Statistics, Research, and Evaluation
A Profile of Health AmongMassachusetts Adults, 2011
Results from the Behavioral Risk Factor Surveillance System
Deval L. Patrick, GovernorTimothy P. Murray, Lieutenant Governor
John Polanowicz, Secretary of Health and Human ServicesLauren Smith, MD, Interim Commissioner, Department of Public Health
Bureau of Health Information, Statistics, Research and Evaluation Gerald F. O’Keefe, Director
Bruce Cohen, Director, Division of Research and Epidemiology
January 2013
Massachusetts Department of Public Health

ACKNOWLEDGEMENTSThe staff of the Health Survey Program prepared this release:
Maria McKenna, MPH, EpidemiologistDiane Gonsalves, MS, MPH, EpidemiologistBertina Backus, MPH, EpidemiologistLiane Tinsley, MPH, Senior EpidemiologistHelen Hawk, PhD, Director
We wish to express our gratitude to the residents of Massachusetts who participated in this survey, and to Abt SRBI, Inc. and the dedicated interviewers who helped make this survey possible. We also wish to acknowledge the contributions of the staff of the many programs within the Massachusetts Department of Public Health who provided topical overviews and reviewed draft sections of this release relevant to their areas of expertise. For further information about this report, about the Behavioral Risk Factor Surveillance System, or the Health Survey Program, please contact: Helen Hawk, Health Survey Program, Bureau of Health Information, Statistics, Research and Evaluation, Massachusetts Department of Public Health, 250 Washington Street, 6th floor, Boston, MA 02108-4619. Telephone: (617) 624-5623. Email: [email protected]. Website: http://www.mass.gov/dph/hsp
2

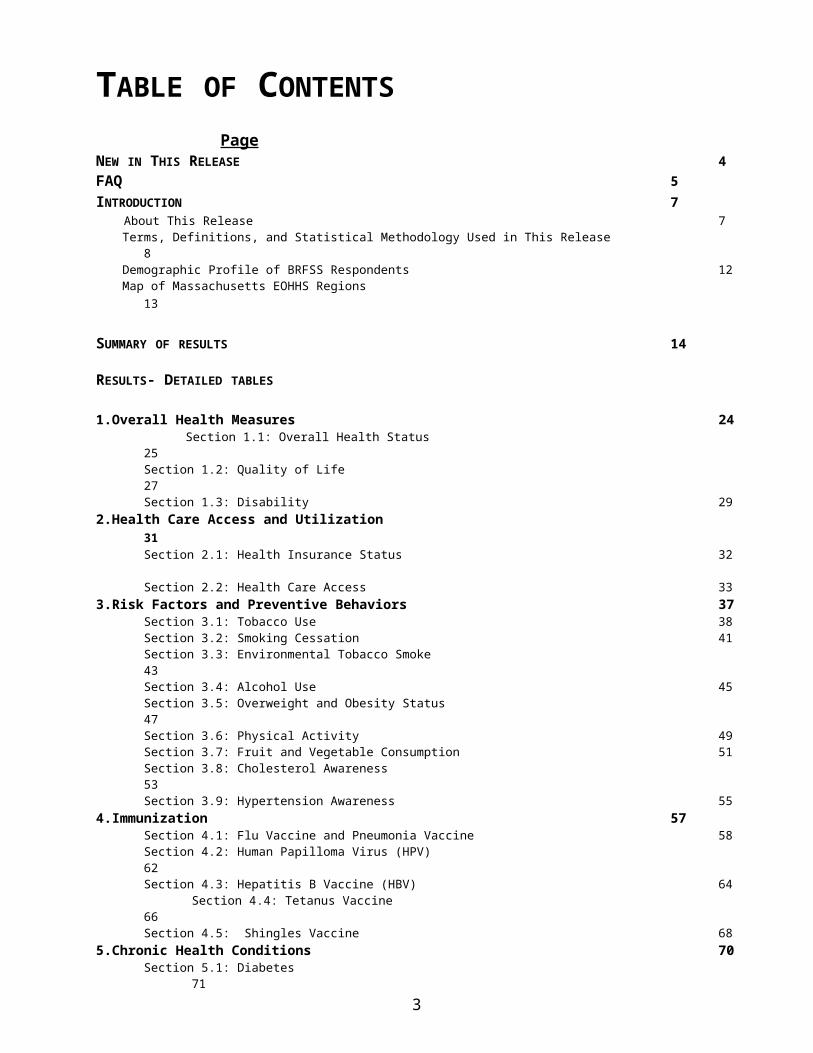
TABLE OF CONTENTS Page
NEW IN THIS RELEASE 4FAQ 5 INTRODUCTION 7
About This Release 7 Terms, Definitions, and Statistical Methodology Used in This Release 8 Demographic Profile of BRFSS Respondents 12 Map of Massachusetts EOHHS Regions 13
SUMMARY OF RESULTS 14
RESULTS- DETAILED TABLES 1.Overall Health Measures 24
Section 1.1: Overall Health Status 25Section 1.2: Quality of Life 27Section 1.3: Disability 29
2.Health Care Access and Utilization 31Section 2.1: Health Insurance Status 32Section 2.2: Health Care Access 33
3.Risk Factors and Preventive Behaviors 37Section 3.1: Tobacco Use 38Section 3.2: Smoking Cessation 41Section 3.3: Environmental Tobacco Smoke 43Section 3.4: Alcohol Use 45Section 3.5: Overweight and Obesity Status 47Section 3.6: Physical Activity 49Section 3.7: Fruit and Vegetable Consumption 51Section 3.8: Cholesterol Awareness 53Section 3.9: Hypertension Awareness 55
4.Immunization 57Section 4.1: Flu Vaccine and Pneumonia Vaccine 58Section 4.2: Human Papilloma Virus (HPV) 62Section 4.3: Hepatitis B Vaccine (HBV) 64
Section 4.4: Tetanus Vaccine 66Section 4.5: Shingles Vaccine 68
5.Chronic Health Conditions 70Section 5.1: Diabetes 71Section 5.2: Asthma 73 Section 5.3: Chronic Obstructive Pulmonary Disease (COPD) 75Section 5.4: Heart Disease and Stroke 77Section 5.5: Arthritis 80Section 5.6: Cancer Diagnosis 82Section 5.7: Depression 84
6.Other Topics 86Section 6.1: Sexual Orientation 87Section 6.2: HIV Testing 89Section 6.3: Sexual Violence 91Section 6.4: Seatbelt Use 93
Appendix 95 Age Adjusted Percentages for Selected Topics 96Massachusetts Estimates and Healthy People 2020 105
Massachusetts and National Estimates 106Item-Specific Non-Response 107
Addendum 108 Limitations 122References 123
3
NEW IN THIS RELEASE
The overall presentation style of the release remains the same as in previous years.
In 2008, Massachusetts BRFSS was among the first states to pilot a multimode survey in order to improve the coverage of the state’s adult population including cell phone-only households. However, until 2011 the results for cell phone only households were not reported and were not included in the analytical files. In addition, the Centers for Disease Control developed and implemented a new weighting methodology for the BRFSS in order to account for socio-demographic differences in the population and improve the quality of the data.
This release is the first to include data based on the combined landline and cell phone samples and to utilize the new weighting methodology.
Due to these changes, data from 2011 are not comparable with data from previous years, thus data from 2011 should not be aggregated with data from previous years.
For more information on the changes in sample design and methodology, please refer to the FAQ section in this release. An addendum included at the end of this release shows estimates for selected indicators for the years 2010 and 2011 as well as CDC documentation and examples regarding these changes.
Two new topics have been added to this year’s release: Adults diagnosed with Chronic Obstructive Pulmonary Disease (Section 5.3) Adults diagnosed with a depressive disorder (Section 5.7)
4

Frequently Asked QuestionsChanges to the Behavioral Risk Factor Surveillance System1
Q: What is the BRFSS?A: The Behavioral Risk Factor Surveillance System (BRFSS) is a state-based system of health surveys established by the Centers for Disease Control and Prevention (CDC) in 1984. BRFSS completes more than 400,000 adult interviews each year, with approximately 15,000 interviews in Massachusetts, making it the largest ongoing telephone-based health survey in the world.
BRFSS surveys a representative sample of adults in each state to obtain information on health risk behaviors, preventive health practices, and healthcare access primarily related to chronic disease and injury.
For most states, BRFSS is their only source of population-based health behavior data about chronic disease prevalence and behavioral risk factors.
Q: What are the changes that have been made to BRFSS?A: Two changes have been made to BRFSS in order to ensure its data remains valid and accurately represents its target population of adults ≥18 years of age who do not live in institutional settings.
The first change is including and then increasing the number of interview calls made to cellular telephone numbers.
The second change is to replace the “post-stratification” weighting method with a more advanced method called ”iterative proportional fitting,” also sometimes called “raking.”
Q: Why is it necessary to increase the number of survey calls to cell phone numbers?A: During 2003—2009, the proportion of U.S. adults who lived in cell phone-only households increased by more than 700%, and this trend is continuing. CDC estimates that currently 3 in 10 U.S. households have only cellular phones. These households increasingly were left out of the population that BRFSS seeks to characterize—adults 18 years of age or older who do not live in institutional settings. Cell-phone-only use is especially strong in younger age groups and among persons in certain racial and ethnic minority groups. Because of differences in the characteristics of people living in households with or without landlines, all telephone surveys in the United States have had to adapt their methods in response to the significant increase in cell-phone-only households.
Q: Why is it necessary to adopt a different method of data weighting?A: For the past several decades, BRFSS used a statistical weighting method called “post-stratification.” However, the advent of easily accessible ultra-fast computer processors and networks has allowed the BRFSS to adopt an advanced weighting method called iterative proportional fitting, also known by its nickname, “raking.” Raking differs from post-stratification because it incorporates adjustor variables one at a time in an iterative process, rather than imposing weights for demographic subgroups in a single process. A principle advantage of raking is that it allows the use of many more adjustor variables than post stratification. Ultimately, this yields a more accurate weighting process and more accurate estimates of the prevalence of health-related behaviors. The use of raking allows for consideration of demographic variables such as education level, marital status, renter or owner status, and phone source, in addition to the standard age, gender, and race and ethnicity variables.
Q: What steps were taken to implement these BRFSS changes?A: In 2004 a panel of national survey experts recommended that CDC make the two changes to
1 Centers for Disease Control and Prevention. BRFSS Frequently Asked Questions. Retrieved on June 28, 2012 from http://www.cdc.gov/surveillancepractice/reports/brfss/brfss_faqs.html
5

ensure BRFSS data remained valid and useful. Beginning in 2006, how to best design and implement the changes went through an extensive development process with experts, collaboration with the state BRFSS coordinators to pilot test the new methods, and training to ensure that state BRFSS coordinators understood the changes and the rationale for them. The changes were discussed at the annual BRFSS Conferences in 2007, 2008, 2009, 2010 and 2011; with CDC and state members of the BRFSS Working Group; at training sessions; and at meetings of NACCHO, APHA, CSTE, and the American Association of Polling and Opinion Research (AAPOR) in 2009, 2010, and 2011.
Q: How will these two changes affect each state’s dataset?A: Including cell phone interviews and using the new weighting method will, together, improve the BRFSS data. Specifically, the BRFSS will better represent lower-income and minority populations, as well as populations with lower levels of formal education. The size and direction of the effects will vary by state, the behavior under study, and other factors. Although generalizing is perilous because of this variability, it is likely that the methodology changes will result in somewhat higher prevalence estimates for behaviors more common among younger adults.
Q: When will we first see BRFSS data that reflects the two changes?A: The first data reflecting the changes is the BRFSS 2011 dataset that CDC releases in August 2012.
Q: Can the 2010 BRFSS dataset be compared with 2011 dataset?A: While it is always difficult to discern long-term trends by comparing one year to the next, such comparisons will be especially difficult to make for 2010 and 2011, given the change in BRFSS methods. Changes in the 2011 data are likely to show indications of somewhat higher occurrences of risk behaviors common to younger adults and to certain racial or ethnic minority groups. Such effects will vary for each state survey. If a state has a large young-adult population, it might see estimates in certain categories, such as tobacco use, increase notably. CDC anticipates small increases for other health-risk indicators such as obesity, binge drinking, HIV, asthma, and health status. Shifts in observed prevalence from 2010 to 2011 for BRFSS measures will likely reflect improved methods of measuring risk factors, rather than true trends in risk-factor prevalence.
Q: Where can I learn more about the BRFSS changes?A: The BRFSS changes are discussed in detail in the June 8, 2012, MMWR Policy Note “Potential Effects on Prevalence Estimates from Improvements in Weighting and Data Collection Methods—Behavioral Risk Factor Surveillance System, 2011” which is available online at http://www.cdc.gov/mmwr/PDF/wk/mm6122.pdf.
6

INTRODUCTIONThe Behavioral Risk Factor Surveillance System (BRFSS) is a continuous multimode survey of adults ages 18 and older and is conducted in all states as a collaboration between the federal Centers for Disease Control and Prevention (CDC) and state departments of health. The landline telephone portion of the survey has been conducted in Massachusetts since 1986. The BRFSS collects data on a variety of health risk factors, preventive behaviors, chronic conditions, and emerging public health issues. The information obtained in this survey assists in identifying the need for health interventions, monitoring the effectiveness of existing interventions and prevention programs, developing health policy and legislation, and measuring progress toward attaining state and national health objectives.
Each year, the BRFSS includes a core set of questions developed by the CDC. In 2011, these questions addressed health status, health care access and utilization, overweight and obesity status, asthma, diabetes, immunizations, tobacco use, alcohol consumption, HIV/AIDS testing and other selected public health topics.
In addition to the core CDC questions, the Massachusetts Health Survey Program, in collaboration with other Massachusetts Department of Public Health programs, added a number of topics to the surveillance instrument including environmental tobacco exposure, disability and quality of life, cancer survivorship, sexual violence, and other selected topics. Interviews were administered in the respondents’ preferred language, with a choice of English, Spanish, or Portuguese. In 2011, 20,492 landline interviews and 1,836 cell phone interviews were completed among Massachusetts adults. To increase the number of respondents who belong to racial and/or ethnic minority groups, the cities of Boston, Brockton, Lowell, Lynn, New Bedford, Quincy, Springfield, and Worcester were oversampled.
This release summarizes selected results from the combined landline and cell phone portions of the 2011 Massachusetts BRFSS. Some of the key findings are discussed in the Summary of Results. In each section of the release, a description of survey questions used to obtain estimates for key variables is provided along with an explanation of the importance of each indicator for public health. Tables detailing the overall estimates and estimates by demographic and socioeconomic characteristics (gender, age, race-ethnicity, disability status, education, annual household income, and Massachusetts health service regions) are provided in the main body of the release in the form of crude percentages.
In the Appendix of the release, tables are presented detailing age-adjusted percentages for 2011 indicators and their 95% confidence intervals. United States (US) median data for all participating states and territories for variables with comparable national data are presented for 2011 in a separate table. The Healthy People 2020 objectives are presented separately as a new challenging goal for public health.
All percentages in this release are weighted (see definition in next section) to the total Massachusetts population in 2011.
An addendum included at the end of this release shows estimates for selected indicators for the years 2010 and 2011 as well as CDC documentation and examples regarding these changes.
7
ABOUT THIS RELEASE

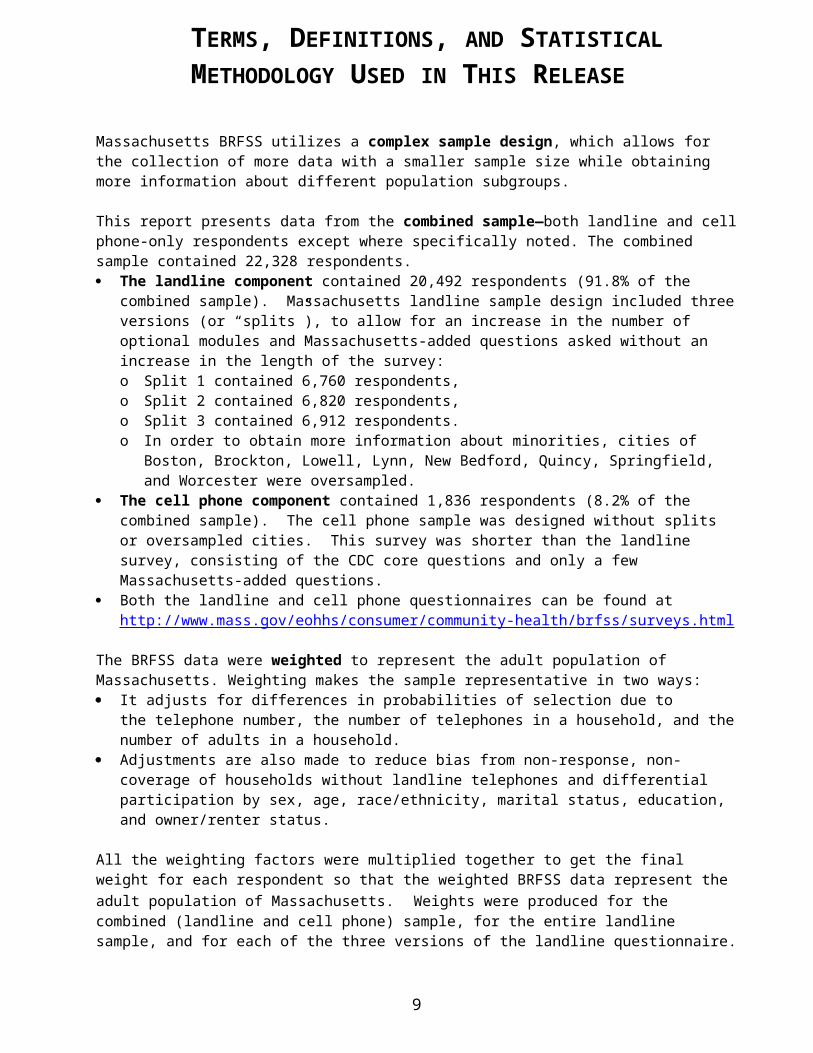
Massachusetts BRFSS utilizes a complex sample design, which allows for the collection of more data with a smaller sample size while obtaining more information about different population subgroups.
This report presents data from the combined sample—both landline and cell phone-only respondents except where specifically noted. The combined sample contained 22,328 respondents. The landline component contained 20,492 respondents (91.8% of the combined sample).
Massachusetts landline sample design included three versions (or “splits”), to allow for an increase in the number of optional modules and Massachusetts-added questions asked without an increase in the length of the survey: o Split 1 contained 6,760 respondents, o Split 2 contained 6,820 respondents, o Split 3 contained 6,912 respondents. o In order to obtain more information about minorities, cities of Boston, Brockton, Lowell,
Lynn, New Bedford, Quincy, Springfield, and Worcester were oversampled. The cell phone component contained 1,836 respondents (8.2% of the combined sample). The
cell phone sample was designed without splits or oversampled cities. This survey was shorter than the landline survey, consisting of the CDC core questions and only a few Massachusetts-added questions.
Both the landline and cell phone questionnaires can be found at http://www.mass.gov/eohhs/consumer/community-health/brfss/surveys.html
The BRFSS data were weighted to represent the adult population of Massachusetts. Weighting makes the sample representative in two ways: It adjusts for differences in probabilities of selection due to the telephone number, the number
of telephones in a household, and the number of adults in a household. Adjustments are also made to reduce bias from non-response, non-coverage of households
without landline telephones and differential participation by sex, age, race/ethnicity, marital status, education, and owner/renter status.
All the weighting factors were multiplied together to get the final weight for each respondent so that the weighted BRFSS data represent the adult population of Massachusetts. Weights were produced for the combined (landline and cell phone) sample, for the entire landline sample, and for each of the three versions of the landline questionnaire.
The underlying sample size (N) in each cell of the presented tables is the number of people who answered “yes” or “no” to the corresponding question. The crude proportion is a weighted ratio of those who answered “yes” to the corresponding question versus all who responded to the question. Those who responded “don’t know” or refused to respond to a question were excluded from the analysis of that question. The underlying size of the sample used to produce particular estimates varies depending on whether the data come from the combined land line and cell phone sample or from one of the sample splits through which some of the optional modules and Massachusetts-added questions were administered.
The crude percentage is the weighted proportion of respondents in a particular category. When percentages are reported in the text of this release, they are referring to crude percentages. The crude percentage of respondents used in this release reflects the burden of a certain health status indicator in a specific group of the population e.g. age group, gender etc.
The age-adjusted percentage is a weighted average of the age-specific proportions. The projected 2000 US population was used as a standard for the calculation. These estimates are presented in
9
TERMS, DEFINITIONS, AND STATISTICAL METHODOLOGY USED IN THIS RELEASE

tables in the Appendix of this release. The age-adjusted percentage is a single, calculated number. Age-adjustment is done in order to be able to compare population subgroups with potentially different age structures (e.g., Hispanic vs. White non-Hispanic). The reader should exercise caution when using age-adjusted percentages for the comparison of survey data subgroups. While the estimates have been adjusted by age, other factors like gender, income, or education and their possible correlation may also have an impact on the results of subgroup comparisons (see Appendix). The percentages were not age-adjusted for health indicators obtained for restricted age groups such as cancer screening.
The data presented here are univariate, descriptive percentages that are either crude or age-adjusted. No multivariate analysis was performed on this data. In addition, all data presented here are cross-sectional and thus this release contains no inferences about causality
The US median was calculated for the estimates from all participating states, the District of Columbia, and territories for each respective indicator when available. The values were ordered from lowest to highest and the middle value is then chosen (if the number of values is odd) or calculated as the average of the two middle values (if the number of values is even). The median then represents a value for which half of the states have higher estimates and half of the states have lower estimates.
The 95% confidence interval (95% CI) is a range of values determined by the degree of variability of the data within which the true value is likely to lie. The confidence interval indicates the precision of a calculation; the wider the interval the less precision in the estimate. The 95% confidence intervals used in this release for crude and age-adjusted percentages are the indicators of reliability (or stability) of the estimate. Smaller population subgroups or smaller numbers of respondents yield less precise estimates.
Suppression of the presented estimates:a) Estimates and their 95% confidence intervals are not presented in the tables if the
underlying sample size is less than 50 respondents. b) Following recommendations of the National Center for Health Statistics, data are not
presented in the tables if a ratio of standard error to the estimate itself exceeds 30% (relative standard error of greater than 30%). Standard error of the estimate is a measure of its variability. Bigger standard errors yield wider confidence intervals and less reliable estimates.2
Statistical significance (at the 95% probability level) was considered as a basis when we used the terms “more likely”, “less likely”, “about the same“, “increase” or “decrease.” Differences between percentages for respective subgroups are presented when a difference is statistically significant.
We considered the difference between two percentages to be statistically significant (with 95% probability) if the 95% confidence intervals surrounding the two percentages do not overlap, which is a conservative estimation for determining statistical significance.3 We use the terms “more likely” or “less likely” when comparing percentages that met the criteria for statistical significance.
Disability was defined as having one or more of the following conditions: (1) physical, mental, or emotional problem that limited activities or caused cognitive difficulties; or (2) use special equipment or require help from others to get around. This definition is consistent with CDC criteria but differs from the definition used in previous years’ reports. Massachusetts historically has used more stringent criteria, requiring that the disability has persisted for at least one year. The question relating to duration of disability is state-added and was not asked on the cell phone survey.
2 National Center for Health Statistics. (January 11, 2007). Reliability of Survey Estimates. Retrieved August 2, 2007, from http://www.cdc.gov/nchs/about/major/ahcd/reliability.htm3 Rosner, B. (2005). Fundamentals of Biostatistics, 6th Ed. Pacific Grove, CA: Duxbury Press.
10

Race-ethnicity categories in this release include White, Black, Hispanic, and Asian. When referring to White, Black, or Asian, these categories include only non-Hispanic respondents. All respondents reporting Hispanic ethnicity are included in the Hispanic category regardless of race.
Healthy People 2020 Objectives: Healthy People 2020: National Health Promotion and Disease Prevention Objectives is a national agenda that aims to significantly improve the health of Americans in the decade preceding the year 2020. Developed through an extensive governmental, professional, and public national process, Healthy People 2020 defined four overarching national goals to: attain high-quality, longer lives free of preventable disease, disability, injury, and premature death; achieve health equity, eliminate disparities, and improve the health of all groups; create social and physical environments that promote good health for all; and promote quality of life, healthy development, and healthy behaviors across all life stages. These goals are organized into 41 Objective Topic Areas, and each area contains specific numeric national targets for the year 2020.4 For each health status indicator in this release that has a corresponding Healthy People 2020 Objective, the year 2020 target is shown in the summary table at the end of the document.
4 U.S. Dept. of Health and Human Services. Healthy People 2020. Retrieved on March 2, 2011, from http://www.healthypeople.gov/2020/default.aspx
11

DEMOGRAPHIC CHARACTERISTICS OF RESPONDENTSMASSACHUSETTS BEHAVIORAL RISK FACTOR SURVEILLANCE SYSTEM, 2011
UNWEIGHTED SAMPLE SIZE WEIGHTED PERCENT
N %†
OVERALL 22,328 100
GENDER
MALE 8,479 47.9FEMALE 13,849 52.1
AGE GROUP
18–24 808 12.825–34 2,190 16.735–44 3,147 17.545–54 4,481 19.755–64 4,853 15.065–74 3,469 9.475 AND OLDER 2,970 8.7
RACE-ETHNICITY*WHITE 17,927 81.9BLACK 1,408 5.4HISPANIC 1,725 8.1ASIAN 462 4.6
DISABILITY¶DISABILITY 5,772 23.0NO DISABILITY 14,522 77.0
EDUCATION
< HIGH SCHOOL 1,820 11.3HIGH SCHOOL 5,743 27.0COLLEGE 1–3 YRS 5,242 26.3COLLEGE 4+ YRS 9,346 35.4
HOUSEHOLD INCOME
<$25,000 5,175 24.0$25,000–34,999 1,966 10.0$35,000–49,999 2,502 13.4$50,000–74,999 2,743 15.4$75,000+ 6,260 37.1
REGION
I–WESTERN 2,981 15.7II–CENTRAL 2,824 15.3III–NORTH EAST 5,129 18.2IV–METRO WEST 3,208 20.7V–SOUTH EAST 5,359 20.5VI–BOSTON 2,271 9.6
* White, Black, and Asian race categories refer to non-Hispanic† See BRFSS methodology in “Terms, Definitions and Methodology Used in this Release”¶ Disability defined as having one or more of the following conditions: (1) physical, mental, or emotional problem that limited activities or caused cognitive difficulties; or (2) used special equipment or required help from others to get around. Please note that this differs from the definition used in previous years’ reports.
12
13

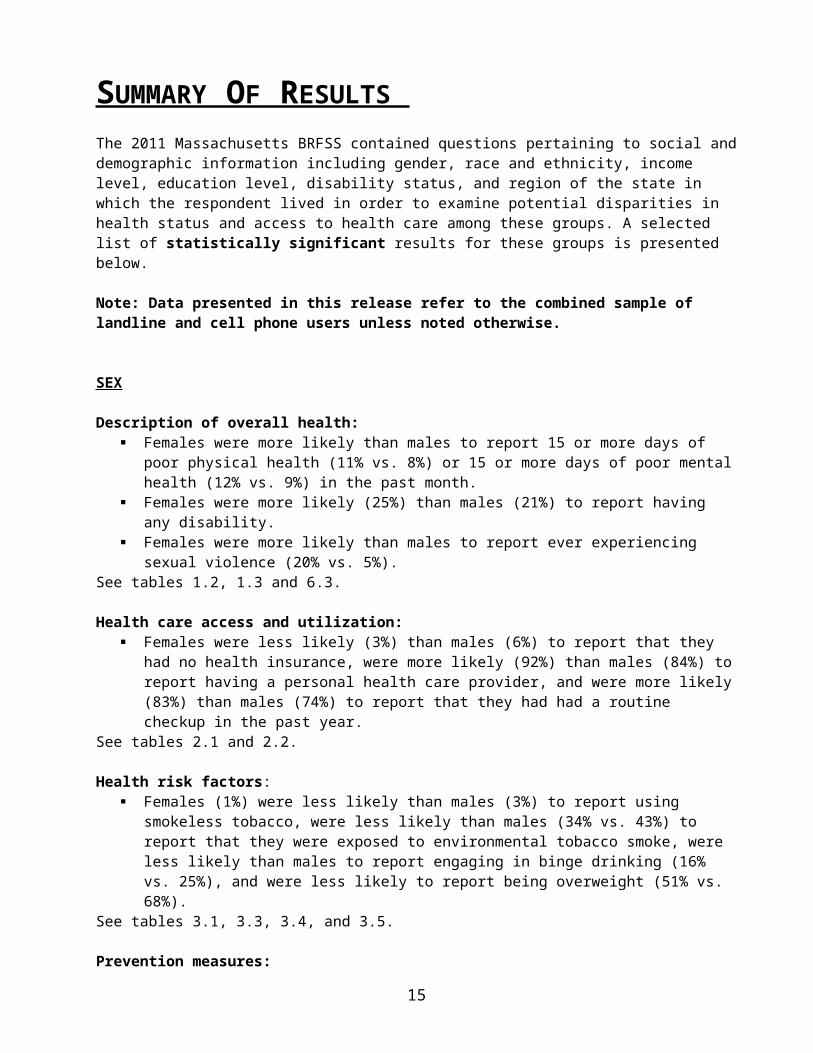
SUMMARY OF RESULTS The 2011 Massachusetts BRFSS contained questions pertaining to social and demographic information including gender, race and ethnicity, income level, education level, disability status, and region of the state in which the respondent lived in order to examine potential disparities in health status and access to health care among these groups. A selected list of statistically significant results for these groups is presented below.
Note: Data presented in this release refer to the combined sample of landline and cell phone users unless noted otherwise.
SEX
Description of overall health: Females were more likely than males to report 15 or more days of poor physical health
(11% vs. 8%) or 15 or more days of poor mental health (12% vs. 9%) in the past month. Females were more likely (25%) than males (21%) to report having any disability. Females were more likely than males to report ever experiencing sexual violence (20% vs.
5%).See tables 1.2, 1.3 and 6.3.
Health care access and utilization: Females were less likely (3%) than males (6%) to report that they had no health insurance,
were more likely (92%) than males (84%) to report having a personal health care provider, and were more likely (83%) than males (74%) to report that they had had a routine checkup in the past year.
See tables 2.1 and 2.2.
Health risk factors: Females (1%) were less likely than males (3%) to report using smokeless tobacco, were
less likely than males (34% vs. 43%) to report that they were exposed to environmental tobacco smoke, were less likely than males to report engaging in binge drinking (16% vs. 25%), and were less likely to report being overweight (51% vs. 68%).
See tables 3.1, 3.3, 3.4, and 3.5.
Prevention measures: Females were less likely (28%) than males (36%) to report meeting recommendations for
muscle strengthening activity. Females were more likely than males to report consuming 5 or more servings of fruits and
vegetables daily (23% vs. 15%) Females were more likely (85%) than males (82%) to report having their cholesterol
checked in the past five years. Females (28%) were less likely than males (31%) to report high blood pressure, but among
those with high blood pressure, females were more likely (83%) than males (71%) to report taking medication to control their blood pressure.
Females age 18-49 were more likely to have received a flu vaccination in the past year (39%) than males in the same age group (32%)
Females ages 65 and older were more likely (75%) than males in the same age group (68%) to have ever received a pneumonia vaccination.
Females were more likely than males to have ever received the Hepatitis B vaccine series (40% vs. 33%).
14

Females ages 50 and older were more likely than males in the same age group to have ever received the shingles vaccine (12% vs. 9%).
Females (85%) were more likely than males (74%) to report always wearing a seatbelt when driving or riding in a car.
See tables 3.6, 3.7, 3.8, 3.9, 4.1.1, 4.1.3, 4.3, 4.5, and 6.4.
Chronic health conditions: Females were more likely (13%) than males (8%) to report that they currently have asthma
and to report ever being diagnosed with asthma (18% vs. 13%). Females were more likely than males to have ever been diagnosed with COPD (7% vs.
5%). Females were more likely than males to have ever been diagnosed with arthritis (27% vs.
20%). Females were more likely than males to have ever been diagnosed with cancer (12% vs.
9%). Females were more likely than males to have ever been diagnosed with depression (20%
vs. 14%). Males were more likely than females to report that they had ever experienced a heart attack
(7% vs. 3%) or angina (7% vs. 4%).See tables 5.2, 5.3, 5.4.1, 5.5, 5.6 and 5.7.
AGE
Discussed below are selected statistically significant differences in health and behavioral indicators observed in three broad age groups: young (18-34), middle-aged (35-64) and older (65+) respondents. Some preventive health measures are recommended for people ages 50 and over and therefore the variables dealing with these activities address only prevalence among the adult population in those age groups. Questions about certain health indicators were not asked of respondents 65 years and older; in these cases, comparisons were made between the two younger age groups.
Description of overall health:Adults ages 18-34 were:
Less likely (8%) to report that their health was fair or poor than adults ages 35-64 (14%) or adults ages 65 and older (24%)
Less likely to experience 15 or more days of poor physical health in the past month (4%) than adults ages 35-64 (11%) or adults ages 65 and older (15%).
Adults ages 65 and older were: More likely to report a disability (36%) than were adults ages 18-34 (13%) or adults ages
35-64 (24%).See tables 1.1, 1.2 and 1.3.
Health care access and utilization:Adults ages 18-34 were:
Less likely to report having a personal health care provider (77%) than adults ages 35-64 (92%) or adults ages 65 and older (96%).
More likely to report not being able to see a doctor at some point in the past year due to cost (12%) than adults ages 65 and older (3%).
Less likely to report having a routine checkup in the past year (69%) than adults ages 35-64 (80%) or adults ages 65 and older (93%).
See table 2.2.
Health risk factors: Adults ages 18-34 were:
15

More likely to report current smoking (25%) than adults ages 35-64 (18%) or adults ages 65 or older (9%).
More likely to use smokeless tobacco (3%) than adults in any other age group. More likely to report exposure to environmental tobacco smoke (55%) than adults ages 35-
64 (35%) or adults ages 65 or older (21%), and were less likely to report living in a home where smoking is not allowed (76%) than adults ages 35-64 (82%) or adults ages 65 and older (84%).
More likely to report heavy drinking (11%) and binge drinking (35%) than adults ages 35-64 (7% heavy drinking, 18% binge drinking) or adults ages 65 and older (6% heavy drinking, 5% binge drinking).
Less likely to be obese (17%) than adults ages 35-64 (27%) or adults ages 65 and older (23%).
Less likely to report having high cholesterol (13%) than adults ages 35-64 (36%) or adults ages 65 and older (52%).
Less likely to report always wearing a seatbelt when driving or riding in an automobile (73%) than adults ages 35-64 (82%) or adults ages 65 and older (84%).
See tables 3.1, 3.3, 3.4, 3.5, 3.8 and 6.4.
Prevention measures:Adults ages 18-34 were:
More likely to meet recommendations for muscle strengthening activity (40%) than adults ages 35-64 (30%) or adults ages 65 and older (25%).
More likely to report receiving the Hepatitis B vaccine series (59%) than adults ages 35-64 (33%) or adults ages 65 and older (13%).
More likely to report having received a tetanus shot in the past ten years (85%) than adults ages 35-64 (77%) or adults ages 65 and older (64%).
More than three times as likely as adults ages 35-64 to have been tested for HIV in the past year (20% vs. 6%).
Adults ages 65 and older were: More likely to report ever receiving the shingles vaccine (20%) than adults ages 50-64 (5%)
See tables 3.6, 4.3, 4.4, 4.5, and 6.2.
Chronic health conditions: Adults ages 18-34 were:
More likely to report that they had ever been diagnosed with asthma (20%) and that they still have asthma (12%) than adults ages 65 and older (12% ever diagnosed, 8% current).
More likely to report that they had ever been diagnosed with depression (18%) than adults ages 65 and older (12%).
Adults ages 65 and older were: More likely to report having high blood pressure (60%) than adults ages 18-34 (10%) or
adults ages 35-64 (29%). More likely to report ever having been diagnosed with pre-diabetes (11%) or diabetes
(18%) than adults ages 35-64 (6% pre-diabetes, 8% diabetes) or adults ages 18-34 (3% pre-diabetes, 2% diabetes).
More likely to have been diagnosed with COPD (13%) than adults ages 18-34 (2%) or adults ages 35-64 (6%).
More likely to have been diagnosed with a heart attack (11%), angina (12%), or a stroke (8%) than adults ages 35-64 (3% for both heart attack and angina, 2% for stroke).
More likely to have been diagnosed with arthritis (51%) or have limitations due to arthritis (21%) than adults ages 18-34 (5% arthritis, 2% limitations) or adults ages 35-64 (25% arthritis, 12% limitations).
More likely to report that they had ever been diagnosed with any type of cancer (30%) than adults ages 18-34 (2%) or adults ages 35-64 (10%).
See tables 3.9, 5.1, 5.2, 5.3, 5.4, 5.5, 5.6 and 5.7.
16

RACE/ETHNICITY
All figures and percentages concerning race/ethnicity disparities presented below refer to age-adjusted proportions in order to reduce the confounding effect of different age composition of population subgroups. Age-adjusted percentages will differ from those found in Sections 1-6 of this report and are presented in the Appendix (pp 95-104) (See p.9 for more details about the age adjustment). This does not include some preventive measure indicators where the age ranges were restricted.
Description of overall health: Hispanic adults (33%) and Black adults (20%) were more likely to report fair or poor health
than White adults (12%) or Asian adults (10%). Hispanic adults were more likely than White adults to report poor physical health (15% vs.
9%) and poor mental health (14% vs. 11%) Hispanic women (13%) were less likely to report ever experiencing sexual violence than
White women (21%).See appendix for age-adjusted tables.
Health care access and utilization: Black adults (82%) and Hispanic adults (79%) were less likely to have a personal health
care provider than White adults (90%). Hispanic adults (17%) and Black adults (17%) were more likely to report not being able to
see a doctor at some point in the past year due to cost than White adults (9%) and Asian adults (5%).
See appendix for age-adjusted tables.
Health risk factors: White adults were more likely to report binge drinking (24%) than either Black adults (15%)
or Hispanic adults (15%). Asian adults were the least likely of all racial/ethnic groups to report binge drinking (7%).
Black (69%) and Hispanic (69%) adults were more likely to report being overweight than White (58%) adults. Asian adults were the least likely of all racial/ethnic groups to report being overweight (36%).
Black (33%) and Hispanic (33%) adults were more likely to report being obese than White (22%) adults. Asian adults were the least likely of all racial/ethnic groups to report being obese (6%).
Hispanic adults (73%) were less likely than White adults (84%) or Black adults (80%) to have had cholesterol checked in the past five years.
See appendix for age-adjusted tables.
Prevention measures: Hispanic adults (44%) were less likely than White adults (58%), Black adults (54%) or Asian
adults (56%) to have met recommendations for aerobic activity in the past month. Of those ages 65 and older, Black adults (47%) were less likely to report having had the flu
vaccine in the past year than White adults (68%); in addition, Black (47%) adults over age 65 were less likely to report ever having had a pneumonia vaccination as compared to White adults in the same age group (74%).
Black adults (44%) and Asian adults (55%) were more likely than White adults (37%) to have received the Hepatitis B vaccine series.
White adults (79%) were more likely than Black adults (73%) or Hispanic adults (69%) to report that they had received a tetanus vaccine in the past ten years.
White adults (45%) and Asian adults (30%) were less likely than Black adults (70%) and Hispanic adults (64%) to report ever having had an HIV test and White adults (10%) and
17

Asian adults (5%) were also less likely than Black adults (27%) or Hispanic adults (20%) to report that they had been tested for HIV in the past year.
See appendix and tables 4.1.2 and 4.1.3.
Chronic health conditions: Black adults (37%) were more likely than White adults (27%) or Asian adults (19%) to
report that they had been diagnosed with high blood pressure. Black adults (13%) and Hispanic adults (14%) were more likely than White adults (7%) to
report that they had ever been diagnosed with diabetes. Hispanic adults (21%) were more likely than White adults (16%) or Asian adults (8%) to
report that they had ever been diagnosed with asthma. Asian adults (10%) were less likely than White adults (22%), Black adults (21%) or Hispanic
adults (25%) to report that they had been diagnosed with arthritis. Hispanic adults (15%) were more likely to report having limitations due to arthritis than
White adults (9%). White adults (11%) were more likely than Black adults (7%) or Hispanic adults (7%) to
report that they had ever been diagnosed with cancer. White adults (17%) and Hispanic adults (21%) were more likely than Black adults (13%) or
Asian adults (10%) to report that they had ever been diagnosed with depression.See appendix for age-adjusted tables.
DISABILITY
Presented below are statistically significant differences in health and behavioral indicators by disability status. Disability was defined as having one or more of the following: (1) impairment or health problem that limited activities or caused cognitive difficulties or (2) used special equipment or required help from others to get around.
Description of overall health:Adults with a disability were:
Over five times as likely to report fair or poor health (38%) as adults without a disability (7%).
More than three times as likely to report 15 or more days of poor mental health in the past month (22%) as adults without a disability (7%).
Ten times as likely to report 15 or more days of poor physical health in the past month (31%) as adults without a disability (3%).
See tables 1.1 and 1.2.
Health care access and utilizationAdults with a disability were:
More likely to report having a personal health care provider than adults without a disability (93% vs. 87%).
More likely to report having a routine checkup in the past year (84%) than adults without a disability (78%).
More likely than adults without a disability to report not being able to see a doctor at some point in the past year due to cost (14% vs. 8%).
See table 2.2.
Health risk factors:Adults with a disability were:
More likely (24%) to report being current smokers than adults without a disability (16%) and less likely to report living in a household where smoking is not allowed (74%) than adults without a disability (83%)
18
Less likely to report binge drinking (14%) or heavy drinking (6%) than adults without a disability (23% binge drinking, 9% heavy drinking).
More likely to be overweight (67%) or obese (34%) than adults without a disability (57% overweight, 20% obese)
More likely to report having high cholesterol (47%) than adults without a disability (31%).See tables 3.1, 3.3, 3.4, 3.5, and 3.8.
Prevention measures: Adults with a disability were less likely to report meeting recommendations for aerobic
activity (45%) or meeting recommendations for muscle strengthening activity (26%) than adults without a disability (59% aerobic, 34% muscle strengthening).
Adults with a disability (43%) were more likely than adults without a disability (25%) to report high blood pressure; among those with high blood pressure, adults with a disability were more likely (85%) than adults without a disability (73%) to report taking medication to control their blood pressure.
Among adults 50-64 years of age, those with a disability were more likely to report receiving a flu shot in the past year (55%) than those without a disability (46%).
Among those 65 years of age and older, those with a disability were more likely to report ever having received a pneumonia vaccination (78%) than those without a disability (69%).
Adults with a disability were less likely to have received the Hepatitis B vaccine series than those without a disability (33% vs. 38%)
Adults 18-64 years of age with a disability were more likely to report ever having been tested for HIV (53%) than those without a disability (44%).
See table 3.6, 3.9, 4.1.1, 4.1.3, 4.3 and 6.2.
Chronic health conditions:Adults with a disability were:
More likely (9%) to report being diagnosed with pre-diabetes than adults without a disability (5%) and almost three times as likely (16%) to report being diagnosed with diabetes as adults without a disability (6%)
Twice as likely to report ever being diagnosed with asthma (25%) as adults without a disability (13%) and more than twice as likely (19%) as adults without a disability (8%) to report that they currently have asthma
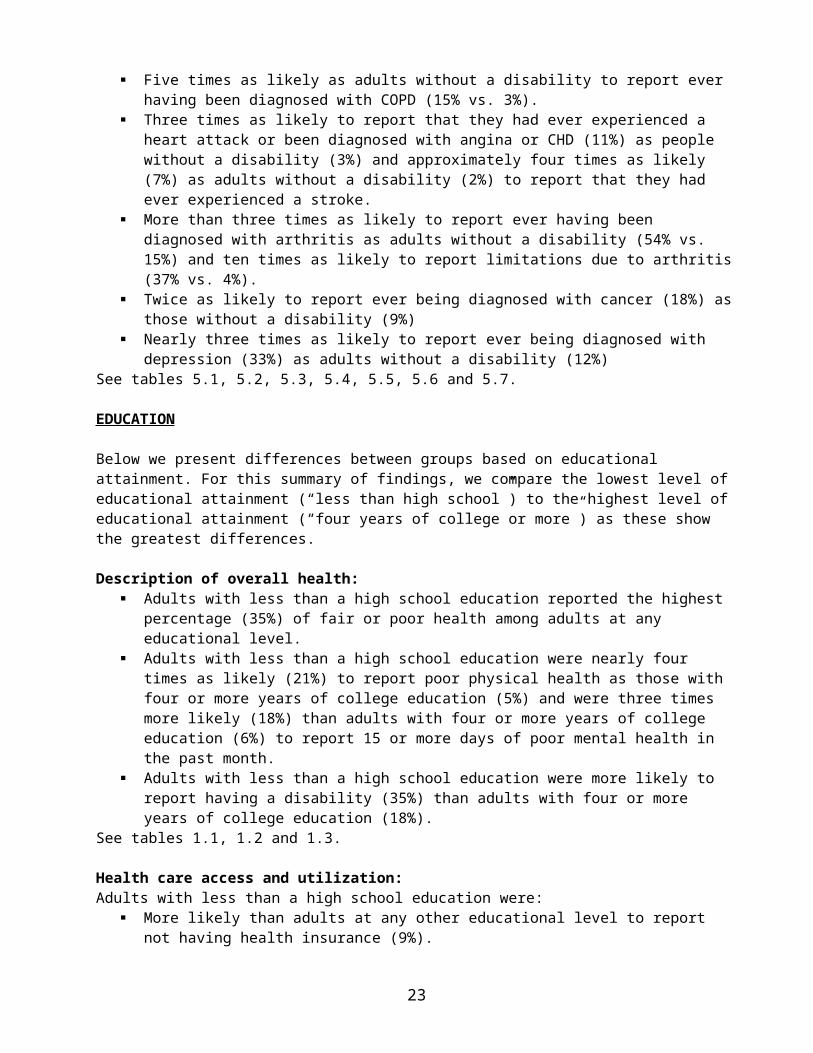
Five times as likely as adults without a disability to report ever having been diagnosed with COPD (15% vs. 3%).
Three times as likely to report that they had ever experienced a heart attack or been diagnosed with angina or CHD (11%) as people without a disability (3%) and approximately four times as likely (7%) as adults without a disability (2%) to report that they had ever experienced a stroke.
More than three times as likely to report ever having been diagnosed with arthritis as adults without a disability (54% vs. 15%) and ten times as likely to report limitations due to arthritis (37% vs. 4%).
Twice as likely to report ever being diagnosed with cancer (18%) as those without a disability (9%)
Nearly three times as likely to report ever being diagnosed with depression (33%) as adults without a disability (12%)
See tables 5.1, 5.2, 5.3, 5.4, 5.5, 5.6 and 5.7.
EDUCATION
Below we present differences between groups based on educational attainment. For this summary of findings, we compare the lowest level of educational attainment (“less than high school”) to the highest level of educational attainment (“four years of college or more”) as these show the greatest differences.
19

Description of overall health: Adults with less than a high school education reported the highest percentage (35%) of fair
or poor health among adults at any educational level. Adults with less than a high school education were nearly four times as likely (21%) to
report poor physical health as those with four or more years of college education (5%) and were three times more likely (18%) than adults with four or more years of college education (6%) to report 15 or more days of poor mental health in the past month.
Adults with less than a high school education were more likely to report having a disability (35%) than adults with four or more years of college education (18%).
See tables 1.1, 1.2 and 1.3.
Health care access and utilization:Adults with less than a high school education were:
More likely than adults at any other educational level to report not having health insurance (9%).
Less likely to report having a personal health care provider (80%) than adults with four or more years of college education (91%).
More likely to report not being able to see a doctor at some point in the past year due to cost (17%) than adults with four or more years of college education (5%).
See tables 2.1 and 2.2.
Health risk factors:Adults with less than a high school education were:
More likely than adults with four or more years of college education to report current smoking (30% vs. 7%), less likely to live in a household where smoking is not allowed (73% vs. 89%), and more likely than adults with four or more years of college education to report being exposed to environmental tobacco smoke (42% vs. 31%).
Less likely to report binge drinking (15%) than adults with four or more years of college education (22%)
More likely to report being overweight (63%) or obese (31%) than adults with four or more years of college education (54% overweight, 17% obese).
Less likely than adults with four or more years of college education to report having their cholesterol checked within the past five years (73% vs. 88%), but more likely to have been told their cholesterol was high (42% vs. 31%).
See tables 3.1, 3.3, 3.4, 3.5, and 3.8.
Prevention measures: Adults with less than a high school education were:
Less likely than adults with four or more years of college education to report meeting recommendations for aerobic activity (42% vs. 64%) or muscle strengthening activity (22% vs. 39%).
Less likely (16%) than adults with four or more years of college education (23%) to report consuming five or more servings of fruits and vegetables daily.
Only half as likely as adults with four or more years of college education to report having received the Hepatitis B vaccine series (22% vs. 44%).
Less likely than adults with four or more years of college education to report having received a tetanus vaccine in the past ten years (69% vs. 80%).
More likely (53%) to report ever having been tested for HIV than adults with 4 or more years of college education (45%).
Among those aged 50 and older, adults with less than a high school education were less likely (6%) than adults with 4 or more years of college education (13%) to report ever having received a shingles vaccine.
See tables 3.6, 3.7, 4.3, 4.4, 4.5 and 6.2.
20

Chronic health conditions:Adults with less than a high school education were:
More likely to report current asthma (15%), COPD (12%) and diabetes (14%) than those with 4 or more years of college education (9% for asthma, 3% for COPD, 5% for diabetes)
More likely to report having been diagnosed with high blood pressure (37%), having experienced a heart attack (9%) or having had a stroke (7%) than those with 4 or more years of college education (22% for high blood pressure 3% for heart attack, 2% for stroke).
More likely to report being diagnosed with arthritis (32%) and having limitations due to arthritis (18%) than those with 4 or more years of college education (17% for diagnosis, 7% for limitations)
More than twice as likely as those with 4 or more years of college education to have ever been diagnosed with depression (27% vs. 13%)
See tables 3.9, 5.1, 5.2, 5.3, 5.4, 5.5, and 5.7.
HOUSEHOLD INCOME
Household income is a sensitive topic among survey respondents; approximately 16% of respondents to the 2011 survey refused to answer questions about their household income levels. Thus, caution should be exercised when interpreting results based on income level. Results for the lowest level of household income (“less than $25,000”) and the highest level of household income (“$75,000 or higher”) are presented below; more detailed figures are contained in the tables in the report.
Description of overall health:Adults with a household income less than $25,000 per year were:
Almost six times more likely to report fair or poor health status (29%) than adults with a household income of $75,000 or higher (5%).
More than four times as likely to report 15 or more days of poor physical health in the past month than adults with a household income of $75,000 or higher (19% vs. 4%).
Three times more likely to report 15 or more days of poor mental health in the past month than adults with a household income of $75,000 or higher (19% vs. 5%).
More likely to report having a disability (37%) than adults with a household income of $75,000 or higher (16%).
See tables 1.1, 1.2, and 1.3.
Health care access and utilizationAdults with a household income less than $25,000 per year were:
More likely than adults with a household income of $75,000 or higher to report not having health insurance (8% vs. 2%).
Less likely to have a personal health care provider (82%) than adults with a household income of $75,000 or higher (93%).
More likely than adults with a household income of $75,000 or higher to report not being able to see a doctor at some point in the past year due to cost (17% vs. 4%).
See tables 2.1 and 2.2.
Health risk factors:Adults with a household income less than $25,000 per year were:
More likely to report being current smokers (29%) and exposure to environmental tobacco smoke (42%) than adults with a household income of $75,000 or higher (10% for current smoking, 33% for environmental tobacco smoke)
Less likely to report living in a household where smoking is not allowed (71%) than adults with a household income of $75,000 or higher (89%).
21

Less likely to report engaging in binge drinking (18%) than adults with a household income of $75,000 or higher (24%).
More likely to be obese (27%) than those with an annual household income of more than $75,000 (19%)
Less likely than adults with a household income of $75,000 or higher to report having their cholesterol checked within the past five years (76% vs. 90%), but more likely to have been told their cholesterol was high (39% vs. 30%).
See tables 3.1, 3.3, 3.4, 3.5 and 3.8.
Prevention measures: Adults with a household income less than $25,000 per year were:
Less likely than adults with a household income of $75,000 or higher to report meeting recommendations for aerobic (48% vs. 64%) or muscle strengthening activity (26% vs. 37%).
Less likely than adults with a household income of $75,000 or higher to report consuming five or more servings of fruits and vegetables daily (16% vs. 22%).
More likely to report ever having been tested for HIV (57%) and being tested for HIV within the past year (19%) than adults with a household income of $75,000 or higher (43% for ever tested, 7% for tested in past year)
Less likely to report always wearing a seatbelt when driving or riding in a car than adults with a household income of $75,000 or higher (74% vs. 85%)
Among adults ages 18-49, those with a household income less than $25,000 per year were less likely to report receiving a flu vaccine in the past year than those with a household income of $75,000 or higher (31% vs. 43%)
Adults with a household income less than $25,000 per year were less likely to report ever receiving the Hepatitis B vaccine series (36%) and receiving a tetanus vaccine in the past ten years (71%) than adults with a household income of $75,000 or higher (42% for Hepatitis B, 81% for tetanus)
See tables 3.6, 3.7, 4.1.1, 4.3, 4.4, 6.2 and 6.4.
Chronic health conditions:Adults with a household income less than $25,000 per year were:
More likely to report having been diagnosed with high blood pressure (36%) than adults with a household income of $75,000 or higher (22%).
More than twice as likely to report having been diagnosed with diabetes (12%) as adults with a household income of $75,000 or higher (5%).
More likely to report having current asthma (16%) and COPD (11%) than adults with a household income of $75,000 or higher (8% for asthma, 2% for COPD)
Approximately four times as likely to report that they had experienced a heart attack (9%) or angina (9%) as adults with an income of $75,000 or above (2% for heart attack, 3% for angina)
More likely to report having a stroke (7%) than adults in higher income groups. Nearly twice as likely to report a diagnosis of arthritis (32%) as adults with a household
income of $75,000 or higher (16%) and were three times more likely than adults with a household income of $75,000 or higher to report having activity limitations due to arthritis (18% vs. 6%).
More likely to report ever being diagnosed with depression (27%) than adults in any other income group.
See tables 3.9, 5.1, 5.2, 5.3, 5.4, 5.5 and 5.7.
22

REGION
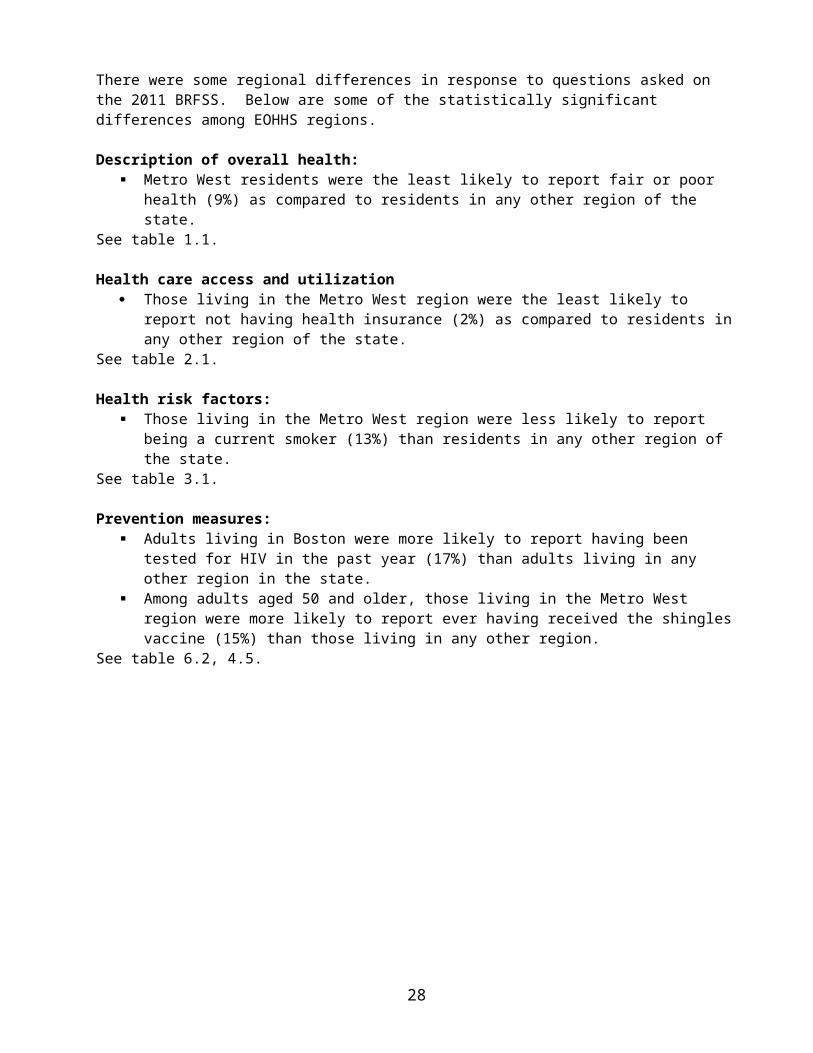
There were some regional differences in response to questions asked on the 2011 BRFSS. Below are some of the statistically significant differences among EOHHS regions.
Description of overall health: Metro West residents were the least likely to report fair or poor health (9%) as compared to
residents in any other region of the state. See table 1.1.
Health care access and utilization Those living in the Metro West region were the least likely to report not having health
insurance (2%) as compared to residents in any other region of the state.See table 2.1.
Health risk factors: Those living in the Metro West region were less likely to report being a current smoker
(13%) than residents in any other region of the state.See table 3.1.
Prevention measures: Adults living in Boston were more likely to report having been tested for HIV in the past year
(17%) than adults living in any other region in the state. Among adults aged 50 and older, those living in the Metro West region were more likely to
report ever having received the shingles vaccine (15%) than those living in any other region.
See table 6.2, 4.5.
23

SECTION 1: OVERALL HEALTH MEASURES
24

SECTION 1: OVERALL HEALTH MEASURES
Section 1.1: Overall Health Status
General health status is a self-rated assessment of one’s perceived health, which may be influenced by all aspects of life, including behaviors, the physical environment, and social factors. Self-assessed health status is a predictor of mortality and morbidity.5 General health status is useful in determining unmet health needs, identifying disparities among subpopulations, and characterizing the burden of chronic diseases within a population.6
Respondents were asked to describe their overall health as excellent, very good, good, fair, or poor. Presented here are the percentages of adults who reported that their overall health was fair or poor.
5 ]Idler EL & Benyamini Y. Self-rated health and mortality: A review of twenty-seven community studies. J Health Soc Behav 1997; 38:p. 21-37.6 Centers for Disease Control and Prevention. (2000). Measuring Healthy Days. Retrieved October 19, 2006, from http://www.cdc.gov/hrqol/pdfs/mhd.pdf.
25

TABLE 1.1 – OVERALL HEALTH STATUS AMONG MASSACHUSETTS ADULTS, 2011
FAIR OR POOR HEALTH
N % 95% CIOVERALL 22,253 14.0 13.3 - 14.8
GENDER
MALE 8,448 13.9 12.7 - 15.0FEMALE 13,805 14.2 13.3 - 15.1
AGE GROUP
18–24 807 7.1 4.8 - 9.425–34 2,186 8.1 6.3 - 9.835–44 3,146 10.8 8.9 - 12.645–54 4,467 12.9 11.4 - 14.355–64 4,833 19.3 17.6 - 21.065–74 3,457 22.7 20.5 - 24.875 AND OLDER 2,951 26.9 24.4 - 29.4
RACE-ETHNICITY*WHITE 17,880 12.5 11.8 - 13.3BLACK 1,398 17.9 14.5 - 21.3HISPANIC 1,718 27.3 23.8 - 30.8ASIAN 461 7.9 4.2 - 11.6
DISABILITY¶
DISABILITY 5,747 37.8 35.7 - 39.9NO DISABILITY 14,486 6.7 6.1 - 7.4
EDUCATION
< HIGH SCHOOL 1,802 34.8 31.2 - 38.5HIGH SCHOOL 5,724 17.7 16.2 - 19.3COLLEGE 1–3 YRS 5,224 12.0 10.8 - 13.3COLLEGE 4+ YRS 9,328 6.0 5.3 - 6.7
HOUSEHOLD INCOME
<$25,000 5,151 29.0 26.8 - 31.1$25,000–34,999 1,962 19.1 16.2 - 22.1$35,000–49,999 2,495 11.8 9.9 - 13.7$50,000–74,999 2,741 7.3 5.9 - 8.7$75,000+ 6,252 4.7 3.9 - 5.5
REGION
I–WESTERN 2,970 16.6 14.7 - 18.5II–CENTRAL 2,808 15.0 13.0 - 17.0III–NORTH EAST 5,110 13.3 11.6 - 14.9IV–METRO WEST 3,203 9.2 7.9 - 10.6V–SOUTH EAST 5,348 15.9 14.1 - 17.6VI–BOSTON 2,260 16.0 13.5 - 18.5
* White, Black, and Asian race categories refer to non-Hispanic¶ Disability defined as having one or more of the following conditions: (1) physical, mental, or emotional problem that limited activities or caused cognitive difficulties; or (2) used special equipment or required help from others to get around. Please note that this differs from the definition used in previous years’ reports.
26
Section 1.2: Quality of Life
A person’s perceived physical and mental health is used to measure the effects of numerous disorders, short- and long-term disabilities, and diseases. An overarching goal of Healthy People 2020 is to promote quality of life, healthy development, and healthy behaviors across all life stages.4
Perceived quality of life can help guide public health policies and interventions to improve health and fulfill unmet health needs.7
All respondents were asked to report: (1) the number of days during the past month that their physical health, which includes physical illness and injury, had not been good; and (2) the number of days during the past month they would describe their mental health, which includes stress, depression, and problems with emotions, as not good. Presented here are the percentages of adults who reported that:
(1) they had experienced at least 15 days of poor physical health in the previous month; (2) their mental health was not good for at least 15 days during the past month.
7 Centers for Disease Control and Prevention. Health-Related Quality of Life. Retrieved October 19, 2006, from http://www.cdc.gov/hrqol/
27
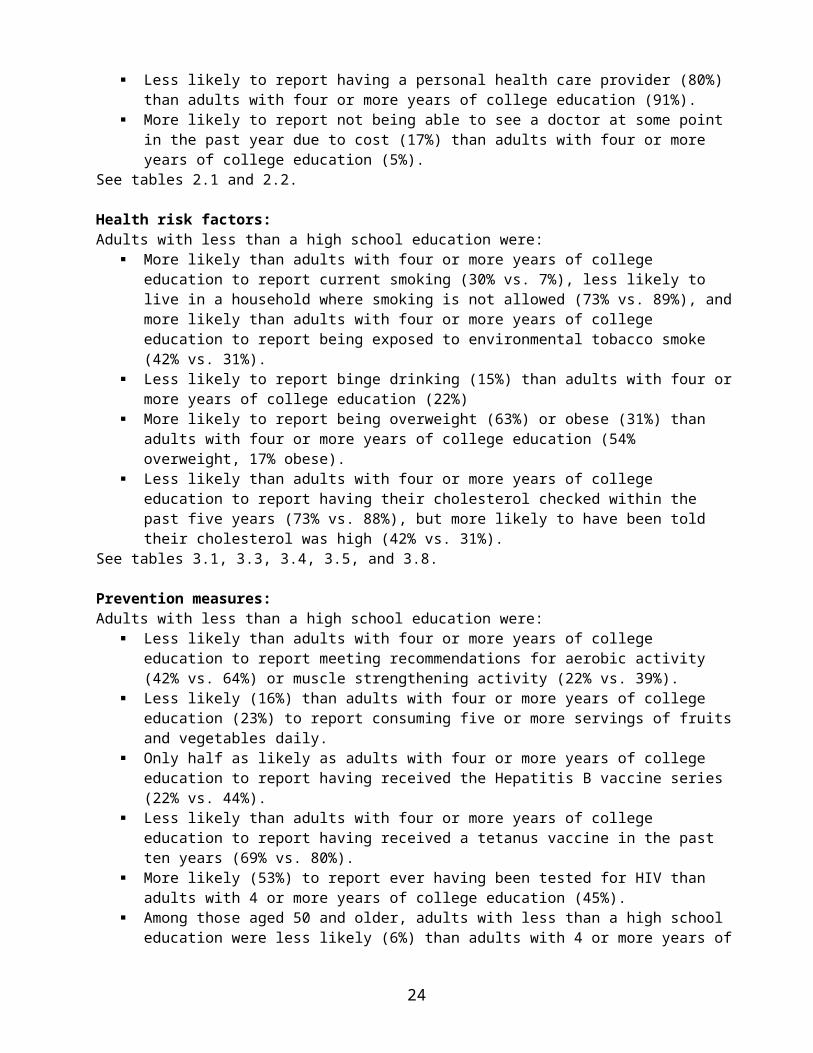
TABLE 1.2 – QUALITY OF LIFE AMONG MASSACHUSETTS ADULTS, 2011
15+ DAYS OF POOR PHYSICAL HEALTH
N % 95% CI
15+ DAYS OF POOR MENTAL HEALTH
N % 95% CIOVERALL 21,752 9.7 9.1 - 10.4 21,749 10.4 9.7 - 11.1GENDER
MALE 8,292 8.4 7.6 - 9.3 8,262 9.0 8.0 - 10.0FEMALE 13,460 10.9 10.1 - 11.8 13,487 11.7 10.7 - 12.6
AGE GROUP
18–24 787 3.6 1.8 5.4 798 10.7 7.9 - 13.525–34 2,156 4.8 3.4 - 6.1 2,147 9.5 7.6 - 11.335–44 3,093 8.8 7.1 - 10.6 3,095 12.4 10.4 - 14.345–54 4,411 10.9 9.5 - 12.3 4,393 12.3 10.9 - 13.755–64 4,734 13.2 11.8 - 14.7 4,697 11.1 9.7 - 12.465–74 3,370 15.1 13.2 - 17.0 3,374 7.9 6.5 - 9.375 AND OLDER 2,814 15.5 13.5 - 17.6 2,863 5.3 4.1 - 6.4
RACE-ETHNICITY*WHITE 17,495 9.7 9.0 - 10.4 17,486 10.5 9.7 - 11.3BLACK 1,356 9.1 6.4 - 11.7 1,368 10.2 7.7 - 12.8HISPANIC 1,676 12.6 10.1 - 15.1 1,665 12.8 10.2 - 15.4ASIAN 453 2.5 1.2 - 3.9 † .
DISABILITY¶
DISABILITY 5,570 31.2 29.2 - 33.2 5,587 22.4 20.6 - 24.3NO DISABILITY 14,248 3.2 2.7 - 3.7 14,225 6.7 6.0 - 7.4
EDUCATION
< HIGH SCHOOL 1,729 20.9 17.8 - 24.1 1,739 18.2 15.0 - 21.4HIGH SCHOOL 5,551 11.3 10.0 - 12.7 5,557 12.0 10.6 - 13.4COLLEGE 1–3 YRS 5,124 9.6 8.5 - 10.7 5,107 11.8 10.4 - 13.2COLLEGE 4+ YRS 9,178 5.2 4.5 - 5.8 9,178 5.7 5.0 - 6.4
HOUSEHOLD INCOME
<$25,000 5,008 18.8 17.0 - 20.6 5,010 18.5 16.6 - 20.4$25,000–34,999 1,915 12.0 9.6 - 14.4 1,917 11.4 9.1 - 13.8$35,000–49,999 2,446 8.1 6.4 - 9.8 2,456 10.1 8.1 - 12.1$50,000–74,999 2,706 6.7 5.2 - 8.1 2,699 8.8 6.9 - 10.8$75,000+ 6,182 4.4 3.7 - 5.1 6,165 5.4 4.6 - 6.3
REGION
I–WESTERN 2,900 12.3 10.6 - 14.1 2,894 11.5 9.7 - 13.3II–CENTRAL 2,746 9.8 8.1 - 11.5 2,755 10.4 8.5 - 12.3III–NORTH EAST 5,007 8.2 7.0 - 9.3 4,983 10.2 8.6 - 11.9IV–METRO WEST 3,144 7.2 6.0 - 8.3 3,143 7.7 6.3 - 9.1V–SOUTH EAST 5,218 11.9 10.3 - 13.6 5,216 11.6 10.0 - 13.2VI–BOSTON 2,197 9.3 7.4 - 11.3 2,218 11.7 9.6 - 13.8
* White, Black, and Asian race categories refer to non-Hispanic† Insufficient Data¶ Disability defined as having one or more of the following conditions: (1) physical, mental, or emotional problem that limited activities or caused cognitive difficulties; or (2) used special equipment or required help from others to get around. Please note that this differs from the definition used in previous years’ reports.
28

Section 1.3: Disability
According to the Census Bureau, in 2005, 54.4 million people (18.7% of the population) had some level of disability and 34.9 million (12% of the population) had a severe disability.8 A major goal for Healthy People 2020 is to promote the health and well-being of people with disabilities.4
In 2011, respondents to the Massachusetts BRFSS were asked about disabilities and activity limitations. Respondents were classified as having a disability if they answered “yes” to one or both of the following questions:
1. Are you limited in any way in any activities because of physical, mental, or emotional problems?
2. Do you now have any health problem that requires you to use special equipment, such as a cane, a wheelchair, a special bed, or a special telephone?
Please note that this differs from the definition used in previous years’ reports in that there is no time restriction on the duration of the disability. This change in definition results in a slight increase in prevalence estimates. See p.10 for a more detailed explanation.
8 U.S. Census Bureau, Americans with Disabilities: 2005, Issued December 2008. Retrieved on April 23, 2012, http://www.census.gov/prod/2008pubs/p70-117.pdf
29

30
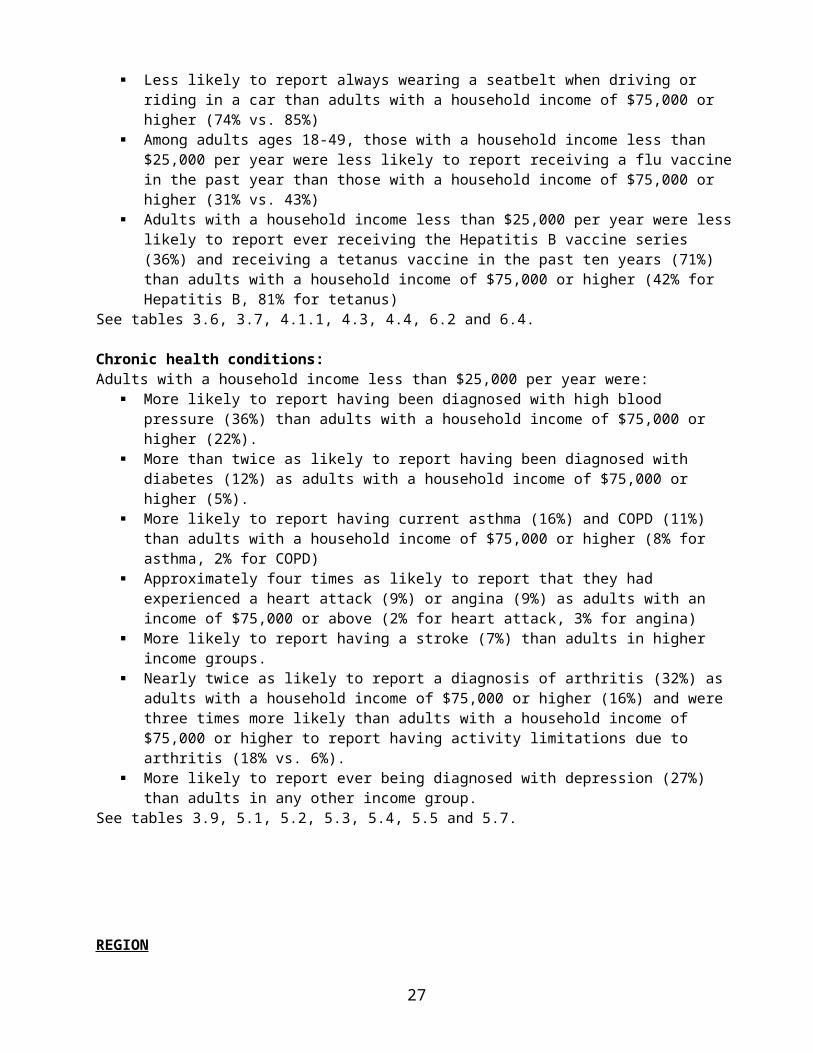
TABLE 1.3 – DISABILITY AMONG MASSACHUSETTS ADULTS, 2011
HAVE DISABILITY¶
N % 95% CIOVERALL 20,294 23.1 22.2 - 24.0
GENDER
MALE 7,721 21.4 20.0 - 22.8FEMALE 12,573 24.7 23.4 - 25.9
AGE GROUP
18–24 728 11.5 8.5 - 14.525–34 1,976 14.3 12.0 - 16.535–44 2,846 17.2 15.0 - 19.345–54 4,106 24.4 22.4 - 26.355–64 4,490 31.5 29.4 - 33.665–74 3,212 31.9 29.5 - 34.475 AND OLDER 2,616 41.1 38.1 - 44.0
RACE-ETHNICITY*WHITE 16,445 23.8 22.8 - 24.8BLACK 1,230 20.4 16.8 - 23.9HISPANIC 1,522 21.6 18.3 - 25.0ASIAN 402 9.8 5.6 - 14.0
EDUCATION
< HIGH SCHOOL 1,597 34.7 30.8 - 38.5HIGH SCHOOL 5,105 25.4 23.5 - 27.4COLLEGE 1–3 YRS 4,825 23.2 21.4 - 25.0COLLEGE 4+ YRS 8,706 17.9 16.8 - 19.0
HOUSEHOLD INCOME
<$25,000 4,691 36.7 34.3 - 39.1$25,000–34,999 1,820 25.8 22.5 - 29.1$35,000–49,999 2,332 20.4 17.9 - 23.0$50,000–74,999 2,573 19.3 17.0 - 21.6$75,000+ 5,905 15.6 14.2 - 17.0
REGION
I–WESTERN 2,751 26.5 24.1 - 29.0II–CENTRAL 2,611 23.6 21.0 - 26.2III–NORTH EAST 4,695 21.9 19.9 - 24.0IV–METRO WEST 2,999 20.5 18.6 - 22.4V–SOUTH EAST 4,947 25.7 23.6 - 27.9VI–BOSTON 2,081 20.2 17.5 - 22.8
* White, Black, and Asian race categories refer to non-Hispanic¶ Disability defined as having one or more of the following conditions: (1) physical, mental, or emotional problem that limited activities or caused cognitive difficulties; or (2) used special equipment or required help from others to get around. Please note that this differs from the definition used in previous years’ reports.
31
SECTION 2: HEALTH CARE ACCESS ANDUTILIZATION
32

SECTION 2: HEALTH CARE ACCESS AND UTILIZATION
Section 2.1: Health Insurance Status
Health insurance status is a key factor affecting access to health care. Adults who do not have health insurance are more likely to have poor health and are at greater risk for chronic diseases than those with health insurance. Those without health insurance are less likely to access health care services, including preventative care, primary care, and tertiary care, and more likely to delay
getting needed medical attention.9 10 The Massachusetts Division of Health Care Finance and Policy reported in December 2010 that 2.9% of non-elderly adults age 19-64 remained uninsured.11
Massachusetts historically adds state questions to the CDC basic question of whether the respondents had any type of health care coverage at the time of the interview. Given the methodological changes in 2011(see FAQ) and some inconsistencies with previous years’ state-added insurance-related questions, the estimates presented in Table 2.1 reflect the 2011 data with an adjustment for MA state-added questions based upon analysis of developmental datasets* for 2009 and 2010. This was done to provide more consistent Massachusetts-specific information about those with no health insurance in 2011.
Presented here are the percentages of adults who reported that they had no health insurance in 2011.
9 Self-assessed health status and selected behavioral risk factors among persons with and without health-care coverage. United States, 1994-1995. MMWR. 47(09): p. 176-180.10 Weissman, J.S. & Epstein, A.M. (1993). The insurance gap: does it make a difference? Annu Rev Public Health, 14, 243-270.11 Division of Health Care Finance and Policy, (2010). Health Insurance Coverage in Massachusetts: Results from the 2008-2010 Massachusetts Health Insurance Surveys. Retrieved on May 17, 2011 from http://www.mass.gov/Eeohhs2/docs/dhcfp/r/pubs/10/mhis_report_12-2010.pdf
33
*Developmental datasets for 2009 and 2010 were provided to states by the CDC. These “developmental” datasets contained data from both landline and cell phone respondents and utilized the new weighting methodology. These datasets were considered “developmental” as the methodology was being finalized.

TABLE 2.1 – HEALTH INSURANCE STATUS AMONG MASSACHUSETTS ADULTS,AGES 18-64, 2011
NO HEALTH INSURANCE
N % 95% CI
OVERALL 15,428 4.4 4.0 - 4.8GENDER
MALE 6,137 5.5 4.7 - 6.2FEMALE 9,291 3.3 2.8 - 3.9
AGE GROUP 18–24 796 6.2 4.7 - 7.725–34 2,186 6.4 5.1 - 7.635–44 3,141 5.8 4.5 - 7.145–54 4,466 2.5 2.0 - 3.055–64 4,839 1.9 1.6 - 2.3
RACE-ETHNICITY* WHITE 11,876 3.4 3.0 - 3.9BLACK 1,088 6.8 5.0 - 8.6HISPANIC 1,456 10.6 8.6 - 12.6ASIAN 422 3.1 1.2 - 5.0
DISABILITY¶ - DISABILITY 3,518 3.6 2.7 - 4.5NO DISABILITY 10,590 4.5 4.0 - 5.1
EDUCATION < HIGH SCHOOL 1,025 8.7 6.8 - 10.7HIGH SCHOOL 3,540 5.9 4.9 - 6.9COLLEGE 1–3 YRS 3,658 5.3 4.2 - 6.4COLLEGE 4+ YRS 7,105 1.5 1.2 - 1.8
HOUSEHOLD INCOME <$25,000 3,127 7.8 6.7 - 9.0
$25,000–34,999 1,131 8.7 6.4 - 11.0$35,000–49,999 1,643 4.5 3.2 - 5.8$50,000–74,999 2,107 2.7 1.7 - 3.8$75,000+ 5,457 1.5 1.0 - 2.0
REGION I–WESTERN 2,064 6.0 4.7 - 7.4II–CENTRAL 2,019 4.1 3.0 - 5.1III–NORTH EAST 3,538 5.1 3.8 - 6.4IV–METRO WEST 2,229 1.5 1.0 - 2.0V–SOUTH EAST 3,487 5.7 4.4 - 7.0VI–BOSTON 1,675 5.3 4.0 - 6.6
* White, Black, and Asian race categories refer to non-Hispanic¶ Disability defined as having one or more of the following conditions: (1) physical, mental, or emotional problem that limited activities or caused cognitive difficulties; or (2) used special equipment or required help from others to get around. Please note that this differs from the definition used in previous years’ reports.
34

Section 2.2: Health Care Access
Access to health care impacts physical, social and mental health status; prevention of disease and disability; detection and treatment of health conditions; quality of life; preventable death; and life expectancy. A goal of Healthy People 2020 is to improve access to comprehensive, quality health care services.4
All respondents were asked if they had a person that they thought of as their personal doctor or health care provider. All respondents were also asked whether they were unable to see a doctor in the past year due to cost and about how long since they last visited a doctor for a routine checkup. Presented here are the percentages of adults who reported that they did not have a personal health care provider, the percentages of adults who reported that cost had prevented them from seeing a doctor at some point in the past year, and the percentage of adults who had visited a medical provider for a checkup in the past year.
35
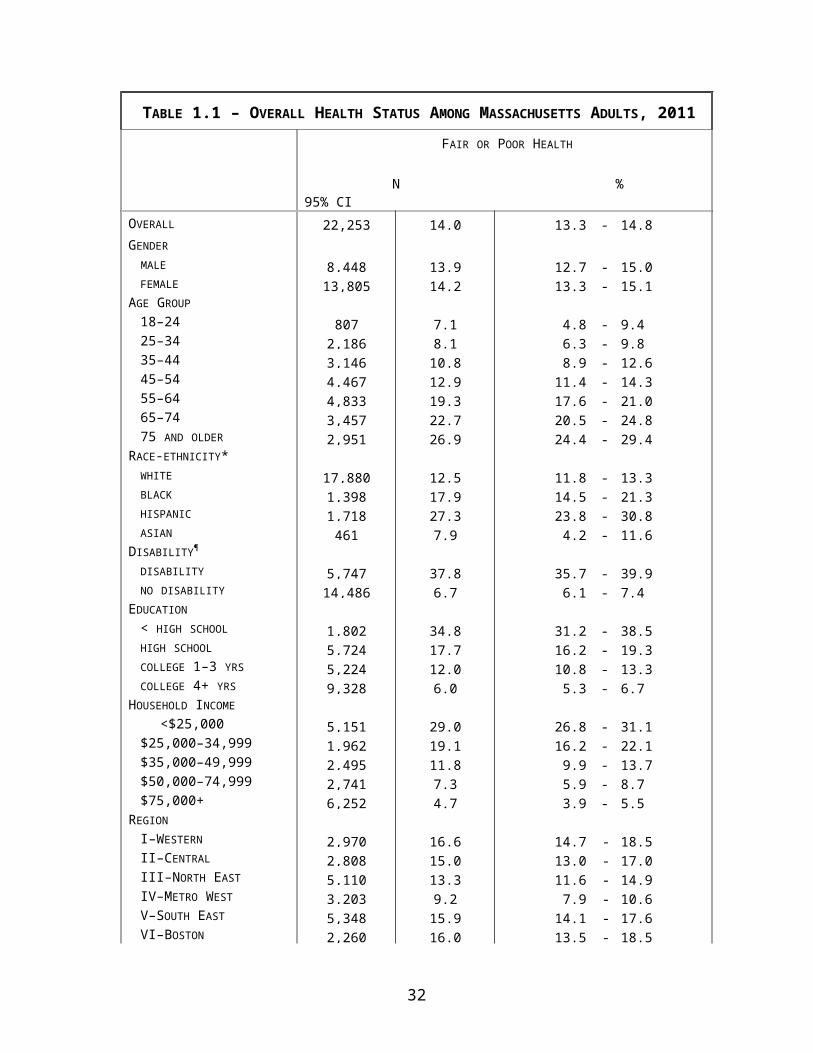
TABLE 2.2 - HEALTH CARE ACCESS AMONG MASSACHUSETTS ADULTS, 2011
HAVE PERSONAL HEALTH CARE PROVIDER
N % 95% CI
COULD NOT SEE DOCTOR DUE TO COST
N % 95% CIOVERALL 22,253 88.3 87.5 - 89.1 22,250 9.5 8.8 - 10.2GENDER
MALE 8,443 83.9 82.5 - 85.3 8,451 9.9 8.8 - 11.0FEMALE 13,810 92.4 91.6 - 93.3 13,799 9.1 8.2 - 10.0
AGE GROUP
18–24 795 74.8 70.9 - 78.8 804 10.5 7.8 - 13.225–34 2,185 78.0 75.3 - 80.6 2,187 13.1 10.9 - 15.435–44 3,141 89.7 87.9 - 91.4 3,136 11.9 10.1 - 13.845–54 4,472 92.1 90.9 - 93.4 4,466 9.8 8.4 - 11.155–64 4,836 95.0 94.1 - 95.9 4,841 8.9 7.5 - 10.265–74 3,455 96.5 95.7 - 97.4 3,459 3.6 2.7 - 4.575 AND OLDER 2,961 95.9 94.9 - 97.0 2,950 3.2 2.2 - 4.2
RACE-ETHNICITY*WHITE 17,876 90.5 89.6 - 91.3 17,883 8.2 7.4 - 8.9BLACK 1,403 80.4 76.3 - 84.6 1,398 17.5 14.0 - 21.0HISPANIC 1,716 75.7 72.1 - 79.4 1,712 18.4 15.4 - 21.4ASIAN 457 83.4 78.4 88.4 457 6.0 2.7 - 9.2
DISABILITY¶
DISABILITY 5,753 93.0 91.7 - 94.2 5,748 13.6 12.0 - 15.2NO DISABILITY 14,476 87.0 86.0 - 88.1 14,484 7.9 7.1 - 8.7
EDUCATION
< HIGH SCHOOL 1,805 79.6 76.1 - 83.1 1,804 17.1 14.0 - 20.1HIGH SCHOOL 5,721 87.6 86.0 - 89.3 5,714 10.7 9.2 - 12.1COLLEGE 1–3 YRS 5,226 89.3 87.7 - 91.0 5,222 10.6 9.1 - 12.1COLLEGE 4+ YRS 9,330 90.9 89.9 - 91.9 9,334 5.2 4.5 - 5.9
HOUSEHOLD INCOME
<$25,000 5,151 82.0 79.9 - 84.1 5,147 16.6 14.7 - 18.6$25,000–34,999 1,960 85.1 82.0 - 88.1 1,955 12.3 9.7 - 14.9$35,000–49,999 2,498 86.9 84.4 - 89.5 2,497 11.8 9.5 - 14.0$50,000–74,999 2,735 91.3 89.3 - 93.4 2,737 8.0 6.0 - 10.0
36
$75,000+ 6,254 93.1 92.0 - 94.2 6,256 4.3 3.4 - 5.2REGION
I–WESTERN 2,965 88.1 86.0 - 90.1 2,964 10.4 8.7 - 12.2II–CENTRAL 2,815 89.4 87.2 - 91.6 2,817 8.9 7.1 - 10.7III–NORTH EAST 5,112 90.2 88.4 - 92.0 5,111 9.9 8.1 - 11.6IV–METRO WEST 3,203 89.2 87.3 - 91.0 3,205 6.8 5.5 - 8.2V–SOUTH EAST 5,338 90.1 88.4 - 91.9 5,335 10.3 8.6 - 12.0VI–BOSTON 2,265 81.5 78.7 - 84.3 2,266 11.0 8.7 - 13.2
* White, Black, and Asian race categories refer to non-Hispanic¶ Disability defined as having one or more of the following conditions: (1) physical, mental, or emotional problem that limited activities or caused cognitive difficulties; or (2) used special equipment or required help from others to get around. Please note that this differs from the definition used in previous years’ reports.
TABLE 2.2 (CONTINUED) - HEALTH CARE ACCESS AMONG MASSACHUSETTS ADULTS, 2011
HAVE HAD A CHECKUP IN THE PAST YEAR
N % 95% CIOVERALL 22,130 78.8 77.8 - 79.8
GENDER
MALE 8,398 74.1 72.5 - 75.7FEMALE 13,732 83.1 82.0 - 84.2
AGE GROUP
18–24 793 73.9 69.9 - 77.825–34 2,169 64.7 61.6 - 67.835–44 3,120 75.0 72.6 - 77.445–54 4,454 77.7 75.8 - 79.655–64 4,817 86.7 85.1 - 88.365–74 3,447 92.6 91.4 - 93.875 AND OLDER 2,928 93.4 91.9 - 94.9
RACE-ETHNICITY*WHITE 17,777 79.5 78.4 - 80.6BLACK 1,403 79.8 75.7 - 83.8HISPANIC 1,698 75.3 71.7 - 79.0ASIAN 459 72.5 66.4 - 78.5
DISABILITY¶
DISABILITY 5,718 83.8 82.0 - 85.6NO DISABILITY 14,409 77.5 76.3 - 78.7
EDUCATION
< HIGH SCHOOL 1,790 78.7 75.1 - 82.4HIGH SCHOOL 5,686 79.0 77.0 - 81.0COLLEGE 1–3 YRS 5,205 78.6 76.7 - 80.6COLLEGE 4+ YRS 9,278 78.8 77.4 - 80.2
HOUSEHOLD INCOME
<$25,000 5,117 78.8 76.6 - 81.0$25,000–34,999 1,949 78.5 75.1 - 81.9
37

$35,000–49,999 2,482 77.4 74.3 - 80.5$50,000–74,999 2,730 79.0 76.3 - 81.8$75,000+ 6,236 78.8 77.2 - 80.4
REGION
I–WESTERN 2,947 79.5 77.0 - 82.0II–CENTRAL 2,799 77.5 74.8 - 80.1III–NORTH EAST 5,082 79.4 77.1 - 81.8IV–METRO WEST 3,188 77.2 74.9 - 79.5V–SOUTH EAST 5,310 82.0 79.9 - 84.0VI–BOSTON 2,257 78.1 75.2 - 81.0
* White, Black, and Asian race categories refer to non-Hispanic¶ Disability defined as having one or more of the following conditions: (1) physical, mental, or emotional problem that limited activities or caused cognitive difficulties; or (2) used special equipment or required help from others to get around. Please note that this differs from the definition used in previous years’ reports.
SECTION 3: RISK FACTORS AND PREVENTIVEBEHAVIORS
38

SECTION 3: RISK FACTORS AND PREVENTIVE BEHAVIORS
Section 3.1: Tobacco Use
Tobacco use is the leading preventable cause of death in the United States, resulting in approximately 443,000 deaths each year. More than 8.6 million people in the United States have at least one serious illness caused by smoking. It is a major risk factor for cancer, heart, and lung diseases.12 In Massachusetts, more than 9,000 residents die each year from the effects of tobacco. The health and economic burden of tobacco use has resulted in more than 3.9 billion dollars per year in health care costs in Massachusetts. The Massachusetts Tobacco Control Program was established in 1993 to control tobacco use and since the implementation of the program, the number of adults who smoke in Massachusetts has declined.13
A current smoker was defined as someone who has smoked at least 100 cigarettes in his/her lifetime and who currently smokes either some days or everyday. A former smoker was defined as someone who has smoked at least 100 cigarettes in his/her lifetime but no longer smokes. Presented here are the percentage of adults who reported being current smokers and the percentage of adults who reported being former smokers.
There are two main types of smokeless tobacco, chewing tobacco and snuff. Users place the tobacco between their gum and cheek and either suck or chew on the tobacco. In 2009, the Centers for Disease Control reported that 3.5% of all adults aged 18 years and older used smokeless tobacco. Prevalence of smokeless tobacco use is higher among younger males. Smokeless tobacco is addictive, known to cause cancer, and affects oral and reproductive health.14
Respondents were asked if they currently use chewing tobacco, snuff, or snus (Swedish for snuff) every day, some days, or not at all. Presented is the percentage of adults who reported using chewing tobacco, snuff or snus either every day or some days.
12 Centers for Disease Control and Prevention. (2011). Tobacco Use: Targeting the Nation's Leading Killer: At A Glance. Retrieved on March 2, 2011, from http://www.cdc.gov/chronicdisease/resources/publications/aag/osh.htm13 Massachusetts Department of Public Health, Tobacco Control Program. (2008). Reducing the health and economic burden of tobacco use. Retrieved on May 28, 2009, from http://www.mass.gov/Eeohhs2/docs/dph/tobacco_control/program_overview.pdf14 Centers for Disease Control and Prevention. (2011). Smokeless Tobacco Facts. Retrieved March 3, 2011, from http://www.cdc.gov/tobacco/data_statistics/fact_sheets/smokeless/smokeless_facts/index.htm
39

TABLE 3.1 – TOBACCO USE AMONG MASSACHUSETTS ADULTS, 2011
CURRENT SMOKER
N % 95% CI
FORMER SMOKER
N % 95% CIOVERALL 22,150 18.2 17.3 - 19.2 22,150 28.3 27.4 - 29.2GENDER
MALE 8,412 19.7 18.2 - 21.1 8,412 29.1 27.6 - 30.6FEMALE 13,738 16.9 15.7 - 18.1 13,738 27.6 26.4 - 28.8
AGE GROUP
18–24 802 22.6 18.7 - 26.5 802 6.2 4.2 - 8.225–34 2,180 26.4 23.4 - 29.3 2,180 16.5 14.1 - 18.835–44 3,125 20.3 17.9 - 22.7 3,125 22.4 20.1 - 24.645–54 4,449 17.8 16.1 - 19.5 4,449 31.0 28.9 - 33.155–64 4,824 15.2 13.7 - 16.8 4,824 39.1 37.0 - 41.365–74 3,447 12.0 10.3 - 13.6 3,447 48.6 46.1 - 51.275 AND OLDER 2,925 5.7 4.3 - 7.1 2,925 47.5 44.7 - 50.4
RACE-ETHNICITY*WHITE 17,781 18.5 17.4 - 19.6 17,781 31.3 30.3 - 32.4BLACK 1,399 17.4 13.9 - 20.9 1,399 17.1 13.6 - 20.6HISPANIC 1,717 19.2 15.7 - 22.7 1,717 15.2 12.4 - 17.9ASIAN 458 8.6 4.5 - 12.8 458 10.0 6.2 - 13.7
DISABILITY¶
DISABILITY 5,730 24.1 22.0 - 26.1 5,730 36.3 34.2 - 38.3NO DISABILITY 14,404 15.8 14.7 - 16.9 14,404 26.1 25.0 - 27.2
EDUCATION
< HIGH SCHOOL 1,806 30.1 26.3 - 34.0 1,806 22.7 19.7 - 25.8HIGH SCHOOL 5,700 25.1 23.0 - 27.1 5,700 32.4 30.3 - 34.4COLLEGE 1–3 YRS 5,205 21.0 19.1 - 23.0 5,205 29.3 27.4 - 31.2COLLEGE 4+ YRS 9,263 7.2 6.3 - 8.1 9,263 26.4 25.1 - 27.6
HOUSEHOLD INCOME
<$25,000 5,145 29.4 27.0 - 31.7 5,145 25.1 23.1 - 27.1$25,000–34,999 1,959 19.6 16.4 - 22.8 1,959 29.5 26.2 - 32.8$35,000–49,999 2,484 19.2 16.4 - 21.9 2,484 30.3 27.4 - 33.2$50,000–74,999 2,724 19.7 16.8 - 22.6 2,724 32.0 29.3 - 34.8$75,000+ 6,217 9.9 8.7 - 11.2 6,217 29.3 27.6 - 31.0
REGION
I–WESTERN 2,963 20.8 18.2 - 23.3 2,963 28.9 26.4 - 31.3II–CENTRAL 2,800 20.3 17.7 - 23.0 2,800 27.4 24.9 - 30.0III–NORTH EAST 5,096 18.5 16.2 - 20.7 5,096 27.1 25.0 - 29.3IV–METRO WEST 3,177 12.5 10.6 - 14.4 3,177 28.2 26.1 - 30.3V–SOUTH EAST 5,316 21.3 19.0 - 23.5 5,316 33.2 30.9 - 35.4VI–BOSTON 2,251 17.5 15.0 - 20.1 2,251 22.7 20.2 - 25.3
40

* White, Black, and Asian race categories refer to non-Hispanic¶ Disability defined as having one or more of the following conditions: (1) physical, mental, or emotional problem that limited activities or caused cognitive difficulties; or (2) used special equipment or required help from others to get around. Please note that this differs from the definition used in previous years’ reports.
TABLE 3.1(CONTINUED) - SMOKELESS TOBACCO USE AMONG MASSACHUSETTS ADULTS, 2011
USE SMOKELESS TOBACCO (CHEWING TOBACCO, SNUFF OR SNUS)
N % 95% CIOVERALL 22,310 1.7 1.4 - 2.0
GENDER
MALE 8,474 2.6 2.0 - 3.3FEMALE 13,836 0.8 0.6 - 1.1
AGE GROUP
18–24 807 3.7 2.0 - 5.425–34 2,189 2.7 1.6 - 3.935–44 3,145 1.5 0.9 - 2.145–54 4,477 0.9 0.5 - 1.355–64 4,850 1.4 0.6 - 2.165–74 † 0.6 0.3 0.975 AND OLDER 2,964 0.7 0.3 - 1.1
RACE-ETHNICITY*WHITE 17,915 1.6 1.2 - 2.0BLACK †HISPANIC 1,725 2.0 0.9 - 3.2ASIAN †
DISABILITY¶
DISABILITY 5,767 2.1 1.3 - 2.9NO DISABILITY 14,513 1.5 1.1 - 1.9
EDUCATION
< HIGH SCHOOL 1,819 2.8 1.2 - 4.3HIGH SCHOOL 5,734 1.8 1.2 - 2.5COLLEGE 1–3 YRS 5,241 1.3 0.7 - 1.8COLLEGE 4+ YRS 9,340 1.6 1.1 - 2.2
HOUSEHOLD INCOME
<$25,000 5,168 2.5 1.6 - 3.3$25,000–34,999 † -$35,000–49,999 2,499 1.0 0.4 - 1.6$50,000–74,999 2,742 2.0 0.9 - 3.1$75,000+ 6,257 1.4 0.8 - 1.9
REGION
I–WESTERN 2,980 2.4 1.3 - 3.5II–CENTRAL 2,820 2.0 0.9 - 3.2III–NORTH EAST 5,126 1.6 0.9 - 2.2IV–METRO WEST 3,207 1.7 0.8 - 2.5V–SOUTH EAST 5,356 1.4 0.9 - 1.9
41
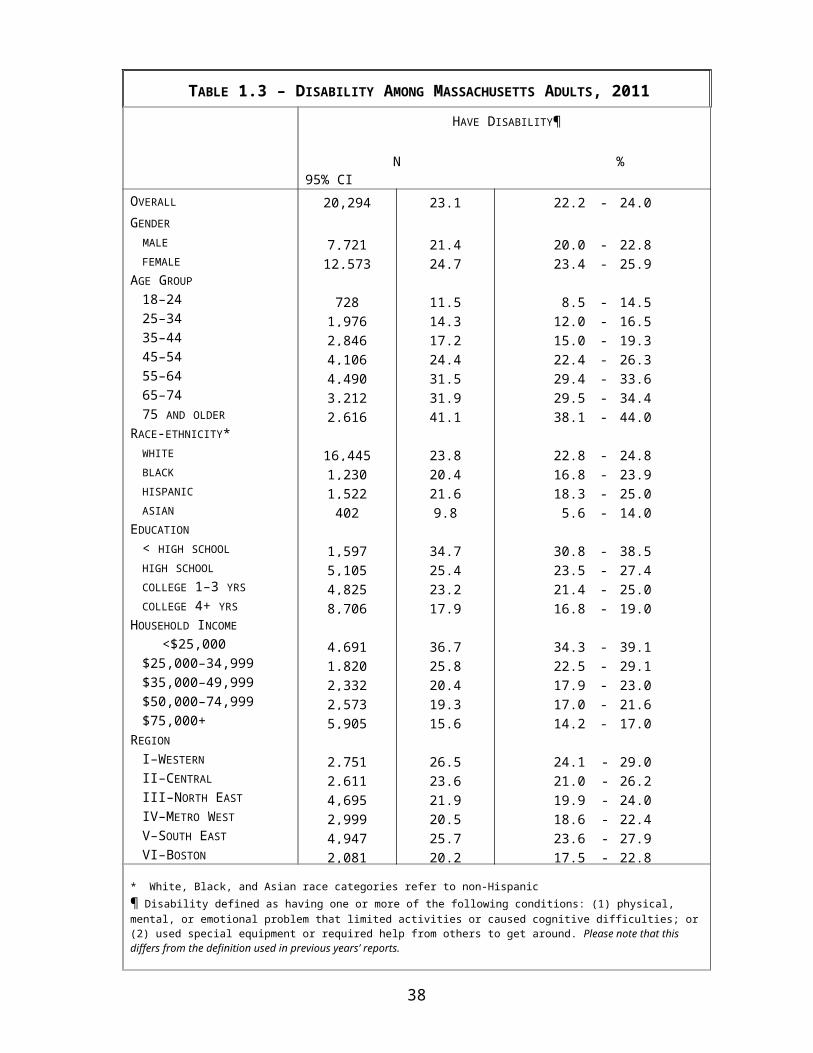
VI–BOSTON 2,266 1.2 0.5 - 1.9* White, Black, and Asian race categories refer to non-Hispanic† Insufficient Data¶ Disability defined as having one or more of the following conditions: (1) physical, mental, or emotional problem that limited activities or caused cognitive difficulties; or (2) used special equipment or required help from others to get around. Please note that this differs from the definition used in previous years’ reports.
Section 3.2: Smoking Cessation
Some of the immediate health benefits to quitting smoking are: improved heart rate and blood pressure, improved circulation and lung function, and improved sense of smell and taste. Long-term benefits include reduced risk of cancer and other diseases caused by smoking, such as heart disease and COPD.15
Respondents who were current smokers were asked if they had stopped smoking for one day or longer in the past 12 months because they were trying to quit smoking. They were also asked if they had any intention of trying to quit smoking within the next 30 days. Presented here is the percentage of adult current smokers who reported that they had attempted to quit smoking for one day or longer in the past 12 months and the percentage of adult current smokers who reported that they had plans to quit smoking within the next 30 days.
15 National Cancer Institute. (2011). Harms of Smoking and Health Benefits of Quitting. Retrieved March 7, 2011 from http://www.cancer.gov/cancertopics/factsheet/Tobacco/cessation
42
43

TABLE 3.2 – SMOKING CESSATION AMONG MASSACHUSETTS ADULTS, 2011
QUIT ATTEMPT
N % 95% CI
PLANNING TO QUIT N % 95% CI
OVERALL 3,623 60.1 57.3 - 63.0 2,876 37.0 33.9 - 40.2GENDER
MALE 1,475 63.5 59.4 - 67.6 1,163 37.5 32.8 - 42.2FEMALE 2,148 56.5 52.6 - 60.4 1,713 36.6 32.3 - 40.8
AGE GROUP
18–24 172 68.9 59.8 - 77.9 132 41.7 30.6 - 52.725–34 474 60.3 53.6 - 67.0 373 28.1 21.6 - 34.635–44 578 60.0 53.2 - 66.8 446 41.0 33.3 - 48.745–54 901 55.5 50.2 - 60.7 744 37.7 32.0 - 43.555–64 817 59.1 53.8 - 64.4 648 39.8 33.8 - 45.965–74 468 56.7 49.5 - 63.9 383 41.1 33.3 - 49.075 AND OLDER 154 52.1 39.6 - 64.6 113 37.5 23.9 - 51.1
RACE-ETHNICITY*WHITE 2,900 58.6 55.4 - 61.9 2,322 34.4 30.9 - 37.8BLACK 239 66.1 55.4 - 76.7 193 46.3 34.2 - 58.4HISPANIC 270 66.9 57.6 - 76.2 199 53.0 40.7 - 65.4ASIAN † †
DISABILITY¶
DISABILITY 1,225 62.2 57.3 - 67.0 1,060 40.9 35.6 - 46.2NO DISABILITY 2,058 59.0 55.2 - 62.7 1,796 35.5 31.5 - 39.5
EDUCATION
< HIGH SCHOOL 447 59.2 51.3 - 67.1 322 40.6 31.7 - 49.5HIGH SCHOOL 1,299 57.5 52.8 - 62.2 1,020 34.2 29.2 - 39.2COLLEGE 1–3 YRS 1,103 63.4 58.5 - 68.3 916 41.0 35.3 - 46.7COLLEGE 4+ YRS 749 61.6 55.4 - 67.9 610 31.3 25.5 - 37.1
HOUSEHOLD INCOME
<$25,000 1,337 60.5 55.6 - 65.5 1,044 41.4 36.0 - 46.9$25,000–34,999 364 66.0 57.4 - 74.7 304 33.2 24.5 - 41.8$35,000–49,999 439 53.7 45.8 - 61.6 359 34.7 26.4 - 43.0$50,000–74,999 413 57.6 49.1 - 66.1 354 33.3 24.0 - 42.6$75,000+ 553 63.5 57.1 - 69.9 459 38.4 30.9 - 45.9
REGION
I–WESTERN 521 63.0 56.3 - 69.8 424 34.4 27.1 - 41.8II–CENTRAL 469 58.4 51.1 - 65.7 384 33.4 26.0 - 40.7III–NORTH EAST 870 65.2 58.8 - 71.7 693 41.1 33.5 - 48.8IV–METRO WEST 362 56.6 48.4 - 64.8 292 39.4 30.1 - 48.6V–SOUTH EAST 1,010 59.0 53.0 - 65.0 815 36.2 29.6 - 42.7VI–BOSTON 324 59.2 51.1 - 67.3 259 40.5 31.6 - 49.5
* White, Black, and Asian race categories refer to non-Hispanic† Insufficient Data¶ Disability defined as having one or more of the following conditions: (1) physical, mental, or emotional problem that limited activities or caused cognitive difficulties; or (2) used special equipment or required help from others to get around. Please note that this differs from the definition used in previous years’ reports.
44

Section 3.3: Environmental Tobacco Smoke
Environmental tobacco smoke (ETS), referred to as secondhand smoke, includes both the smoke given off the burning end of tobacco products and the smoke exhaled by the smoker. Secondhand smoke has been linked to lung cancer deaths, heart disease, and respiratory illnesses, such as asthma and bronchitis in non-smoking adults. Nonsmokers exposed to secondhand smoke at home or work increase their risk of developing heart disease by 25 to 30 percent and lung cancer by 20 to 30 percent compared to those not exposed to secondhand smoke.16
Respondents were asked about rules regarding smoking in their households. Answer selections were: no smoking is allowed, smoking is allowed in some places or at some times, or smoking is permitted anywhere in the household. Presented here is the percentage of adults reporting that no smoking was allowed in their household. Respondents were also asked about exposure to environmental tobacco smoke at their home, work, or other places. ETS exposure was defined in one of two ways depending on whether respondents reported working outside the home or not on an earlier employment status question. Among the employed (including the self-employed), ETS exposure was defined as any report of exposure to ETS at work, at home, or in other places in the past 7 days. Among those not employed outside the home, ETS exposure was defined as any exposure to ETS at home or in other places in the past 7 days.
Questions about environmental tobacco smoke were asked only on the MA BRFSS landline survey in 2011 and not the cell phone survey; therefore the results in Table 3.3 represent the landline sample only.
16 U.S. Dept. of Health and Human Services, Centers for Disease Control and Prevention, Coordinating Center for Health Promotion, National Center for Chronic Disease Prevention and Health Promotion, Office on Smoking and Health. (2006). The Health Consequences of Involuntary Exposure to Tobacco Smoke: A Report of the Surgeon General. Retrieved on November 1, 2006, from http://www.surgeongeneral.gov/library/secondhandsmoke/report/
45

TABLE 3.3 – ENVIRONMENTAL TOBACCO AMONG MASSACHUSETTS ADULTS, 2011
LIVE IN A HOUSEHOLD WHERE SMOKING IS NOT ALLOWED
N % 95% CI
EXPOSED TO ENVIRONMENTAL TOBACCO SMOKE §
N % 95% CI
OVERALL 18,631 80.5 79.5 - 81.5 16,779 37.9 36.5 - 39.4GENDER
MALE 7,028 78.6 77.0 - 80.2 6,094 42.8 40.4 - 45.1FEMALE 11,603 82.2 80.9 - 83.5 10,685 33.5 31.7 - 35.4
AGE GROUP
18–24 659 73.1 68.7 - 77.6 404 62.9 56.6 - 69.125–34 1,776 77.9 74.8 - 81.0 1,284 47.9 43.4 - 52.335–44 2,628 83.7 81.3 - 86.1 2,328 40.9 37.6 - 44.245–54 3,840 81.4 79.5 - 83.3 3,489 33.8 31.4 - 36.255–64 4,166 80.0 78.1 - 82.0 3,926 28.0 25.8 - 30.165–74 2,966 82.5 80.3 - 84.6 2,861 25.3 22.6 - 27.975 AND OLDER 2,328 85.2 82.9 - 87.5 2,245 16.7 14.2 - 19.1
RACE-ETHNICITY*WHITE 15,172 80.2 79.1 - 81.4 13,932 36.9 35.3 - 38.5BLACK 1,116 77.7 73.4 - 82.1 957 46.5 40.6 - 52.3HISPANIC 1,368 82.2 78.7 - 85.8 1,085 41.8 36.1 - 47.5ASIAN 356 89.1 84.0 - 94.2 268 41.2 31.5 - 50.9
DISABILITY¶
DISABILITY 5,266 73.7 71.6 - 75.8 4,859 39.4 36.8 - 42.1NO DISABILITY 13,267 82.5 81.3 - 83.7 11,835 37.5 35.7 - 39.2
EDUCATION
< HIGH SCHOOL 1,404 72.5 68.3 - 76.6 1,216 42.2 36.9 - 47.4HIGH SCHOOL 4,611 73.1 70.8 - 75.4 4,133 42.4 39.3 - 45.4COLLEGE 1–3 YRS 4,480 79.0 77.0 - 81.1 4,040 42.5 39.5 - 45.6COLLEGE 4+ YRS 8,082 89.2 88.1 - 90.3 7,342 30.5 28.5 - 32.6
HOUSEHOLD INCOME
<$25,000 4,278 71.4 68.9 - 73.9 3,720 42.4 39.1 - 45.7$25,000–34,999 1,661 75.3 71.4 - 79.2 1,445 43.2 38.0 - 48.5$35,000–49,999 2,130 78.8 75.8 - 81.7 1,906 43.8 39.1 - 48.5$50,000–74,999 2,416 79.9 77.0 - 82.9 2,214 38.3 34.3 - 42.2$75,000+ 5,519 88.9 87.5 - 90.2 5,127 33.1 30.8 - 35.5
REGION
I–WESTERN 2,559 79.6 76.9 - 82.3 2,313 38.0 34.4 - 41.6II–CENTRAL 2,420 78.4 75.6 - 81.3 2,175 38.4 34.4 - 42.3III–NORTH EAST 4,308 81.4 79.0 - 83.8 3,963 40.8 37.4 - 44.2IV–METRO WEST 2,790 83.7 81.5 - 85.8 2,498 33.1 30.0 - 36.3V–SOUTH EAST 4,545 78.5 76.1 - 80.9 4,220 38.1 34.9 - 41.4VI–BOSTON 1,936 80.8 78.1 - 83.5 1,607 42.5 37.9 - 47.1
§ Data presented for the landline sample only* White, Black, and Asian race categories refer to non-Hispanic¶ Disability defined as having one or more of the following conditions: (1) physical, mental, or emotional problem that limited activities or caused cognitive difficulties; or (2) used special equipment or required help from others to get around. Please note that this differs from the definition used in previous years’ reports.
46
Section 3.4: Alcohol Use
Excessive alcohol consumption is among the leading causes of preventable death in the United States.17 Excessive drinking, including binge and heavy drinking, has numerous chronic effects including cirrhosis of the liver, pancreatitis, high blood pressure, stroke, and various cancers. Alcohol abuse can cause unintentional injuries, motor vehicle accidents, alcohol poisonings, and contributes to violence and suicides.18 In 2010, driving while under the influence of alcohol accounted for 115 alcohol-related fatalities in Massachusetts – 36% of the total traffic fatalities for the year.19
All respondents were asked about their consumption of alcohol in the past month. A drink of alcohol was defined as one can or bottle of beer, one glass of wine, one can or bottle of wine cooler, one cocktail, or one shot of liquor. Binge drinking was defined as consumption of five or more drinks for men or four or more drinks for women, on any one occasion in the past month. Heavy drinking was defined as consumption of more than 60 drinks in the past month for men and consumption of more than 30 drinks in the past month for women. Presented here are the percentage of adults who reported binge drinking and the percentage of adults who reported heavy drinking.
17 Danaei, G., et al. (2009). The Preventable Causes of Death in the United States: Comparative Risk Assessment of Dietary, Lifestyle, and Metabolic Risk Factors. PLoS Med 6(4): e1000058. Retrieved on March 3, 2011 from http://www.plosmedicine.org/article/info%3Adoi%2F10.1371%2Fjournal.pmed.100005818 Centers for Disease Control and Prevention. (2011). Alcohol and Public Health: FAQs. Retrieved on March 4, 2011 from http://www.cdc.gov/alcohol/faqs.htm#heavyDrinking19 National Highway Traffic Safety Administration, National Center for Statistics and Analysis (2010). Traffic Safety Facts – Alcohol-Impaired Driving (2010 Data) – April 2012. Retrieved on April 23, 2012 from http://www-nrd.nhtsa.dot.gov/Pubs/811606.pdf
47

48

TABLE 3.4 – ALCOHOL USE AMONG MASSACHUSETTS ADULTS, 2011
BINGE DRINKING
N % 95% CI
HEAVY DRINKING
N % 95% CIOVERALL 19,793 20.6 19.5 - 21.6 19,786 7.9 7.3 - 8.6GENDER
MALE 7,500 25.4 23.8 - 27.1 7,498 7.9 6.9 - 9.0FEMALE 12,293 16.1 14.8 - 17.3 12,288 7.9 7.1 - 8.8
AGE GROUP
18–24 699 37.8 33.0 - 42.5 697 13.0 9.8 - 16.125–34 1,940 33.5 30.3 - 36.6 1,938 9.2 7.3 - 11.235–44 2,791 23.4 21.1 - 25.8 2,789 7.8 6.2 - 9.445–54 4,007 17.1 15.4 - 18.9 4,016 6.7 5.6 - 7.855–64 4,396 12.2 10.6 - 13.8 4,399 6.8 5.7 - 7.965–74 3,129 7.4 5.9 - 8.8 3,126 7.5 5.9 - 9.175 AND OLDER 2,532 2.4 1.6 - 3.2 2,522 3.6 2.6 - 4.6
RACE-ETHNICITY*WHITE 16,064 21.9 20.8 - 23.1 16,073 8.7 7.9 - 9.4BLACK 1,195 15.8 11.7 - 19.8 1,188 4.6 2.3 - 6.9HISPANIC 1,467 17.2 13.8 - 20.7 1,463 5.0 2.8 - 7.2ASIAN 396 9.5 6.0 - 13.1 †
DISABILITY¶
DISABILITY 5,565 14.3 12.6 - 16.0 5,565 6.2 5.2 - 7.3NO DISABILITY 14,124 22.5 21.2 - 23.7 14,120 8.5 7.7 - 9.3
EDUCATION
< HIGH SCHOOL 1,528 14.9 11.8 - 18.0 1,519 6.6 4.2 - 9.1HIGH SCHOOL 4,936 19.4 17.3 - 21.5 4,940 7.4 6.1 - 8.7COLLEGE 1–3 YRS 4,699 22.2 20.0 - 24.4 4,706 8.9 7.5 - 10.2COLLEGE 4+ YRS 8,572 22.0 20.5 - 23.5 8,564 8.1 7.1 - 9.0
HOUSEHOLD INCOME
<$25,000 4,558 18.1 15.8 - 20.5 4,557 7.4 6.0 - 8.9$25,000–34,999 1,785 20.4 17.0 - 23.8 1,782 7.7 5.5 - 9.8$35,000–49,999 2,268 21.6 18.5 - 24.6 2,267 7.4 5.7 - 9.1$50,000–74,999 2,536 20.7 17.8 - 23.6 2,532 9.8 7.6 - 11.9$75,000+ 5,802 24.3 22.5 - 26.1 5,817 8.6 7.4 - 9.7
REGION
I–WESTERN 2,702 19.3 16.7 - 21.8 2,693 6.9 5.3 - 8.5II–CENTRAL 2,547 20.0 17.3 - 22.7 2,550 8.7 6.7 - 10.8III–NORTH EAST 4,558 19.9 17.6 - 22.3 4,547 7.9 6.4 - 9.4IV–METRO WEST 2,944 19.7 17.3 - 22.0 2,945 7.0 5.6 - 8.4V–SOUTH EAST 4,811 21.0 18.6 - 23.4 4,816 7.7 6.3 - 9.1
49
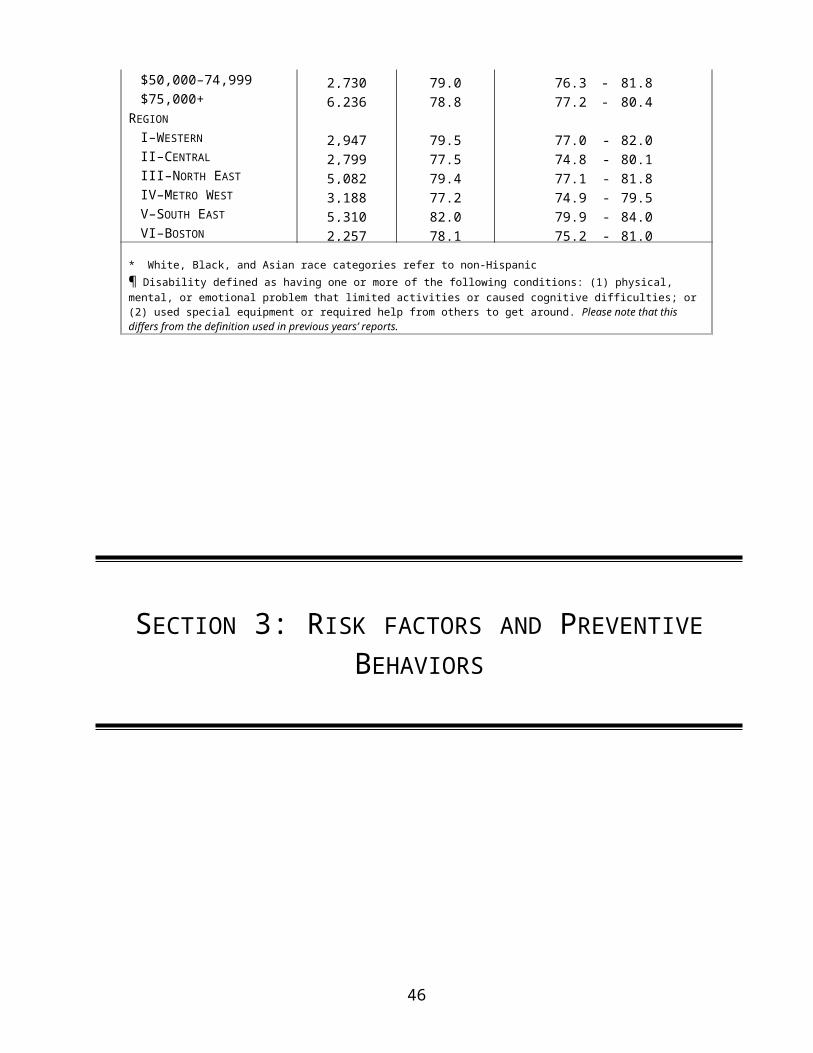
VI–BOSTON 2,028 22.4 19.4 - 25.4 2,033 10.2 8.1 - 12.3
* White, Black, and Asian race categories refer to non-Hispanic† Insufficient Data¶ Disability defined as having one or more of the following conditions: (1) physical, mental, or emotional problem that limited activities or caused cognitive difficulties; or (2) used special equipment or required help from others to get around. Please note that this differs from the definition used in previous years’ reports.
Section 3.5: Overweight and Obesity Status
Obese and/or overweight adults are at increased risk of developing serious health conditions such as hypertension, dyslipidemia (a disorder of lipoprotein metabolism, which may include overproduction of blood cholesterol), type 2 diabetes, coronary heart disease, stroke, gallbladder disease, osteoarthritis, sleep apnea, respiratory problems, and certain cancers, including endometrial, breast, and colon cancer. An estimated 1.82 billion dollars in medical expenses are attributable to adult obesity in Massachusetts.20
To address this significant public health problem in the state of Massachusetts, in January 2009, the Department of Public Health launched the Mass in Motion program. A multi-pronged approach to address the obesity epidemic, Mass in Motion (a public/private initiative) includes: support for regulatory changes to promote healthy diet and exercise, such as menu labeling; grants to cities and towns to promote wellness at the community level; the expansion of workplace wellness programs; and a state-sponsored web-site promoting better eating and increasing physical activity.21
All respondents were asked to report their height and weight. Respondents’ overweight status and obesity status were categorized based on their Body Mass Index (BMI), which equals weight in kilograms divided by height in meters squared. All adults with a BMI between 25.0 and 29.9 were classified as being overweight and adults with a BMI greater than or equal to 30.0 were classified as being obese. Presented here are the percentages of adults who were defined as overweight and obese. Please note that the overweight category includes all adults with a BMI of greater than 25.0, including those who are obese.
50

51

TABLE 3.5 – OVERWEIGHT AND OBESE AMONG MASSACHUSETTS ADULTS, 2011
OVERWEIGHT (BMI 25.0)
N % 95% CI
OBESE (BMI 30.0) N % 95% CI
OVERALL 20,532 59.3 58.2 - 60.5 20,532 22.7 21.8 - 23.7GENDER
MALE 8,221 68.2 66.5 - 69.8 8,221 24.1 22.6 - 25.5FEMALE 12,311 50.5 49.0 - 52.0 12,311 21.4 20.2 - 22.6
AGE GROUP
18–24 743 38.0 33.3 - 42.6 743 13.0 9.9 - 16.225–34 1,975 54.1 50.9 - 57.4 1,975 18.6 16.2 - 21.135–44 2,886 61.9 59.2 - 64.5 2,886 25.0 22.6 - 27.545–54 4,181 65.5 63.4 - 67.6 4,181 26.3 24.2 - 28.455–64 4,490 68.0 65.9 - 70.1 4,490 28.9 26.8 - 31.065–74 3,232 67.5 65.1 - 69.9 3,232 26.8 24.3 - 29.275 AND OLDER 2,741 57.8 55.0 - 60.7 2,741 18.4 16.0 - 20.8
RACE-ETHNICITY*WHITE 16,593 59.0 57.8 - 60.3 16,593 22.1 21.1 - 23.1BLACK 1,292 69.1 64.7 - 73.5 1,292 31.6 27.2 - 36.0HISPANIC 1,524 65.5 61.3 - 69.7 1,524 30.9 26.9 - 34.9ASIAN 423 38.2 31.7 - 44.7 423 4.9 2.3 - 7.5
DISABILITY¶
DISABILITY 5,397 67.1 64.9 - 69.2 5,397 33.7 31.6 - 35.8NO DISABILITY 13,567 57.1 55.7 - 58.5 13,567 19.7 18.6 - 20.8
EDUCATION
< HIGH SCHOOL 1,623 62.7 58.5 - 67.0 1,623 31.1 27.3 - 34.8HIGH SCHOOL 5,314 62.7 60.3 - 65.0 5,314 25.2 23.2 - 27.2COLLEGE 1–3 YRS 4,835 61.2 58.9 - 63.6 4,835 24.1 22.2 - 26.0COLLEGE 4+ YRS 8,708 54.3 52.6 - 55.9 8,708 17.3 16.1 - 18.5
HOUSEHOLD INCOME
<$25,000 4,847 59.6 57.1 - 62.1 4,847 27.3 25.0 - 29.5$25,000–34,999 1,853 57.9 53.9 - 61.8 1,853 22.9 19.9 - 25.9$35,000–49,999 2,368 62.1 58.8 - 65.4 2,368 25.4 22.5 - 28.3$50,000–74,999 2,587 63.9 60.8 - 67.1 2,587 24.6 21.8 - 27.3$75,000+ 5,958 58.9 57.0 - 60.8 5,958 19.3 17.9 - 20.8
REGION
I–WESTERN 2,791 61.8 58.8 - 64.7 2,791 26.1 23.6 - 28.6II–CENTRAL 2,627 61.7 58.5 - 64.8 2,627 23.1 20.5 - 25.6III–NORTH EAST 4,733 60.0 57.3 - 62.7 4,733 22.7 20.4 - 25.0IV–METRO WEST 3,003 54.0 51.4 - 56.7 3,003 17.6 15.7 - 19.5V–SOUTH EAST 4,988 62.4 59.9 - 64.9 4,988 25.8 23.5 - 28.0VI–BOSTON 2,124 56.7 53.4 - 60.1 2,124 22.1 19.4 - 24.7
52

* White, Black, and Asian race categories refer to non-Hispanic¶ Disability defined as having one or more of the following conditions: (1) physical, mental, or emotional problem that limited activities or caused cognitive difficulties; or (2) used special equipment or required help from others to get around. Please note that this differs from the definition used in previous years’ reports.
Section 3.6: Physical Activity
Regular physical activity reduces a person’s risk for heart attack, colon cancer, diabetes, and high blood pressure, and helps to reduce the risk of stroke. Additionally, it helps to control weight, contributes to healthy bones, muscles, and joints, reduces falls among older adults, helps to relieve the pain of arthritis, reduces symptoms of anxiety and depression, and is associated with fewer hospitalizations, physician visits, and medications.22
In 2011, all respondents who reported ANY leisure-time physical activity were asked what two types of physical activity gave them the most exercise in the past month. They were also asked how frequently and for how long they took part in these activities. All respondents were also asked how frequently they took part in activities or exercises to strengthen muscles.
Healthy People 2020 objectives for physical activity for adults include:1. Increase the proportion of adults who engage in aerobic physical activity of at least moderate intensity for at least 150 minutes/week, or 75 minutes/week of vigorous intensity, or an equivalent combination.2. Increase the proportion of adults who engage in aerobic physical activity of at least moderate intensity for more than 300 minutes/week, or more than 150 minutes/week of vigorous intensity, or an equivalent combination.3. Increase the proportion of adults who perform muscle-strengthening activities on 2 or more days of the week.4
Presented below, in accordance to the Healthy People 2020 objectives, are the percentage of respondents who meet the 150-minute aerobic recommendation and the percentage of respondents who meet the muscle-strengthening recommendation. Please note that these indicators are NOT mutually exclusive e.g. people doing aerobic activity may or may not also do muscle-strengthening activities.
53

TABLE 3.6 – PHYSICAL ACTIVITY AMONG MASSACHUSETTS ADULTS, 2011
MET AEROBIC ACTIVITY GUIDELINE (>= 150 MINUTES/WEEK)
N % 95% CI
MET GUIDELINE FOR MUSCLE STRENGTHENING ACTIVITY (2+ DAYS/WEEK)
N % 95% CIOVERALL 19,779 56.3 55.1 - 57.4 20,304 32.0 30.9 - 33.1GENDER
MALE 7,564 58.4 56.6 - 60.2 7,723 36.0 34.2 - 37.8FEMALE 12,215 54.3 52.8 - 55.8 12,581 28.3 26.9 - 29.6
AGE GROUP
18–24 727 59.5 54.7 - 64.3 724 44.5 39.6 - 49.325–34 1,957 54.1 50.8 - 57.4 1,987 36.3 33.1 - 39.535–44 2,831 56.0 53.2 - 58.8 2,858 33.0 30.4 - 35.645–54 4,084 57.8 55.5 - 60.1 4,121 29.4 27.3 - 31.455–64 4,418 55.9 53.7 - 58.2 4,489 27.8 25.8 - 29.765–74 3,142 57.1 54.4 - 59.7 3,207 26.7 24.4 - 29.175 AND OLDER 2,529 54.4 51.4 - 57.5 2,603 21.8 19.4 - 24.3
RACE-ETHNICITY*WHITE 16,053 58.2 57.0 - 59.5 16,444 32.0 30.8 - 33.2BLACK 1,179 54.5 49.6 - 59.3 1,229 32.5 27.8 - 37.1HISPANIC 1,504 44.0 39.8 - 48.3 1,527 30.0 25.8 - 34.1ASIAN 388 50.4 43.4 - 57.5 406 36.0 29.4 - 42.7
DISABILITY¶
DISABILITY 5,504 45.3 43.1 - 47.5 5,708 26.4 24.4 - 28.4NO DISABILITY 13,994 59.4 58.0 - 60.7 14,392 33.7 32.3 - 35.0
EDUCATION
< HIGH SCHOOL 1,536 42.4 38.0 - 46.7 1,600 22.2 18.5 - 25.9HIGH SCHOOL 4,971 50.5 48.1 - 52.9 5,109 25.6 23.4 - 27.7COLLEGE 1–3 YRS 4,687 57.9 55.6 - 60.3 4,815 32.8 30.4 - 35.1COLLEGE 4+ YRS 8,534 63.5 61.9 - 65.1 8,721 39.1 37.4 - 40.7
HOUSEHOLD INCOME
<$25,000 4,576 47.8 45.2 - 50.4 4,696 26.2 23.8 - 28.6$25,000–34,999 1,786 51.9 48.0 - 55.9 1,822 28.6 25.1 - 32.1$35,000–49,999 2,272 55.3 51.8 - 58.9 2,323 30.9 27.6 - 34.2$50,000–74,999 2,539 56.8 53.5 - 60.0 2,578 30.7 27.7 - 33.7
54

$75,000+ 5,822 63.7 61.8 - 65.6 5,922 37.4 35.5 - 39.3REGION
I–WESTERN 2,676 57.5 54.6 - 60.4 2,758 28.8 26.0 - 31.6II–CENTRAL 2,550 56.2 53.0 - 59.3 2,614 30.9 27.8 - 34.0III–NORTH EAST 4,579 52.9 50.2 - 55.7 4,695 31.7 29.1 - 34.3IV–METRO WEST 2,927 60.4 57.8 - 63.0 2,991 35.1 32.6 - 37.6V–SOUTH EAST 4,805 55.6 52.9 - 58.2 4,947 31.3 28.8 - 33.7VI–BOSTON 2,038 55.4 52.0 - 58.8 2,089 34.4 31.1 - 37.6
* White, Black, and Asian race categories refer to non-Hispanic¶ Disability defined as having one or more of the following conditions: (1) physical, mental, or emotional problem that limited activities or caused cognitive difficulties; or (2) used special equipment or required help from others to get around. Please note that this differs from the definition used in previous years’ reports.
Section 3.7: Fruit and Vegetable Consumption
A diet rich in fruits and vegetables not only aids in weight management, but also has been associated with a decreased risk for chronic diseases.23 The goal for Healthy People 2020 is to ensure that adults consume at least 0.9 cup equivalents of fruit, 1.1 cup equivalents of vegetables and 0.3 cup equivalents of dark green vegetables, orange vegetables and legumes per 1000 calories.4
All respondents were asked how many servings of fruits and vegetables they consumed each day. Methodology is being developed to convert the BRFSS data to cup equivalents per 1000 calories, but is not yet available. Presented here is the percentage of respondents who stated that they consumed at least five servings of fruits or vegetables per day. Although this relates to the prior recommendation, it maintains the consistency of the indicator.
55

TABLE 3.7 – FRUIT AND VEGETABLE CONSUMPTION AMONG MASSACHUSETTS ADULTS, 2011
5 OR MORE SERVINGS OF FRUITS OR VEGETABLES PER DAY
N % 95% CIOVERALL 20,805 18.8 17.9 - 19.7
GENDER
MALE 7,903 14.7 13.5 - 16.0FEMALE 12,902 22.5 21.3 - 23.8
AGE GROUP
18–24 757 18.0 14.3 - 21.825–34 2,036 16.8 14.5 - 19.235–44 2,931 19.1 17.0 - 21.245–54 4,218 18.7 17.0 - 20.555–64 4,604 20.1 18.4 - 21.865–74 3,255 19.9 17.8 - 22.175 AND OLDER 2,668 20.1 17.8 - 22.5
RACE-ETHNICITY*WHITE 16,812 18.7 17.8 - 19.7BLACK 1,273 18.7 14.7 - 22.6HISPANIC 1,579 19.9 16.4 - 23.4ASIAN 422 18.4 13.5 - 23.4
DISABILITY¶
DISABILITY 5,740 17.7 16.1 - 19.3NO DISABILITY 14,437 19.3 18.2 - 20.4
EDUCATION
< HIGH SCHOOL 1,633 15.6 12.5 - 18.8HIGH SCHOOL 5,270 15.0 13.3 - 16.7COLLEGE 1–3 YRS 4,948 18.8 17.0 - 20.6COLLEGE 4+ YRS 8,889 22.6 21.3 - 23.9
56
HOUSEHOLD INCOME
<$25,000 4,841 15.9 14.2 - 17.7$25,000–34,999 1,867 14.1 11.7 - 16.5$35,000–49,999 2,379 18.5 15.8 - 21.1$50,000–74,999 2,627 20.8 18.2 - 23.5$75,000+ 6,030 21.6 20.1 - 23.2
REGION
I–WESTERN 2,829 18.1 16.0 - 20.2II–CENTRAL 2,683 17.1 15.0 - 19.3III–NORTH EAST 4,825 19.0 17.0 - 21.0IV–METRO WEST 3,055 21.0 18.9 - 23.1V–SOUTH EAST 5,075 18.4 16.3 - 20.4VI–BOSTON 2,124 18.0 15.4 - 20.6
* White, Black, and Asian race categories refer to non-Hispanic¶ Disability defined as having one or more of the following conditions: (1) physical, mental, or emotional problem that limited activities or caused cognitive difficulties; or (2) used special equipment or required help from others to get around. Please note that this differs from the definition used in previous years’ reports.
Section 3.8: Cholesterol Awareness
High cholesterol, defined as total serum cholesterol over 199 mg/dL, is an important risk factor for cardiovascular disease.24
Researchers consider it important to discern cholesterol awareness in various populations so that prevention efforts may be more targeted. Reducing the proportion of people with high serum cholesterol levels to 13.5% or less is one of the objectives listed in Healthy People 2020.4
All respondents were asked about whether they had ever had their cholesterol tested, and, if so, how long it had been since they last had it tested. Respondents who indicated that they had ever had their cholesterol tested were asked if they had ever been told by a doctor, nurse, or other medical professional that they had high cholesterol. Below are the percentages of adults who indicated that they had had their cholesterol tested in the past five years and the percentage of adults who had ever been tested and told that they have high cholesterol.
57

TABLE 3.8 – CHOLESTEROL AWARENESS AMONG MASSACHUSETTS ADULTS, 2011
CHOLESTEROL CHECKED IN PAST 5 YEARS
N % 95% CI
HIGH CHOLESTEROL** N % 95% CI
OVERALL 21,590 83.7 82.7 - 84.7 19,891 34.3 33.2 - 35.3GENDER
MALE 8,194 82.1 80.6 - 83.6 7,415 35.6 34.0 - 37.3FEMALE 13,396 85.2 83.9 - 86.5 12,476 33.0 31.7 - 34.4
AGE GROUP
18–24 703 49.9 44.9 - 54.8 391 9.9 6.0 - 13.825–34 2,054 71.1 68.1 - 74.1 1,636 15.0 12.5 - 17.535–44 3,055 85.3 83.2 - 87.3 2,754 25.0 22.5 - 27.545–54 4,383 91.2 89.8 - 92.6 4,149 34.5 32.3 - 36.855–64 4,783 95.0 94.1 - 96.0 4,585 49.1 46.8 - 51.365–74 3,384 96.3 95.3 - 97.4 3,300 53.8 51.2 - 56.575 AND OLDER 2,834 95.9 95.0 - 96.9 2,711 48.8 45.9 - 51.8
RACE-ETHNICITY*WHITE 17,368 86.2 85.1 - 87.3 16,316 35.4 34.2 - 36.5BLACK 1,354 78.1 73.9 - 82.4 1,184 30.8 26.4 - 35.3HISPANIC 1,649 68.5 64.6 - 72.4 1,329 32.1 27.8 - 36.3ASIAN 443 75.1 69.0 - 81.2 364 21.6 15.9 - 27.3
DISABILITY¶
DISABILITY 5,562 89.6 88.0 - 91.2 5,267 46.6 44.3 - 48.8NO DISABILITY 14,089 82.6 81.4 - 83.9 12,904 30.7 29.5 - 32.0
EDUCATION
< HIGH SCHOOL 1,732 73.2 69.4 - 77.1 1,468 41.9 37.5 - 46.3HIGH SCHOOL 5,536 82.4 80.4 - 84.3 4,999 36.8 34.6 - 39.0COLLEGE 1–3 YRS 5,070 83.5 81.4 - 85.6 4,695 33.3 31.3 - 35.4COLLEGE 4+ YRS 9,089 88.1 86.8 - 89.4 8,590 31.2 29.8 - 32.7
HOUSEHOLD INCOME
<$25,000 4,968 76.3 74.0 - 78.7 4,405 38.5 36.0 - 40.9$25,000–34,999 1,892 80.2 76.7 - 83.6 1,701 37.5 33.7 - 41.3
58

$35,000–49,999 2,437 85.0 82.1 - 88.0 2,258 36.1 32.9 - 39.3$50,000–74,999 2,688 86.2 83.4 - 89.0 2,515 34.6 31.6 - 37.5$75,000+ 6,151 89.7 88.2 - 91.1 5,891 30.2 28.5 - 31.9
REGION
I–WESTERN 2,876 81.8 79.1 - 84.4 2,623 34.3 31.7 - 37.0II–CENTRAL 2,741 82.5 79.7 - 85.3 2,520 34.1 31.3 - 36.9III–NORTH EAST 4,975 84.6 82.3 - 86.9 4,587 36.2 33.7 - 38.7IV–METRO WEST 3,095 87.0 84.7 - 89.2 2,907 33.9 31.6 - 36.2V–SOUTH EAST 5,205 86.4 84.3 - 88.5 4,844 35.7 33.4 - 38.1VI–BOSTON 2,186 77.2 74.0 - 80.4 1,962 31.5 28.5 - 34.4
* White, Black, and Asian race categories refer to non-Hispanic** Analysis conducted among those who reported having their cholesterol checked.¶ Disability defined as having one or more of the following conditions: (1) physical, mental, or emotional problem that limited activities or caused cognitive difficulties; or (2) used special equipment or required help from others to get around. Please note that this differs from the definition used in previous years’ reports.
Section 3.9: Hypertension Awareness
Hypertension, commonly known as “high blood pressure,” is a risk factor for many conditions including heart disease, kidney failure, stroke, and disability.25 According to the CDC, approximately one in four U.S. adults has hypertension.25 Hypertension is defined as having an average systolic blood pressure greater than or equal to 140 mm Hg or an average diastolic blood pressure greater than or equal to 90 mm Hg.25 To reduce the incidence of chronic diseases and potentially fatal conditions resulting from hypertension, the Healthy People 2020 goal is to reduce the proportion of U.S. adults with high blood pressure to 26.9% or less.4
All respondents were asked if a doctor, nurse, or other health professional had ever told them that they had high blood pressure. Respondents who answered yes were then asked if they were taking medication for their high blood pressure. Presented below are the percentages of respondents who had been told that they had high blood pressure and, if so, if they are currently taking medication to treat it.
59

TABLE 3.9 – HYPERTENSION AWARENESS AMONG MASSACHUSETTS ADULTS, 2011
HIGH BLOOD PRESSURE
N % 95% CI
TAKE MEDICINE FOR HIGH BLOOD PRESSURE**
N % 95% CIOVERALL 22,254 29.2 28.3 - 30.2 8,210 76.9 75.1 - 78.7GENDER
MALE 8,446 30.9 29.3 - 32.4 3,264 70.7 67.8 - 73.5FEMALE 13,808 27.7 26.5 - 28.9 4,946 83.3 81.3 - 85.3
AGE GROUP
18–24 808 7.9 5.5 - 10.3 †25–34 2,182 11.7 9.6 - 13.8 247 35.6 26.5 - 44.635–44 3,141 18.7 16.5 - 21.0 508 51.0 44.1 - 57.945–54 4,469 27.9 25.8 - 29.9 1,268 75.4 71.5 - 79.355–64 4,844 43.7 41.5 - 45.8 2,137 85.0 82.4 - 87.665–74 3,464 57.9 55.3 - 60.4 1,990 93.5 91.9 - 95.075 AND OLDER 2,947 61.5 58.8 - 64.3 1,840 94.0 92.0 - 96.1
RACE-ETHNICITY*WHITE 17,877 30.1 29.0 - 31.2 6,673 77.7 75.7 - 79.7BLACK 1,403 34.6 30.4 - 38.7 596 74.4 67.7 - 81.1HISPANIC 1,713 23.2 20.0 - 26.3 575 69.9 63.0 - 76.9ASIAN 461 14.4 9.9 - 18.9 68 75.6 61.0 - 90.2
DISABILITY¶
DISABILITY 5,757 42.9 40.8 - 45.1 2,908 84.5 81.9 - 87.1NO DISABILITY 14,480 25.0 24.0 - 26.1 4,538 73.4 71.0 - 75.8
EDUCATION
< HIGH SCHOOL 1,811 37.1 33.4 - 40.8 915 75.4 69.5 - 81.4HIGH SCHOOL 5,731 34.3 32.3 - 36.4 2,535 77.6 74.3 - 80.8COLLEGE 1–3 YRS 5,224 31.0 29.1 - 33.0 2,015 75.7 72.2 - 79.3COLLEGE 4+ YRS 9,314 21.5 20.4 - 22.7 2,678 78.0 75.4 - 80.7
HOUSEHOLD INCOME
<$25,000 5,160 36.0 33.7 - 38.2 2,431 77.8 74.4 - 81.2$25,000–34,999 1,962 34.5 31.1 - 37.9 844 79.2 73.7 - 84.7$35,000–49,999 2,498 31.8 28.9 - 34.7 954 79.1 74.2 - 83.9$50,000–74,999 2,741 30.5 27.7 - 33.3 913 73.1 67.4 - 78.7$75,000+ 6,248 21.8 20.3 - 23.2 1,584 74.2 70.6 - 77.8
REGION
60

I–WESTERN 2,971 31.2 28.7 - 33.6 1,159 76.8 72.6 - 81.1II–CENTRAL 2,815 29.2 26.6 - 31.8 1,000 75.6 70.4 - 80.9III–NORTH EAST 5,111 32.0 29.6 - 34.3 1,941 73.9 69.4 - 78.4IV–METRO WEST 3,197 25.4 23.3 - 27.4 1,002 81.9 78.0 - 85.8V–SOUTH EAST 5,347 32.2 30.0 - 34.4 2,184 79.1 75.4 - 82.7VI–BOSTON 2,260 25.2 22.6 - 27.7 756 73.5 68.2 - 78.9
* White, Black, and Asian race categories refer to non-Hispanic** Analysis conducted among those who reported having high blood pressure† Insufficient Data¶ Disability defined as having one or more of the following conditions: (1) physical, mental, or emotional problem that limited activities or caused cognitive difficulties; or (2) used special equipment or required help from others to get around. Please note that this differs from the definition used in previous years’ reports.
SECTION 4: IMMUNIZATION
61
SECTION 4: IMMUNIZATION
Section 4.1: Flu Vaccine and Pneumonia Vaccine
Influenza, or the flu, is a contagious respiratory illness caused by influenza viruses. It can cause mild to severe illness and can even lead to death. Because of the fluctuations in the length and severity of the flu from year to year, the CDC estimates that from the 1976-1977 season to the 2006-2007 flu season, flu-associated deaths ranged from a low of about 3,000 to a high of about 49,000 people.26 Adults 65 years or older, children younger than 2 years old, and individuals with chronic medical conditions are at an increased risk for pneumococcal infection. In Massachusetts, flu and pneumonia were the seventh leading causes of death in 2008 among adults 65 and older.27
All respondents were asked if they had received an influenza vaccine (flu shot) or nasal flu spray (flu mist) within the past 12 months. In addition, all respondents were asked if they had ever received a pneumonia vaccine. Presented here are the percentages of adults ages 18-49 years, 50-64 years and ages 65 and older who received a flu vaccine or spray in the past year, and the percentage of adults, ages 65 and older, who reported that they had ever had a pneumonia vaccination.
26 Centers for Disease Control and Prevention. (2011). Estimating Seasonal Influenza-Associated Deaths in the United States: CDC Study Confirms Variability of Flu. Retrieved on March 8, 2011, from http://www.cdc.gov/flu/about/disease/us_flu-related_deaths.htm27 Massachusetts Department of Public Health, Bureau of Health Information, Statistics, Research and Evaluation. (August 2010). Massachusetts Deaths 2008. Boston, MA
62

TABLE 4.1.1 – FLU VACCINE AMONG MASSACHUSETTS ADULTS, AGES 18-64, 2011
FLU VACCINE IN PAST YEAR, AGES 18-49
N % 95% CI
FLU VACCINE IN PAST YEAR, AGES 50-64
N % 95% CI
OVERALL 7,343 35.1 33.4 - 36.8 6,694 48.7 46.8 - 50.6GENDER
MALE 2,954 31.6 29.1 - 34.0 2,603 47.3 44.4 - 50.3FEMALE 4,389 38.6 36.3 - 41.0 4,091 49.9 47.6 - 52.3
AGE GROUP
18–24 720 31.8 27.2 - 36.425-34 1,959 34.1 31.1 - 37.235-44 4,664 38.5 35.8 - 41.145-49 1,842 35.0 31.8 - 38.250-64 6,694 48.7 46.8 50.6
RACE-ETHNICITY*WHITE 5,308 34.5 32.5 - 36.5 5,621 48.8 46.8 - 50.8BLACK 591 30.2 24.5 - 35.9 351 45.6 37.1 - 54.1HISPANIC 875 37.7 32.7 - 42.7 402 47.3 38.8 - 55.8ASIAN 303 42.5 34.7 - 50.3 68 54.8 37.5 - 72.2
DISABILITY¶
DISABILITY 1,342 37.3 33.3 - 41.4 2,118 54.9 51.5 - 58.3NO DISABILITY 5,971 34.6 32.8 - 36.5 4,540 46.3 44.1 - 48.6
EDUCATION
< HIGH SCHOOL 459 31.4 25.0 - 37.7 433 48.9 41.1 - 56.8HIGH SCHOOL 1,574 27.6 24.1 - 31.1 1,575 45.4 41.3 - 49.5COLLEGE 1–3 YRS 1,781 33.0 29.6 - 36.4 1,577 46.7 43.0 - 50.4COLLEGE 4+ YRS 3,516 42.7 40.3 - 45.1 3,090 52.1 49.6 - 54.5
HOUSEHOLD INCOME
<$25,000 1,467 31.3 27.6 - 34.9 1,351 46.8 42.3 - 51.2$25,000–34,999 552 28.3 22.5 - 34.1 489 44.4 37.3 - 51.5$35,000–49,999 786 28.3 23.6 - 32.9 731 45.3 39.4 - 51.2$50,000–74,999 972 35.2 30.4 - 40.0 988 52.9 48.1 - 57.7$75,000+ 2,803 42.4 39.7 - 45.2 2,313 49.4 46.4 - 52.3
REGION
I–WESTERN 962 30.6 26.3 - 34.9 964 49.8 45.3 - 54.4II–CENTRAL 995 32.5 28.1 - 36.9 855 46.8 41.8 - 51.8III–NORTH EAST 1,708 36.7 32.6 - 40.7 1,517 47.7 43.1 - 52.2IV–METRO WEST 1,085 40.2 36.2 - 44.3 1,004 53.6 49.4 - 57.7V–SOUTH EAST 1,552 31.4 27.5 - 35.4 1,666 45.0 41.0 - 49.0VI–BOSTON 874 40.5 35.9 - 45.1 659 48.5 43.1 - 53.9
* White, Black, and Asian race categories refer to non-Hispanic¶ Disability defined as having one or more of the following conditions: (1) physical, mental, or emotional problem that limited activities or caused cognitive difficulties; or (2) used special equipment or required help from others to get around. Please note that this differs from the definition used in previous years’ reports.

TABLE 4.1.2 – FLU VACCINE AMONG MASSACHUSETTS ADULTS, AGES 65 YEARS AND OLDER, 2011
FLU VACCINE IN PAST YEAR, AGES 65+
N % 95% CIOVERALL 5,741 66.9 65.0 - 68.7
GENDER
MALE 1,997 68.2 65.0 - 71.4FEMALE 3,744 65.9 63.6 - 68.2
AGE GROUP
65–74 3,178 63.1 60.5 - 65.775 AND OLDER 2,563 71.1 68.4 - 73.8
RACE-ETHNICITY*WHITE 5,120 68.4 66.5 - 70.3BLACK 234 47.2 36.8 - 57.6HISPANIC 223 60.8 48.1 - 73.5ASIAN †
DISABILITY¶
DISABILITY 2,100 68.4 65.3 - 71.5NO DISABILITY 3,608 65.9 63.5 - 68.3
EDUCATION
< HIGH SCHOOL 648 62.3 56.0 - 68.7HIGH SCHOOL 1,820 66.4 63.0 - 69.8COLLEGE 1–3 YRS 1,357 65.9 62.2 - 69.6COLLEGE 4+ YRS 1,895 71.3 68.5 - 74.1
HOUSEHOLD INCOME
<$25,000 1,752 64.5 60.8 - 68.1$25,000–34,999 746 62.9 57.6 - 68.3$35,000–49,999 763 64.8 59.6 - 70.1$50,000–74,999 577 68.7 62.8 - 74.6$75,000+ 697 72.3 67.7 - 76.9
REGION
I–WESTERN 785 69.6 64.7 - 74.5II–CENTRAL 686 65.3 59.8 - 70.9III–NORTH EAST 1,344 66.1 61.8 - 70.4IV–METRO WEST 840 72.0 68.1 - 75.9V–SOUTH EAST 1,589 63.3 59.4 - 67.2VI–BOSTON 491 63.5 57.6 - 69.4
* White, Black, and Asian race categories refer to non-Hispanic¶ Disability defined as having one or more of the following conditions: (1) physical, mental, or emotional problem that limited activities or caused cognitive difficulties; or (2) used special equipment or required help from others to get around. Please note that this differs from the definition used in previous years’ reports.

TABLE 4.1.3 – PNEUMONIA VACCINE AMONG MASSACHUSETTS ADULTS, AGES 65 YEARS AND OLDER, 2011
EVER HAD PNEUMONIA VACCINE
N % 95% CI OVERALL 5,448 72.2 70.3 - 74.0GENDER
MALE 1,865 68.2 64.9 - 71.5FEMALE 3,583 75.0 72.9 - 77.2
AGE GROUP
65–74 3,014 67.1 64.5 - 69.775 AND OLDER 2,434 77.9 75.2 - 80.5
RACE-ETHNICITY*WHITE 4,875 73.9 72.0 - 75.8BLACK 224 46.6 36.1 - 57.0HISPANIC 196 58.6 45.1 - 72.1ASIAN †
DISABILITY¶
DISABILITY 2,008 78.2 75.2 - 81.1NO DISABILITY 3,407 68.7 66.3 - 71.1
EDUCATION
< HIGH SCHOOL 602 65.5 58.9 - 72.0HIGH SCHOOL 1,738 72.4 69.0 - 75.7COLLEGE 1–3 YRS 1,292 75.5 72.1 - 78.9COLLEGE 4+ YRS 1,799 72.5 69.7 - 75.4
HOUSEHOLD INCOME
<$25,000 1,671 74.9 71.5 - 78.3$25,000–34,999 710 70.4 65.0 - 75.7$35,000–49,999 727 73.1 68.1 - 78.0$50,000–74,999 556 69.4 63.2 - 75.6$75,000+ 659 69.9 65.0 - 74.9
REGION
I–WESTERN 750 72.8 68.0 - 77.6II–CENTRAL 648 71.1 65.2 - 77.0III–NORTH EAST 1,273 73.6 69.5 - 77.7IV–METRO WEST 799 77.7 73.9 - 81.4V–SOUTH EAST 1,512 70.0 66.2 - 73.8VI–BOSTON 460 58.7 52.8 - 64.6
* White, Black, and Asian race categories refer to non-Hispanic† Insufficient data¶ Disability defined as having one or more of the following conditions: (1) physical, mental, or emotional problem that limited activities or caused cognitive difficulties; or (2) used special equipment or required help from others to get around. Please note that this differs from the definition used in previous years’ reports.

Section 4.2: Human Papilloma Virus (HPV)
Genital human papilloma virus (also called HPV) is the most common sexually transmitted infection (STI). Approximately 20 million Americans are currently infected with HPV. Another 6 million people become newly infected each year. HPV is so common that at least 50% of sexually active men and women get it at some point in their lives.28
Vaccines can protect both males and females against some of the most common types of HPV. These vaccines are given in three shots. It is important to get all three doses to get the best protection. The vaccines are most effective when given before a person's first sexual contact. Cervarix and Gardisil protect females against HPV that causes most cervical cancer. Gardisil protects both males and females from genital warts.28
All respondents between the ages of 18-49 were asked if they had ever received the HPV vaccine; if they responded yes, they were then asked how many HPV shots they had received. Presented are the percentage of females aged 18-49 who had ever received the HPV vaccine and the percentage of those who had completed the series of three shots. Percentages for males are not presented due to insufficient data.
Questions about HPV vaccination were asked only on the MA BRFSS landline survey in 2011 and not the cell phone survey; therefore the results in Table 4.2 represent the landline sample only.
28 Centers for Disease Control and Prevention. (2011). Sexually Transmitted Diseases (STDs) - Genital HPV Infection - Fact Sheet. Retrieved March 8, 2011 from http://www.cdc.gov/std/hpv/stdfact-hpv.htm/

TABLE 4.2 – HPV VACCINE AMONG MASSACHUSETTS FEMALES, AGES 18-49 YEARS, 2011§
EVER HAD HPV VACCINE
N % 95% CI
COMPLETED SERIES ** N % 95% CI
OVERALL 3,445 19.1 16.1 - 22.1 275 73.8 65.6 - 82.0AGE GROUP
18-24 207 62.2 53.3 - 71.2 118 78.3 68.6 - 88.025-34 846 14.2 10.3 - 18.0 114 62.3 46.2 - 78.535-44 1,455 1.8 1.0 - 2.6 †
45-49 937 2.9 1.3 - 4.4 †
RACE-ETHNICITY*WHITE 2,578 17.2 13.8 - 20.7 175 76.7 67.3 - 86.2BLACK 290 22.7 15.3 - 30.1 †
HISPANIC 366 24.1 15.1 - 33.2 †
ASIAN 103 30.3 13.3 - 47.3 †
DISABILITY¶
DISABILITY 690 17.3 11.1 - 23.4 51 75.8 60.2 - 91.5NO DISABILITY 2,744 19.7 16.2 - 23.1 224 73.4 64.2 - 82.6
EDUCATION
< HIGH SCHOOL † †HIGH SCHOOL 620 16.6 10.4 - 22.8 †COLLEGE 1–3 YRS 905 28.2 22.0 - 34.4 102 74.0 61.9 - 86.2COLLEGE 4+ YRS 1,736 15.2 11.0 - 19.4 117 78.0 64.2 - 91.8
HOUSEHOLD INCOME
<$25,000 648 20.9 14.6 - 27.3 76 68.9 52.4 - 85.3$25,000–34,999 260 23.4 12.1 - 34.7 †
$35,000–49,999 339 20.8 11.0 - 30.6 †
$50,000–74,999 475 16.1 8.6 - 23.5 †
$75,000+ 1,363 10.6 6.4 - 14.7 57 80.3 63.6 - 97.0REGION
I–WESTERN 495 17.3 10.2 - 24.3 †
II–CENTRAL 448 17.1 9.8 - 24.3 †
III–NORTH EAST 815 21.3 14.0 - 28.6 70 72.4 53.4 - 91.3IV–METRO WEST 494 19.2 12.1 - 26.2 †V–SOUTH EAST 835 18.4 11.6 - 25.2 59 78.9 61.1 - 96.7VI–BOSTON 357 23.5 14.7 - 32.4 †
* White, Black, and Asian race categories refer to non-Hispanic§ Data presented for the landline sample only** Analysis conducted among those who reported ever having had vaccine† Insufficient data¶ Disability defined as having one or more of the following conditions: (1) physical, mental, or emotional problem that limited activities or caused cognitive difficulties; or (2) used special equipment or required help from others to get around. Please note that this differs from the definition used in previous years’ reports.
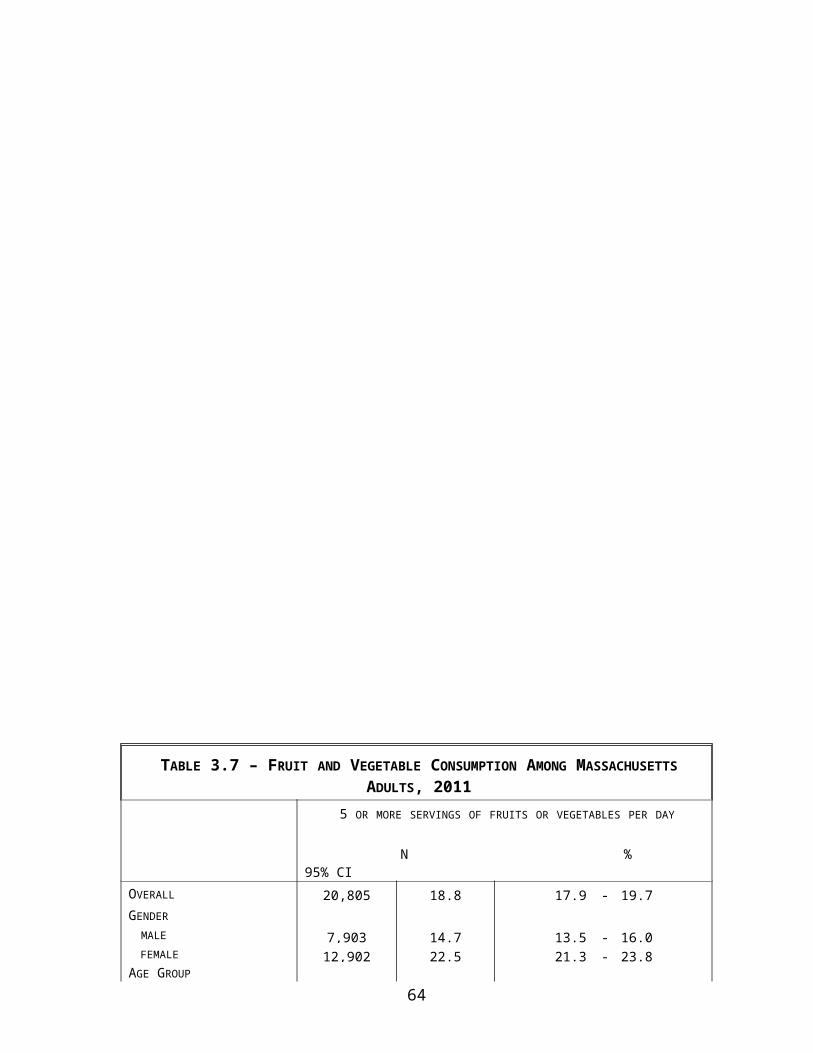
Section 4.3: Hepatitis B Virus (HBV) Vaccine
Hepatitis is the inflammation of the liver and also refers to viral infections that affect the liver. The most common types are Hepatitis A, Hepatitis B, and Hepatitis C.
Hepatitis is the leading cause of liver cancer and the most common reason for liver transplantation. Among persons with chronic Hepatitis B, the risk for premature death from cirrhosis or hepatocellular carcinoma is 15%–25%. HBV is transmitted by contact with infected blood or body fluids. Transmission can occur during birth from an infected mother, during unprotected sex with an infected partner, and using contaminated needles. An estimated 4.4 million Americans are living with chronic hepatitis; most do not know they are infected. An estimated 800,000–1.4 million of those have chronic HBV infection. About 80,000 new infections occur each year.29
The rate of new HBV infections has declined by approximately 82% since 1991, when a national strategy to eliminate HBV infection was implemented in the United States. The decline has been greatest among children born since 1991, when routine vaccination of children was first recommended.29 From 1999-2008 Massachusetts reported that rates of acute Hepatitis B decreased by 57%.30
All respondents were asked if they had ever received the Hepatitis B vaccine. They were told to respond yes only if they had received the entire series of 3 shots. Presented below is the percentage of adults who reported that they had ever received the Hepatitis B vaccine.
Questions about HBV vaccination were asked only on the MA BRFSS landline survey in 2011 and not the cell phone survey; therefore the results in Table 4.3 represent the landline sample only.
29 Centers for Disease Control and Prevention. (March 2011). Viral Hepatitis. Retrieved on March 8, 2011 from http://www.cdc.gov/hepatitis/30 National Center for HIV/AIDS, Viral Hepatitis, STD and TB Prevention. (2010) Massachusetts - 2010 Profile. Retrieved on March 8, 2011 from http://www.cdc.gov/nchhstp/stateprofiles/pdf/massachusetts_profile.pdf

TABLE 4.3 – HEPATITIS B VACCINE AMONG MASSACHUSETTS ADULTS, 2011§
RECEIVED 3 SHOTS HBV VACCINE
N % 95% CIOVERALL 15,180 36.5 34.9 - 38.0
GENDER
MALE 5,552 33.1 30.7 - 35.5FEMALE 9,628 39.7 37.7 - 41.6
AGE GROUP
18–24 335 59.2 52.2 - 66.125–34 1,093 58.4 53.6 - 63.135–44 2,015 41.7 38.3 - 45.245–54 3,128 31.4 29.0 - 33.955–64 3,656 25.2 23.1 - 27.365–74 2,641 17.5 15.5 - 19.675 AND OLDER 2,085 8.3 6.6 - 10.1
RACE-ETHNICITY*WHITE 12,586 33.5 31.8 - 35.1BLACK 892 45.1 39.1 - 51.1HISPANIC 954 47.7 41.6 - 53.8ASIAN 238 59.7 50.0 - 69.4
DISABILITY¶
DISABILITY 4,481 32.6 29.9 - 35.2NO DISABILITY 10,618 37.7 35.8 - 39.5
EDUCATION
< HIGH SCHOOL 1,133 22.4 17.9 - 26.9HIGH SCHOOL 3,834 27.4 24.4 - 30.4COLLEGE 1–3 YRS 3,684 41.1 37.9 - 44.3COLLEGE 4+ YRS 6,486 43.9 41.7 - 46.1
HOUSEHOLD INCOME
<$25,000 3,473 35.6 32.1 - 39.1$25,000–34,999 1,346 29.6 24.6 - 34.7$35,000–49,999 1,745 33.3 28.7 - 38.0$50,000–74,999 2,002 37.9 33.6 - 42.1$75,000+ 4,503 42.4 39.9 - 44.9
REGION
I–WESTERN 2,125 38.5 34.8 - 42.3II–CENTRAL 1,964 34.1 30.1 - 38.1III–NORTH EAST 3,571 37.5 33.9 - 41.1IV–METRO WEST 2,200 38.4 35.0 - 41.8V–SOUTH EAST 3,865 31.4 28.2 - 34.6VI–BOSTON 1,452 42.3 37.7 - 46.9
§ Data presented for the landline sample only* White, Black, and Asian race categories refer to non-Hispanic¶ Disability defined as having one or more of the following conditions: (1) physical, mental, or emotional problem that limited activities or caused cognitive difficulties; or (2) used special equipment or required help from others to get around. Please note that this differs from the definition used in previous years’ reports.
69

Section 4.4: Tetanus Vaccine
Tetanus (or lockjaw) is a serious disease that causes painful tightening of the muscles, usually all over the body. It can lead to "locking" of the jaw so the victim cannot open his mouth or swallow. Even with treatment, tetanus leads to death in about 1 in 10 cases.
Several vaccines are used to prevent tetanus among children, adolescents, and adults including DTaP and Tdap (Diphtheria, Tetanus and Pertussis); and DT, and Td (Diphtheria and Tetanus). Due to widespread immunization in childhood, tetanus is now extremely rare in developed countries. In the US, only 130 cases were reported in the period 1998-2000 most occurring among unvaccinated or inadequately vaccinated individuals following an acute injury.31 The last reported case of tetanus in Massachusetts was in 1996.32
Presented here is the percentage of adults who reported receiving the tetanus vaccine in the past 10 years.
Questions about tetanus vaccination were asked only on the MA BRFSS landline survey in 2011 and not the cell phone survey; therefore the results in Table 4.4 represent the landline sample only.
31 Dire, Daniel, (2010) Tetanus. MedScape, eMedicine Emergency. Retrieved on March 9, 2011 from http://emedicine.medscape.com/article/786414-overview32 MA Department of Public Health, Bureau of Communicable Disease Control. (2006) Tetanus. Retrieved on March 9, 2011 from http://www.mass.gov/Eeohhs2/docs/dph/disease_reporting/guide/tetanus.pdf20 Centers for Disease Control and Prevention. (updated May 29, 2009). Overweight and Obesity: Economic Consequences. Retrieved on June 2, 2009 from http://www.cdc.gov/nccdphp/dnpa/obesity/economic_consequences.htm21 Massachusetts Department of Public Health, ( 2011), About Mass in Motion, Retrieved on May 6, 2011 from http://www.mass.gov/?pageID=eohhs2terminal&L=4&L0=Home&L1=Consumer&L2=Prevention+and+Wellness&L3=Healthy+Living&sid=Eeohhs2&b=terminalcontent&f=dph_mass_in_motion_about&csid=Eeohhs222 U.S. Department of Health and Human Services, Centers for Disease Control and Prevention, National Center for Chronic Disease Prevention and Health Promotion. (1996). Physical Activity and Health: a Report of the Surgeon General. Retrieved on April 6, 2010 from http://www.cdc.gov/physicalactivity/everyone/health/23 Centers for Disease Control and Prevention. Fruit and vegetable consumption among adults -- United States, 2005. MMWR. [cited September 16, 2008]. Available at http://www.cdc.gov/mmwr/preview/mmwrhtml/mm5610a2.htm24 Schober SE et al (2007). High serum total cholesterol--an indicator for monitoring cholesterol lowering efforts: U.S. Adults, 2005-2006. Available from: www. cdc .gov/nchs/data/databriefs/db02.pdf 25 Centers for Disease Control and Prevention. Racial/ethnic disparities in prevalence, treatment, and control of hypertension, 1999-2002. January 14, 2005. Available from:http://www.cdc.gov/mmwr/preview/mmwrhtml/mm5401a3.htm
70
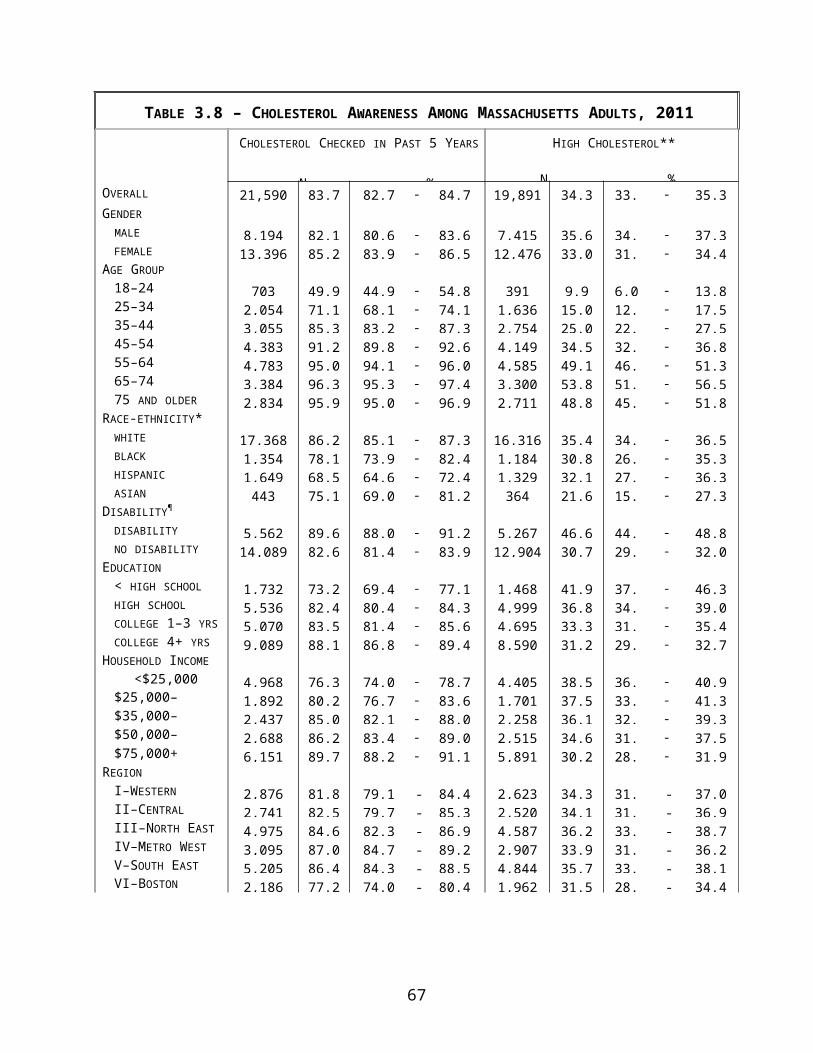
TABLE 4.4 – TETANUS VACCINE AMONG MASSACHUSETTS ADULTS, 2011§
RECEIVED TETANUS VACCINE IN PAST 10 YEARS
N % 95% CIOVERALL 15,972 76.8 75.7 - 78.0
GENDER
MALE 5,880 76.8 75.0 - 78.6FEMALE 10,092 76.8 75.4 - 78.2
AGE GROUP
18–24 381 87.5 83.4 - 91.625–34 1,234 82.8 79.4 - 86.235–44 2,215 80.6 78.0 - 83.245–54 3,342 75.8 73.6 - 78.055–64 3,760 73.0 70.8 - 75.365–74 2,694 68.2 65.5 - 70.875 AND OLDER 2,113 59.6 56.4 - 62.8
RACE-ETHNICITY*WHITE 13,210 77.8 76.6 - 79.0BLACK 930 73.5 68.9 - 78.1HISPANIC 1,044 69.4 63.9 - 74.9ASIAN 258 74.9 66.2 - 83.6
DISABILITY¶
DISABILITY 4,647 74.9 72.7 - 77.0NO DISABILITY 11,242 77.4 76.1 - 78.8
EDUCATION
< HIGH SCHOOL 1,172 69.2 64.7 - 73.6HIGH SCHOOL 4,036 73.9 71.5 - 76.3COLLEGE 1–3 YRS 3,864 78.5 76.2 - 80.8COLLEGE 4+ YRS 6,857 79.9 78.4 - 81.5
HOUSEHOLD INCOME
<$25,000 3,627 70.7 67.9 - 73.6$25,000–34,999 1,395 73.5 69.4 - 77.5$35,000–49,999 1,828 77.8 74.2 - 81.4$50,000–74,999 2,079 78.7 75.6 - 81.8$75,000+ 4,819 80.6 78.8 - 82.4
REGION
I–WESTERN 2,219 77.6 74.9 - 80.2II–CENTRAL 2,106 82.0 79.3 - 84.7III–NORTH EAST 3,800 73.5 70.7 - 76.3IV–METRO WEST 2,338 78.7 76.3 - 81.2V–SOUTH EAST 3,992 75.0 72.4 - 77.6VI–BOSTON 1,514 71.6 67.4 - 75.7
71
§ Data presented for the landline sample only* White, Black, and Asian race categories refer to non-Hispanic¶ Disability defined as having one or more of the following conditions: (1) physical, mental, or emotional problem that limited activities or caused cognitive difficulties; or (2) used special equipment or required help from others to get around. Please note that this differs from the definition used in previous years’ reports.
Section 4.5: Shingles
Almost 1 out of every 3 people in the United States will develop shingles during their lifetime. There are an estimated one million cases of shingles each year in the US. Approximately half of all cases occur in adults ages 60 and older. Shingles (or herpes zoster) is caused by the chickenpox virus and is characterized by a painful skin rash with blisters in a limited area on one side of the body, often in a stripe. The most common complication of shingles is a condition called postherpetic neuralgia (PHN). People with PHN have severe pain in the areas where they had the shingles rash, even after the rash clears up. Shingles may also lead to serious complications involving the eye. Very rarely, shingles can also lead to pneumonia, hearing problems, blindness, brain inflammation (encephalitis) or death.33 The shingles vaccine, Zostavax ® first became available in May 2006. A Healthy People 2020 objective is to increase the shingles vaccine rate to 30% of older adults.4
All respondents ages 50 and older were asked if they had ever received the shingles vaccine. Presented here is the percentage of adults ages 50 or older who had ever received the shingles vaccine.
Questions about shingles vaccine were asked only on the MA BRFSS landline survey in 2011 and not the cell phone survey; therefore the results in Table 4.5 represent the landline sample only.
33 Centers for Disease Control and Prevention. (2011) Shingles (Herpes Zoster).Retrieved on May 10, 2011 from http://www.cdc.gov/shingles/about/overview.html

TABLE 4.5 – SHINGLES VACCINE AMONG MASSACHUSETTS ADULTS, AGE 50+, 2011§
EVER HAD SHINGLES VACCINE
N % 95% CIOVERALL 11,122 10.6 9.8 - 11.4
GENDER
MALE 3,968 9.3 8.1 - 10.5FEMALE 7,154 11.7 10.7 - 12.7
AGE GROUP
50-59 3,964 2.1 1.4 - 2.760-69 3,599 16.0 14.4 - 17.770-75 2,219 20.5 18.0 - 23.075+ 1,340 13.6 11.2 - 16.0
RACE-ETHNICITY*WHITE 9,723 11.3 10.5 - 12.2BLACK †HISPANIC 497 5.8 2.7 - 8.8ASIAN †
DISABILITY¶
DISABILITY 3,793 9.6 8.4 - 10.9NO DISABILITY 7,263 11.1 10.1 - 12.0
EDUCATION
< HIGH SCHOOL 904 6.0 3.8 - 8.3HIGH SCHOOL 3,010 9.2 7.7 - 10.7COLLEGE 1–3 YRS 2,639 10.6 9.0 - 12.3COLLEGE 4+ YRS 4,538 13.3 12.0 - 14.5
HOUSEHOLD INCOME
<$25,000 2,743 9.0 7.4 - 10.6$25,000–34,999 1,104 12.2 9.3 - 15.0$35,000–49,999 1,336 13.3 10.7 - 16.0$50,000–74,999 1,424 11.0 8.9 - 13.1$75,000+ 2,742 9.5 8.2 - 10.9
REGION
I–WESTERN 1,577 9.9 8.1 - 11.7II–CENTRAL 1,382 8.4 6.6 - 10.1III–NORTH EAST 2,572 9.8 7.9 - 11.6IV–METRO WEST 1,662 15.0 13.0 - 17.0V–SOUTH EAST 2,941 9.7 8.1 - 11.4VI–BOSTON 988 8.2 6.3 - 10.1
§ Data presented for the landline sample only* White, Black, and Asian race categories refer to non-Hispanic† Insufficient data¶ Disability defined as having one or more of the following conditions: (1) physical, mental, or emotional problem that limited activities or caused cognitive difficulties; or (2) used special equipment or required help from others to get around. Please note that this differs from the definition used in previous years’ reports.

SECTION 5: CHRONIC HEALTH CONDITIONS

SECTION 5: CHRONIC HEALTH CONDITIONS
Section 5.1: Diabetes
Diabetes is a disease in which the body does not produce or properly use insulin. Insulin is a hormone which is used to convert sugar, starches, and other food into the energy needed for everyday life.34 There are two types of diabetes: type 1 and type 2. In type 1 diabetes, the body is unable to produce insulin. In type 2 diabetes, the body is able to produce insulin, but is unable to utilize it efficiently.
Obesity, poor diet, and physical inactivity are risk factors associated with the increase in the prevalence of type 2 diabetes. In 2008, diabetes was the ninth leading cause of death in Massachusetts.27 Overall, the risk for death among people with diabetes is about twice that of people without diabetes of a similar age.35 It is estimated that in 2007, in Massachusetts alone, the cost of diabetes is $4.3 billion; people with diagnosed diabetes, on average, have medical expenditures that are approximately 2.3 times higher than for people without the disease.36
All respondents were asked if a doctor had ever told them that they had diabetes or pre-diabetes (defined as a blood glucose level that is higher than normal but not yet diabetic). Women who reported that they had diabetes only during pregnancy (gestational diabetes) were categorized as not having diabetes. Presented here is the percentage of adults who reported that a doctor had ever told them that they had diabetes and the percentage of adults who reported that a doctor had ever told them that they had pre-diabetes.
Questions about pre-diabetes were asked only on the MA BRFSS landline survey in 2011 and not the cell phone survey; therefore the pre-diabetes results in Table 5.1 represent the landline sample only.
34 American Diabetes Association. (2011). Diabetes Basics. Retrieved on March 14, 2011 from:. http://www.diabetes.org/diabetes-basics/35 U.S. Department of Health and Human Services, Centers for Disease Control and Prevention. (2011). National diabetes fact sheet, 2011. Retrieved on March 14, 2011 from http://www.cdc.gov/diabetes/pubs/pdf/ndfs_2011.pdf36 Massachusetts Department of Public Health. (June 2009) Healthy Massachusetts Disease Management and Wellness: Focus on Diabetes. Retrieved on March 14, 2011 from http://www.mass.gov/Eeohhs2/docs/eohhs/healthymass/diabetes_recommendations.doc
75
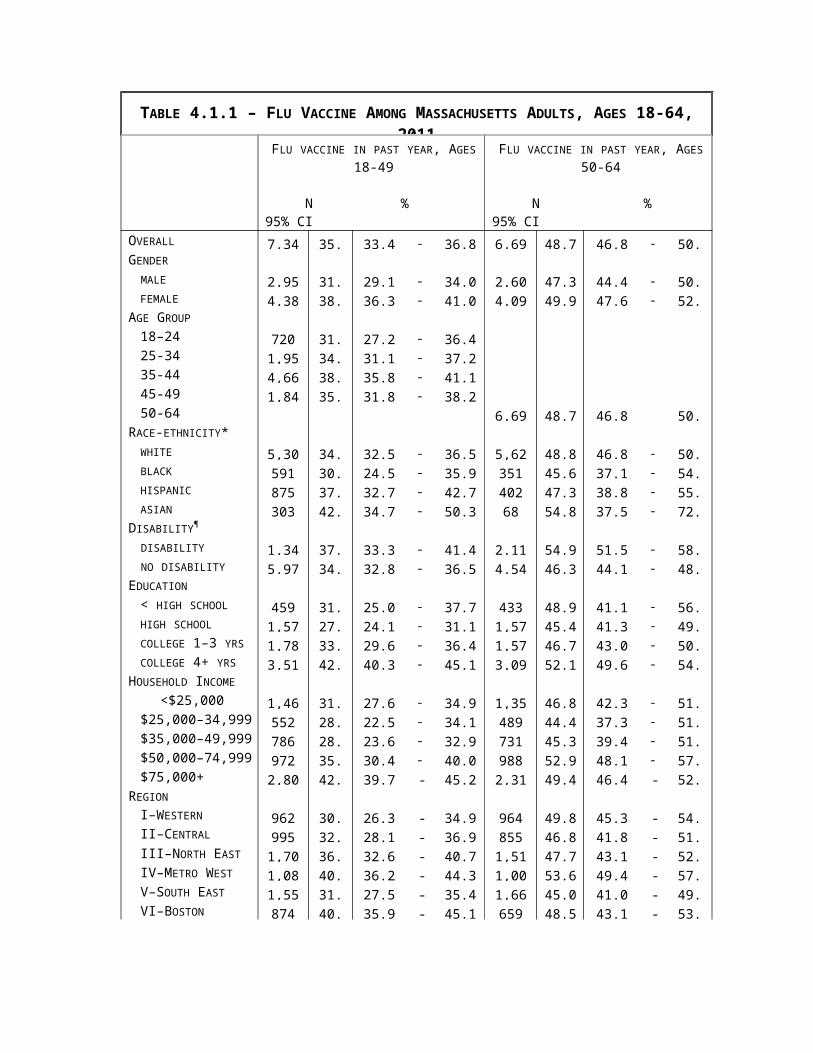
TABLE 5.1 – DIABETES AMONG MASSACHUSETTS ADULTS, 2011PRE-DIABETES§
N % 95% CI
DIABETES
N % 95% CIOVERALL 15,768 5.5 4.9 - 6.0 22,292 8.0 7.5 - 8.5GENDER
MALE 5,675 5.2 4.4 - 6.1 8,465 8.5 7.7 - 9.3FEMALE 10,093 5.7 5.0 - 6.4 13,827 7.6 6.9 - 8.2
AGE GROUP
18–24 † †25–34 1,340 2.6 1.5 - 3.8 2,188 2.0 1.2 - 2.735–44 2,361 3.3 2.2 - 4.5 3,145 4.2 2.9 - 5.445–54 3,387 5.3 4.1 - 6.4 4,472 6.6 5.5 - 7.755–64 3,560 8.9 7.4 - 10.4 4,851 14.1 12.6 - 15.665–74 2,464 11.1 9.1 - 13.1 3,461 18.2 16.2 - 20.275 AND OLDER 1,985 10.4 8.4 - 12.5 2,963 18.9 16.6 - 21.2
RACE-ETHNICITY*WHITE 13,158 5.6 5.0 - 6.3 17,905 7.6 7.1 - 8.2BLACK 861 6.0 4.1 - 7.9 1,407 11.6 9.0 - 14.2HISPANIC 955 4.1 2.5 - 5.8 1,719 10.5 8.3 - 12.8ASIAN † 461 4.1 2.1 - 6.2
DISABILITY¶
DISABILITY 4,146 8.6 7.2 - 10.0 5,768 16.1 14.6 - 17.5NO DISABILITY 11,523 4.5 3.9 - 5.1 14,498 5.7 5.2 - 6.3
EDUCATION
< HIGH SCHOOL 1,052 6.6 4.5 - 8.6 1,814 13.9 11.5 - 16.3HIGH SCHOOL 3,831 5.8 4.6 - 7.0 5,738 9.3 8.3 - 10.4COLLEGE 1–3 YRS 3,738 6.0 4.8 - 7.2 5,234 7.8 6.8 - 8.7COLLEGE 4+ YRS 7,101 4.6 3.9 - 5.3 9,331 5.3 4.7 - 5.9
HOUSEHOLD INCOME
<$25,000 3,239 6.2 5.0 - 7.4 5,159 12.1 10.7 - 13.5$25,000–34,999 1,308 7.5 5.1 - 9.9 1,965 10.5 8.5 - 12.5$35,000–49,999 1,799 4.9 3.6 - 6.2 2,500 8.2 6.6 - 9.9$50,000–74,999 2,103 6.0 4.4 - 7.6 2,743 6.9 5.7 - 8.2$75,000+ 5,039 4.4 3.6 - 5.3 6,256 4.8 4.0 - 5.5
REGION
I–WESTERN 2,147 6.3 4.9 - 7.7 2,979 8.9 7.5 - 10.2II–CENTRAL 2,063 5.3 3.8 - 6.7 2,819 7.6 6.3 - 8.9III–NORTH EAST 3,709 5.8 4.3 - 7.2 5,120 8.3 7.1 - 9.4IV–METRO WEST 2,405 4.7 3.7 - 5.8 3,202 6.6 5.5 - 7.7V–SOUTH EAST 3,937 5.9 4.6 - 7.2 5,353 9.5 8.1 - 10.8

VI–BOSTON 1,502 4.6 3.3 - 5.9 2,263 7.6 6.3 - 8.9§ Data presented for the landline sample only* White, Black, and Asian race categories refer to non-Hispanic† Insufficient data¶ Disability defined as having one or more of the following conditions: (1) physical, mental, or emotional problem that limited activities or caused cognitive difficulties; or (2) used special equipment or required help from others to get around. Please note that this differs from the definition used in previous years’ reports.
Section 5.2: Asthma
Asthma is a chronic inflammatory disorder that affects the lungs, causing repeated episodes of wheezing, breathlessness, coughing, and chest tightness.37 Asthma attacks can be triggered by a variety of causes, such as second hand smoke, outdoor air pollution, allergens, irritants, and respiratory viral infections. These environmental irritants are also potential risk factors associated with the development of asthma.38 The prevalence of asthma in the state of Massachusetts is one of the highest reported for a state across the nation, and the costs of treatment are increasing each year: the total charges for hospitalization due to asthma in Massachusetts increased 77.7% from $50 million in 2000 to $89 million in 2006.39
All respondents were asked if a doctor, nurse, or other health care professional had ever told them that they had asthma. Those who reported ever having asthma were then asked if they currently have asthma. Reported here are the percentages of adults who have ever had asthma and those who currently have asthma.
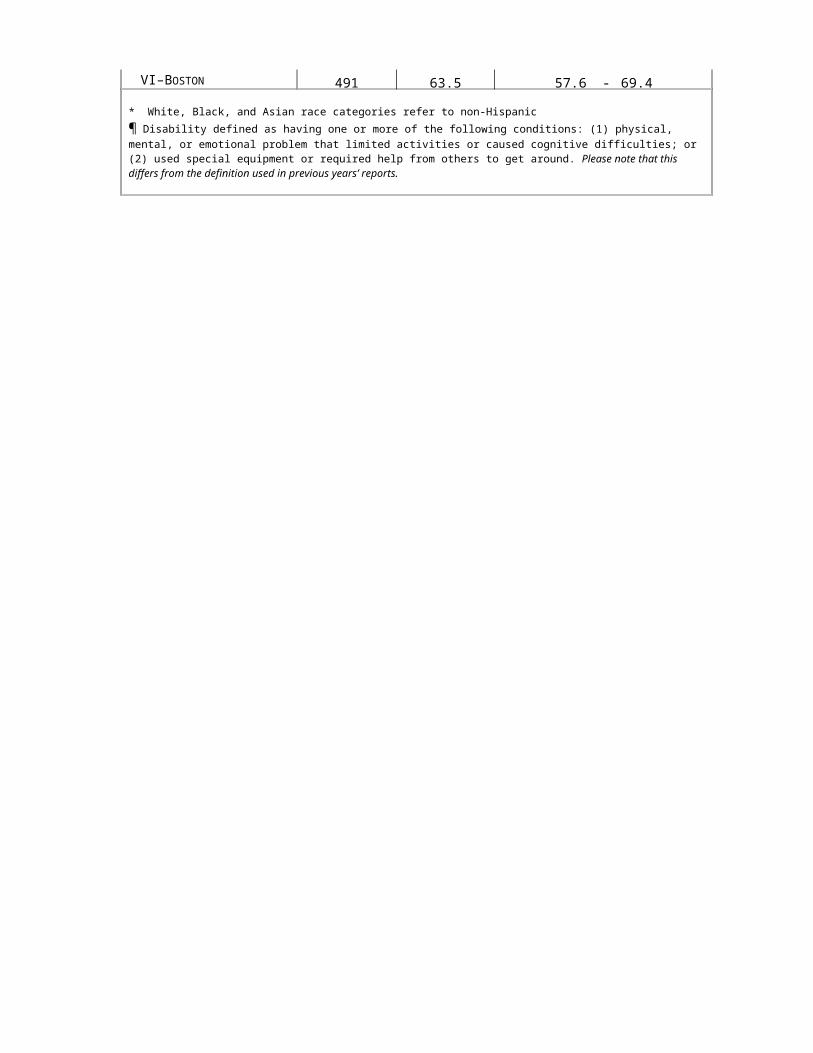
TABLE 5.2 – ASTHMA AMONG MASSACHUSETTS ADULTS, 2011
EVER HAD ASTHMA
N % 95% CI
CURRENTLY HAVE ASTHMA
N % 95% CI
OVERALL 22,262 15.3 14.5 - 16.2 22,192 10.7 10.0 - 11.4
GENDER
MALE 8,454 12.6 11.4 - 13.9 8,425 7.9 6.9 - 8.9FEMALE 13,808 17.8 16.6 - 19.0 13,767 13.3 12.3 - 14.3
AGE GROUP
18–24 805 21.2 17.4 - 25.1 799 13.8 10.5 - 17.125–34 2,187 18.5 15.9 - 21.1 2,178 11.1 9.0 - 13.335–44 3,143 15.0 13.2 - 16.8 3,135 11.7 10.1 - 13.445–54 4,472 14.2 12.6 - 15.8 4,462 10.5 9.1 - 11.955–64 4,837 13.4 12.0 - 14.8 4,817 9.8 8.6 - 11.065–74 3,457 14.8 13.0 - 16.7 3,450 11.0 9.3 - 12.775 AND OLDER 2,954 8.7 7.1 - 10.2 2,946 5.4 4.2 - 6.6
RACE-ETHNICITY*WHITE 17,876 15.0 14.0 - 15.9 17,820 10.6 9.8 - 11.4BLACK 1,402 15.5 12.3 - 18.6 1,398 9.7 7.2 - 12.3HISPANIC 1,721 21.2 17.7 - 24.7 1,715 15.1 12.0 - 18.3ASIAN 462 8.7 4.8 - 12.7 †
DISABILITY¶
DISABILITY 5,748 25.2 23.2 - 27.2 5,721 19.0 17.3 - 20.8NO DISABILITY 14,492 12.5 11.5 - 13.5 14,459 8.2 7.4 - 9.0
EDUCATION
< HIGH SCHOOL 1,815 21.4 18.2 - 24.7 1,808 15.0 12.3 - 17.6HIGH SCHOOL 5,723 14.6 12.9 - 16.3 5,706 11.0 9.5 - 12.5COLLEGE 1–3 YRS 5,231 16.1 14.3 - 17.9 5,216 10.5 9.0 - 11.9COLLEGE 4+ YRS 9,318 13.4 12.3 - 14.6 9,287 9.3 8.3 - 10.2
HOUSEHOLD INCOME
<$25,000 5,160 20.9 18.8 - 22.9 5,143 15.7 13.8 - 17.6$25,000–34,999 1,959 13.1 10.5 - 15.7 1,954 8.9 7.0 - 10.8$35,000–49,999 2,497 14.8 12.3 - 17.2 2,490 10.1 8.0 - 12.3$50,000–74,999 2,739 14.4 12.0 - 16.7 2,731 9.3 7.5 - 11.1$75,000+ 6,248 12.1 10.8 - 13.4 6,229 8.1 7.1 - 9.2
REGION
I–WESTERN 2,971 19.6 17.1 - 22.0 2,962 14.1 12.0 - 16.2II–CENTRAL 2,812 14.0 11.7 - 16.3 2,802 10.3 8.3 - 12.2III–NORTH EAST 5,115 14.6 12.7 - 16.5 5,106 10.6 9.0 - 12.2IV–METRO WEST 3,199 14.1 12.2 - 16.0 3,191 9.2 7.6 - 10.8V–SOUTH EAST 5,346 15.9 13.9 - 17.8 5,322 10.7 9.1 - 12.3VI–BOSTON 2,263 14.4 12.1 - 16.7 2,256 10.4 8.4 - 12.4
* White, Black, and Asian race categories refer to non-Hispanic† Insufficient data¶ Disability defined as having one or more of the following conditions: (1) physical, mental, or emotional problem that limited activities or caused cognitive difficulties; or (2) used special equipment or required help from others to get around. Please note that this differs from the definition used in previous years’ reports.
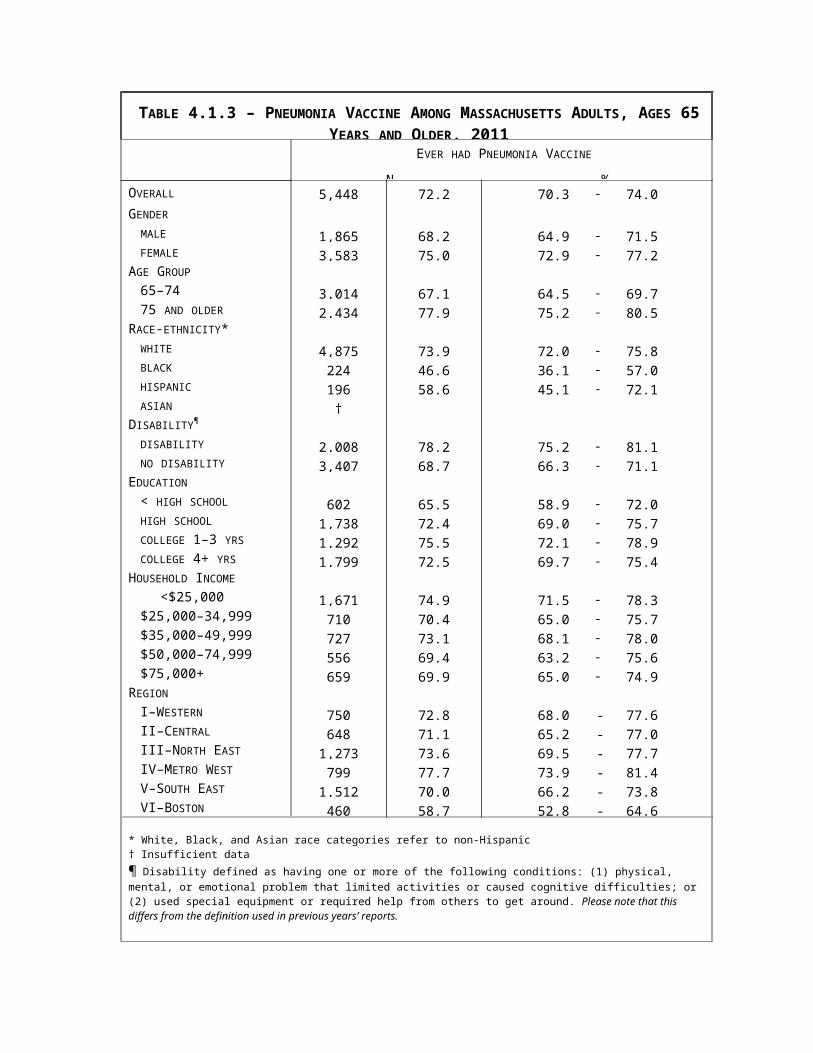
Section 5.3: Chronic Obstructive Pulmonary Disease (COPD)
Chronic Obstructive Pulmonary Disease, or COPD, refers to a group of diseases that cause airflow blockage and breathing-related problems. It includes emphysema, chronic bronchitis, and in some cases asthma. In the United States, tobacco use is a key factor in the development and progression of COPD, but asthma, exposure to air pollutants in the home and workplace, genetic factors, and respiratory infections also play a role.40 In 2011, approximately 34% of Massachusetts adults who reported a diagnosis of COPD also reported current smoking.
Presented here is the percentage of adults who reported that they had ever been diagnosed with COPD, emphysema or chronic bronchitis.
40 Centers for Disease Control and Prevention, Chronic Obstructive Pulmonary Disease. Retrieved on May 1, 2012 from http://www.cdc.gov/copd/
79

TABLE 5.3 – CHRONIC OBSTRUCTIVE PULMONARY DISEASE (COPD) AMONG MASSACHUSETTS ADULTS, 2011
EVER DIAGNOSED WITH COPD
N % 95% CIOVERALL 22,216 5.8 5.3 - 6.2
GENDER
MALE 8,433 4.8 4.1 - 5.4FEMALE 13,783 6.6 6.0 - 7.3
AGE GROUP
18–24 †25–34 2,182 2.9 1.7 - 4.135–44 3,135 3.5 2.5 - 4.545–54 4,463 4.5 3.6 - 5.455–64 4,833 9.0 7.7 - 10.265–74 3,445 12.6 10.9 - 14.375 AND OLDER 2,948 12.6 10.5 - 14.7
RACE-ETHNICITY*WHITE 17,852 6.2 5.6 - 6.7BLACK 1,400 5.0 2.5 - 7.4HISPANIC 1,712 3.2 2.0 - 4.3ASIAN †
DISABILITY¶
DISABILITY 5,726 15.0 13.5 - 16.5NO DISABILITY 14,478 2.9 2.5 - 3.3
EDUCATION
< HIGH SCHOOL 1,811 12.1 9.8 - 14.5HIGH SCHOOL 5,706 7.6 6.6 - 8.6COLLEGE 1–3 YRS 5,212 5.3 4.5 - 6.2COLLEGE 4+ YRS 9,314 2.7 2.2 - 3.1
HOUSEHOLD INCOME
<$25,000 5,145 11.3 9.9 - 12.8$25,000–34,999 1,958 6.8 5.1 - 8.6$35,000–49,999 2,492 5.4 4.2 - 6.6$50,000–74,999 2,734 5.3 4.1 - 6.6$75,000+ 6,251 2.2 1.7 - 2.7
REGION
I–WESTERN 2,957 6.6 5.3 - 7.9II–CENTRAL 2,814 5.7 4.6 - 6.9III–NORTH EAST 5,103 6.3 5.1 - 7.4IV–METRO WEST 3,194 4.3 3.4 - 5.2V–SOUTH EAST 5,334 7.0 5.9 - 8.2VI–BOSTON 2,262 5.0 3.7 - 6.4
* White, Black, and Asian race categories refer to non-Hispanic† Insufficient data¶ Disability defined as having one or more of the following conditions: (1) physical, mental, or emotional problem that limited activities or caused cognitive difficulties; or (2) used special equipment or required help from others to get around. Please note that this differs from the definition used in previous years’ reports.
80

Section 5.4: Heart Disease and Stroke
Heart disease includes a number of different heart conditions, the most common of which is coronary heart disease, a condition that can lead to a heart attack. A stroke occurs when blood to the brain is blocked or a blood vessel in the brain bursts, causing damage to the individual’s brain. Heart disease and stroke account for more than 1/3 of all U.S. deaths.41 They are also major causes of disability. In 2008, heart disease and stroke were the second (after cancer-related deaths) and third leading causes of death, respectively, in Massachusetts.Error: Reference source not found
All respondents were asked whether a doctor, nurse, or other health professional had ever told them that they had had a myocardial infarction (“MI,” also called a “heart attack”), angina or coronary heart disease, or a stroke. Presented here are the percentages of adults 35 and older who reported being told that they had experienced a heart attack, had angina or coronary heart disease, or had a stroke.
81

TABLE 5.4.1 – HEART DISEASE AMONG MASSACHUSETTS ADULTS,AGES 35 YEARS AND OLDER, 2011
EVER DIAGNOSED WITH MYOCARDIAL INFARCTION
N % 95% CI
EVER DIAGNOSED WITH ANGINA OR CORONARY HEART DISEASE
N % 95% CIOVERALL 18,826 5.1 4.7 - 5.6 18,763 5.2 4.7 - 5.7
GENDER
MALE 7,070 7.3 6.4 - 8.1 7,037 6.5 5.7 - 7.3FEMALE 11,756 3.2 2.8 - 3.7 11,726 4.0 3.5 - 4.6
AGE GROUP
35–44 3,137 1.0 0.5 - 1.5 †45–54 4,464 2.4 1.7 - 3.1 4,460 2.8 2.0 - 3.655–64 4,838 6.0 4.9 - 7.1 4,818 5.7 4.6 - 6.865–74 3,449 9.7 8.2 - 11.3 3,434 9.3 7.9 - 10.875 AND OLDER 2,938 13.4 11.5 - 15.3 2,916 14.5 12.4 - 16.5
RACE-ETHNICITY*WHITE 15,666 5.0 4.5 - 5.5 15,615 5.1 4.6 - 5.6BLACK 1,076 5.8 3.7 - 8.0 1,072 3.4 1.9 - 5.0HISPANIC 1,195 6.3 4.2 - 8.4 1,185 5.4 3.6 - 7.1ASIAN † †
DISABILITY¶
DISABILITY 5,253 11.0 9.7 - 12.3 5,221 11.1 9.8 - 12.5NO DISABILITY 11,941 3.0 2.5 - 3.5 11,912 3.0 2.6 - 3.5
EDUCATION
< HIGH SCHOOL 1,527 9.1 7.0 - 11.2 1,509 7.8 5.8 - 9.8HIGH SCHOOL 4,952 6.1 5.1 - 7.1 4,923 5.7 4.8 - 6.7COLLEGE 1–3 YRS 4,361 5.1 4.1 - 6.0 4,348 5.9 4.8 - 6.9COLLEGE 4+ YRS 7,847 3.2 2.7 - 3.7 7,841 3.5 3.0 - 4.1
HOUSEHOLD INCOME
<$25,000 4,327 9.4 8.0 - 10.8 4,304 8.6 7.3 - 10.0$25,000–34,999 1,637 6.6 4.9 - 8.3 1,635 6.9 5.0 - 8.8$35,000–49,999 2,105 6.9 5.1 - 8.7 2,096 7.0 5.2 - 8.8$50,000–74,999 2,335 3.3 2.3 - 4.3 2,336 3.8 2.6 - 5.0$75,000+ 5,408 2.1 1.6 - 2.7 5,404 2.9 2.2 - 3.6
REGION
I–WESTERN 2,536 6.4 5.0 - 7.8 2,533 6.1 4.8 - 7.5II–CENTRAL 2,387 5.1 3.8 - 6.5 2,383 6.0 4.4 - 7.5III–NORTH EAST 4,346 5.8 4.8 - 6.9 4,319 5.5 4.5 - 6.4IV–METRO WEST 2,744 3.7 2.8 - 4.6 2,737 3.6 2.7 - 4.5V–SOUTH EAST 4,652 5.0 4.0 - 6.0 4,635 5.9 4.8 - 7.0VI–BOSTON 1,807 5.2 3.7 - 6.7 1,803 3.3 2.3 - 4.3
* White, Black, and Asian race categories refer to non-Hispanic† Insufficient data¶ Disability defined as having one or more of the following conditions: (1) physical, mental, or emotional problem that limited activities or caused cognitive difficulties; or (2) used special equipment or required help from others to get around. Please note that this differs from the definition used in previous years’ reports.
82

TABLE 5.4.2 – STROKE AMONG MASSACHUSETTS ADULTS,AGES 35 YEARS AND OLDER, 2011
STROKE
N % 95% CIOVERALL 18,861 3.1 2.7 - 3.6GENDER
MALE 7,079 3.4 2.7 - 4.0FEMALE 11,782 2.9 2.5 - 3.4
AGE GROUP
35–44 †45–54 4,470 1.0 0.6 - 1.355–64 4,839 3.1 2.2 - 3.965–74 3,460 5.9 4.5 - 7.275 AND OLDER 2,951 9.3 7.5 - 11.1
RACE-ETHNICITY*WHITE 15,682 2.9 2.5 - 3.3BLACK 1,081 5.7 2.7 - 8.8HISPANIC † 3.3 1.5 5.0ASIAN †
DISABILITY¶
DISABILITY 5,276 7.1 6.0 - 8.2NO DISABILITY 11,944 1.6 1.2 - 2.0
EDUCATION
< HIGH SCHOOL 1,532 7.0 4.6 - 9.3HIGH SCHOOL 4,967 4.2 3.3 - 5.1COLLEGE 1–3 YRS 4,365 2.5 1.9 - 3.0COLLEGE 4+ YRS 7,854 1.6 1.3 - 2.0
HOUSEHOLD INCOME
<$25,000 4,346 6.6 5.2 - 8.1$25,000–34,999 1,644 4.4 2.8 - 6.1$35,000–49,999 2,105 3.7 2.4 - 5.1$50,000–74,999 2,337 1.6 0.9 - 2.2$75,000+ 5,411 1.0 0.7 - 1.4
REGION
I–WESTERN 2,547 3.6 2.5 - 4.7II–CENTRAL 2,392 3.0 1.9 - 4.1III–NORTH EAST 4,347 3.3 2.3 - 4.2IV–METRO WEST 2,750 2.5 1.6 - 3.4V–SOUTH EAST 4,661 3.7 2.7 - 4.6VI–BOSTON 1,808 2.5 1.6 - 3.3
* White, Black, and Asian race categories refer to non-Hispanic† Insufficient data¶ Disability defined as having one or more of the following conditions: (1) physical, mental, or emotional problem that limited activities or caused cognitive difficulties; or (2) used special equipment or required help from others to get around. Please note that this differs from the definition used in previous years’ reports.
83

Section 5.5: Arthritis
The term arthritis refers to many different conditions that affect the joints, and includes such conditions as rheumatoid arthritis, systematic lupus erythematosus (SLE), and gout.42 The pain experienced due to arthritis can be so severe that it disrupts daily activities or makes them difficult to perform. A goal of Healthy People 2020 is to reduce the percentage of those who have limitations on their activities due to their arthritis to 35.5% or less.4
All respondents were asked if a doctor or other health professional had ever told them they had arthritis. Respondents who indicated that they had been diagnosed with arthritis or who indicated that they had “symptoms of pain, aching, or stiffness in or around a joint” that had begun more than three months ago were then asked if they were limited in any way in any of their usual physical activities due to the arthritis or joint symptoms. Presented is the percentage of respondents who indicated that they had been diagnosed with arthritis and, if they had been or if they had the symptoms described above for more than three months, the percentage of respondents who experienced limitations in their usual daily activities due to the arthritis or symptoms.
42 Centers for Disease Control and Prevention, Arthritis Basics. (updated April 8, 2010), from http://www.cdc.gov/arthritis/basics.htm
84

TABLE 5.5 – ARTHRITIS AMONG MASSACHUSETTS ADULTS, 2011
DOCTOR DIAGNOSED ARTHRITIS
N % 95% CI
LIMITATIONS DUE TO ARTHRITIS N % 95% CI
OVERALL 22,193 23.6 22.7 - 24.4 21,546 10.3 9.7 - 10.9GENDER
MALE 8,425 20.0 18.8 - 21.3 8,260 8.4 7.5 - 9.3FEMALE 13,768 26.8 25.7 - 27.9 13,286 12.0 11.2 - 12.8
AGE GROUP
18–24 805 2.7 1.2 - 4.1 †25–34 2,185 5.9 4.4 - 7.4 2,173 2.5 1.5 - 3.535–44 3,137 13.4 11.4 - 15.3 3,106 6.6 5.1 - 8.145–54 4,447 25.2 23.2 - 27.2 4,355 11.0 9.7 - 12.455–64 4,830 38.6 36.5 - 40.8 4,663 18.1 16.4 - 19.865–74 3,447 48.4 45.8 - 51.0 3,315 19.1 17.1 - 21.275 AND OLDER 2,939 52.0 49.1 - 54.8 2,755 22.7 20.2 - 25.1
RACE-ETHNICITY*WHITE 17,835 25.1 24.1 - 26.0 17,328 10.4 9.8 - 11.1BLACK 1,399 19.3 16.1 - 22.6 1,356 9.7 7.4 - 11.9HISPANIC 1,708 18.1 15.2 - 21.0 1,652 10.8 8.6 - 13.1ASIAN 458 6.2 3.2 - 9.1 †
DISABILITY¶
DISABILITY 5,726 53.7 51.4 - 55.9 5,648 36.5 34.4 - 38.6NO DISABILITY 14,450 15.0 14.2 - 15.9 14,413 3.5 3.1 - 3.9
EDUCATION
< HIGH SCHOOL 1,800 32.2 28.7 - 35.7 1,698 17.6 14.9 - 20.4HIGH SCHOOL 5,710 27.9 26.1 - 29.8 5,473 11.6 10.3 - 12.8COLLEGE 1–3 YRS 5,209 24.1 22.4 - 25.8 5,079 10.5 9.3 - 11.6COLLEGE 4+ YRS 9,301 17.1 16.2 - 18.1 9,156 7.0 6.4 - 7.7
HOUSEHOLD INCOME
<$25,000 5,135 31.8 29.7 - 33.9 4,928 17.8 16.2 - 19.5$25,000–34,999 1,957 26.2 23.3 - 29.2 1,905 12.3 10.1 - 14.5$35,000–49,999 2,491 25.3 22.6 - 28.0 2,433 9.3 7.5 - 11.2$50,000–74,999 2,733 23.7 21.3 - 26.2 2,697 9.1 7.6 - 10.6$75,000+ 6,241 16.3 15.0 - 17.6 6,175 6.1 5.3 - 7.0
REGION
I–WESTERN 2,960 27.6 25.3 - 29.9 2,878 12.8 11.2 - 14.4II–CENTRAL 2,812 23.4 21.1 - 25.7 2,747 10.2 8.6 - 11.9III–NORTH EAST 5,094 23.5 21.5 - 25.5 4,945 9.8 8.4 - 11.2IV–METRO WEST 3,182 20.5 18.7 - 22.3 3,123 9.1 7.9 - 10.4V–SOUTH EAST 5,332 28.5 26.4 - 30.7 5,184 12.3 10.8 - 13.8VI–BOSTON 2,258 17.0 15.1 - 19.0 2,193 7.7 6.3 - 9.1
* White, Black, and Asian race categories refer to non-Hispanic† Insufficient data¶ Disability defined as having one or more of the following conditions: (1) physical, mental, or emotional problem that limited activities or caused cognitive difficulties; or (2) used special equipment or required help from others to get around. Please note that this differs from the definition used in previous years’ reports.

Section 5.6: Cancer Diagnosis
In this report, the term “cancer survivor” is used to describe a person from the time of cancer diagnosis through the remaining years of life.
The number of cancer survivors increased from approximately 3 million adults and children in 1971 to approximately 12 million in 2008.43 This increase in cancer survivors can be attributed to multiple factors including: earlier detection, improved diagnostic methods, more effective treatment, improved clinical follow up after treatment, and an aging US population. Breast, prostate and colorectal cancers are the most common types of cancer among survivors. 43
In Massachusetts, though cancer rates fluctuated by year, overall cancer incidence from 2003-2007 remained unchanged for both males and females. During the same time period, cancer mortality decreased by 1.3% per year for males and 2.1% per year for females. The most common cancer diagnoses for men during this time period were prostate, bronchus and lung, colon/rectum and urinary bladder. For women, the most commonly diagnosed cancers were breast, bronchus and lung, colon/rectum, and uterus.44
Presented is the percentage of adults who were ever told they had one or more types of cancer by a doctor, nurse, or other health professional.
43 National Cancer Institue, Estimated U.S. Cancer Prevalence. Retrieved on June 19, 2012 from http://dccps.nci.nih.gov/ocs/prevalence/prevalence.html#survivor
44 Massachusetts Department of Public Health. Cancer Incidence and Mortality in Massachusetts, 2003-2007, A Statewide Report. Retrieved on May 6, 2011, from http://www.mass.gov/Eeohhs2/docs/dph/cancer/registry_statewide_03_07_report.pdf
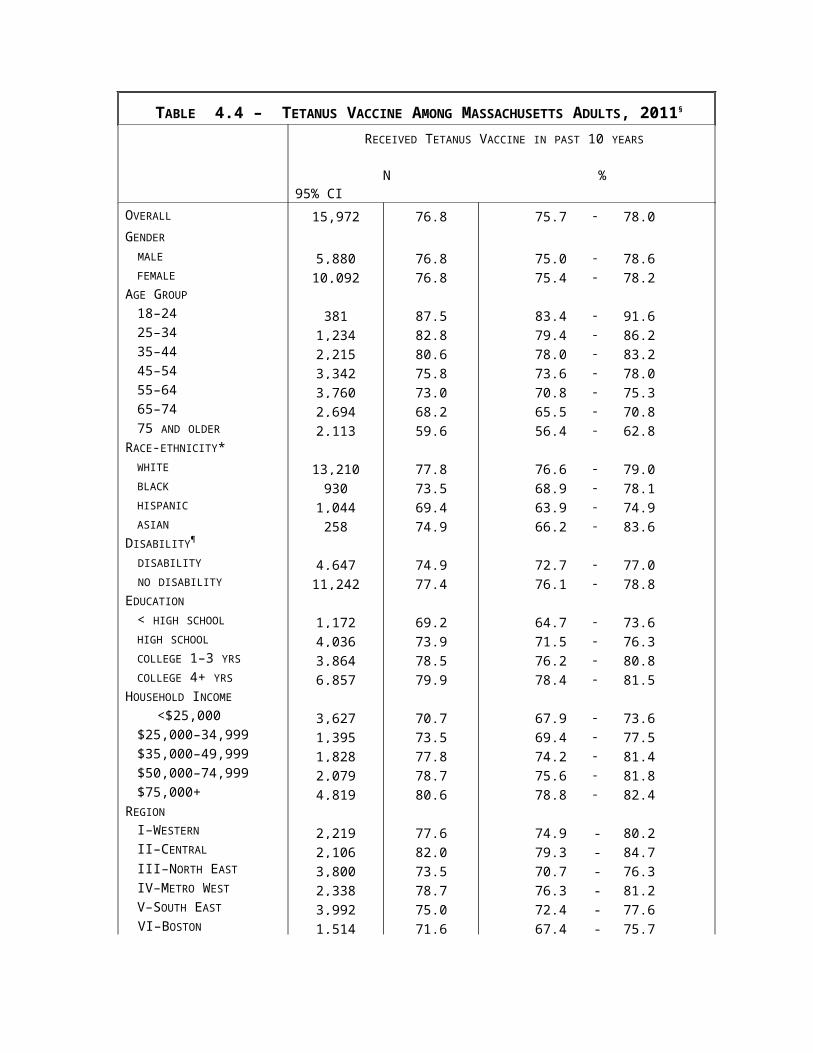
TABLE 5.6 – CANCER DIAGNOSIS AMONG MASSACHUSETTS ADULTS, 2011
EVER DIAGNOSED WITH CANCER
N % 95% CIOVERALL 22,237 10.9 10.4 - 11.5
GENDER
MALE 8,436 9.3 8.5 - 10.1FEMALE 13,801 12.4 11.6 - 13.3
AGE GROUP
18–24 †25–34 2,187 1.8 1.0 - 2.535–44 3,138 4.8 3.6 - 6.045–54 4,466 9.9 8.6 - 11.355–64 4,826 15.0 13.5 - 16.465–74 3,454 25.7 23.5 - 28.075 AND OLDER 2,956 33.5 30.7 - 36.2
RACE-ETHNICITY*WHITE 17,861 12.6 11.9 - 13.3BLACK 1,404 5.4 3.3 - 7.4HISPANIC 1,714 4.7 2.8 - 6.5ASIAN †
DISABILITY¶
DISABILITY 5,739 18.3 16.8 - 19.9NO DISABILITY 14,483 9.0 8.4 - 9.7
EDUCATION
< HIGH SCHOOL 1,809 11.3 8.8 - 13.7HIGH SCHOOL 5,722 10.6 9.4 - 11.8COLLEGE 1–3 YRS 5,225 11.2 10.1 - 12.3COLLEGE 4+ YRS 9,309 10.8 10.0 - 11.6
HOUSEHOLD INCOME
<$25,000 5,151 11.0 9.7 - 12.4$25,000–34,999 1,959 13.4 11.2 - 15.6$35,000–49,999 2,498 12.0 10.2 - 13.8$50,000–74,999 2,737 10.9 9.1 - 12.7$75,000+ 6,249 10.1 9.1 - 11.1
REGION
I–WESTERN 2,967 10.9 9.5 - 12.4II–CENTRAL 2,815 9.3 7.9 - 10.7III–NORTH EAST 5,117 11.3 9.9 - 12.7IV–METRO WEST 3,185 12.0 10.7 - 13.3V–SOUTH EAST 5,338 13.5 11.9 - 15.1VI–BOSTON 2,262 7.6 6.4 - 8.9
* White, Black, and Asian race categories refer to non-Hispanic† Insufficient data¶ Disability defined as having one or more of the following conditions: (1) physical, mental, or emotional problem that limited activities or caused cognitive difficulties; or (2) used special equipment or required help from others to get around. Please note that this differs from the definition used in previous years’ reports.
Section 5.7: Depression
Depression is characterized by depressed or sad mood, diminished interest in activities which used to be pleasurable, weight gain or loss, psychomotor agitation or retardation, fatigue, inappropriate guilt, difficulties concentrating, as well as recurrent thoughts of death. But depression is more than a “bad day”; diagnostic criteria established by the American Psychiatric Association dictate that five or more of the above symptoms must be present for a continuous period of at least two weeks. As an illness, depression falls within the spectrum of affective disorders.
The urgency of the rate of depression to public health is likely compounded by the recognition that – if not effectively treated – depression is likely to lapse into a chronic disease. Just experiencing one episode of depression places the individual at a 50% risk for experiencing another, with subsequent episodes raising the likelihood of experiencing more episodes in the future.45
In addition to being a chronic disease in its own right, the burden of depression is further increased as depression appears to be associated with behaviors linked to other chronic diseases. Depression has been shown to be positively associated with smoking, alcohol consumption, physical inactivity and sleep disturbances.46
Presented here is the percentage of adults who were ever told by a doctor, nurse or other health professional that they had a depressive disorder (including depression, major depression, dysthymia, or minor depression).
45 NIMH Consensus Development Conference Statement. Mood disorders: pharmacologic prevention of recurrences. Am J Psychiatry. 1985;142:469-476
46 Centers for Disease Control and Prevention. Depression as a Correlate of Adverse Health Behaviors. Retrieved on May 1, 2012 from http://www.cdc.gov/mentalhealth/basics/mental-illness/depression.htm
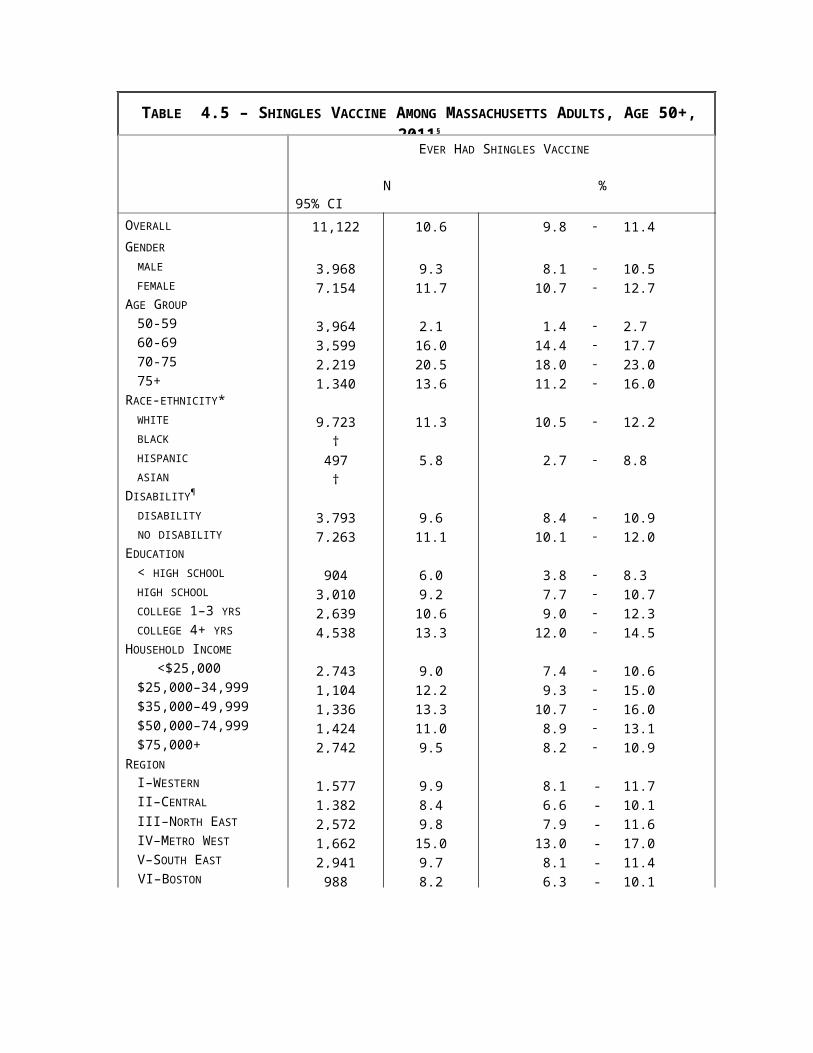
TABLE 5.7 – DEPRESSION AMONG MASSACHUSETTS ADULTS, 2011
EVER DIAGNOSED WITH DEPRESSION
N % 95% CIOVERALL 22,201 16.7 15.8 - 17.5
GENDER
MALE 8,428 13.5 12.2 - 14.7FEMALE 13,773 19.6 18.5 - 20.8
AGE GROUP
18–24 802 15.5 12.1 - 18.925–34 2,181 19.4 16.8 - 22.135–44 3,139 17.1 15.0 - 19.145–54 4,454 17.5 15.8 - 19.155–64 4,818 20.2 18.4 - 21.965–74 3,449 14.8 13.0 - 16.575 AND OLDER 2,956 7.9 6.3 - 9.5
RACE-ETHNICITY*WHITE 17,845 16.9 15.9 - 17.8BLACK 1,400 12.4 9.4 - 15.4HISPANIC 1,702 19.2 16.1 - 22.2ASIAN 458 8.8 4.3 - 13.3
DISABILITY¶
DISABILITY 5,724 32.9 30.8 - 35.0NO DISABILITY 14,471 11.8 10.9 - 12.8
EDUCATION
< HIGH SCHOOL 1,798 27.4 23.7 - 31.1HIGH SCHOOL 5,707 16.1 14.4 - 17.8COLLEGE 1–3 YRS 5,222 17.5 15.9 - 19.2COLLEGE 4+ YRS 9,301 13.2 12.1 - 14.3
HOUSEHOLD INCOME
<$25,000 5,141 26.9 24.7 - 29.1$25,000–34,999 1,958 18.4 15.3 - 21.6$35,000–49,999 2,496 15.4 12.9 - 17.8$50,000–74,999 2,734 17.2 14.7 - 19.7$75,000+ 6,244 10.7 9.5 - 11.8
REGION
I–WESTERN 2,966 18.3 16.1 - 20.5II–CENTRAL 2,809 18.4 15.8 - 20.9III–NORTH EAST 5,103 15.2 13.3 - 17.1IV–METRO WEST 3,186 15.3 13.5 - 17.2V–SOUTH EAST 5,327 18.4 16.3 - 20.4VI–BOSTON 2,260 13.9 11.8 - 15.9
* White, Black, and Asian race categories refer to non-Hispanic¶ Disability defined as having one or more of the following conditions: (1) physical, mental, or emotional problem that limited activities or caused cognitive difficulties; or (2) used special equipment or required help from others to get around. Please note that this differs from the definition used in previous years’ reports.

SECTION 6: OTHER TOPICS
SECTION 6: OTHER TOPICS
Section 6.1: Sexual Orientation
Health research indicates that health disparities exist between the homosexual (gay, lesbian)/bisexual population and the heterosexual population.47 Differences exist with respect to access to health care, overall health status, cancer screening, chronic health conditions, mental health, substance use including tobacco smoking, sexual health, and violence/victimization. Fear of discrimination and stigma keep many from seeking care or disclosing relevant information once in care.48
All respondents were asked if they considered themselves to be heterosexual or straight, homosexual (gay, lesbian), bisexual or other. The percentage of those who self-identified as homosexual, bisexual or other is presented.
Questions about sexual orientation were asked only on the MA BRFSS landline survey in 2011 and not the cell phone survey; therefore the results in Table 6.1 represent the landline sample only.
47 Massachusetts Department of Public Health. A Health Profile of Massachusetts Adults by Sexual Orientation Identity: Results from the 2001-2006 Behavioral Risk Factor Surveillance System Surveys. Retrieved April 8, 2010 from http://www.mass.gov/Eeohhs2/docs/dph/health_equity/sexual_orientation_disparities_report.pdf48 Massachusetts Department of Public Health. The Health of Lesbian, Gay, Bisexual and Transgender (LGBT) Persons in Massachusetts. Retrieved April 8, 2010 from http://www.mass.gov/Eeohhs2/docs/dph/commissioner/lgbt_health_report.pdf
91

TABLE 6.1 - SEXUAL ORIENTATION AMONG MASSACHUSETTS ADULTS, 2011§
SELF-IDENTIFIED AS HOMOSEXUAL, BISEXUAL OR OTHER
N % 95% CIOVERALL 17,373 3.9 3.3 - 4.4
GENDER
MALE 6,404 4.0 3.3 - 4.8FEMALE 10,969 3.7 3.0 - 4.5
AGE GROUP
18–24 422 4.6 2.2 - 7.025–34 1,364 5.3 3.4 - 7.135–44 2,414 3.3 2.2 - 4.345–54 3,631 4.8 3.9 - 5.855–64 4,053 3.3 2.6 - 4.065–74 2,938 2.4 1.6 - 3.275 AND OLDER 2,302 1.9 1.0 - 2.8
RACE-ETHNICITY*WHITE 14,425 3.9 3.3 - 4.5BLACK 1,009 4.0 1.9 - 6.0HISPANIC †ASIAN †
DISABILITY¶
DISABILITY 5,018 5.2 3.9 - 6.5NO DISABILITY 12,269 3.4 2.9 - 4.0
EDUCATION
< HIGH SCHOOL 1,280 1.8 1.0 - 2.7HIGH SCHOOL 4,318 2.9 1.9 - 3.9COLLEGE 1–3 YRS 4,191 4.2 3.0 - 5.3COLLEGE 4+ YRS 7,548 4.9 4.0 - 5.9
HOUSEHOLD INCOME
<$25,000 3,872 4.3 3.1 - 5.5$25,000–34,999 1,514 3.6 2.2 - 5.0$35,000–49,999 1,990 3.6 2.1 - 5.2$50,000–74,999 2,279 4.0 2.5 - 5.5$75,000+ 5,281 4.4 3.4 - 5.5
REGION
I–WESTERN 2,403 4.0 2.9 - 5.1II–CENTRAL 2,232 2.8 1.5 - 4.1III–NORTH EAST 4,109 3.2 2.0 - 4.4IV–METRO WEST 2,592 3.9 2.6 - 5.2V–SOUTH EAST 4,380 3.8 2.7 - 5.0VI–BOSTON 1,654 7.2 5.2 - 9.1
§ Data presented for the landline sample only* White, Black, and Asian race categories refer to non-Hispanic† Insufficient data¶ Disability defined as having one or more of the following conditions: (1) physical, mental, or emotional problem that limited activities or caused cognitive difficulties; or (2) used special equipment or required help from others to get around. Please note that this differs from the definition used in previous years’ reports.
92

Section 6.2: HIV Testing
In Massachusetts, the number of people living with HIV/AIDS increases each year due to the fact that 1) new HIV infection diagnoses exceed the number of deaths among people reported with HIV/AIDS and 2) there are more survivors due to improved treatment options over time. An estimated 21% of people infected with HIV do not know they have it. Early awareness of an HIV infection through HIV testing can prevent further spread of the disease.49
All respondents ages 18-64 were asked if they had ever been tested for HIV. Respondents were told not to include times that HIV testing had been done as part of a blood donation. Respondents who reported that they had ever been tested for HIV were asked the date of their most recent HIV test. Presented here is the percentage of adults ages 18-64 who report ever having been tested for HIV and the percentage who had been tested in the past year.
49 Massachusetts Department of Public Health, Office of HIV/AIDS. Massachusetts HIV/AIDS Data Fact Sheet: The Massachusetts HIV/AIDS Epidemic at a Glance. Retrieved June 19, 2012 from http://www.mass.gov/eohhs/docs/dph/aids/2012-profiles/epidemic-glance.pdf
93

TABLE 6.2 – HIV TESTING AMONG MASSACHUSETTS ADULTS, AGES 18-64, 2011
EVER TESTED FOR HIV
N % 95% CI
TESTED FOR HIV IN PAST YEAR
N % 95% CIOVERALL 13,502 45.5 44.2 - 46.9 11,758 11.2 10.2 - 12.2GENDER
MALE 5,315 42.7 40.6 - 44.7 4,633 11.0 9.5 - 12.5FEMALE 8,187 48.3 46.5 - 50.1 7,125 11.4 10.0 - 12.7
AGE GROUP
18–24 699 37.6 32.9 - 42.3 638 19.3 15.4 - 23.225–34 1,899 64.0 60.8 - 67.3 1,647 20.0 17.1 - 22.835–44 2,689 57.7 54.9 - 60.6 2,266 10.9 8.9 - 12.845–54 3,935 38.5 36.3 - 40.8 3,420 4.6 3.7 - 5.655–64 4,280 27.3 25.2 - 29.4 3,787 3.4 2.4 - 4.3
RACE-ETHNICITY*WHITE 10,503 42.3 40.8 - 43.9 9,293 9.3 8.2 - 10.4BLACK 907 69.5 64.4 - 74.5 748 27.4 21.9 - 32.8HISPANIC 1,242 64.5 60.0 - 69.0 980 21.4 17.2 - 25.6ASIAN 357 31.1 24.6 - 37.6 330 5.5 2.6 - 8.3
DISABILITY¶
DISABILITY 3,326 52.9 50.0 - 55.8 2,775 13.0 10.8 - 15.2NO DISABILITY 10,111 43.5 42.0 - 45.1 8,936 10.8 9.6 - 11.9
EDUCATION
< HIGH SCHOOL 861 52.6 47.1 - 58.1 675 11.9 8.2 - 15.5HIGH SCHOOL 3,009 43.3 40.3 - 46.3 2,604 12.8 10.4 - 15.2COLLEGE 1–3 YRS 3,241 45.6 42.8 - 48.4 2,799 12.5 10.4 - 14.5COLLEGE 4+ YRS 6,361 45.0 43.2 - 46.9 5,658 9.0 7.8 - 10.3
HOUSEHOLD INCOME
<$25,000 2,739 56.5 53.3 - 59.8 2,290 18.9 16.0 - 21.7$25,000–34,999 999 47.1 41.9 - 52.3 870 14.3 10.2 - 18.4$35,000–49,999 1,456 46.9 42.5 - 51.2 1,274 11.6 8.6 - 14.7$50,000–74,999 1,895 41.9 38.2 - 45.5 1,694 9.7 7.1 - 12.2$75,000+ 4,924 43.1 41.0 - 45.2 4,378 7.2 5.9 - 8.6
REGION
I–WESTERN 1,858 48.6 45.1 - 52.2 1,604 10.9 8.3 - 13.4II–CENTRAL 1,779 40.9 37.2 - 44.5 1,541 8.2 6.0 - 10.4III–NORTH EAST 3,103 46.9 43.6 - 50.2 2,688 12.0 9.6 - 14.4IV–METRO WEST 2,006 41.5 38.4 - 44.5 1,800 9.2 7.0 - 11.4V–SOUTH EAST 3,084 45.3 42.0 - 48.5 2,710 11.5 8.9 - 14.1VI–BOSTON 1,482 55.4 51.5 - 59.4 1,246 17.4 14.4 - 20.5
* White, Black, and Asian race categories refer to non-Hispanic¶ Disability defined as having one or more of the following conditions: (1) physical, mental, or emotional problem that limited activities or caused cognitive difficulties; or (2) used special equipment or required help from others to get around. Please note that this differs from the definition used in previous years’ reports.
94

Section 6.3: Sexual Violence
Sexual violence results in harmful and lasting consequences for victims, families, and communities. In addition to the potential for injury and the psychological consequences of being a victim of sexual violence, many victims experience physiological problems. Physiological problems include chronic headaches, back pain, fatigue, sleep disturbances, recurrent nausea, decreased appetite, menstrual pain, and sexual dysfunction.50 Psychological problems include post traumatic stress disorder, suicidal behavior, anxiety, eating disorders, and substance abuse.51 52
Respondents were asked if they had experienced sexual violence at any time in their lifetime. Sexual violence was defined as having the sexual parts of the body touched without consent or attempted or completed sex without consent. Presented here are the percentages of men and women who reported that they had experienced sexual violence at some time in their lifetime.
Questions about sexual violence were asked only on the MA BRFSS landline survey in 2011 and not the cell phone survey; therefore the results in Table 6.3 represent the landline sample only.
50 Centers for Disease Control and Prevention. Intimate Partner Violence: Prevention Strategies. Updated April 8, 2010, from http://www.cdc.gov/ViolencePrevention/intimatepartnerviolence/prevention.html51 Crime Victims Research and Treatment Center and National Victim Center. (1992). Rape in America, A Report to the Nation. Medical University of South Carolina: Charleston, SC. Retrieved on March 16, 2011 from http://www.ncvc.org/ncvc/main.aspx?dbName=DocumentViewer&DocumentID=3236652 The National Center for Victims of Crime. (1998) Sexual Assault. Retrieved on March 16, 2011 from http://www.ncvc.org/ncvc/main.aspx?dbName=DocumentViewer&DocumentID=32369
95

TABLE 6.3 – SEXUAL VIOLENCE AMONG MASSACHUSETTS ADULTS, 2011§
SEXUAL VIOLENCE,WOMEN
N % 95% CI
SEXUAL VIOLENCE, MEN
N % 95% CIOVERALL 2,162 20.1 16.5 - 23.7 1,371 4.6 2.9 - 6.2AGE GROUP
18–24 † †25–34 224 27.9 18.0 - 37.8 †35–44 339 21.2 15.1 - 27.2 †45–54 499 19.0 14.2 - 23.8 310 6.4 2.7 10.055–64 500 16.2 12.0 - 20.5 †65–74 323 11.3 6.8 - 15.9 †75 AND OLDER † †
RACE-ETHNICITY*WHITE 1,803 20.6 16.6 - 24.5 1,174 4.1 2.4 - 5.7BLACK † †HISPANIC † †ASIAN † † .
DISABILITY¶
DISABILITY 630 24.0 17.8 - 30.2 380 6.8 3.3 - 10.4NO DISABILITY 1,525 19.0 14.6 - 23.3 984 3.9 2.0 - 5.8
EDUCATION
< HIGH SCHOOL † †HIGH SCHOOL 456 21.2 11.0 - 31.4 †COLLEGE 1–3 YRS 582 20.3 14.3 - 26.4 †COLLEGE 4+ YRS 1,002 22.4 17.1 - 27.7 653 4.0 2.0 - 6.0
HOUSEHOLD INCOME
<$25,000 488 27.8 18.6 - 36.9 †$25,000–34,999 191 14.7 6.8 - 22.5 †$35,000–49,999 251 20.3 9.8 - 30.8 †$50,000–74,999 305 21.8 13.6 - 30.0 †$75,000+ 677 15.7 11.0 - 20.5 515 3.9 1.8 - 6.0
REGION
I–WESTERN 309 28.2 19.6 - 36.7 †II–CENTRAL 301 19.4 9.6 - 29.1 †III–NORTH EAST 462 17.4 9.2 - 25.7 †IV–METRO WEST 341 17.0 11.5 - 22.6 †V–SOUTH EAST 537 20.8 10.5 - 31.1 †VI–BOSTON 211 16.8 10.0 - 23.6 †
§ Data presented for the landline sample only* White, Black, and Asian race categories refer to non-Hispanic† Insufficient data¶ Disability defined as having one or more of the following conditions: (1) physical, mental, or emotional problem that limited activities or caused cognitive difficulties; or (2) used special equipment or required help from others to get around. Please note that this differs from the definition used in previous years’ reports.
96

Section 6.4: Seatbelt Use
Traffic crashes are the leading cause of unintentional death in the United States and the third leading cause of unintentional injury death in Massachusetts.Error: Reference source not found In 2009, there were an additional 3,598 hospital discharges and 67,472 emergency department visits, and 701 observation stays at MA acute care hospitals associated with unintentional nonfatal motor vehicle occupant injuries.53 54 55 Wearing a seatbelt is the simplest and least expensive way to reduce deaths and serious injuries. When crash victims are unbuckled, their medical treatment costs are 50 percent higher.56 Seat belt use is required by law in Massachusetts.
Respondents were asked how often they wear a seatbelt when riding or driving in a car. Presented here is the percentage of adults who reported that they always wear their seatbelts.
97

TABLE 6.4 – SEATBELT USE AMONG MASSACHUSETTS ADULTS, 2011
ALWAYS USE A SEATBELT
N % 95% CIOVERALL 20,061 79.7 78.7 - 80.8GENDER
MALE 7,622 74.2 72.5 - 75.8FEMALE 12,439 84.9 83.7 - 86.1
AGE GROUP
18–24 727 69.5 65.0 - 73.925–34 1,968 75.7 72.7 - 78.735–44 2,839 80.5 78.1 - 82.945–54 4,071 81.9 80.0 - 83.955–64 4,443 83.5 81.8 - 85.365–74 3,156 83.8 81.7 - 85.975 AND OLDER 2,544 84.4 82.1 - 86.8
RACE-ETHNICITY*WHITE 16,288 79.9 78.8 - 81.0BLACK 1,204 74.5 70.1 - 78.9HISPANIC 1,484 78.7 75.0 - 82.4ASIAN 401 89.6 85.1 - 94.1
DISABILITY¶
DISABILITY 5,598 79.0 77.0 - 81.0NO DISABILITY 14,358 80.1 78.9 - 81.2
EDUCATION
< HIGH SCHOOL 1,528 73.1 69.1 - 77.0HIGH SCHOOL 5,020 73.1 70.8 - 75.3COLLEGE 1–3 YRS 4,782 78.1 76.1 - 80.2COLLEGE 4+ YRS 8,669 87.7 86.5 - 88.9
HOUSEHOLD INCOME
<$25,000 4,600 74.2 71.8 - 76.6$25,000–34,999 1,797 77.4 73.9 - 80.9$35,000–49,999 2,313 75.9 72.8 - 79.0$50,000–74,999 2,564 79.3 76.1 - 82.4$75,000+ 5,891 84.8 83.2 - 86.4
REGION
I–WESTERN 2,733 78.9 76.4 - 81.5II–CENTRAL 2,591 79.6 76.8 - 82.4III–NORTH EAST 4,627 79.6 77.2 - 82.0IV–METRO WEST 2,974 82.3 79.9 - 84.6V–SOUTH EAST 4,893 76.9 74.6 - 79.3VI–BOSTON 2,036 81.6 78.9 - 84.3
* White, Black, and Asian race categories refer to non-Hispanic¶ Disability defined as having one or more of the following conditions: (1) physical, mental, or emotional problem that limited activities or caused cognitive difficulties; or (2) used special equipment or required help from others to get around. Please note that this differs from the definition used in previous years’ reports.
98

APPENDIX
99

AGE-ADJUSTED PERCENTAGES FOR SELECTED TOPICS
MASSACHUSETTS BEHAVIORAL RISK FACTOR SURVEILLANCE SYSTEM, 2011FAIR OR POOR HEALTH POOR MENTAL HEALTH POOR PHYSICAL HEALTH DISABILITY PERSONAL DOCTOR
% 95% CI % 95% CI % 95% CI % 95% CI % 95% CIOVERALL 13.4 12.7 - 14.2 10.4 9.6 - 11.1 9.2 8.6 - 9.9 22.2 21.3 - 23.2 87.9 87.0 - 88.8GENDER
MALE 13.9 12.7 - 15.0 9.0 7.9 - 10.0 8.4 7.4 - 9.3 20.9 19.5 - 22.3 83.5 82.1 - 84.9FEMALE 13.5 12.5 - 14.4 11.9 10.9 - 12.9 10.4 9.5 - 11.3 23.5 22.3 - 24.7 92.1 91.2 - 93.0
RACE-ETHNICITY*WHITE 11.6 10.8 - 12.4 10.7 9.8 - 11.5 9.0 8.3 - 9.8 22.2 21.2 - 23.3 89.5 88.6 - 90.5BLACK 19.6 15.9 - 23.2 10.4 7.9 - 12.9 10.1 7.2 - 13.0 22.1 18.5 - 25.6 82.3 78.8 - 85.8HISPANIC 32.7 28.9 - 36.4 13.6 10.9 - 16.2 15.1 12.4 - 17.8 23.3 20.0 - 26.7 78.9 75.9 - 82.0ASIAN 9.9 5.6 - 14.2 † 3.5 1.5 5.6 14.3 8.5 - 20.1 88.5 85.2 - 91.9
DISABILITY¶
DISABILITY 34.0 31.4 - 36.7 24.8 22.2 - 27.4 28.7 26.1 - 31.2 22.2 21.3 - 23.2 90.4 88.4 - 92.5NO DISABILITY 6.9 6.2 - 7.5 6.7 6.0 - 7.4 3.3 2.8 - 3.8 n/a 87.3 86.3 - 88.3
EDUCATION
< HIGH SCHOOL 34.7 30.9 - 38.5 19.4 15.9 - 22.9 21.6 18.2 - 25.0 34.1 30.1 - 38.0 78.5 74.9 - 82.1HIGH SCHOOL 16.8 15.1 - 18.4 12.4 10.9 - 14.0 10.6 9.2 - 12.1 23.8 21.8 - 25.8 86.8 85.0 - 88.6COLLEGE 1–3 YRS 11.9 10.7 - 13.2 11.9 10.4 - 13.4 9.7 8.5 - 10.8 23.0 21.2 - 24.9 89.3 87.7 - 90.9COLLEGE 4+ YRS 6.1 5.3 - 6.9 5.6 4.8 - 6.4 5.1 4.4 - 5.8 17.8 16.6 - 19.0 90.3 89.1 - 91.5
HOUSEHOLD INCOME
<$25,000 29.4 27.2 - 31.6 20.2 18.1 - 22.3 19.5 17.6 - 21.5 37.0 34.6 - 39.4 81.7 79.6 - 83.9$25,000–34,999 19.1 15.9 - 22.3 13.0 10.4 - 15.7 12.0 9.3 - 14.6 24.5 21.2 - 27.8 84.9 81.9 - 87.8$35,000–49,999 11.5 9.5 - 13.4 10.5 8.3 - 12.7 8.2 6.3 - 10.2 19.1 16.6 - 21.6 86.9 84.4 - 89.4$50,000–74,999 7.1 5.6 - 8.5 9.1 6.9 - 11.3 6.3 4.9 - 7.7 18.5 16.2 - 20.7 91.1 88.9 - 93.4$75,000+ 5.4 4.2 - 6.5 5.1 4.1 - 6.0 4.3 3.5 - 5.1 16.0 14.3 - 17.7 92.3 90.8 - 93.7
REGION
I–WESTERN 15.9 14.0 - 17.8 11.6 9.7 - 13.5 11.8 10.0 - 13.5 25.8 23.3 - 28.2 87.6 85.5 - 89.8II–CENTRAL 14.9 13.0 - 16.9 10.1 8.3 - 11.9 9.7 8.0 - 11.4 23.0 20.5 - 25.6 89.4 87.3 - 91.6III–NORTH EAST 12.5 10.8 - 14.2 10.2 8.4 - 12.0 7.6 6.4 - 8.7 20.3 18.3 - 22.3 89.4 87.4 - 91.4IV–METRO WEST 8.7 7.4 - 10.0 7.5 6.0 - 9.0 6.6 5.5 - 7.7 19.2 17.3 - 21.0 87.9 85.8 - 90.0V–SOUTH EAST 14.7 12.8 - 16.5 12.0 10.2 - 13.7 11.2 9.4 - 13.0 23.7 23.4 - 24.1 88.8 86.7 - 90.9VI–BOSTON 17.5 15.0 - 19.9 11.8 9.7 - 13.9 10.7 8.6 - 12.8 21.6 19.0 - 24.1 83.4 81.0 - 85.8
* White, Black, and Asian race categories refer to non-Hispanic† Insufficient data¶ Disability defined as having one or more of the following conditions: (1) physical, mental, or emotional problem that limited activities or caused cognitive difficulties; or (2) used special equipment or required help from others to get around. Please note that this differs from the definition used in previous years’ reports.
100

AGE-ADJUSTED PERCENTAGES FOR SELECTED TOPICS (CONTINUED)
MASSACHUSETTS BEHAVIORAL RISK FACTOR SURVEILLANCE SYSTEM, 2011NO DOCTOR DUE TO COST CHECKUP IN PAST YEAR CURRENT SMOKER FORMER SMOKER USE SMOKELESS TOBACCO
% 95% CI % 95% CI % 95% CI % 95% CI % 95% CIOVERALL 9.6 8.8 - 10.3 78.2 77.1 - 79.2 18.2 17.2 - 19.2 27.3 26.3 - 28.2 1.7 1.3 - 2.1GENDER
MALE 10.1 8.9 - 11.3 73.5 71.9 - 75.1 19.9 18.4 - 21.4 28.9 27.5 - 30.3 2.7 2.0 - 3.3FEMALE 9.4 8.5 - 10.3 82.5 81.3 - 83.7 17.5 16.2 - 18.7 26.1 24.9 - 27.2 0.8 0.6 - 1.1
RACE-ETHNICITY*WHITE 8.7 7.8 - 9.5 77.9 76.7 - 79.1 19.6 18.4 - 20.8 29.2 28.1 - 30.3 1.8 1.4 - 2.3BLACK 17.2 13.9 - 20.5 81.0 77.3 - 84.7 17.0 13.9 - 20.2 17.7 14.1 - 21.4 0.9 0.4 - 1.4HISPANIC 17.4 14.6 - 20.2 78.5 75.5 - 81.6 17.0 14.0 - 19.9 18.7 15.6 - 21.8 1.9 1.0 - 2.7ASIAN 5.2 2.4 - 8.1 75.3 69.3 - 81.3 7.5 3.9 - 11.1 11.7 6.6 - 16.8 †
DISABILITY¶
DISABILITY 16.4 14.1 - 18.8 80.0 77.4 - 82.5 29.4 26.5 - 32.3 30.1 27.7 - 32.6 3.1 1.7 - 4.5NO DISABILITY 8.0 7.2 - 8.8 77.6 76.5 - 78.8 15.8 14.7 - 16.8 26.5 25.4 - 27.5 1.5 1.1 - 1.9
EDUCATION
< HIGH SCHOOL 18.2 14.9 - 21.4 77.4 73.7 - 81.0 32.6 28.6 - 36.7 20.9 18.0 - 23.7 2.7 1.1 - 4.2HIGH SCHOOL 11.5 9.9 - 13.1 76.8 74.6 - 79.0 27.0 24.7 - 29.2 30.5 28.4 - 32.6 2.0 1.2 - 2.7COLLEGE 1–3 YRS 11.4 9.8 - 13.0 78.0 76.0 - 80.0 21.4 19.4 - 23.3 29.4 27.5 - 31.3 1.2 0.7 - 1.7COLLEGE 4+ YRS 5.3 4.4 - 6.2 78.5 77.0 - 80.1 7.0 6.1 - 7.9 25.9 24.6 - 27.2 1.8 1.1 - 2.4
HOUSEHOLD INCOME
<$25,000 17.9 15.8 - 19.9 77.9 75.6 - 80.1 31.1 28.6 - 33.6 23.6 21.6 - 25.6 2.6 1.7 - 3.5$25,000–34,999 14.9 11.8 - 18.0 76.1 72.4 - 79.8 21.0 17.7 - 24.3 27.7 24.4 - 31.0 †
$35,000–49,999 12.9 10.4 - 15.4 76.0 72.8 - 79.3 20.2 17.2 - 23.2 28.4 25.7 - 31.2 †
$50,000–74,999 8.4 6.2 - 10.6 78.6 75.7 - 81.6 20.7 17.5 - 23.9 30.5 27.9 - 33.0 2.3 1.0 3.7$75,000+ 4.6 3.4 - 5.7 79.4 77.6 - 81.3 9.6 8.1 - 11.1 28.9 27.1 - 30.7 1.6 0.8 - 2.4
REGION
I–WESTERN 10.7 8.8 - 12.5 78.5 75.9 - 81.2 21.7 19.0 - 24.4 27.4 25.2 - 29.7 2.5 1.4 - 3.6II–CENTRAL 9.1 7.3 - 10.8 76.5 73.8 - 79.1 20.6 18.0 - 23.3 27.0 24.5 - 29.4 †III–NORTH EAST 10.5 8.6 - 12.5 77.8 75.3 - 80.3 19.3 16.9 - 21.8 25.1 23.2 - 27.1 1.7 0.9 - 2.4IV–METRO WEST 6.9 5.5 - 8.4 76.2 73.7 - 78.6 12.8 10.7 - 14.9 26.5 24.5 - 28.5 1.8 0.9 - 2.7V–SOUTH EAST 11.0 9.1 - 12.9 80.3 78.0 - 82.7 23.0 22.6 - 23.4 30.5 30.2 - 30.8 1.5 0.9 - 2.1VI–BOSTON 10.2 8.3 - 12.2 79.4 76.9 - 81.9 16.9 14.6 - 19.3 24.1 21.6 - 26.5 1.1 0.5 - 1.6
* White, Black, and Asian race categories refer to non-Hispanic† Insufficient data
¶ Disability defined as having one or more of the following conditions: (1) physical, mental, or emotional problem that limited activities or caused cognitive difficulties; or (2) used special equipment or required help from others to get around. Please note that this differs from the definition used in previous years’ reports.
101

AGE-ADJUSTED PERCENTAGES FOR SELECTED TOPICS (CONTINUED)
MASSACHUSETTS BEHAVIORAL RISK FACTOR SURVEILLANCE SYSTEM, 2011QUIT ATTEMPT PLANNING TO QUIT NO SMOKING IN HOUSE ENVIRONMENTAL SMOKE BINGE DRINKING
% 95% CI % 95% CI % 95% CI % 95% CI % 95% CIOVERALL 59.7 56.8 - 62.6 38.0 35.0 - 41.1 80.4 79.3 - 81.5 38.8 37.3 - 40.3 21.5 20.4 - 22.6GENDER
MALE 61.4 57.4 - 65.3 38.2 33.7 - 42.6 78.5 76.9 - 80.2 43.1 40.8 - 45.4 25.9 24.2 - 27.5FEMALE 56.9 53.1 - 60.7 37.3 33.1 - 41.4 82.2 80.8 - 83.5 34.9 33.1 - 36.8 17.3 15.9 - 18.6
RACE-ETHNICITY*WHITE 58.0 54.8 - 61.1 34.8 31.4 - 38.1 79.9 78.6 - 81.2 38.8 37.1 - 40.6 24.2 22.9 - 25.4BLACK 67.7 57.7 - 77.8 54.7 43.6 - 65.9 78.2 73.8 - 82.5 44.2 39.1 - 49.3 14.6 11.0 - 18.2HISPANIC 67.8 59.4 - 76.2 57.1 47.0 - 67.1 82.5 78.5 - 86.5 37.7 32.5 - 42.9 14.5 11.7 - 17.3ASIAN 65.0 65.0 - 65.0 29.0 29.0 - 29.0 90.0 85.4 - 94.6 36.9 28.5 - 45.3 6.6 4.1 - 9.1
DISABILITY¶
DISABILITY 62.5 57.5 - 67.6 41.0 35.6 - 46.5 71.5 68.5 - 74.5 46.6 43.1 - 50.1 18.6 16.0 - 21.2NO DISABILITY 57.9 54.4 - 61.5 36.2 32.4 - 39.9 82.7 81.5 - 83.8 36.9 35.3 - 38.6 22.2 21.0 - 23.4
EDUCATION
< HIGH SCHOOL 58.9 51.9 - 66.0 40.8 32.6 - 48.9 71.1 66.7 - 75.6 45.4 39.8 - 51.1 15.6 12.2 - 18.9HIGH SCHOOL 56.9 52.3 - 61.4 35.4 30.6 - 40.3 72.2 69.6 - 74.7 44.2 41.0 - 47.3 21.3 19.0 - 23.6COLLEGE 1–3 YRS 62.9 58.3 - 67.5 41.0 35.6 - 46.5 79.7 77.7 - 81.6 42.2 39.4 - 45.0 22.2 20.1 - 24.3COLLEGE 4+ YRS 59.8 53.0 - 66.5 31.9 26.0 - 37.8 88.8 87.5 - 90.1 31.9 29.6 - 34.2 23.4 21.7 - 25.0
HOUSEHOLD INCOME
<$25,000 59.7 55.2 - 64.2 42.6 37.5 - 47.7 70.6 67.9 - 73.2 45.1 41.7 - 48.6 17.9 15.7 - 20.1$25,000–34,999 65.5 57.9 - 73.0 34.3 26.2 - 42.5 75.0 71.0 - 78.9 47.1 41.6 - 52.7 21.7 18.2 - 25.3$35,000–49,999 52.5 44.7 - 60.3 35.6 26.8 - 44.3 78.1 74.8 - 81.4 45.6 41.0 - 50.2 23.1 19.8 - 26.4$50,000–74,999 57.1 49.0 - 65.2 31.8 24.0 - 39.5 79.7 76.3 - 83.0 38.8 34.5 - 43.1 21.5 18.3 - 24.6$75,000+ 62.2 55.1 - 69.3 36.7 28.2 - 45.3 88.3 86.5 - 90.1 34.4 31.8 - 37.1 25.7 23.5 - 28.0
REGION
I–WESTERN 62.3 56.0 - 68.6 36.8 29.8 - 43.8 79.2 76.4 - 82.0 39.6 36.0 - 43.2 20.5 17.8 - 23.2II–CENTRAL 56.5 49.6 - 63.3 † 78.6 75.8 - 81.5 37.5 34.0 - 41.1 20.5 17.8 - 23.2III–NORTH EAST 64.8 58.6 - 70.9 41.4 34.1 - 48.8 81.4 78.8 - 83.9 41.9 38.5 - 45.3 21.3 18.7 - 23.9IV–METRO WEST 54.9 47.3 - 62.6 38.9 30.1 - 47.7 83.9 81.6 - 86.1 33.8 30.3 - 37.2 21.4 18.9 - 24.0V–SOUTH EAST 58.6 52.7 - 64.6 36.4 29.8 - 43.0 77.5 77.1 - 77.9 40.8 40.1 - 41.5 23.8 23.5 - 24.2VI–BOSTON 59.8 52.0 - 67.6 44.0 35.8 - 52.2 81.3 78.8 - 83.8 41.7 37.6 - 45.8 19.6 17.2 - 22.1
* White, Black, and Asian race categories refer to non-Hispanic† Insufficient data
¶ Disability defined as having one or more of the following conditions: (1) physical, mental, or emotional problem that limited activities or caused cognitive difficulties; or (2) used special equipment or required help from others to get around. Please note that this differs from the definition used in previous years’ reports.
102

AGE-ADJUSTED PERCENTAGES FOR SELECTED TOPICS (CONTINUED)
MASSACHUSETTS BEHAVIORAL RISK FACTOR SURVEILLANCE SYSTEM, 2011HEAVY DRINKING OVERWEIGHT (BMI≥25.0) OBESE (BMI≥30.0)
MET GUIDELINES FOR AEROBIC ACTIVITY
MET GUIDELINES FOR MUSCLE STRENGTHENING
% 95% CI % 95% CI % 95% CI % 95% CI % 95% CIOVERALL 8.1 7.4 - 8.8 59.0 57.7 - 60.2 22.8 21.8 - 23.8 56.3 55.0 - 57.5 32.4 31.2 - 33.5GENDER
MALE 8.0 6.9 - 9.1 68.1 66.4 - 69.7 24.0 22.5 - 25.5 58.3 56.5 - 60.1 36.0 34.3 - 37.8FEMALE 8.1 7.2 - 9.0 49.6 48.1 - 51.2 21.3 20.0 - 22.6 54.6 53.0 - 56.2 28.7 27.2 - 30.1
RACE-ETHNICITY*WHITE 9.1 8.2 - 9.9 58.1 56.7 - 59.5 21.7 20.6 - 22.8 58.4 57.0 - 59.8 33.1 31.7 - 34.4BLACK 4.4 2.4 - 6.4 69.4 65.3 - 73.6 32.5 28.2 - 36.7 54.0 49.4 - 58.6 30.9 26.4 - 35.3HISPANIC 5.6 2.6 - 8.7 68.9 65.2 - 72.7 32.6 28.3 - 36.9 44.4 40.2 - 48.6 27.3 23.5 - 31.1ASIAN † 36.2 29.8 - 42.5 5.5 2.4 - 8.5 56.1 49.1 - 63.1 33.9 26.8 - 41.1
DISABILITY¶
DISABILITY 6.9 5.3 - 8.4 63.7 60.7 - 66.6 31.8 29.1 - 34.5 45.9 42.9 - 48.9 27.9 25.1 - 30.7NO DISABILITY 8.4 7.6 - 9.2 57.4 56.0 - 58.7 19.9 18.8 - 21.0 59.5 58.2 - 60.9 33.4 32.2 - 34.7
EDUCATION
< HIGH SCHOOL 7.1 4.4 - 9.8 62.5 58.1 - 66.8 31.5 27.5 - 35.5 41.9 37.4 - 46.4 22.1 18.2 - 25.9HIGH SCHOOL 7.5 6.1 - 9.0 63.0 60.6 - 65.3 25.5 23.4 - 27.6 50.7 48.2 - 53.3 26.4 24.0 - 28.7COLLEGE 1–3 YRS 8.8 7.4 - 10.2 62.0 59.7 - 64.3 24.8 22.8 - 26.7 57.5 55.1 - 59.9 32.5 30.2 - 34.7COLLEGE 4+ YRS 8.5 7.4 - 9.7 53.0 51.2 - 54.8 17.0 15.7 - 18.3 63.1 61.4 - 64.9 39.3 37.5 - 41.1
HOUSEHOLD INCOME
<$25,000 7.2 5.8 - 8.6 61.1 58.6 - 63.6 29.3 26.9 - 31.7 46.9 44.2 - 49.6 26.0 23.6 - 28.5$25,000–34,999 7.9 5.8 - 10.0 59.6 55.7 - 63.6 23.2 20.1 - 26.4 52.2 48.0 - 56.4 28.9 25.2 - 32.7$35,000–49,999 7.6 5.7 - 9.5 62.2 58.7 - 65.6 25.9 22.8 - 29.0 55.3 51.5 - 59.0 31.0 27.6 - 34.4$50,000–74,999 10.3 7.9 - 12.7 63.0 59.6 - 66.4 23.7 20.7 - 26.6 57.4 53.8 - 60.9 31.2 27.9 - 34.5$75,000+ 9.3 7.7 - 10.9 56.5 54.2 - 58.8 18.5 16.9 - 20.0 63.4 61.0 - 65.8 38.9 36.5 - 41.3
REGION
I–WESTERN 7.3 5.5 - 9.1 60.7 57.6 - 63.8 25.9 23.4 - 28.4 57.8 54.8 - 60.8 29.2 26.3 - 32.1II–CENTRAL 8.6 6.6 - 10.6 62.4 59.5 - 65.2 23.2 20.6 - 25.8 55.8 52.7 - 59.0 30.6 27.6 - 33.5III–NORTH EAST 8.1 6.4 - 9.7 59.3 56.4 - 62.1 22.3 19.9 - 24.8 52.5 49.6 - 55.5 32.4 29.6 - 35.3IV–METRO WEST 7.0 5.5 - 8.6 53.1 50.3 - 55.8 17.4 15.4 - 19.4 60.4 57.6 - 63.2 35.4 32.7 - 38.2V–SOUTH EAST 8.0 7.8 - 8.2 61.3 58.5 - 64.0 25.3 22.9 - 27.8 55.8 55.4 - 56.2 33.3 32.9 - 33.7VI–BOSTON 9.6 7.7 - 11.4 58.8 55.9 - 61.6 23.4 20.8 - 26.0 55.5 52.4 - 58.6 32.9 29.9 - 35.8
* White, Black, and Asian race categories refer to non-Hispanic† Insufficient data
¶ Disability defined as having one or more of the following conditions: (1) physical, mental, or emotional problem that limited activities or caused cognitive difficulties; or (2) used special equipment or required help from others to get around. Please note that this differs from the definition used in previous years’ reports.
103

AGE-ADJUSTED PERCENTAGES FOR SELECTED TOPICS (CONTINUED)
MASSACHUSETTS BEHAVIORAL RISK FACTOR SURVEILLANCE SYSTEM, 20115+ SERVINGS OF
FRUIT/VEGETABLES DAILYCHOLESTEROL CHECKED IN
PAST 5 YEARSHIGH CHOLESTEROL HIGH BLOOD PRESSURE
TAKE MEDICINE FOR HIGH BLOOD PRESSURE
% 95% CI % 95% CI % 95% CI % 95% CI % 95% CIOVERALL 18.9 18.0 - 19.9 82.7 81.6 - 83.7 30.8 29.7 - 31.9 27.6 26.7 - 28.6 59.2 56.4 - 61.9GENDER
MALE 14.8 13.5 - 16.1 81.0 79.4 - 82.5 31.9 30.3 - 33.5 30.6 29.1 - 32.0 54.6 51.5 - 57.6FEMALE 22.5 21.2 - 23.8 83.5 82.2 - 84.8 29.1 27.7 - 30.5 25.1 24.0 - 26.1 66.8 62.0 - 71.5
RACE-ETHNICITY*WHITE 18.6 17.5 - 19.6 83.6 82.4 - 84.8 30.4 29.2 - 31.6 27.2 26.2 - 28.3 58.0 54.8 - 61.1BLACK 18.4 14.7 - 22.1 80.1 76.7 - 83.6 29.9 25.5 - 34.2 37.1 33.2 - 41.0 63.9 56.9 - 70.8HISPANIC 20.1 16.4 - 23.8 72.6 69.3 - 75.9 34.1 29.8 - 38.4 29.8 26.2 - 33.3 60.7 53.3 - 68.2ASIAN 23.9 17.8 - 30.0 80.7 76.0 - 85.3 24.8 18.2 - 31.4 19.4 13.5 - 25.2 74.5 72.5 - 76.5
DISABILITY¶
DISABILITY 17.4 15.2 - 19.7 84.4 81.9 - 86.9 38.1 34.9 - 41.2 34.0 31.6 - 36.3 65.6 60.0 - 71.3NO DISABILITY 19.4 18.3 - 20.4 82.4 81.2 - 83.5 28.6 27.4 - 29.8 25.5 24.5 - 26.5 57.3 54.3 - 60.4
EDUCATION
< HIGH SCHOOL 15.9 12.6 - 19.3 71.1 67.3 - 74.9 36.7 32.2 - 41.1 35.4 31.7 - 39.1 57.6 49.9 - 65.3HIGH SCHOOL 15.0 13.1 - 16.9 79.7 77.6 - 81.9 31.6 29.3 - 34.0 31.6 29.6 - 33.6 61.8 56.3 - 67.3COLLEGE 1–3 YRS 18.4 16.6 - 20.1 83.7 81.8 - 85.6 30.1 28.1 - 32.0 30.5 28.7 - 32.3 58.9 54.2 - 63.6COLLEGE 4+ YRS 22.4 20.9 - 23.9 86.3 84.8 - 87.9 29.6 27.9 - 31.2 21.3 20.2 - 22.4 58.5 55.1 - 61.9
HOUSEHOLD INCOME
<$25,000 15.8 14.0 - 17.7 75.7 73.4 - 78.1 34.0 31.6 - 36.5 34.3 32.1 - 36.5 63.4 57.8 - 68.9$25,000–34,999 14.2 11.4 - 16.9 77.7 74.1 - 81.3 34.1 29.8 - 38.3 30.7 27.6 - 33.9 64.4 56.9 - 71.8$35,000–49,999 18.7 15.9 - 21.5 83.9 81.0 - 86.9 31.8 28.5 - 35.1 29.2 26.6 - 31.9 56.6 50.4 - 62.7$50,000–74,999 21.6 18.5 - 24.6 84.4 81.3 - 87.5 31.7 28.6 - 34.8 29.2 26.4 - 32.0 55.0 49.4 - 60.5$75,000+ 21.9 20.0 - 23.9 86.2 84.3 - 88.2 28.4 26.5 - 30.4 22.3 20.7 - 23.9 61.3 53.9 - 68.7
REGION
I–WESTERN 17.9 15.7 - 20.2 79.5 76.8 - 82.3 29.4 26.9 - 31.9 29.2 26.9 - 31.5 58.2 52.5 - 63.8II–CENTRAL 17.3 15.1 - 19.5 81.7 79.0 - 84.4 30.6 28.0 - 33.3 28.3 26.0 - 30.7 †III–NORTH EAST 18.9 16.7 - 21.1 82.1 79.7 - 84.6 32.8 29.9 - 35.7 30.0 27.6 - 32.3 57.0 51.6 - 62.4IV–METRO WEST 20.9 18.6 - 23.1 85.0 82.6 - 87.3 29.6 27.3 - 31.9 23.6 21.7 - 25.6 69.5 69.4 - 69.5V–SOUTH EAST 18.6 18.3 - 18.9 83.3 81.0 - 85.7 30.9 28.3 - 33.6 28.0 26.1 - 30.0 56.2 55.5 - 56.9VI–BOSTON 17.8 15.5 - 20.2 79.9 77.4 - 82.5 31.5 28.7 - 34.3 28.4 26.0 - 30.8 62.2 55.2 - 69.2
* White, Black, and Asian race categories refer to non-Hispanic† Insufficient data
¶ Disability defined as having one or more of the following conditions: (1) physical, mental, or emotional problem that limited activities or caused cognitive difficulties; or (2) used special equipment or required help from others to get around. Please note that this differs from the definition used in previous years’ reports
104

AGE-ADJUSTED PERCENTAGES FOR SELECTED TOPICS (CONTINUED)
MASSACHUSETTS BEHAVIORAL RISK FACTOR SURVEILLANCE SYSTEM, 2011RECEIVED 3 SHOTS HBV
VACCINERECEIVED TETANUS VACCINE
IN PAST 10 YEARSPRE-DIABETES DIABETES EVER HAD ASTHMA
% 95% CI % 95% CI % 95% CI % 95% CI % 95% CIOVERALL 38.2 36.6 - 39.7 77.3 76.1 - 78.5 5.3 4.8 - 5.9 7.6 7.1 - 8.1 15.6 14.7 - 16.6GENDER
MALE 33.6 31.3 - 36.0 76.9 75.1 - 78.7 5.4 4.6 - 6.2 8.5 7.7 - 9.2 12.7 11.5 - 13.9FEMALE 42.9 40.9 - 44.9 77.9 76.4 - 79.3 5.5 4.8 - 6.3 6.8 6.2 - 7.4 18.3 17.0 - 19.6
RACE-ETHNICITY*WHITE 36.5 34.7 - 38.3 78.9 77.7 - 80.1 5.3 4.7 - 6.0 6.7 6.2 - 7.2 15.5 14.4 - 16.5BLACK 44.0 38.5 - 49.5 72.8 68.5 - 77.1 6.8 4.7 - 8.8 13.2 10.4 - 15.9 14.8 11.9 - 17.7HISPANIC 42.8 37.6 - 47.9 69.3 64.2 - 74.4 5.3 3.0 - 7.5 14.2 11.4 - 17.0 20.7 17.5 - 23.9ASIAN 55.1 46.1 - 64.2 73.0 64.1 - 82.0 † 8.2 3.7 12.7 8.4 4.6 - 12.1
DISABILITY¶
DISABILITY 40.1 36.2 - 44.1 78.5 75.8 - 81.2 7.9 6.3 - 9.4 12.3 10.9 - 13.7 28.5 25.7 - 31.3NO DISABILITY 37.6 35.9 - 39.4 77.1 75.8 - 78.4 4.7 4.1 - 5.3 5.9 5.4 - 6.5 12.4 11.5 - 13.4
EDUCATION
< HIGH SCHOOL 25.3 19.9 - 30.6 71.6 67.1 - 76.1 5.9 4.0 - 7.9 12.7 10.3 - 15.1 22.2 18.7 - 25.7HIGH SCHOOL 29.9 26.6 - 33.1 75.4 72.9 - 77.9 5.6 4.4 - 6.8 8.2 7.2 - 9.3 15.3 13.4 - 17.1COLLEGE 1–3 YRS 41.6 38.6 - 44.5 78.4 76.2 - 80.6 6.0 4.8 - 7.1 7.6 6.7 - 8.5 15.9 14.2 - 17.6COLLEGE 4+ YRS 46.2 43.9 - 48.5 80.3 78.7 - 81.8 4.6 3.9 - 5.3 5.5 4.7 - 6.2 14.0 12.7 - 15.3
HOUSEHOLD INCOME
<$25,000 38.7 35.1 - 42.4 72.9 70.0 - 75.8 5.9 4.7 - 7.2 11.7 10.2 - 13.1 21.6 19.4 - 23.8$25,000–34,999 36.3 30.2 - 42.3 75.9 71.9 - 80.0 6.4 4.2 - 8.6 8.9 7.0 - 10.7 13.8 11.1 - 16.5$35,000–49,999 34.5 29.9 - 39.2 79.1 75.7 - 82.4 4.6 3.4 - 5.7 7.5 6.0 - 9.0 15.3 12.6 - 17.9$50,000–74,999 39.3 35.1 - 43.4 78.7 75.5 - 81.9 5.9 4.3 - 7.6 6.6 5.4 - 7.8 14.9 12.3 - 17.5$75,000+ 43.5 40.7 - 46.2 80.4 78.4 - 82.4 5.1 4.1 - 6.0 5.1 4.1 - 6.0 12.9 11.2 - 14.6
REGION
I–WESTERN 41.3 37.5 - 45.1 78.0 75.5 - 80.6 6.2 4.9 - 7.5 8.3 7.0 - 9.6 20.2 17.6 - 22.8II–CENTRAL † - 81.3 78.6 - 84.0 5.8 4.2 - 7.4 7.2 5.9 - 8.4 14.0 11.7 - 16.2III–NORTH EAST 39.6 36.0 - 43.1 74.4 71.4 - 77.4 5.7 4.2 - 7.2 7.5 6.4 - 8.6 14.9 12.8 - 17.0IV–METRO WEST 40.5 37.0 - 44.1 79.4 77.1 - 81.8 4.4 3.5 - 5.4 6.2 5.1 - 7.3 14.4 12.4 - 16.5V–SOUTH EAST 34.9 34.1 - 35.7 76.4 73.6 - 79.3 5.5 5.1 - 5.9 8.0 6.7 - 9.3 16.6 14.3 - 18.9VI–BOSTON 42.3 38.7 - 45.9 71.2 67.2 - 75.1 5.0 3.6 - 6.3 8.8 7.4 - 10.2 14.1 12.0 - 16.3
* White, Black, and Asian race categories refer to non-Hispanic† Insufficient data
¶ Disability defined as having one or more of the following conditions: (1) physical, mental, or emotional problem that limited activities or caused cognitive difficulties; or (2) used special equipment or required help from others to get around. Please note that this differs from the definition used in previous years’ reports.
105
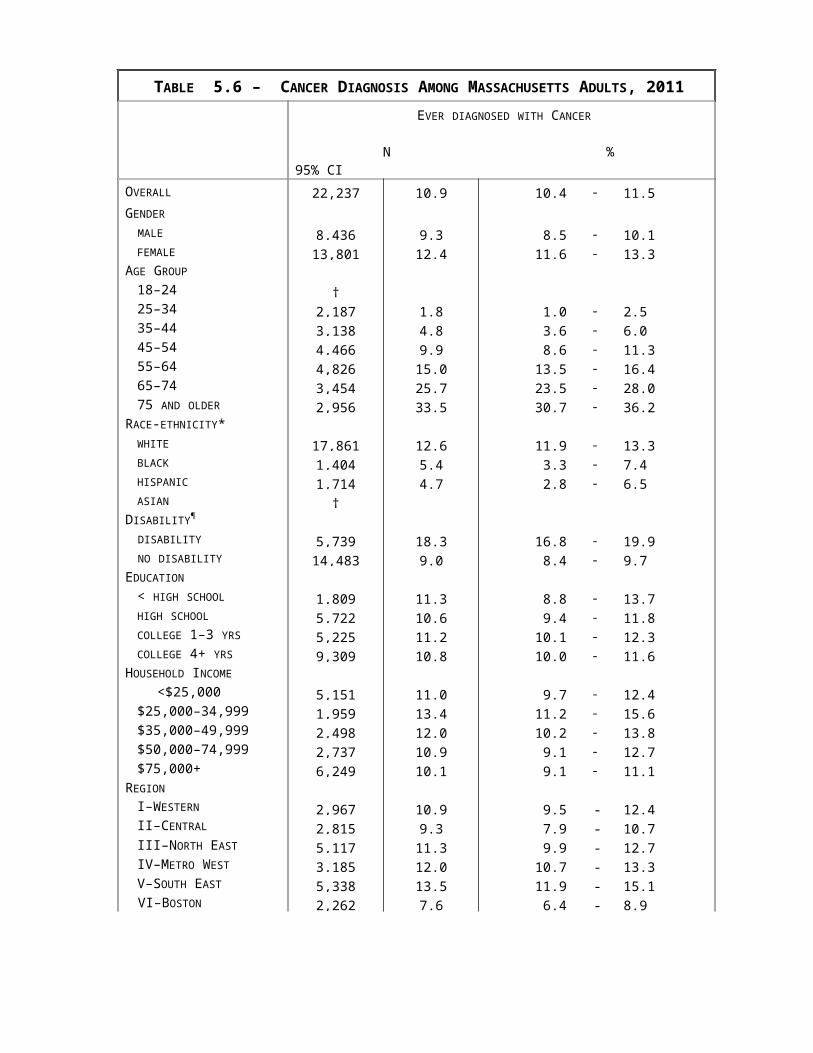
AGE-ADJUSTED PERCENTAGES FOR SELECTED TOPICS (CONTINUED)
MASSACHUSETTS BEHAVIORAL RISK FACTOR SURVEILLANCE SYSTEM, 2011CURRENTLY HAVE ASTHMA
EVER DIAGNOSED WITH COPD
DOCTOR DIAGNOSED ARTHRITIS
LIMITATIONS DUE TO ARTHRITIS
EVER DIAGNOSED WITH CANCER
% 95% CI % 95% CI % 95% CI % 95% CI % 95% CIOVERALL 10.8 10.0 - 11.6 5.4 5.0 - 5.9 22.4 21.6 - 23.2 10.4 9.8 - 11.1 10.4 9.8 - 10.9GENDER
MALE 7.9 6.9 - 8.9 4.8 4.1 - 5.5 19.7 18.5 - 20.9 8.3 7.4 - 9.2 9.3 8.6 - 10.1FEMALE 13.7 12.5 - 14.8 6.2 5.6 - 6.8 24.2 23.2 - 25.2 11.2 10.5 - 12.0 11.1 10.3 - 11.9
RACE-ETHNICITY*WHITE 10.9 10.0 - 11.8 5.6 5.1 - 6.1 22.2 21.4 - 23.1 9.4 8.8 - 10.1 10.9 10.3 - 11.5BLACK 9.3 7.1 - 11.6 5.2 2.5 - 7.9 21.3 18.2 - 24.5 11.0 8.5 - 13.4 6.5 4.2 - 8.8HISPANIC 14.6 11.8 - 17.4 4.1 2.7 - 5.5 25.2 21.9 - 28.5 14.8 12.0 - 17.7 6.6 3.9 - 9.2ASIAN 4.9 2.2 - 7.7 † 10.1 5.8 - 14.4 † †
DISABILITY¶
DISABILITY 21.6 19.0 - 24.1 12.6 10.9 - 14.2 45.0 42.4 - 47.5 31.2 28.8 - 33.6 13.7 12.3 - 15.1NO DISABILITY 8.2 7.4 - 9.0 3.0 2.6 - 3.4 15.3 14.5 - 16.1 3.6 3.1 - 4.0 9.3 8.6 - 9.9
EDUCATION
< HIGH SCHOOL 15.6 12.7 - 18.4 11.2 9.0 - 13.4 30.3 27.0 - 33.5 17.7 14.8 - 20.6 10.3 7.9 - 12.7HIGH SCHOOL 11.6 9.9 - 13.3 6.8 5.8 - 7.9 25.0 23.2 - 26.8 10.5 9.2 - 11.7 8.9 7.8 - 10.0COLLEGE 1–3 YRS 10.4 9.0 - 11.8 5.4 4.5 - 6.2 23.7 22.2 - 25.2 10.6 9.4 - 11.7 11.0 10.0 - 12.0COLLEGE 4+ YRS 9.7 8.5 - 10.8 2.8 2.3 - 3.2 17.0 16.1 - 17.9 6.9 6.3 - 7.5 11.1 10.3 - 12.0
HOUSEHOLD INCOME
<$25,000 16.6 14.6 - 18.6 11.0 9.6 - 12.5 31.1 29.1 - 33.2 18.1 16.4 - 19.9 9.9 8.6 - 11.1$25,000–34,999 9.7 7.6 - 11.8 6.1 4.3 - 7.8 23.6 20.9 - 26.3 11.6 9.5 - 13.7 11.1 9.0 - 13.3$35,000–49,999 10.7 8.4 - 13.0 5.0 3.8 - 6.2 23.4 20.7 - 26.0 8.7 6.9 - 10.6 10.6 8.9 - 12.3$50,000–74,999 9.5 7.4 - 11.5 5.2 3.9 - 6.4 22.1 20.0 - 24.2 8.7 7.2 - 10.1 10.5 8.7 - 12.3$75,000+ 8.5 7.1 - 10.0 2.6 1.9 - 3.3 16.7 15.3 - 18.1 6.3 5.3 - 7.4 11.7 10.5 - 12.8
REGION
I–WESTERN 14.3 12.1 - 16.5 6.3 5.0 - 7.5 25.5 23.5 - 27.6 12.1 10.5 - 13.6 9.8 8.5 - 11.1II–CENTRAL 10.2 8.2 - 12.2 5.7 4.6 - 6.9 22.8 20.7 - 24.9 10.1 8.4 - 11.7 9.0 7.7 - 10.3III–NORTH EAST 10.9 9.0 - 12.7 5.8 4.7 - 6.9 21.4 19.6 - 23.3 9.0 7.7 - 10.4 10.2 8.9 - 11.5IV–METRO WEST 9.4 7.7 - 11.2 4.1 3.2 - 4.9 18.5 17.0 - 20.1 8.4 7.2 - 9.6 10.9 9.7 - 12.1V–SOUTH EAST 11.2 9.3 - 13.1 6.2 5.1 - 7.4 24.9 22.9 - 26.9 11.1 9.6 - 12.6 11.3 9.8 - 12.8VI–BOSTON 10.3 8.4 - 12.2 5.3 4.1 - 6.6 20.2 18.2 - 22.2 9.2 7.7 - 10.8 9.0 7.6 - 10.4
* White, Black, and Asian race categories refer to non-Hispanic† Insufficient data
¶ Disability defined as having one or more of the following conditions: (1) physical, mental, or emotional problem that limited activities or caused cognitive difficulties; or (2) used special equipment or required help from others to get around. Please note that this differs from the definition used in previous years’ reports.
106

AGE-ADJUSTED PERCENTAGES FOR SELECTED TOPICS (CONTINUED)
MASSACHUSETTS BEHAVIORAL RISK FACTOR SURVEILLANCE SYSTEM, 2011EVER DIAGNOSED WITH
DEPRESSIONSELF-IDENTIFIED AS HOMOSEXUAL,
BISEXUAL, OR OTHEREVER TESTED FOR HIV -
AGES 18-64TESTED FOR HIV IN PAST
YEAR - AGES 18-64 SEXUAL VIOLENCE - WOMEN
% 95% CI % 95% CI % 95% CI % 95% CI % 95% CIOVERALL 16.8 15.8 - 17.7 3.9 3.3 - 4.4 47.3 45.9 - 48.7 11.8 10.7 - 12.8 19.8 16.5 - 23.2GENDER
MALE 13.3 12.1 - 14.6 3.9 3.1 - 4.7 44.1 42.0 - 46.1 11.5 10.0 - 13.1 n/aFEMALE 20.2 18.9 - 21.4 3.9 3.1 - 4.7 50.9 49.1 - 52.7 12.0 10.6 - 13.4 19.8 16.5 - 23.2
RACE-ETHNICITY*WHITE 17.3 16.3 - 18.4 4.0 3.3 - 4.6 45.1 43.4 - 46.7 10.3 9.1 - 11.5 20.7 16.7 - 24.6BLACK 12.8 9.6 - 16.1 3.8 2.0 - 5.7 69.8 65.4 - 74.2 26.9 21.5 - 32.2 18.0 9.2 - 26.8HISPANIC 20.5 17.4 - 23.6 3.0 1.4 - 4.6 64.2 60.0 - 68.4 19.5 15.7 - 23.3 13.2 12.1 - 14.4ASIAN 9.5 4.6 - 14.4 † 30.2 23.8 - 36.7 4.8 2.2 - 7.3 †
DISABILITY¶
DISABILITY 35.5 32.6 - 38.3 6.5 4.4 - 8.6 58.3 54.9 - 61.7 16.3 13.2 - 19.3 24.6 16.7 - 32.5NO DISABILITY 11.8 10.9 - 12.7 3.3 2.8 - 3.9 44.7 43.2 - 46.2 10.8 9.7 - 11.8 18.1 14.4 - 21.8
EDUCATION
< HIGH SCHOOL 29.3 25.3 - 33.2 1.7 0.9 - 2.5 54.0 48.5 - 59.5 11.8 8.2 - 15.4 †HIGH SCHOOL 16.9 15.0 - 18.8 2.9 1.8 - 3.9 46.8 43.9 - 49.8 14.3 11.7 - 16.9 20.2 12.1 - 28.3COLLEGE 1–3 YRS 17.8 16.1 - 19.5 4.3 3.2 - 5.5 49.0 46.3 - 51.7 13.0 10.9 - 15.1 19.8 14.2 - 25.3COLLEGE 4+ YRS 12.9 11.7 - 14.1 4.8 3.7 - 5.9 46.2 44.1 - 48.3 9.9 8.4 - 11.3 22.0 16.8 - 27.2
HOUSEHOLD INCOME
<$25,000 28.9 26.6 - 31.3 4.3 3.1 - 5.6 58.4 55.3 - 61.5 18.3 15.6 - 21.0 27.6 20.2 - 35.1$25,000–34,999 19.6 16.4 - 22.9 4.0 2.3 - 5.7 49.4 44.2 - 54.6 13.5 9.9 - 17.1 †$35,000–49,999 15.9 13.1 - 18.7 3.6 2.1 - 5.2 47.7 43.4 - 52.1 12.0 8.8 - 15.2 22.6 12.4 - 32.8$50,000–74,999 17.3 14.6 - 20.1 3.9 2.3 - 5.6 42.8 38.7 - 46.8 10.3 7.5 - 13.1 15.4 10.1 - 20.6$75,000+ 10.7 9.2 - 12.2 4.7 3.3 - 6.1 44.7 42.0 - 47.3 9.2 7.2 - 11.2 17.4 12.2 - 22.6
REGION
I–WESTERN 18.5 16.2 - 20.9 4.1 2.8 - 5.3 51.4 47.7 - 55.0 12.0 9.3 - 14.8 27.5 19.1 - 35.8II–CENTRAL 18.3 15.7 - 20.8 2.7 1.5 - 4.0 † † 18.0 11.1 - 24.9III–NORTH EAST 15.1 13.1 - 17.2 3.2 1.9 - 4.5 48.5 45.1 - 52.0 12.7 10.1 - 15.4 16.3 10.0 - 22.6IV–METRO WEST 15.4 13.3 - 17.4 4.1 2.6 - 5.5 43.2 39.9 - 46.5 10.1 7.7 - 12.4 17.0 17.0 - 17.0V–SOUTH EAST 19.0 16.7 - 21.4 4.0 3.6 - 4.4 47.9 47.4 - 48.4 † 20.5 11.8 - 29.2VI–BOSTON 14.5 12.5 - 16.5 7.0 5.2 - 8.7 57.0 53.6 - 60.3 17.5 14.5 - 20.5 15.8 12.5 - 19.2
* White, Black, and Asian race categories refer to non-Hispanic† Insufficient data
¶ Disability defined as having one or more of the following conditions: (1) physical, mental, or emotional problem that limited activities or caused cognitive difficulties; or (2) used special equipment or required help from others to get around. Please note that this differs from the definition used in previous years’ reports.
107
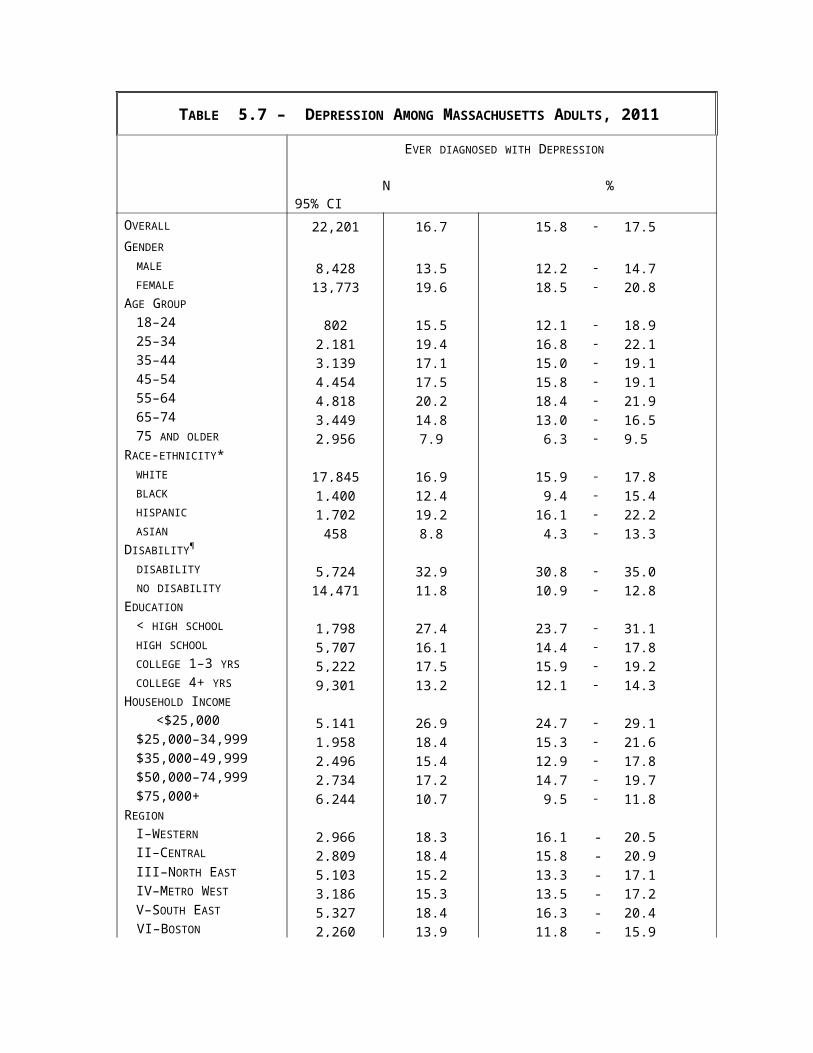
AGE- ADJUSTED PERCENTAGES FOR SELECTED TOPICS (CONTINUED)
ALWAYS USE A SEATBELT
% 95% CI
OVERALL 79.5 78.4 - 80.6GENDER
MALE 73.9 72.2 - 75.6FEMALE 84.7 83.4 - 85.9
RACE-ETHNICITY*WHITE 79.2 77.9 - 80.4BLACK 76.5 72.7 - 80.3HISPANIC 80.0 76.2 - 83.9ASIAN 90.7 87.0 - 94.4
DISABILITY¶
DISABILITY 75.8 73.0 - 78.6NO DISABILITY 80.2 79.0 - 81.4
EDUCATION
< HIGH SCHOOL 73.5 69.4 - 77.6HIGH SCHOOL 71.4 68.9 - 73.8COLLEGE 1–3 YRS 78.4 76.3 - 80.4COLLEGE 4+ YRS 87.1 85.7 - 88.6
HOUSEHOLD INCOME
<$25,000 74.6 72.2 - 76.9$25,000–34,999 76.3 72.4 - 80.3$35,000–49,999 74.6 71.2 - 78.1$50,000–74,999 77.9 74.5 - 81.2$75,000+ 83.7 81.6 - 85.7
REGION
I–WESTERN 78.7 76.0 - 81.5II–CENTRAL 79.6 76.8 - 82.3III–NORTH EAST 78.9 76.3 - 81.5IV–METRO WEST 81.5 79.0 - 84.0V–SOUTH EAST 75.5 75.1 - 76.0VI–BOSTON 82.0 79.5 - 84.4
* White, Black, and Asian race categories refer to non-Hispanic¶ Disability defined as having one or more of the following conditions: (1) physical, mental, or emotional problem that limited activities or caused cognitive difficulties; or (2) used special equipment or required help from others to get around. Please note that this differs from the definition used in previous years’ reports
108

MASSACHUSETTS ESTIMATES AND HP 2020^
109
MASSACHUSETTS BEHAVIORAL RISK FACTOR SURVEILLANCE SYSTEM, 2011
VARIABLES¶ MA%
HP 2020^%
HEALTH CARE ACCESS AND UTILIZATIONHAVE PERSONAL HEALTH CARE PROVIDER (18-64) 86.8 89.4HAVE PERSONAL HEALTH CARE PROVIDER (65+) 96.5 100.0
RISK FACTORS AND PREVENTIVE BEHAVIORSCURRENT SMOKER 18.2 12.0QUIT ATTEMPT AMONG CURRENT SMOKERS 60.1 80.0USE SMOKELESS TOBACCO 1.7 0.3BINGE DRINKING 20.6 24.3OBESITY (20+) 22.7 30.6NO LEISURE TIME PHYSICAL ACTIVITY 23.5 32.6AEROBIC ACTIVITY 150+ MINUTES/WEEK 56.3 47.9MUSCLE-STRENGTHENING ACTIVITIES 2+ DAYS/WEEK 32.0 24.1CHOLESTEROL CHECKED IN PAST 5 YEARS 83.7 82.1HIGH CHOLESTEROL (20+) 34.8 13.5HIGH BLOOD PRESSURE 29.2 26.9
IMMUNIZATIONFLU VACCINE IN PAST YEAR (18-64) 39.6 80.0FLU VACCINE IN PAST YEAR (65+) 66.9 90.0EVER HAD PNEUMONIA VACCINATION (18-64) 23.5 60.0EVER HAD PNEUMONIA VACCINATION (65+) 72.7 90.0
CHRONIC HEALTH CONDITIONSLIMITATIONS DUE TO ARTHRITIS (AMONG THOSE DIAGNOSED) 46.6 35.5
OTHER TOPICSTESTED FOR HIV IN PAST YEAR (18-44) 16.7 16.9
¶ Variable definitions were created to match those in HP 2020 and may not match definitions used elsewhere in this report - e.g. may use different age grouping
^ HP 2020 = Healthy People 2020 Objectives.

MASSACHUSETTS AND NATIONAL ESTIMATES
MASSACHUSETTS BEHAVIORAL RISK FACTOR SURVEILLANCE SYSTEM, 2011VARIABLES
MA%
US MEDIAN¶
%US RANGE¶
%OVERALL HEALTH MEASURES
FAIR OR POOR HEALTH 14.0 17.1 12.0-34.515+ POOR MENTAL HEALTH DAYS 10.4 11.1 7.4-16.215+ DAYS IN POOR PHYSICAL HEALTH 9.7 11.0 7.8-16.3DISABILITY 23.1 25.6 20.6-33.0
HEALTH CARE ACCESS AND UTILIZATION NO HEALTH INSURANCE 4.4 †
HAVE PERSONAL HEALTH CARE PROVIDER 88.3 78.1 63.0-88.3COULD NOT SEE DOCTOR DUE TO COST 9.5 16.1 8.7-23.3CHECKUP IN PAST YEAR 78.8 66.7 53.5-79.0
RISK FACTORS AND PREVENTIVE BEHAVIORSCURRENT SMOKER 18.2 21.1 11.8-29.0FORMER SMOKER 28.8 25.1 16.0-31.6QUIT ATTEMPT AMONG CURRENT SMOKERS 60.1 58.4 50.2-64.9USE SMOKELESS TOBACCO 1.7 4.4 1.3-9.8BINGE DRINKING 20.6 18.3 10.0-25.0HEAVY DRINKING 7.9 6.6 3.4-9.8OVERWEIGHT 59.3 63.9 52.9-68.9OBESITY 22.7 27.8 20.7-34.9MET GUIDELINES FOR AEROBIC ACTIVITY 56.3 51.6 33.8-61.8MET GUIDELINES FOR MUSCLE-STRENGTHENING ACTIVITY 32.0 29.4 12.1-36.15+ SERVINGS OF FRUIT/VEGETABLES PER DAY 18.8 16.5 7.9-25.5CHOLESTEROL CHECKED IN PAST 5 YEARS 83.7 75.5 66.3-83.7HIGH CHOLESTEROL 34.3 38.4 33.5-42.3HIGH BLOOD PRESSURE 29.2 30.9 22.9-40.1TAKE MEDICINE FOR HIGH BLOOD PRESSURE 76.9 77.7 64.7-84.3
IMMUNIZATIONFLU VACCINE IN PAST YEAR (18-49) 35.1 28.9 15.8-42.4FLU VACCINE IN PAST YEAR (50-64) 48.7 42.1 17.8-52.2FLU VACCINE IN PAST YEAR (65+) 66.9 61.0 28.6-70.2EVER HAD PNEUMONIA VACCINATION (65+) 72.2 70.0 22.9-76.0
CHRONIC HEALTH CONDITIONSDIABETES 8.0 9.5 6.7-13.5EVER HAD ASTHMA 15.3 13.7 10.4-17.2CURRENTLY HAVE ASTHMA 10.7 9.1 6.4-12.0HAVE ARTHRITIS 23.6 24.4 18.2-35.9LIMITATIONS DUE TO ARTHRITIS 10.3 11.2 4.0-14.5MYOCARDIAL INFARCTION (35+) 5.1 6.1 3.8-9.2ANGINA OR CORONARY HEART DISEASE (35+) 5.2 5.7 3.5-10.1STROKE (35+) 3.1 3.8 2.4-6.1CHRONIC OBSTRUCTIVE PULMONARY DISEASE 5.8 6.1 3.1-9.8EVER DIAGNOSED WITH CANCER 10.9 11.2 4.0-14.5EVER DIAGNOSED WITH DEPRESSION 16.7 17.5 10.6-24.4
OTHER TOPICSEVER TESTED FOR HIV (18-64) 45.5 40.7 27.4-73.5TESTED FOR HIV IN PAST YEAR (18-64) 11.2 10.8 6.6-38.3ALWAYS WEAR A SEATBELT 79.7 86.1 63.9-94.1
¶ The US median percentage and range are based on data for all 50 states, District of Columbia, and Puerto Rico. † No comparable US data available
110

ITEM-SPECIFIC NON-RESPONSE
MASSACHUSETTS BEHAVIORAL RISK FACTOR SURVEILLANCE SYSTEM, 2011PERCENTAGE OF NON-RESPONSE*
%OVERALL HEALTH MEASURES
FAIR OR POOR HEALTH 0.315+ DAYS IN POOR PHYSICAL HEALTH IN PAST MONTH 2.615+ POOR MENTAL HEALTH DAYS IN PAST MONTH 2.6DISABILITY 9.1
HEALTH CARE ACCESS AND UTILIZATIONHAVE PERSONAL HEALTH CARE PROVIDER 0.3COULD NOT SEE DOCTOR DUE TO COST 0.4CHECKUP IN PAST YEAR 0.9
RISK FACTORS AND PREVENTIVE BEHAVIORSCURRENT SMOKER 0.8FORMER SMOKER 0.8USE SMOKELESS TOBACCO 0.1QUIT ATTEMPT AMONG CURRENT SMOKERS 0.4LIVE IN HOUSEHOLD WHERE SMOKING IS NOT ALLOWED 16.6EXPOSED TO ENVIRONMENTAL SMOKE 18.1BINGE DRINKING 11.4HEAVY DRINKING 11.4OVERWEIGHT 8.0OBESITY 8.0MET RECOMMENDATION FOR AEROBIC ACTIVITY 11.4MET RECOMMENDATION FOR MUSCLE STRENGTHENING ACTIVITY 9.15 OR MORE SERVINGS OF FRUITS OR VEGETABLES 6.8CHOLESTEROL CHECKED IN PAST 5 YEARS 10.9HIGH BLOOD PRESSURE 0.3
IMMUNIZATIONFLU VACCINE IN THE PAST YEAR (18-49) 10.3FLU VACCINE IN THE PAST YEAR (50-64) 8.3FLU VACCINE IN THE PAST YEAR (65+) 10.8EVER HAD PNEUMONIA VACCINE (65+) 15.4HPV VACCINE (FEMALES 18-49) 18.9HAD HEPATITIS B VACCINE 25.9TETANUS VACCINE IN PAST 10 YEARS 22.1SHINGLES VACCINE (50+) 16.2
CHRONIC HEALTH CONDITIONSPRE-DIABETES 12.5DIABETES 0.2EVER HAD ASTHMA 0.3CURRENTLY HAVE ASTHMA 0.6DOCTOR DIAGNOSED ARTHRITIS 0.6LIMITATIONS DUE TO ARTHRITIS 3.5HEART ATTACK (35+) 0.5ANGINA OR CORONARY HEART DISEASE (35+) 0.8STROKE (35+) 0.3EVER DIAGNOSED WITH CANCER 0.4CHRONIC OBSTRUCTIVE PULMONARY DISEASE 0.5EVER DIAGNOSED WITH DEPRESSION 0.6
OTHER TOPICSEVER TESTED FOR HIV (18-64) 12.8ALWAYS WEAR A SEATBELT 10.2
* The item-specific unweighted non-response % was calculated using the number of respondents who had finished the demographic section of the 2011 BRFSS as the denominator and those who reported don’t know or refused as the numerator.
111
ADDENDUM
112

This addendum serves to offer further explanation of the methodological changes to the BRFSS implemented in 2011.
This addendum contains a document, “Understanding the Impact of Changes in BRFSS Weighting Protocols”57. This document was produced by the CDC and contains examples from national data. In addition, there are eleven tables, produced using Massachusetts data, with selected indicators comparing 2010 estimates utilizing only the landline sample and the “old” weighting methodology (post-stratification) to 2011 estimates utilizing the combined landline and cell phone samples and employing the “new” weighting methodology (raking or iterative proportional fitting). These tables provide a comparison of the overall estimates as well as estimates among subpopulations, so that the reader can see which groups were most affected by the survey modes and methodological changes.
Please note that these tables are provided for the sole purpose of illustrating the effect of changes to the weighting methodology and the inclusion of cell phone respondents. As noted earlier in this release, data from 2011 are not comparable to previous years’ data. Disability status was not included in these tables as there was a minor change in how disability was defined between 2010 and 2011.
57 Centers for Disease Control and Prevention. Understanding the Impact of Changes in BRFSS Weighting Protocols. Retrieved on June 28, 2012 from http://www.cdc.gov/surveillancepractice/reports/brfss/brfss.html
113

UNDERSTANDING THE IMPACT OF CHANGES IN BRFSS WEIGHTING PROTOCOLS
Background:
Weighting processes are used by all large surveys. These processes adjust the data so that those groups which are underrepresented in the sample can be accurately represented in the data. The weighting process for BRFSS data has been changed from Post-Stratification to Raking (or iterative proportional fitting). Post-Stratification has been used by BRFSS for many years. During 2007 Raking was introduced and in 2011 Raking will be the only method used for weighting.
Post-Stratification and Raking methods used by the BRFSS differ. In Post-Stratification, categories of gender, age, race/ethnicity and regions within states were used to adjust data. In Raking, telephone source (landline or cell phone), education level, marital status and renter/owner status will be added to race and ethnicity, regions within states, age group by gender, gender by race and ethnicity, and age group by race and ethnicity. The post-stratification process also required that categories of variables had to be collapsed when too few respondents fit the criteria. For example, if there were only a few persons who met race, gender and age criteria, then groups of ages might be combined prior to weighting. Raking does not require the collapsing of categories, even though more demographic characteristics are being included. The inclusion of new demographic characteristics as weights allows for a greater understanding of how BRFSS samples represent populations.
Raking is completed by adjusting for one demographic variable (or dimension) at a time. For example, when weighting by age and gender, weights would first be adjusted for gender groups, then those estimates would be adjusted by age groups. This procedure would continue in an iterative process until all group proportions in the sample approach those of the population, or after 75 iterations.
Raking is a step forward in the weighting process. In the past, computer systems were strained by the complexity of Raking with very large survey samples. In 2011, computer systems are better able to accomplish this task. The changes in personal communication require that surveys include cell phone samples. Raking allows for the integration of cell phone samples in BRFSS estimates.
Differences in Estimates using Post-Stratification and Raking
It should be remembered that Raking will include new demographic characteristics on which weights are calculated. Raking adds new variables (telephone source, education level, marital status and renter/owner status) to variables which have been used for weighting in the past (age, race/ethnicity, gender, region/state). The statistical processes are also different. In some cases this will result in changes in prevalence estimates when comparing Post-Stratification and Raking. In the example below (see Table 1), small differences are noted between prevalence estimates for landline samples when Post-Stratification and Raking are compared for responses in a single state. This table provides weighted frequency distributions for the variable DIABETE2: “Has a healthcare provider ever told you that you have diabetes?”
114

Table 1State-level Responses to Question:
“Has a doctor, nurse or other healthcare provider ever told you that you have diabetes?”By Type Of Weighting Procedure for Landline Data
Response Landline Weighted frequency with Post-Stratification
Landline Percent With Post-Stratification
Landline Weighted frequency with Raking
Landline Percent With Raking
Differences in Landline Percentages(Post-Stratification - Raking)
Yes 434,858 12.26 440,694 12.43 -0.17Yes, but only during pregnancy
26,306 0.74 26,262 0.74 0.00
No 3,031,681 85.44 3,029,545 85.42 0.02No, Pre-diabetes/ borderline diabetes
55,454 1.56 50,196 1.42 0.15
As this table indicates, differences between the prevalence estimates are very small and not likely to be noted in trends of responses to this question over time. However, in other instances differences may be evident when Post-Stratification and Raking are compared. In Table 2, below, responses to the variable GENHLTH are presented. These questions are in response to the question, “Would you say that in general your health is…Excellent, Very Good, Good, Fair or Poor.” As the table indicates, some of the weighted percentages are similar when Post-Stratification and Raking are compared. Other categories of response differ. For example, the percentage of the responses in the response category “Good” is 31.26 percent when weighted using Post-Stratification, and it is 31.42 percent using Raking (a difference of only -0.16 percent). Differences are more pronounced between the prevalence estimates of those who respond “Fair,” with percentages of 14.65 and 16.73 for Post-Stratification and Raking, respectively (a difference of -2.07 percent).
Table 2State-level Responses to Question:
“Would you say that in general your health is excellent, very good, good, fair or poor?”By Type Of Weighting Procedure for Landline Data
Response Landline Weighted Frequency With Post-Stratification
Landline PercentWith Post-Stratification
Landline Weighted Frequency With Raking
Landline Percent With Raking
Differences In Landline Percentages(Post-Stratification - Raking)
Excellent 631,742 17.83 575,541 16.27 1.56Very Good 1,037,345 29.27 963,330 27.23 2.04Good 1,107,272 31.26 1,111,484 31.42 -0.16Fair 519,248 14.65 591,716 16.73 -2.07Poor 247,424 6.98 295,425 8.35 -1.37
115

In the example below there are more consistent differences between weighted percentages in all of the responses to a question. The table below provides comparisons to the variable EXERANY2: “During the past month, other than your regular job, did you participate in any physical activities or exercises such as running, calisthenics, golf, gardening, or walking for exercise?” As is depicted in the table, both categories of response are different when compared by weighting procedures.
Table 3State-level Responses to Question:
“During the past month, other than your regular job, did you participate in any physical activities or exercises such as running, calisthenics, golf, gardening, or walking for exercise?”
By Type Of Weighting Procedure for Landline DataResponse Landline Weighted
Frequency With Post-Stratification
Landline PercentWith Post-Stratification
Landline Weighted Frequency With Raking
Landline Percent With Raking
Differences In Landline Percentages(Post-Stratification - Raking)
Yes 2,448,288 68.97 2,342,381 65.98 2.99No 1,101,378 31.03 1,207,643 34.02 -2.99
Differences noted in these examples are consequences of the inclusion of additional variables in the weighting process as well as differences in the procedure itself.
However, some of the differences which are noted in Tables 1-3 are ameliorated by the inclusion of cell phone data, which is also being included in the 2011 BRFSS data. In the section below, illustrations of the impact of cell phone data and concurrent weighting changes are presented.
Differences in Estimates using Post-Stratification and Raking With Integrated Cell Phone Data
One of the reasons for moving to Raking is to allow for the inclusion of cell phone data. In 2011, these two changes will be adopted for all BRFSS data. Some of the changes noted in the tables above, are minimized by the inclusion of cell phone data. For example, in Table 4 below, data from Table 3 are reproduced with additional columns to illustrate percentages using landline and cell phone data. As this table shows, the differences noted between estimates produced using Post-Stratification and Raking, are no longer a factor when cell phone samples are included in the weighting.
Table 4State-level Responses to Question:
“During the past month, other than your regular job, did you participate in any physical activities or exercises such as running, calisthenics, golf, gardening, or walking for exercise?”
By Type Of Weighting Procedure for Landline and Cell Phone DataResponse Landline
Weighted Frequency With Post-Stratification
Landline PercentWith Post-Stratification
Landline Weighted Frequency With Raking
Landline Percent With Raking
Differences In Landline Percentages(Post-Stratification - Raking)
Landline And Cell Phone Weighted Frequency With Raking
Landline And Cell Phone Percent With Raking
Landline And Cell Phone Differences In Percentages (Post-Stratification - Raking)
Yes 2,448,288 68.97 2,342,381 65.98 2.99 2,447,823 68.96 0.02No 1,101,378 31.03 1,207,643 34.02 -2.99 1,102,053 31.04 -0.02
In some cases, the inclusion of cell phone samples may reduce, but not minimize the impact of 116

weighting changes. For example, in the table below, while differences in weighting are less substantial, there are still noticeable differences between estimates derived from Post-Stratification and Raking weighting. In this instance respondents were asked how often they smoked. As the data illustrate, in some categories the Raking landline/cell phone responses are closer to the Post-Stratification estimates. In one category (persons who smoke some days), the estimate is further off and in a different direction than with Raking alone.
Table 5State-level Responses to Question:
“Do you smoke cigarettes every day, some days or not at all?”By Type Of Weighting Procedure for Landline and Cell Phone Data
Response Landline Weighted Frequency With Post-Stratification
Landline PercentWith Post-Stratification
Landline Weighted Frequency With Raking
Landline Percent With Raking
Differences In Landline Percentages(Post-Stratification - Raking)
Landline And Cell Phone Weighted Frequency With Raking
Landline And Cell Phone Percent With Raking
Landline And Cell Phone Differences In Percentages (Post-Stratification - Raking)
Every day 581,967 36.32 704,831 40.95 -4.63 676,129 40.40 -4.08Some Days
213,724 13.34 248,782 14.45 -1.12 199,278 11.91 1.43
Not At All 806,827 50.35 767,708 44.60 5.75 798,181 47.69 2.65
Conclusions
New weighting procedures are needed to keep pace with the changing landscape of personal communications. The inclusion of new variables and more complex weighting procedures for large scale survey data are now feasible, because of improvements in the capacity of computer systems. It is to be expected that there will be some differences in estimates when weighting procedures change and when new variables for weighting are introduced. The change from Post-Stratification to Raking will allow researchers to understand better the associations between variables, by controlling more factors through the weighting process. In addition Raking allows for the inclusion of cell phone samples in the data.
It should be remembered that these are only depictions of potential outcomes of changes at the BRFSS. The examples presented here may not be illustrative of impacts of weighting procedures in different states or for different variables.
117

The following tables provide Massachusetts estimates for selected indicators comparing 2010 estimates utilizing only the landline sample and the “old” weighting methodology (post-stratification) to 2011 estimates utilizing the combined landline and cell phone samples and employing the “new” weighting methodology (raking or iterative proportional fitting). These tables provide a comparison of the overall estimates as well as estimates among subpopulations, so that the reader can see which groups were most affected by the survey modes and methodological changes.
Please note that these tables are provided for the sole purpose of illustrating the effect of changes to the weighting methodology and the inclusion of cell phone respondents. As noted earlier in this release, data from 2011 are not comparable to previous years’ data. Disability status was not included in these tables as there was a minor change in how disability was defined between 2010 and 2011.
118

TABLE A1: FAIR OR POOR OVERALL HEALTH AMONG MA ADULTS, 2010-2011
FAIR OR POOR HEALTH2010 POST-STRATIFIED DATA
(LANDLINE SAMPLE) N % 95% CI
FAIR OR POOR HEALTH
2011 “RAKED” DATA
(COMBINED SAMPLE) N % 95% CI
OVERALL 16,262 11.6 10.8 - 12.3 22,253 14.0 13.3 - 14.8
GENDER
MALE 6,106 10.8 9.7 - 11.9 8,448 13.9 12.7 - 15.0
FEMALE 10,156 12.3 11.3 - 13.2 13,805 14.2 13.3 - 15.1
AGE GROUP
18–24 365 4.9 2.2 - 7.5 807 7.1 4.8 - 9.4
25–34 1,361 6.5 4.7 - 8.4 2,186 8.1 6.3 - 9.8
35–44 2,495 8.0 6.5 - 9.5 3,146 10.8 8.9 - 12.6
45–54 3,423 9.9 8.6 - 11.3 4,467 12.9 11.4 - 14.3
55–64 3,583 15.2 13.4 - 17.0 4,833 19.3 17.6 - 21.0
65–74 2,507 18.6 16.5 - 20.7 3,457 22.7 20.5 - 24.8
75 AND OLDER 2,252 25.5 23.0 - 28.0 2,951 26.9 24.4 - 29.4
RACE-ETHNICITY*WHITE 13,314 10.4 9.7 - 11.1 17,880 12.5 11.8 - 13.3
BLACK 792 13.3 10.1 - 16.4 1,398 17.9 14.5 - 21.3
HISPANIC 1,253 23.4 19.4 - 27.3 1,718 27.3 23.8 - 30.8
ASIAN † 461 7.9 4.2 - 11.6
EDUCATION
< HIGH SCHOOL 1,529 40.7 35.8 - 45.6 1,802 34.8 31.2 - 38.5
HIGH SCHOOL 4,049 18.5 16.6 - 20.3 5,724 17.7 16.2 - 19.3
COLLEGE 1–3 YRS 3,714 12.0 10.6 - 13.5 5,224 12.0 10.8 - 13.3
COLLEGE 4+ YRS 6,847 4.9 4.2 - 5.5 9,328 6.0 5.3 - 6.7
HOUSEHOLD INCOME
<$25,000 3,751 31.4 28.9 - 34.0 5,151 29.0 26.8 - 31.1
$25,000–34,999 1,418 20.0 16.4 - 23.7 1,962 19.1 16.2 - 22.1
$35,000–49,999 1,739 10.6 8.6 - 12.6 2,495 11.8 9.9 - 13.7
$50,000–74,999 1,962 6.9 5.3 - 8.5 2,741 7.3 5.9 - 8.7
$75,000+ 4,813 3.5 2.8 - 4.1 6,252 4.7 3.9 - 5.5
REGION
I–WESTERN 2,253 14.0 12.1 - 15.9 2,970 16.6 14.7 - 18.5
II–CENTRAL 2,137 11.9 10.0 - 13.9 2,808 15.0 13.0 - 17.0
III–NORTH EAST 3,765 11.7 10.0 - 13.3 5,110 13.3 11.6 - 14.9
IV–METRO WEST 2,082 7.3 6.0 - 8.5 2,970 9.2 7.9 - 10.6
V–SOUTH EAST 3,988 12.9 11.3 - 14.5 5,348 15.9 14.1 - 17.6VI–BOSTON 1,764 16.2 13.5 - 18.8 2,260 16.0 13.5 - 18.5
* White, Black, and Asian race categories refer to non-Hispanic† Insufficient DataThis table is provided for illustrative purposes only. Data from 2010 and 2011 are not comparable due to changes in methodology
119

TABLE A2: CHECK-UP IN PAST YEAR AMONG MA ADULTS, 2010-2011HAVE HAD A CHECKUP IN THE PAST YEAR
2010 POST-STRATIFIED DATA(LANDLINE SAMPLE)
N % 95% CI
HAVE HAD A CHECKUP IN THE PAST YEAR
2011 “RAKED” DATA
(COMBINED SAMPLE) N % 95% CIOVERALL 16199 80.0 78.9 - 81.0 22,130 78.8 77.8 - 79.8
GENDER
MALE 6083 76.0 74.3 - 77.8 8,398 74.1 72.5 - 75.7
FEMALE 10116 83.6 82.382.3
- 84.8 13,732 83.1 82.0 - 84.2
AGE GROUP
18–24 362 76.3 69.5 - 83.2 793 73.9 69.9 - 77.8
25–34 1350 73.4 69.8 - 76.9 2,169 64.7 61.6 - 67.8
35–44 2484 73.3 70.9 - 75.8 3,120 75.0 72.6 - 77.4
45–54 3407 80.1 78.1 - 82.1 4,454 77.7 75.8 - 79.6
55–64 3577 83.7 81.7 - 85.6 4,817 86.7 85.1 - 88.3
65–74 2501 91.4 89.8 - 93.0 3,447 92.6 91.4 - 93.8
75 AND OLDER 2245 95.3 94.2 - 96.4 2,928 93.4 91.9 - 94.9
RACE-ETHNICITY*WHITE 13273 79.9 78.8 - 81.1 17,777 79.5 78.4 - 80.6
BLACK 790 85.0 80.5 - 89.4 1,403 79.8 75.7 - 83.8
HISPANIC 1241 80.8 76.5 - 85.2 1,698 75.3 71.7 - 79.0
ASIAN 278 76.2 68.6 - 83.7 459 72.5 66.4 - 78.5
EDUCATION
< HIGH SCHOOL 1515 79.1 74.0 - 84.2 1,790 78.7 75.1 - 82.4
HIGH SCHOOL 4037 81.1 78.8 - 83.4 5,686 79.0 77.0 - 81.0
COLLEGE 1–3 YRS 3695 82.4 80.5 - 84.4 5,205 78.6 76.7 - 80.6
COLLEGE 4+ YRS 6835 78.4 76.8 - 79.9 9,278 78.8 77.4 - 80.2
HOUSEHOLD INCOME
<$25,000 3724 83.1 80.8 - 85.4 5,117 78.8 76.6 - 81.0
$25,000–34,999 1413 82.7 79.1 - 86.3 1,949 78.5 75.1 - 81.9
$35,000–49,999 1734 80.0 76.6 - 83.3 2,482 77.4 74.3 - 80.5
$50,000–74,999 1964 79.4 76.3 - 82.5 2,730 79.0 76.3 - 81.8
$75,000+ 4806 77.8 76.0 - 79.5 6,236 78.8 77.2 - 80.4
REGION
I–WESTERN 2235 77.2 74.2 - 80.2 2,947 79.5 77.0 - 82.0
II–CENTRAL 2131 79.7 76.8 - 82.6 2,799 77.5 74.8 - 80.1
III–NORTH EAST 3756 80.2 77.7 - 82.6 5,082 79.4 77.1 - 81.8
IV–METRO WEST 2084 78.8 76.5 - 81.2 3,188 77.2 74.9 - 79.5
V–SOUTH EAST 3967 82.4 80.2 - 84.7 5,310 82.0 79.9 - 84.0VI–BOSTON 1756 80.9 77.8 - 84.0 2,257 78.1 75.2 - 81.0
* White, Black, and Asian race categories refer to non-Hispanic† Insufficient DataThis table is provided for illustrative purposes only. Data from 2010 and 2011 are not comparable due to changes in methodology
120

TABLE A3: CURRENT CIGARETTE SMOKING AMONG MA ADULTS, 2010-2011CURRENT SMOKER
2010 POST-STRATIFIED DATA
(LANDLINE SAMPLE) N % 95% CI
CURRENT SMOKER
2011 “RAKED” DATA
(COMBINED SAMPLE) N % 95% CI
OVERALL 16,219 14.1 13.2 - 15.0 22,150 18.2 17.3 - 19.2
GENDER
MALE 6,086 14.8 13.4 - 16.2 8,412 19.7 18.2 - 21.1
FEMALE 10,133 13.4 12.4 - 14.5 13,738 16.9 15.7 - 18.1
AGE GROUP
18–24 362 18.8 12.8 - 24.9 802 22.6 18.7 - 26.5
25–34 1,357 18.7 15.6 - 21.7 2,180 26.4 23.4 - 29.3
35–44 2,487 15.5 13.6 - 17.5 3,125 20.3 17.9 - 22.7
45–54 3,422 14.8 13.1 - 16.5 4,449 17.8 16.1 - 19.5
55–64 3,573 12.6 11.1 - 14.1 4,824 15.2 13.7 - 16.8
65–74 2,500 10.4 8.8 - 12.0 3,447 12.0 10.3 - 13.6
75 AND OLDER 2,249 4.7 3.6 - 5.8 2,925 5.7 4.3 - 7.1
RACE-ETHNICITY*WHITE 13,279 14.1 13.1 - 15.0 17,781 18.5 17.4 - 19.6
BLACK 789 15.7 11.5 - 19.8 1,399 17.4 13.9 - 20.9
HISPANIC 1,252 14.8 11.3 - 18.3 1,717 19.2 15.7 - 22.7
ASIAN 276 8.1 3.4 - 12.9 458 8.6 4.5 - 12.8
EDUCATION
< HIGH SCHOOL 1,530 26.8 22.3 - 31.3 1,806 30.1 26.3 - 34.0
HIGH SCHOOL 4,044 21.8 19.6 - 24.0 5,700 25.1 23.0 - 27.1
COLLEGE 1–3 YRS 3,706 19.3 17.2 - 21.4 5,205 21.0 19.1 - 23.0
COLLEGE 4+ YRS 6,816 7.0 6.1 - 7.9 9,263 7.2 6.3 - 8.1
HOUSEHOLD INCOME
<$25,000 3,738 25.7 23.1 - 28.2 5,145 29.4 27.0 - 31.7
$25,000–34,999 1,418 18.2 14.9 - 21.4 1,959 19.6 16.4 - 22.8
$35,000–49,999 1,735 18.1 15.1 - 21.2 2,484 19.2 16.4 - 21.9
$50,000–74,999 1,960 13.8 11.3 - 16.4 2,724 19.7 16.8 - 22.6
$75,000+ 4,800 8.7 7.5 - 9.9 6,217 9.9 8.7 - 11.2
REGION
I–WESTERN 2,242 18.0 15.6 - 20.5 2,963 20.8 18.2 - 23.3
II–CENTRAL 2,134 16.3 13.8 - 18.8 2,800 20.3 17.7 - 23.0
III–NORTH EAST 3,756 12.8 10.9 - 14.8 5,096 18.5 16.2 - 20.7
IV–METRO WEST 2,076 8.9 7.3 - 10.6 3,177 12.5 10.6 - 14.4
V–SOUTH EAST 3,983 16.1 14.1 - 18.1 5,316 21.3 19.0 - 23.5VI–BOSTON 1,756 15.5 13.0 - 18.1 2,251 17.5 15.0 - 20.1
* White, Black, and Asian race categories refer to non-Hispanic† Insufficient DataThis table is provided for illustrative purposes only. Data from 2010 and 2011 are not comparable due to changes in methodology
121

TABLE A4: HEAVY DRINKING AMONG MA ADULTS, 2010-2011HEAVY DRINKING
2010 POST-STRATIFIED DATA
(LANDLINE SAMPLE) N % 95% CI
HEAVY DRINKING
2011 “RAKED” DATA
(COMBINED SAMPLE) N % 95% CI
OVERALL 15,179 6.7 6.0 - 7.3 19,786 7.9 7.3 - 8.6
GENDER
MALE 5,671 6.7 5.5 - 7.8 7,498 7.9 6.9 - 9.0
FEMALE 9,508 6.7 5.9 - 7.4 12,288 7.9 7.1 - 8.8
AGE GROUP
18–24 336 11.4 6.2 - 16.7 697 13.0 9.8 - 16.1
25–34 1,280 8.9 6.3 - 11.4 1,938 9.2 7.3 - 11.2
35–44 2,350 6.1 4.8 - 7.4 2,789 7.8 6.2 - 9.4
45–54 3,222 5.9 4.8 - 7.0 4,016 6.7 5.6 - 7.8
55–64 3,348 6.8 5.5 - 8.1 4,399 6.8 5.7 - 7.9
65–74 2,350 6.6 5.1 - 8.1 3,126 7.5 5.9 - 9.1
75 AND OLDER 2,087 3.8 2.6 - 5.0 2,522 3.6 2.6 - 4.6
RACE-ETHNICITY*WHITE 12,486 7.3 6.5 - 8.0 16,073 8.7 7.9 - 9.4
BLACK † 1,188 4.6 2.3 - 6.9
HISPANIC 1,172 5.1 2.8 - 7.5 1,463 5.0 2.8 - 7.2
ASIAN † †
EDUCATION
< HIGH SCHOOL 1,412 3.2 1.6 - 4.9 1,519 6.6 4.2 - 9.1
HIGH SCHOOL 3,735 7.8 6.1 - 9.5 4,940 7.4 6.1 - 8.7
COLLEGE 1–3 YRS 3,499 7.7 6.1 - 9.3 4,706 8.9 7.5 - 10.2
COLLEGE 4+ YRS 6,488 6.1 5.3 - 7.0 8,564 8.1 7.1 - 9.0
HOUSEHOLD INCOME
<$25,000 3,517 3.9 2.8 - 4.9 4,557 7.4 6.0 - 8.9
$25,000–34,999 1,347 4.6 3.1 - 6.1 1,782 7.7 5.5 - 9.8
$35,000–49,999 1,653 7.4 5.3 - 9.5 2,267 7.4 5.7 - 9.1
$50,000–74,999 1,882 8.6 6.4 - 10.8 2,532 9.8 7.6 - 11.9
$75,000+ 4,634 7.9 6.7 - 9.1 5,817 8.6 7.4 - 9.7
REGION
I–WESTERN 2,143 8.8 6.5 - 11.1 2,693 6.9 5.3 - 8.5
II–CENTRAL 2,021 6.9 4.9 - 8.9 2,550 8.7 6.7 - 10.8
III–NORTH EAST 3,563 6.0 4.6 - 7.4 4,547 7.9 6.4 - 9.4
IV–METRO WEST 1,980 5.3 4.1 - 6.4 2,945 7.0 5.6 - 8.4
V–SOUTH EAST 3,751 7.1 5.6 - 8.7 4,816 7.7 6.3 - 9.1VI–BOSTON 1,679 6.7 5.0 - 8.5 2,033 10.2 8.1 - 12.3
* White, Black, and Asian race categories refer to non-Hispanic† Insufficient DataThis table is provided for illustrative purposes only. Data from 2010 and 2011 are not comparable due to changes in methodology
122
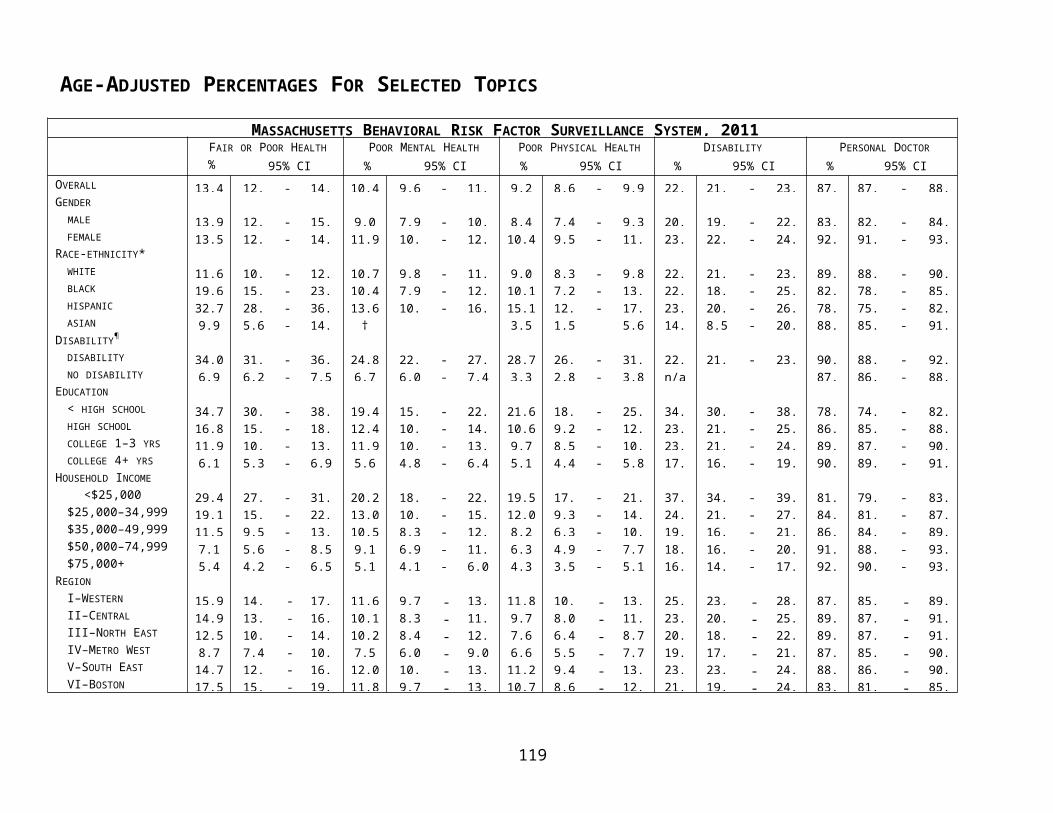
TABLE A5: OVERWEIGHT (BMI >=25.0) AMONG MA ADULTS, 2010-2011OVERWEIGHT (BMI 25.0)
2010 POST-STRATIFIED DATA(LANDLINE SAMPLE)
N % 95% CI
OVERWEIGHT (BMI 25.0)2011 “RAKED” DATA
(COMBINED SAMPLE) N % 95% CI
OVERALL 15088 60.1 58.8 - 61.4 20,532 59.3 58.2 - 60.5
GENDER
MALE 5947 71.1 69.2 - 72.9 8,221 68.2 66.5 - 69.8
FEMALE 9141 49.3 47.7 - 50.9 12,311 50.5 49.0 - 52.0
AGE GROUP
18–24 342 41.1 32.7 - 49.5 743 38.0 33.3 - 42.6
25–34 1263 55.6 51.4 - 59.7 1,975 54.1 50.9 - 57.4
35–44 2318 60.9 58.1 - 63.6 2,886 61.9 59.2 - 64.5
45–54 3218 63.3 60.9 - 65.6 4,181 65.5 63.4 - 67.6
55–64 3307 66.0 63.6 - 68.4 4,490 68.0 65.9 - 70.1
65–74 2350 65.6 62.8 - 68.4 3,232 67.5 65.1 - 69.9
75 AND OLDER 2119 54.4 51.4 - 57.3 2,741 57.8 55.0 - 60.7
RACE-ETHNICITY*WHITE 12407 59.2 57.9 - 60.6 16,593 59.0 57.8 - 60.3
BLACK 724 67.3 61.1 - 73.5 1,292 69.1 64.7 - 73.5
HISPANIC 1150 66.5 61.5 - 71.5 1,524 65.5 61.3 - 69.7
ASIAN 261 51.7 42.8 - 60.7 423 38.2 31.7 - 44.7
EDUCATION
< HIGH SCHOOL 1395 67.8 62.9 - 72.6 1,623 62.7 58.5 - 67.0
HIGH SCHOOL 3742 64.7 62.0 - 67.3 5,314 62.7 60.3 - 65.0
COLLEGE 1–3 YRS 3466 63.6 61.0 - 66.2 4,835 61.2 58.9 - 63.6
COLLEGE 4+ YRS 6449 55.9 54.1 - 57.8 8,708 54.3 52.6 - 55.9
HOUSEHOLD INCOME
<$25,000 3538 65.0 62.1 - 67.9 4,847 59.6 57.1 - 62.1
$25,000–34,999 1342 63.9 59.6 - 68.2 1,853 57.9 53.9 - 61.8
$35,000–49,999 1645 59.7 55.9 - 63.6 2,368 62.1 58.8 - 65.4
$50,000–74,999 1887 64.2 60.7 - 67.7 2,587 63.9 60.8 - 67.1
$75,000+ 4615 58.2 56.1 - 60.3 5,958 58.9 57.0 - 60.8
REGION
I–WESTERN 2105 62.0 58.8 - 65.2 2,791 61.8 58.8 - 64.7
II–CENTRAL 2013 62.6 59.2 - 65.9 2,627 61.7 58.5 - 64.8
III–NORTH EAST 3535 60.3 57.2 - 63.3 4,733 60.0 57.3 - 62.7
IV–METRO WEST 1963 55.6 52.8 - 58.4 3,003 54.0 51.4 - 56.7
V–SOUTH EAST 3727 63.2 60.5 - 65.9 4,988 62.4 59.9 - 64.9VI–BOSTON 1668 58.1 54.6 - 61.7 2,124 56.7 53.4 - 60.1
* White, Black, and Asian race categories refer to non-Hispanic† Insufficient DataThis table is provided for illustrative purposes only. Data from 2010 and 2011 are not comparable due to changes in methodology
123

TABLE A6: OBESITY (BMI>=30.0) AMONG MA ADULTS, 2010-2011OBESE (BMI 30.0)
2010 POST-STRATIFIED DATA
(LANDLINE SAMPLE) N % 95% CI
OBESE (BMI 30.0)2011 “RAKED” DATA
(COMBINED SAMPLE) N % 95% CI
OVERALL 15,088 23.6 22.5 - 24.7 20,532 22.7 21.8 - 23.7
GENDER
MALE 5,947 26.1 24.3 - 27.8 8,221 24.1 22.6 - 25.5
FEMALE 9,141 21.1 19.9 - 22.4 12,311 21.4 20.2 - 22.6
AGE GROUP
18–24 342 9.5 4.7 - 14.4 743 13.0 9.9 - 16.2
25–34 1,263 23.7 20.2 - 27.3 1,975 18.6 16.2 - 21.1
35–44 2,318 24.5 22.0 - 26.9 2,886 25.0 22.6 - 27.5
45–54 3,218 25.7 23.5 - 27.9 4,181 26.3 24.2 - 28.4
55–64 3,307 25.2 23.0 - 27.3 4,490 28.9 26.8 - 31.0
65–74 2,350 28.1 25.6 - 30.7 3,232 26.8 24.3 - 29.2
75 AND OLDER 2,119 17.4 15.2 - 19.6 2,741 18.4 16.0 - 20.8
RACE-ETHNICITY*
124

WHITE 12,407 22.9 21.8 - 24.1 16,593 22.1 21.1 - 23.1
BLACK 724 31.3 25.7 - 36.8 1,292 31.6 27.2 - 36.0
HISPANIC 1,150 31.8 26.9 - 36.7 1,524 30.9 26.9 - 34.9
ASIAN 261 14.4 8.3 - 20.5 423 4.9 2.3 - 7.5
EDUCATION
< HIGH SCHOOL 1,395 31.0 26.4 - 35.6 1,623 31.1 27.3 - 34.8
HIGH SCHOOL 3,742 28.0 25.5 - 30.5 5,314 25.2 23.2 - 27.2
COLLEGE 1–3 YRS 3,466 28.0 25.7 - 30.3 4,835 24.1 22.2 - 26.0
COLLEGE 4+ YRS 6,449 19.0 17.5 - 20.4 8,708 17.3 16.1 - 18.5
HOUSEHOLD INCOME
<$25,000 3,538 27.5 24.9 - 30.1 4,847 27.3 25.0 - 29.5
$25,000–34,999 1,342 23.3 19.7 - 26.8 1,853 22.9 19.9 - 25.9
$35,000–49,999 1,645 25.7 22.3 - 29.0 2,368 25.4 22.5 - 28.3
$50,000–74,999 1,887 27.5 24.3 - 30.8 2,587 24.6 21.8 - 27.3
$75,000+ 4,615 21.5 19.8 - 23.2 5,958 19.3 17.9 - 20.8
REGION
I–WESTERN 2,105 24.9 22.1 - 27.7 2,791 26.1 23.6 - 28.6
II–CENTRAL 2,013 27.6 24.5 - 30.7 2,627 23.1 20.5 - 25.6
III–NORTH EAST 3,535 24.3 21.8 - 26.9 4,733 22.7 20.4 - 25.0
IV–METRO WEST 1,963 19.6 17.3 - 21.9 3,003 17.6 15.7 - 19.5
V–SOUTH EAST 3,727 23.8 21.5 - 26.1 4,988 25.8 23.5 - 28.0VI–BOSTON 1,668 23.5 20.5 - 26.5 2,124 22.1 19.4 - 24.7
* White, Black, and Asian race categories refer to non-Hispanic† Insufficient DataThis table is provided for illustrative purposes only. Data from 2010 and 2011 are not comparable due to changes in methodology
TABLE A7: ANY LEISURE-TIME PHYSICAL ACTIVITY AMONG MA ADULTS, 2010-2011
ANY LEISURE TIME PHYSICAL ACTIVITY
2010 POST-STRATIFIED DATA
(LANDLINE SAMPLE) N % 95% CI
ANY LEISURE TIME PHYSICAL ACTIVITY
2011 “RAKED” DATA
(COMBINED SAMPLE) N % 95% CI
OVERALL 16,282 79.4 78.4 - 80.4 20,634 76.5 75.5 - 77.4
GENDER
MALE 6,118 81.8 80.3 - 83.3 7,854 77.9 76.4 - 79.3
FEMALE 10,164 77.2 75.9 - 78.5 12,780 75.2 73.9 - 76.5
AGE GROUP
18–24 365 85.4 79.6 - 91.2 747 83.8 80.5 - 87.2
25–34 1,361 83.6 80.7 - 86.5 2,017 78.0 75.1 - 80.8
35–44 2,497 81.1 79.0 - 83.2 2,900 79.3 76.9 - 81.7
45–54 3,423 82.0 80.2 - 83.8 4,176 77.7 75.7 - 79.7
55–64 3,587 77.6 75.5 - 79.6 4,553 73.9 71.8 - 75.9
65–74 2,514 75.5 73.1 - 77.9 3,249 72.3 69.9 - 74.7
75 AND OLDER 2,259 65.0 62.3 - 67.7 2,661 63.7 60.8 - 66.6
125

RACE-ETHNICITY*WHITE 13,330 81.3 80.3 - 82.2 16,701 78.1 77.0 - 79.1
BLACK 794 74.1 69.1 - 79.2 1,260 74.2 70.5 - 77.9
HISPANIC 1,253 66.7 62.2 - 71.3 1,548 65.0 61.0 - 69.1
ASIAN 278 78.4 71.5 - 85.3 416 79.6 74.4 - 84.8
EDUCATION
< HIGH SCHOOL 1,536 56.8 51.9 - 61.7 1,625 60.8 56.8 - 64.9
HIGH SCHOOL 4,049 69.2 66.8 - 71.6 5,213 68.6 66.5 - 70.7
COLLEGE 1–3 YRS 3,722 77.6 75.5 - 79.6 4,898 78.3 76.5 - 80.1
COLLEGE 4+ YRS 6,851 87.5 86.3 - 88.6 8,833 85.7 84.5 - 86.8
HOUSEHOLD INCOME
<$25,000 3,752 63.9 61.2 - 66.7 4,780 66.4 64.1 - 68.8
$25,000–34,999 1,418 71.0 67.3 - 74.7 1,853 71.8 68.3 - 75.2
$35,000–49,999 1,740 73.9 70.4 - 77.3 2,358 77.0 74.3 - 79.8
$50,000–74,999 1,964 82.4 79.8 - 84.9 2,610 76.1 73.3 - 78.9
$75,000+ 4,812 88.6 87.4 - 89.9 5,980 86.0 84.5 - 87.4
REGION
I–WESTERN 2,248 77.8 75.3 - 80.2 2,797 74.8 72.3 - 77.2
II–CENTRAL 2,137 79.0 76.5 - 81.4 2,665 75.4 72.7 78.0
III–NORTH EAST 3,768 77.6 75.1 - 80.1 4,777 74.7 72.4 77.1
IV–METRO WEST 2,088 84.8 82.8 - 86.9 3,037 81.6 79.5 83.7
V–SOUTH EAST 4,000 78.0 75.9 - 80.2 5,031 73.7 71.5 76.0VI–BOSTON 1,769 75.4 72.4 - 78.5 2,116 77.4 74.7 80.1
* White, Black, and Asian race categories refer to non-Hispanic† Insufficient DataThis table is provided for illustrative purposes only. Data from 2010 and 2011 are not comparable due to changes in methodology
TABLE A8: DIABETES AMONG MA ADULTS, 2010-2011DIABETES
2010 POST-STRATIFIED DATA
(LANDLINE SAMPLE) N % 95% CI
DIABETES
2011 “RAKED” DATA
(COMBINED SAMPLE) N % 95% CI
OVERALL 16,287 7.4 6.9 - 8.0 22,292 8.0 7.5 - 8.5
GENDER
MALE 6,118 7.9 7.1 - 8.8 8,465 8.5 7.7 - 9.3
FEMALE 10,169 7.0 6.3 - 7.6 13,827 7.6 6.9 - 8.2
AGE GROUP
18–24 † †
25–34 † 2,188 2.0 1.2 - 2.7
35–44 2,498 3.0 2.1 - 3.8 3,145 4.2 2.9 - 5.4
45–54 3,429 6.4 5.3 - 7.4 4,472 6.6 5.5 - 7.7
55–64 3,587 12.6 11.0 - 14.1 4,851 14.1 12.6 - 15.6
65–74 2,511 18.9 16.7 - 21.0 3,461 18.2 16.2 - 20.2
75 AND OLDER 2,262 16.3 14.3 - 18.4 2,963 18.9 16.6 - 21.2126
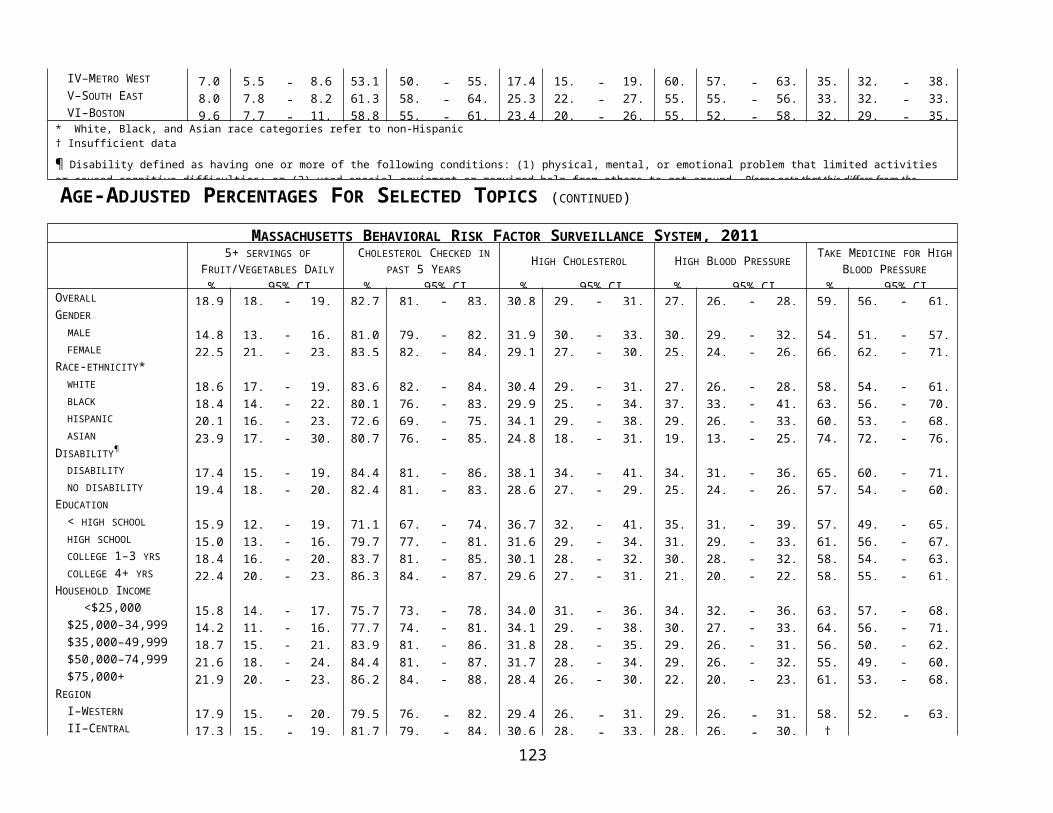
RACE-ETHNICITY*WHITE 13,335 7.2 6.6 - 7.8 17,905 7.6 7.1 - 8.2
BLACK 794 10.9 8.3 - 13.6 1,407 11.6 9.0 - 14.2
HISPANIC 1,252 10.6 8.0 - 13.3 1,719 10.5 8.3 - 12.8
ASIAN † 461 4.1 2.1 - 6.2
EDUCATION
< HIGH SCHOOL 1,538 16.2 13.4 - 19.1 1,814 13.9 11.5 - 16.3
HIGH SCHOOL 4,055 10.4 9.0 - 11.7 5,738 9.3 8.3 - 10.4
COLLEGE 1–3 YRS 3,719 8.0 6.9 - 9.2 5,234 7.8 6.8 - 8.7
COLLEGE 4+ YRS 6,851 4.8 4.2 - 5.5 9,331 5.3 4.7 - 5.9
HOUSEHOLD INCOME
<$25,000 3,759 15.6 13.7 - 17.4 5,159 12.1 10.7 - 13.5
$25,000–34,999 1,416 10.6 8.2 - 12.9 1,965 10.5 8.5 - 12.5
$35,000–49,999 1,739 9.0 7.1 - 10.9 2,500 8.2 6.6 - 9.9
$50,000–74,999 1,967 6.6 5.2 - 8.0 2,743 6.9 5.7 - 8.2
$75,000+ 4,813 3.7 3.1 - 4.3 6,256 4.8 4.0 - 5.5
REGION
I–WESTERN 2,254 8.6 7.1 - 10.0 2,979 8.9 7.5 - 10.2
II–CENTRAL 2,139 8.2 6.6 - 9.8 2,819 7.6 6.3 - 8.9
III–NORTH EAST 3,770 6.7 5.7 - 7.8 5,120 8.3 7.1 - 9.4
IV–METRO WEST 2,088 5.7 4.6 - 6.8 3,202 6.6 5.5 - 7.7
V–SOUTH EAST 3,995 8.1 7.0 - 9.2 5,353 9.5 8.1 - 10.8VI–BOSTON 1,769 9.2 7.4 - 11.0 2,263 7.6 6.3 - 8.9
* White, Black, and Asian race categories refer to non-Hispanic† Insufficient DataThis table is provided for illustrative purposes only. Data from 2010 and 2011 are not comparable due to changes in methodology
TABLE A9: CURRENT ASTHMA AMONG MA ADULTS, 2010-2011CURRENTLY HAVE ASTHMA
2010 POST-STRATIFIED DATA
(LANDLINE SAMPLE) N % 95% CI
CURRENTLY HAVE ASTHMA
2011 “RAKED” DATA
COMBINED SAMPLE) N % 95% CI
OVERALL 16,215 10.4 9.6 - 11.1 22,192 10.7 10.0 - 11.4
GENDER
MALE 6,092 7.6 6.6 - 8.6 8,425 7.9 6.9 - 8.9
FEMALE 10,123 12.9 11.8 - 13.9 13,767 13.3 12.3 - 14.3
AGE GROUP
18–24 359 12.3 6.9 - 17.6 799 13.8 10.5 - 17.1
25–34 1,355 13.4 10.8 - 15.9 2,178 11.1 9.0 - 13.3
35–44 2,491 9.9 8.3 - 11.5 3,135 11.7 10.1 - 13.4
45–54 3,421 10.0 8.7 - 11.3 4,462 10.5 9.1 - 11.9
55–64 3,568 9.7 8.3 - 11.1 4,817 9.8 8.6 - 11.0
65–74 2,492 9.5 7.9 - 11.0 3,450 11.0 9.3 - 12.7
75 AND OLDER 2,254 9.3 7.5 - 11.1 2,946 5.4 4.2 - 6.6
RACE-ETHNICITY*127

WHITE 13,276 10.4 9.6 - 11.2 17,820 10.6 9.8 - 11.4
BLACK 791 11.7 7.8 - 15.5 1,398 9.7 7.2 - 12.3
HISPANIC 1,248 12.9 10.0 - 15.9 1,715 15.1 12.0 - 18.3
ASIAN † †
EDUCATION
< HIGH SCHOOL 1,530 18.2 14.3 - 22.2 1,808 15.0 12.3 - 17.6
HIGH SCHOOL 4,032 10.0 8.5 - 11.6 5,706 11.0 9.5 - 12.5
COLLEGE 1–3 YRS 3,704 11.0 9.5 - 12.6 5,216 10.5 9.0 - 11.9
COLLEGE 4+ YRS 6,826 9.4 8.4 - 10.4 9,287 9.3 8.3 - 10.2
HOUSEHOLD INCOME
<$25,000 3,731 16.8 14.7 - 19.0 5,143 15.7 13.8 - 17.6
$25,000–34,999 1,416 9.4 7.1 - 11.7 1,954 8.9 7.0 - 10.8
$35,000–49,999 1,734 9.1 7.0 - 11.2 2,490 10.1 8.0 - 12.3
$50,000–74,999 1,963 9.2 7.3 - 11.2 2,731 9.3 7.5 - 11.1
$75,000+ 4,793 8.6 7.5 - 9.8 6,229 8.1 7.1 - 9.2
REGION
I–WESTERN 2,244 12.0 10.0 - 14.1 2,962 14.1 12.0 - 16.2
II–CENTRAL 2,133 11.6 9.4 - 13.9 2,802 10.3 8.3 - 12.2
III–NORTH EAST 3,752 10.1 8.5 - 11.7 5,106 10.6 9.0 - 12.2
IV–METRO WEST 2,076 8.3 6.9 - 9.8 3,191 9.2 7.6 - 10.8
V–SOUTH EAST 3,978 10.9 9.2 - 12.6 5,322 10.7 9.1 - 12.3VI–BOSTON 1,761 11.4 9.1 - 13.8 2,256 10.4 8.4 - 12.4
* White, Black, and Asian race categories refer to non-Hispanic† Insufficient DataThis table is provided for illustrative purposes only. Data from 2010 and 2011 are not comparable due to changes in methodology
TABLE A10: FLU VACCINE IN PAST YEAR AMONG MA ADULTS AGES 65 AND OLDER, 2010-2011
FLU VACCINE IN PAST YEAR, AGES 65+2010 POST-STRATIFIED DATA
(LANDLINE SAMPLE) N % 95% CI
FLU VACCINE IN PAST YEAR, AGES 65+2011 “RAKED” DATA
(COMBINED SAMPLE) N % 95% CI
OVERALL 4478 72.8 70.9 - 74.6 5,741 66.9 65.0 - 68.7
GENDER
MALE 1541 73.5 70.4 - 76.6 1,997 68.2 65.0 - 71.4
FEMALE 2937 72.3 70.0 - 74.6 3,744 65.9 63.6 - 68.2
AGE GROUP
65–74 2368 70.2 67.5 - 72.8 3,178 63.1 60.5 - 65.7
75 AND OLDER 2110 75.5 73.0 - 78.0 2,563 71.1 68.4 - 73.8
RACE-ETHNICITY*WHITE 3953 73.5 71.6 - 75.4 5,120 68.4 66.5 - 70.3
BLACK 149 63.8 52.1 - 75.5 234 47.2 36.8 - 57.6
HISPANIC 183 76.2 68.3 - 84.2 223 60.8 48.1 - 73.5
ASIAN † †
128
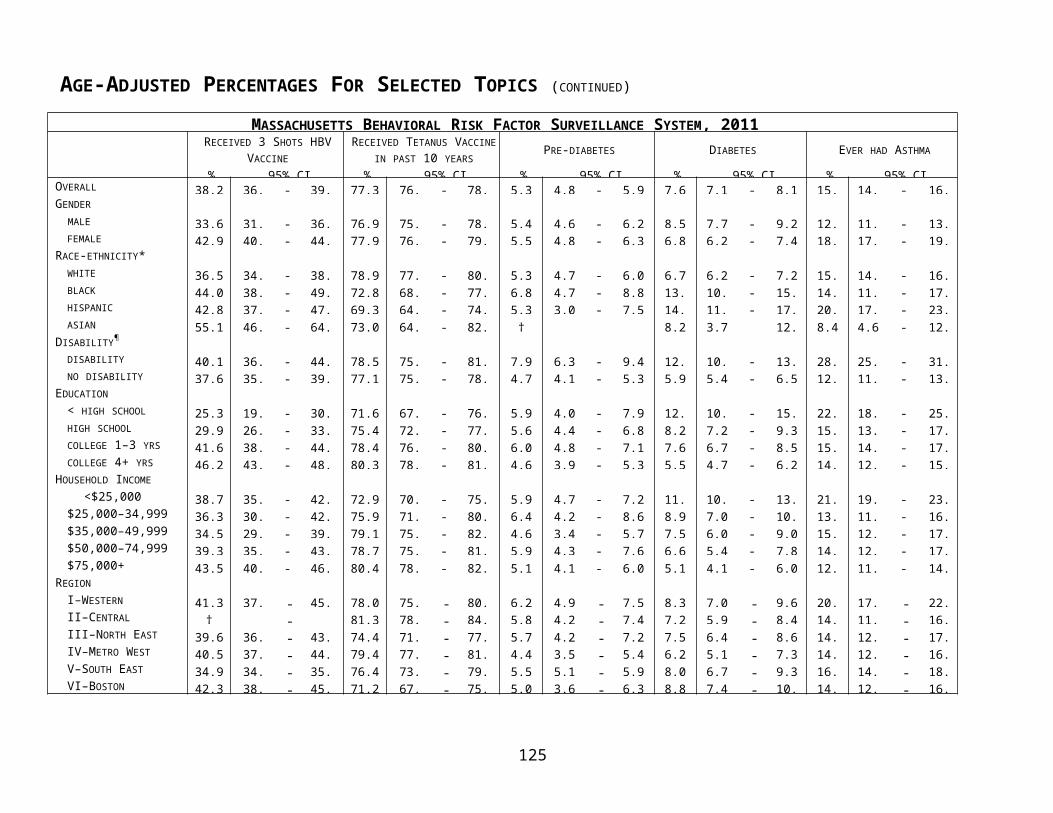
EDUCATION
< HIGH SCHOOL 642 70.5 64.3 - 76.7 648 62.3 56.0 - 68.7
HIGH SCHOOL 1448 68.3 64.7 - 71.8 1,820 66.4 63.0 - 69.8
COLLEGE 1–3 YRS 937 75.6 71.9 - 79.3 1,357 65.9 62.2 - 69.6
COLLEGE 4+ YRS 1433 75.4 72.5 - 78.4 1,895 71.3 68.5 - 74.1
HOUSEHOLD INCOME
<$25,000 1490 69.0 65.3 - 72.6 1,752 64.5 60.8 - 68.1
$25,000–34,999 572 75.8 70.8 - 80.9 746 62.9 57.6 - 68.3
$35,000–49,999 527 73.3 68.0 - 78.6 763 64.8 59.6 - 70.1
$50,000–74,999 380 74.3 68.6 - 80.1 577 68.7 62.8 - 74.6
$75,000+ 540 76.3 71.7 - 80.8 697 72.3 67.7 - 76.9
REGION
I–WESTERN 652 71.6 67.0 - 76.3 785 69.6 64.7 - 74.5
II–CENTRAL 558 72.9 68.0 - 77.8 686 65.3 59.8 - 70.9
III–NORTH EAST 983 71.8 67.3 - 76.3 1,344 66.1 61.8 - 70.4
IV–METRO WEST 594 78.5 74.9 - 82.2 840 72.0 68.1 - 75.9
V–SOUTH EAST 1222 70.0 65.9 - 74.2 1,589 63.3 59.4 - 67.2VI–BOSTON 461 67.6 62.0 - 73.2 491 63.5 57.6 - 69.4
* White, Black, and Asian race categories refer to non-Hispanic† Insufficient DataThis table is provided for illustrative purposes only. Data from 2010 and 2011 are not comparable due to changes in methodology
TABLE A11: SEATBELT USE AMONG MA ADULTS, 2010-2011ALWAYS USE A SEATBELT
2010 POST-STRATIFIED DATA
(LANDLINE SAMPLE) N % 95% CI
ALWAYS USE A SEATBELT
2011 “RAKED” DATA
(COMBINED SAMPLE) N % 95% CI
OVERALL 15,180 82.7 81.7 - 83.7 20,061 79.7 78.7 - 80.8
GENDER
MALE 5,674 76.6 74.9 - 78.3 7,622 74.2 72.5 - 75.8
FEMALE 9,506 88.1 87.1 - 89.2 12,439 84.9 83.7 - 86.1
AGE GROUP
18–24 339 70.5 62.5 - 78.4 727 69.5 65.0 - 73.9
25–34 1,273 81.4 78.3 - 84.5 1,968 75.7 72.7 - 78.7
35–44 2,338 83.1 81.0 - 85.2 2,839 80.5 78.1 - 82.9
45–54 3,232 84.4 82.6 - 86.3 4,071 81.9 80.0 - 83.9
55–64 3,370 83.7 81.9 - 85.5 4,443 83.5 81.8 - 85.3
65–74 2,338 81.0 78.6 - 83.5 3,156 83.8 81.7 - 85.9
75 AND OLDER 2,062 85.1 82.9 - 87.3 2,544 84.4 82.1 - 86.8
RACE-ETHNICITY*WHITE 12,515 82.8 81.7 - 83.9 16,288 79.9 78.8 - 81.0
BLACK 712 75.0 69.4 - 80.6 1,204 74.5 70.1 - 78.9
129

HISPANIC 1,135 84.1 80.4 - 87.8 1,484 78.7 75.0 - 82.4
ASIAN 261 93.3 89.5 - 97.1 401 89.6 85.1 - 94.1
EDUCATION
< HIGH SCHOOL 1,380 72.4 67.4 - 77.5 1,528 73.1 69.1 - 77.0
HIGH SCHOOL 3,711 76.0 73.5 - 78.5 5,020 73.1 70.8 - 75.3
COLLEGE 1–3 YRS 3,499 79.4 77.2 - 81.6 4,782 78.1 76.1 - 80.2
COLLEGE 4+ YRS 6,540 88.0 86.8 - 89.2 8,669 87.7 86.5 - 88.9
HOUSEHOLD INCOME
<$25,000 3,452 76.5 73.9 - 79.2 4,600 74.2 71.8 - 76.6
$25,000–34,999 1,343 79.6 75.9 - 83.3 1,797 77.4 73.9 - 80.9
$35,000–49,999 1,648 79.6 76.4 - 82.8 2,313 75.9 72.8 - 79.0
$50,000–74,999 1,883 80.1 77.0 - 83.3 2,564 79.3 76.1 - 82.4
$75,000+ 4,642 86.0 84.5 - 87.5 5,891 84.8 83.2 - 86.4
REGION
I–WESTERN 2,147 82.0 79.4 - 84.6 2,733 78.9 76.4 - 81.5
II–CENTRAL 2,031 80.3 77.4 - 83.3 2,591 79.6 76.8 - 82.4
III–NORTH EAST 3,545 81.3 78.9 - 83.7 4,627 79.6 77.2 - 82.0
IV–METRO WEST 1,996 88.0 86.2 - 89.8 2,974 82.3 79.9 - 84.6
V–SOUTH EAST 3,754 81.4 79.3 - 83.6 4,893 76.9 74.6 - 79.3VI–BOSTON 1,664 78.2 74.9 - 81.5 2,036 81.6 78.9 - 84.3
* White, Black, and Asian race categories refer to non-Hispanic† Insufficient DataThis table is provided for illustrative purposes only. Data from 2010 and 2011 are not comparable due to changes in methodology
130

LIMITATIONS
There are some limitations that should be considered when interpreting results from the BRFSS, based on the nature of the survey data:
The health characteristics estimated from the BRFSS pertain to the adult population, aged 18 years and older, who live in households with either a landline telephone or a cell phone.
As noted above, respondents are identified through telephone-based methods. Telephone penetration in the United States is estimated at 96.7%; in Massachusetts,
telephone penetration is estimated at 98.3%, meaning that only 1.7% of households do not have any telephone service.58
Telephone coverage varies across population subgroups: minorities and those in lower socioeconomic groups typically have lower telephone coverage. No direct method of compensating for non-telephone coverage is employed by the BRFSS; however, weighted data are used, which may partially correct for any bias caused by non-telephone coverage. Weighting is designed to make the total number of cases equal to some desired number which, for MA BRFSS data, is the number of people in the state who are aged 18 years and older. In the BRFSS, such weighting serves as a blanket adjustment for non-coverage and non-response and forces the total number of cases to equal population estimates.
Evidence of acceptable performance on surveys is measured by the following quality assurance indicators: CASRO or other response rate, refusal rate, refusal conversion, and timeliness of providing data. A high response rate indicates low potential bias. CASRO response rate is a main indicator of survey quality. The CASRO rate is a measure of respondent cooperation and is generally defined as the proportion of all eligible respondents in the sample for whom an interview has been completed. In 2011, the MA BRFSS had an average CASRO rate of 49%, which is higher than the required BRFSS standard of 40%.
All data collected by the BRFSS are based on self-report from the respondents. By its nature, self-reported data may be subject to error for several reasons. An individual may have difficulty remembering events that occurred a long time ago or the frequency of certain behaviors. Some respondents may over report socially desirable behaviors, while underreporting behaviors they perceive to be less acceptable. Finally, because the BRFSS surveys a randomly selected sample of Massachusetts adults, these results may differ from another random sample to some extent simply due to chance.
Persons with the most severe limitations and with certain disabilities are not represented in this sample since individuals living in institutions are not included in the BRFSS. BRFSS methodology also precludes anyone from assisting respondents in completing the interview if the selected adult had difficulty in participating for any reason, such as an intellectual or developmental disability.
58 Belinfante, A. (February 2010). Telephone subscribership in the United States: Data though March 2010. Federal Communications Commission. Retrieved on June 19,2012 from http://hraunfoss.fcc.gov/edocs_public/attachmatch/DOC-301241A1.pdf
131

REFERENCES
37 Centers for Disease Control and Prevention. (updated May 5, 2009). Basic Facts About Asthma. Retrieved on May 29, 2009, from http://www.cdc.gov/asthma/faqs.htm38 National Heart Lung and Blood Institute. (2011). Diseases and conditions index: Asthma. Retrieved on March 14, 2011 from http://www.nhlbi.nih.gov/health/dci/Diseases/Asthma/Asthma_WhatIs.html39 Massachusetts Department of Public Health, Asthma Prevention and Control Program. (April 2009). Burden of Asthma in Massachusetts. Retrieved on May 28, 2009, from http://www.mass.gov/Eeohhs2/docs/dph/com_health/asthma/burden_in_mass.pdf41 Centers for Disease Control and Prevention, Chronic Disease Prevention and Health Promotion. (2011). Heart Disease and Stroke: Addressing The Nation's Leading Killers: At A Glance 2010. Retrieved on March 15, 2011 from http://www.cdc.gov/chronicdisease/resources/publications/AAG/dhdsp.htm53 Massachusetts Department of Public Health, Injury Surveillance Program. (2011). Injury-Related Hospital Discharges, 2009. Retrieved on June 19, 2012 from http://www.mass.gov/eohhs/docs/dph/injury-surveillance/ma-resident-hosp-discharge-summary09.pdf54 Massachusetts Department of Public Health, Injury Surveillance Program. (2011). Injury-Related Outpatient Observation Stays, 2009. Retrieved on June 19, 2012 fromhttp://www.mass.gov/eohhs/docs/dph/injury-surveillance/ma-residents-outpatient-summary-09.pdf55 Massachusetts Department of Public Health, Injury Surveillance Program. (2011). Injury-Related Emergency Department Visits, 2009. Retrieved on June 19, 2012 fromhttp://www.mass.gov/eohhs/docs/dph/injury-surveillance/ma-residents-emergency-visits-summary-09.pdf56 Blincoe, L., et al. (2002). The Economic Impact of Motor Vehicle Crashes. Sponsored by the U.S. Department of Transportation, National Highway Traffic Safety Administration, Washington, D.C
132