a profile of health among lawrence/lowell adults, … profile of health among lawrence ... the...
TRANSCRIPT

A PROFILE OF HEALTH AMONGLAWRENCE/LOWELL ADULTS,
1997 – 1999
Results from the Massachusetts Behavioral Risk Factor Surveillance System
HEALTH SURVEY PROGRAMBUREAU OF HEALTH STATISTICS, RESEARCH AND EVALUATION
MASSACHUSETTS DEPARTMENT OF PUBLIC HEALTH
M A R C H 2 0 0 2

2

Massachusetts Department of Public Health
Health Survey ProgramBureau of Health Statistics, Research, and Evaluation
A Profile of Health Among Lawrence/Lowell Adults, 1997 - 1999
R e s u l t s f r o m t h e B e h a v i o r a l R i s k F a c t o r S u r v e i l l a n c e S y s t e m
Jane Swift ? GovernorRobert P. Gittens ? Secretary of Health and Human Services
Howard K. Koh, MD, MPH ? Commissioner, Department of Public HealthDeborah Klein Walker, EdD ? Associate Commissioner for Programs and Prevention
Bureau of Health Statistics, Research and EvaluationDaniel J. Friedman, PhD ? Assistant Commissioner
Bruce B. Cohen, PhD ? Director, Research and EpidemiologyZi Zhang, MB, MPH ? Director, Health Survey Program
March 2002
3

4

TABLE OF CONTENTS
Page
HIGHLIGHTS 1
RESULTS SUMMARY TABLE 3
INTRODUCTION What is the BRFSS? 5About this Report 5BRFSS Methodology 6Demographic Profile of BRFSS Survey Respondents 9
RESULTS I. OVERALL HEALTH MEASURES
Section 1: Overall Health Status 10Section 2: Quality of Life 12
II. ACCESS AND UTILIZATIONSection 3: Health Access and Utilization 14Section 4: Dental Health 16
III. RISK FACTORSSection 5: Tobacco Use 18Section 6: Environmental Tobacco 20Section 7: Alcohol Use 22Section 8: Weight Control 24
IV. PREVENTIVE BEHAVIORSSection 9: High Blood Pressure Awareness 26Section 10: Cholesterol Awareness 28Section 11: Colorectal Cancer Screening 30
V. HEALTH CONDITIONSSection 12: Chronic Disease 32Section 13: Disability and Limitations 34
VI. WOMEN’S HEALTHSection 14: Breast Cancer Screening 36Section 15: Cervical Cancer Screening 38
VII. ADDITIONAL TOPICSSection 16: Intimate Partner Abuse 40Section 17: HIV / AIDS Risk and Testing 42
APPENDIX Glossary 44Key Links 45Acknowledgements 45
5

6
H I G H L I G H T S
This report summarizes selected results from 1,149 Lawrence/Lowell respondents participating in the 1997, 1998, and 1999 Massachusetts BRFSS. The following represent selected areas of interest for Lawrence/ Lowell, as it compares to the state-wide average and results from previous years.
Lawrence/Lowell was doing about the same as the state overall with regard to the following health risks and behaviors:
� adults with heart disease� adults with high blood pressure� binge drinking in the past month� adults with disability or limitation� ever tested for HIV, adults ages 18 to 64
Lawrence/Lowell was not doing as well as the state overall with regard to the following health risks and behaviors:
� fair or poor overall health� adults with no health insurance� current smoking� adults with diabetes� dental visit in the past year
Lawrence/Lowell has improved since 1994-1996 with regard to the following health risks and behaviors:
� Pap smear in the past three years, among all women� support for smoke-free restaurants� live in a household where smoking was not allowed
1

2

3

4
SUMMARY OF BEHAVIORAL RISK FACTOR SURVEILLANCE SYSTEM RESULTS: LAWRENCE/LOWELL, 1997 - 1999
Year1 1997 – 1999 Lawrence/
Lowell
1997 – 1999 Massachusetts
1997 – 1999 U.S.
OVERALL HEALTH MEASURES Fair/Poor Health 97, 98, 99 20.3 11.2 13.0 15+ Days Poor Mental Health 97, 98, 99 9.2 8.0 15+ Days Activities Limited 97, 98, 99 6.2 4.9 15+ Days Depressed 98, 99 8.6 6.3 15+ Days Pain 98, 99 10.6 7.0 15+ Days Full of Energy 98, 99 69.6 72.0
ACCESS AND UTILIZATION No Health Insurance 97, 98, 99 10.2 6.4 Did Not See a Doctor Due to Cost 97, 98, 99 15.0 7.6 9.6 Dental Visit in Past Year 98, 99 65.5 76.8 6+ Teeth Missing Due to Decay 98, 99 19.7 17.8
RISK FACTORS Current Smoker 97, 98, 99 26.9 20.6 22.9 Heavy Smoker 97, 98, 99 4.4 3.5 Made Quit Attempt < 1 Year 97, 98, 99 51.6 59.8 49.2 Support Smoke-Free Restaurants 97, 98, 99 57.5 55.2 Do Not Allow Smoking At Home 97, 98, 99 51.3 59.3 5+ Drinks on One Occasion Past Month 97, 99 15.4 17.7 14.7 60+ Drinks Past Month 97, 99 3.5 4.2 3.3 Driving Under the Influence 97, 99 3.2 2.7 4.3 Overweight (HP 2010) 97, 98, 99 53.3 49.1 Very Overweight (HP 2010) 97, 98, 99 14.6 13.9
PREVENTIVE BEHAVIORS Blood Pressure Checked Past 2 Years 97, 99 96.0 95.9 94.5 Ever Told Had High Blood Pressure 97, 99 21.9 20.7 23.5 Had Blood Cholesterol Checked Past 5 Years 97, 99 71.2 76.1 69.2 Ever Told Had High Cholesterol 97, 99 33.1 27.0 29.4 Blood Stool Test Ever, Age 50+ 97, 99 34.9 43.5 30.7 Blood Stool Test Past 2 Years, Age 50+ 97, 99 26.8 34.1 25.1 Sigmoidoscopy/Proctoscopy < 5 years, Age 50+ 97, 99 29.4 33.9
1 Survey years in which health topics were included

5
SUMMARY OF BEHAVIORAL RISK FACTOR SURVEILLANCE SYSTEM RESULTS: LAWRENCE/LOWELL, 1997 – 1999
Year 1997 – 1999
Lawrence/Low ell
1997 – 1999 Massachusetts
1997 – 1999 U.S.
HEALTH CONDITIONS Diabetes 97, 98, 99 7.0 4.4 5.2 Heart Disease 97, 98 6.2 6.2 Osteoporosis, Women Age 45+ 97, 98 14.6 11.4 With Disability or Limitation 97, 98, 99 18.8 16.4 With Disability or Limitation AND Need Help With Activities
97, 98, 99 7.2 4.8
WOMEN’S HEALTH Mammogram Ever, Age 40+ 97, 98, 99 85.7 90.5 84.7 Mammogram Past 2 Years, Age 50+ 97, 98, 99 74.4 82.8 75.2 Clinical Breast Exam Past 2 Years 97, 98, 99 72.6 82.8 76.9 Pap Smear Ever 97, 98, 99 90.6 93.5 94.9 Pap Smear Past 3 Years 97, 98, 99 84.3 87.8 85.1 Intimate Partner Abuse, Past 12 Months, Women Ages 18-59
98, 99 3.2 5.5
HIV / AIDS, ADULTS AGE 18 TO 64 High / Medium Risk of Infection 97, 98, 99 11.8 7.3 6.3 Ever Tested for HIV 97, 98, 99 43.5 43.6 Tested for HIV Past Year 97, 98, 99 15.4 13.3
(CONTINUED)

I N T R O D U C T I O N
W H A T I S T H E B R F S S?
The BRFSS collects data on a variety of health characteristics, risk factors for chronic
conditions, and preventive behaviors.
The Behavioral Risk Factor Surveillance System (BRFSS) is a continuous, random-digit-dial, telephone survey of adults age 18 and older, and is conducted in all states as a joint collaboration between the U.S. Centers for Disease Control and Prevention (CDC) and state departments of health. The survey has been in the field in Massachusetts since 1986. The BRFSS collects data on a variety of health characteristics, risk factors for chronic conditions, and preventive behaviors. The information obtained in this
survey assists in identifying the need for health interventions, monitoring the effectiveness of existing intervention and prevention programs, developing health policy and legislation, and measuring progress toward attaining state and national health objectives.
A B O U T T H I S R E P O R T
This report summarizes selected results from 1,149 Lawrence/Lowell respondents participating in the1997, 1998, and 1999 Massachusetts BRFSS. For each topic, we first present overall percentage estimatesof key variables followed by percentage estimates in specific demographic groups. This section allows usto assess whether there are specific groups of adults who are at risk for chronic conditions or who are morelikely to participate in healthy behaviors. It is important to note that these data are not adjusted for age orother differences across these characteristics; for example, adults of lower income may be more likely toreport fair or poor health. However, age is a strong predictor of health status, and adults of lower incomeare more likely to be older. Therefore, some of the differences in health status are actually due todifferences in age.
Following the core section, we compare the 1997 to 1999 results in Lawrence/Lowell to those of Boston,Springfield, Worcester, and Fall River/New Bedford. The estimates for Lawrence/Lowell are also comparedwith the state-wide average. Additionally, wherever possible, wecompare Lawrence/Lowell’s estimates to the goals and objectives setby Healthy People 2010*, as well as the U.S. median* estimate for1997 to 1999. For national comparisons, we provide the medianpercentage for all fifty states, the District of Columbia, and PuertoRico. In cases where there are only U.S. estimates for two of the threeyears, the mean of those two values serve as the U.S. estimate forcomparison purposes. If none or only one value was available for the three year span, the correspondingU.S. estimate for that variable has been omitted. Following the city to city comparisons, wherever available,we provide a comparison to the 1994-1996 Lawrence/Lowell estimate, as reported in the BRFSS report forthose years. The full-text version of the 1994-1996 Lawrence/Lowell report is currently available on ourwebsite, at http://www.state.ma.us/dph/bhsre/CDSP/brfss/Brfss.htm.
This report provides estimates for 1997 to 1999 data, compares Lawrence/Lowell with other
selected cities, Massachusetts estimates, U.S. data and Healthy
People 2010 Objectives.
* see glossary 6
Due to a limited number of respondents, certain demographic characteristics have required consolidating strata or groups in order to provide more accurate estimates and reduce variability. For example the race/ ethnicity groups have been divided into two groups in all cases (white non-Hispanic, all other); we also report the more specific groupings of Black non-Hispanic, Hispanic, and other ethnicity, whenever the data could support these subcategories. Additionally, for certain variables, age groupings were consolidated to reflect the current screening recommendations, e.g. Pap smear in the past three years.
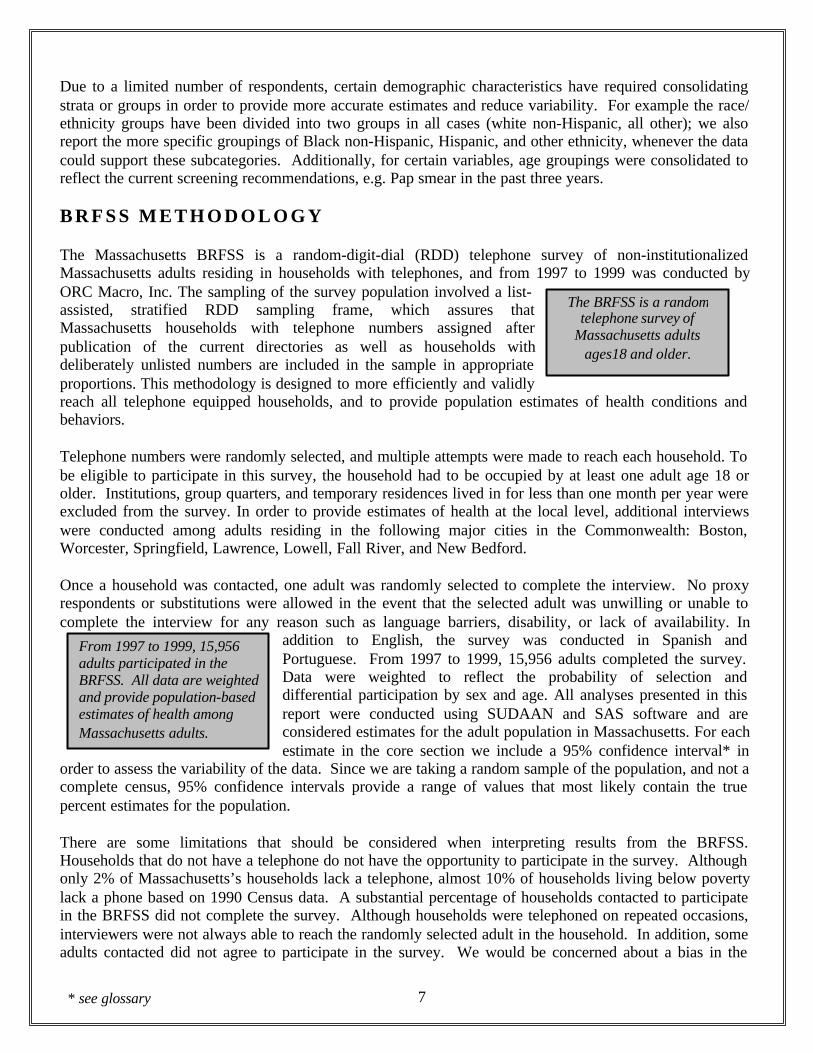
B R F S S M E T H O D O L O G Y
The Massachusetts BRFSS is a random-digit-dial (RDD) telephone survey of non-institutionalizedMassachusetts adults residing in households with telephones, and from 1997 to 1999 was conducted byORC Macro, Inc. The sampling of the survey population involved a list-assisted, stratified RDD sampling frame, which assures thatMassachusetts households with telephone numbers assigned afterpublication of the current directories as well as households withdeliberately unlisted numbers are included in the sample in appropriateproportions. This methodology is designed to more efficiently and validlyreach all telephone equipped households, and to provide population estimates of health conditions andbehaviors.
The BRFSS is a random telephone survey of
Massachusetts adults ages18 and older.
Telephone numbers were randomly selected, and multiple attempts were made to reach each household. Tobe eligible to participate in this survey, the household had to be occupied by at least one adult age 18 orolder. Institutions, group quarters, and temporary residences lived in for less than one month per year wereexcluded from the survey. In order to provide estimates of health at the local level, additional interviewswere conducted among adults residing in the following major cities in the Commonwealth: Boston,Worcester, Springfield, Lawrence, Lowell, Fall River, and New Bedford.
Once a household was contacted, one adult was randomly selected to complete the interview. No proxyrespondents or substitutions were allowed in the event that the selected adult was unwilling or unable tocomplete the interview for any reason such as language barriers, disability, or lack of availability. In
addition to English, the survey was conducted in Spanish and Portuguese. From 1997 to 1999, 15,956 adults completed the survey. Data were weighted to reflect the probability of selection and differential participation by sex and age. All analyses presented in this report were conducted using SUDAAN and SAS software and are considered estimates for the adult population in Massachusetts. For each estimate in the core section we include a 95% confidence interval* in
order to assess the variability of the data. Since we are taking a random sample of the population, and not a complete census, 95% confidence intervals provide a range of values that most likely contain the true percent estimates for the population.
From 1997 to 1999, 15,956 adults participated in the BRFSS. and provide population-based estimates of health among Massachusetts adults.
All data are weighted,
There are some limitations that should be considered when interpreting results from the BRFSS. Households that do not have a telephone do not have the opportunity to participate in the survey. Although only 2% of Massachusetts’s households lack a telephone, almost 10% of households living below poverty lack a phone based on 1990 Census data. A substantial percentage of households contacted to participate in the BRFSS did not complete the survey. Although households were telephoned on repeated occasions, interviewers were not always able to reach the randomly selected adult in the household. In addition, some adults contacted did not agree to participate in the survey. We would be concerned about a bias in the
* see glossary 7

results if the respondents who participated in the survey differed significantly from those not included in the survey. The weighting of the data partially takes into account this non-response.
All data collected by the BRFSS are based on self-report from the respondents. By its nature, self-reported data may be subject to error for several reasons. An individual may have difficulty remembering events that occurred a long time ago or the frequency of certain behaviors. Some respondents may over-report socially desirable behaviors, while under-reporting behaviors they perceive to be less acceptable. Finally, because the BRFSS surveys a randomly selected sample of Massachusetts’s adults, these results may differ from another random sample to some extent simply due to chance.
8

9

DEMOGRAPHIC PROFILE OF BRFSS SURVEY RESPONDENTS: LAWRENCE/LOWELL, 1997-1999
From 1997 to 1999, 1,149 Lawrence/Lowell residents age 18 and older completed the Massachusetts Behavioral Risk Factor Surveillance System. The BRFSS data are weighted to account for the probability of selection related to the number of telephones in the house, number of adults, and the city of residence. In addition, the data are post-stratified to the 1997 to 1999 Massachusetts population estimates by age and gender.
UNWEIGHTED SAMPLE SIZE N
WEIGHTED PERCENT (%)
OVERALL GENDER
MALE FEMALE
AGE GROUP 18 - 29 30 - 44 45 - 64 65 AND OLDER
RACE / ETHNICITY WHITE, NON-HISPANIC ALL OTHER
BLACK, NON-HISPANIC HISPANIC OTHER ETHNICITY
EDUCATION < HIGH SCHOOL HIGH SCHOOL GRAD COLLEGE 1-3 YEARS COLLEGE 4+ YEARS
HOUSEHOLD INCOME < $25,000 $25-34,999 $35-49,999 $50,000+
1149
459 690
269 419 257 192
831 304 22
235 47
212 420 280 235
347 159 160 230
100
48.4 51.6
28.2 33.5 21.4 16.9
73.8 26.2 1.7
20.8 3.6
17.6 35.2 25.9 21.4
35.8 18.9 15.7 29.6
10

S E C T I O N 1 : O V E R A L L H E A L T H S T A T U S
All respondents were asked to describe their overall health status as excellent, very good, good, fair, or poor, and they were also asked on how many days in the previous month their mental health had been poor, and how many days physical or mental health had limited their daily activities.
During 1997 to 1999, 20% of Lawrence/Lowell adults described their health as fair or poor. Older adults, and individuals with lower education or income were more likely to report fair or poor health. Overall, 9% of Lawrence/Lowell adults had experienced 15 or more days of poor mental health in the previous month. Of all Lawrence/Lowell adults, 6% were limited in their usual activities by poor physical or mental health for 15 or more days in the previous month. Adults of lower income were more likely to have had their activities limited by poor health. White non-Hispanics were more likely than Black non-Hispanics and Hispanics to have had 15 or more days in which their activities were limited due to health.
PHYSICAL AND MENTAL HEALTH AMONG LAWRENCE/LOWELL ADULTS, 1997-1999 (PERCENTAGES AND 95% CONFIDENCE INTERVALS)
FAIR OR POOR HEALTH 15+ DAYS POOR MENTAL HEALTH IN PAST MONTH
15+ DAYS HEALTH LIMITED ACTIVITIES
% 95% CI % 95% CI % 95% CI
OVERALL 20.3 16.6 – 24.0 9.2 6.4 – 12.1 6.2 4.4 – 8.1 GENDER
MALE FEMALE
AGE GROUP 18-29 30-44 45-64 65 AND OLDER
RACE / ETHNICITY WHITE, NON-HISP. ALL OTHER
16.8 11.5 – 22.0 7.2 4.0 – 10.5 6.0 3.2 – 8.9 23.5 18.4 – 28.5 11.1 6.6 – 15.6 6.4 4.0 – 8.8
12.3 6.0 – 18.6 10.8 5.9 – 15.8 2.9 0.4 – 5.5 12.2 7.6 – 16.7 8.5 4.9 – 12.1 5.7 2.5 – 8.9 26.7 17.0 – 36.5 11.2 1.8 – 20.7 9.0 4.2 – 13.9 43.6 34.1 – 53.2 5.9 1.0 – 10.8 9.1 3.9 – 14.2
21.9 17.4 – 26.5 9.9 6.3 – 13.5 7.4 5.0 – 9.8 16.4 10.4 – 22.4 6.5 3.2 – 9.9 3.2 1.1 – 5.3
BLACK, NON-HISP. † † † HISPANIC
EDUCATION < HIGH SCHOOL HIGH SCHOOL COLLEGE 1-3 YRS COLLEGE 4+ YRS
HOUSEHOLD INCOME < $25,000 $25-34,999 $35-49,999
14.0 8.1 – 20.0 5.7 2.4 – 9.0 2.3 0.5 – 4.0
27.5 18.5 – 36.5 7.7 2.6 – 12.9 7.8 3.3 – 12.3 25.1 18.2 – 32.0 11.7 5.6 – 17.9 6.2 3.2 – 9.1 16.9 10.2 – 23.7 10.6 5.1 – 16.2 7.0 2.7 – 11.4 10.2 4.8 – 15.5 4.4 1.4 – 7.4 4.1 0.8 – 7.5
27.6 21.4 – 33.9 10.9 6.0 – 15.9 10.4 6.0 – 14.8 19.8 10.8 – 28.9 5.4 1.4 – 9.4 4.3 0.2 – 8.4 15.4 0.8 – 30.0 11.9 0.0 – 27.1 0.3 0.0 – 0.7
$50,000+ 8.2 1.2 – 15.1 7.7 3.1 – 12.2 2.9 0.0 – 6.0
† Insufficient sample size
11
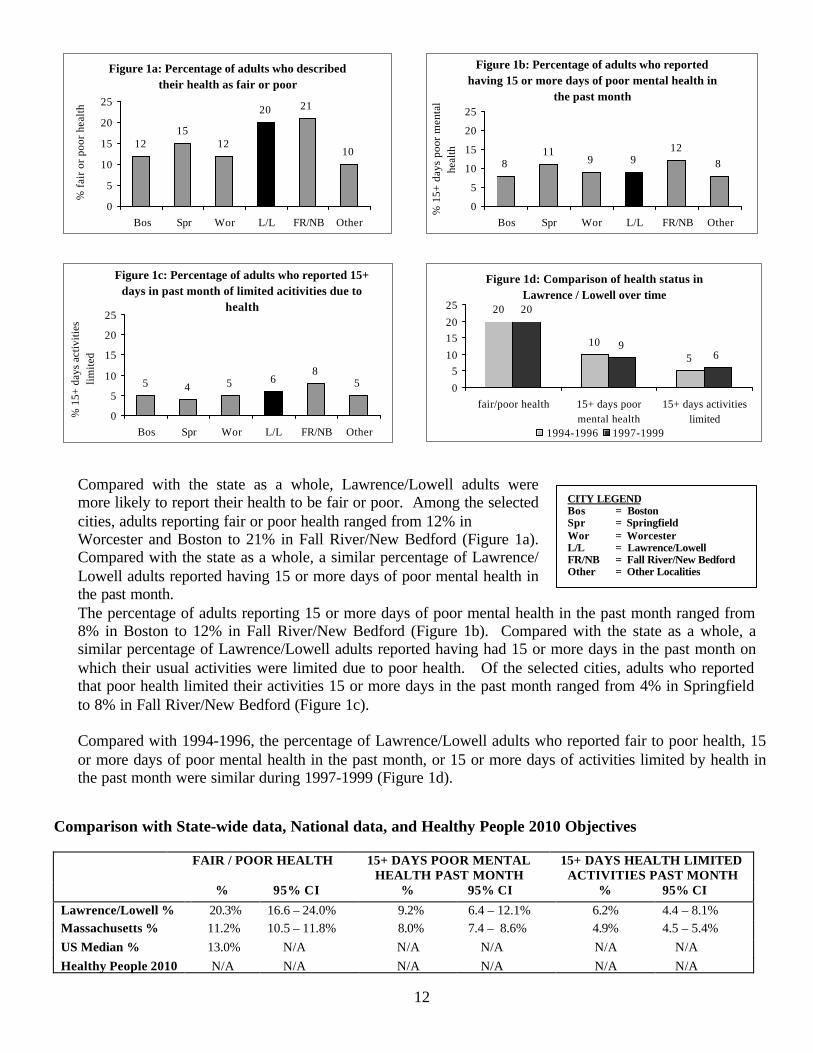
Figure 1b: Percentage of adults who reported having 15 or more days of poor mental health in
the past month
8 11
9 9 12
8
0
5
10
15
20
25
Bos Spr Wor L/L FR/NB Other
% 1
5+ d
ays
poor
men
tal
heal
th
Figure 1c: Percentage of adults who reported 15+ days in past month of limited acitivities due to
health
5 4 5 6 8
5
0
5
10
15
20
25
Bos Spr Wor L/L FR/NB Other
% 1
5+ d
ays
activ
ities
lim
ited
Figure 1d: Comparison of health status in Lawrence / Lowell over time
20
10 5
20
9 6
0
5 10
15 20
25
fair/poor health 15+ days poor mental health
15+ days activities limited
1994-1996 1997-1999
Figure 1a: Percentage of adults who described their health as fair or poor
12 15
12
20 21
10
0
5
10
15
20
25
Bos Spr Wor L/L FR/NB Other
% f
air
or p
oor
heal
th
Compared with the state as a whole, Lawrence/Lowell adults were more likely to report their health to be fair or poor. Among the selected cities, adults reporting fair or poor health ranged from 12% in Worcester and Boston to 21% in Fall River/New Bedford (Figure 1a). Compared with the state as a whole, a similar percentage of Lawrence/ Lowell adults reported having 15 or more days of poor mental health in the past month.
CITY LEGEND Bos = Spr = Wor = L/L = FR/NB = Other =
Boston Springfield Worcester Lawrence/Lowell Fall River/New Bedford Other Localities
The percentage of adults reporting 15 or more days of poor mental health in the past month ranged from 8% in Boston to 12% in Fall River/New Bedford (Figure 1b). Compared with the state as a whole, a similar percentage of Lawrence/Lowell adults reported having had 15 or more days in the past month on which their usual activities were limited due to poor health. Of the selected cities, adults who reported that poor health limited their activities 15 or more days in the past month ranged from 4% in Springfield to 8% in Fall River/New Bedford (Figure 1c).
Compared with 1994-1996, the percentage of Lawrence/Lowell adults who reported fair to poor health, 15 or more days of poor mental health in the past month, or 15 or more days of activities limited by health in the past month were similar during 1997-1999 (Figure 1d).
Comparison with State-wide data, National data, and Healthy People 2010 Objectives
FAIR / POOR HEALTH 15+ DAYS POOR MENTAL HEALTH PAST MONTH
15+ DAYS HEALTH LIMITED ACTIVITIES PAST MONTH
% 95% CI % 95% CI % 95% CI
Lawrence/Lowell % 20.3% 16.6 – 24.0% 9.2% 6.4 – 12.1% 6.2% 4.4 – 8.1% Massachusetts % 11.2% 10.5 – 11.8% 8.0% 7.4 – 8.6% 4.9% 4.5 – 5.4% US Median % 13.0% N/A N/A N/A N/A N/A Healthy People 2010 N/A N/A N/A N/A N/A N/A
12

SECTION 2 : QUALITY OF LIFE
All respondents were asked to self-assess measures of quality of life. Respondents were asked on how many days in the previous month they had felt sad, blue or depressed, how many days pain made it hard to do usual activities, and how many days they felt very healthy and full of energy.
During 1998 to 1999, 9% of Lawrence/Lowell adults said that they had felt depressed for at least 15 days in the past month. The percentage of adults who reported feeling depressed for 15 or more days of the month decreased with increasing age. Adults of lower income were more likely to have felt depressed. Eleven percent of Lawrence/Lowell adults stated that during the past month they had experienced pain that made it hard to do their usual activities for at least 15 days. The percentage of adults who reported 15 or more days of pain in the past month increased with increasing age. White non-Hispanics were more likely than Hispanics to have had pain for at least half of the past month. Of all Lawrence/Lowell adults, 70% reported that they felt full of energy for at least 15 days of the past month. The percentage of adults who reported feeling full of energy for over half of the past month decreased with increasing age.
QUALITY OF LIFE AMONG LAWRENCE/LOWELL ADULTS, 1998-1999 (PERCENTAGES AND 95% CONFIDENCE INTERVALS) 15+ DAYS DEPRESSED 15+ DAYS PAIN 15+ DAYS FULL OF
ENERGY % 95% CI % 95% CI % 95% CI
OVERALL 8.6 5.5 – 11.7 10.6 6.8 – 14.5 69.6 64.6 – 74.6 GENDER
MALE FEMALE
AGE GROUP 18-29 30-44 45-64 65 AND OLDER
RACE / ETHNICITY WHITE, NON-HISP. ALL OTHER
BLACK, NON-HISP. HISPANIC
EDUCATION < HIGH SCHOOL HIGH SCHOOL COLLEGE 1-3 YRS COLLEGE 4+ YRS
HOUSEHOLD INCOME < $25,000 $25-34,999
10.5 5.2 – 15.8 12.7 5.8 – 19.6 73.4 65.8 – 81.1 6.7 3.3 – 10.1 8.7 5.3 – 12.1 65.9 59.9 – 71.8
10.9 4.2 – 17.5 1.5 0.0 – 3.7 74.5 66.0 – 83.0 9.0 3.6 – 14.4 9.4 4.2 – 14.5 69.3 59.5 – 79.0 7.9 1.8 – 13.9 17.9 5.0 – 30.8 67.0 56.8 – 77.3 4.9 0.0 – 11.1 21.3 11.1 – 31.6 63.3 51.5 – 75.0
8.6 4.8 – 12.3 13.5 8.5 – 18.5 66.6 61.0 – 72.2 7.3 2.6 – 12.1 4.0 0.5 – 7.6 75.8 66.0 – 85.5 † † †
5.3 1.1 – 9.5 2.5 0.0 – 5.4 78.6 68.1 – 89.2
8.6 1.4 – 15.8 12.2 5.4 – 18.9 63.3 52.4 – 74.2 7.3 2.4 – 12.3 11.7 6.2 – 17.2 69.0 61.4 – 76.7 8.9 2.6 – 15.1 11.3 1.1 – 21.6 76.6 66.7 – 86.5 10.0 3.0 – 17.0 6.9 1.4 – 12.4 66.4 56.2 – 76.6
11.6 4.9 – 18.4 12.8 6.7 – 19.0 61.6 52.5 – 70.6 16.6 4.8 – 28.4 9.0 0.3 – 17.7 71.8 60.0 – 83.7
$35-49,999 3.0 0.0 – 8.8 1.6 0.0 – 4.9 78.7 67.0 – 90.5 $50,000+ 5.4 0.6 – 10.1 4.7 0.2 – 9.1 71.3 58.7 – 83.8 † Insufficient sample size
13

CITY LEGEND Bos = Spr = Wor = L/L = FR/NB = Other =
Figure 2a: Percentage of adults who felt sad or depressed for 15 or more days of the past month
7 9 8 9
12
6
0
5
10
15
20
25
Bos Spr Wor L/L FR/NB Other
% 1
5+ d
ays
depr
esse
d
Figure 2c: Percentage of adults who felt full of energy for 15 or more days in the past month
70 70 71 70 65
73
0
15
30
45
60
75
Bos Spr Wor L/L FR/NB Other
% 1
5+ d
ays
full
ener
gyFigure 2b: Percentage of adults who had physical
pain for 15 or more days in the past month
6 8 7
11 11
7
0
5
10
15
20
25
Bos Spr Wor L/L FR/NB Other
% 1
5+ d
ays
pain
Boston Springfield Worcester Lawrence/Lowell Fall River/New Bedford Other Localities
Compared with the state as a whole, a similar percentage of Lawrence/ Lowell adults had felt depressed for the majority of the past month. The percentage of adults who said that they had felt sad, blue, or depressed for at least 15 days in the past month ranged from 7% in Boston to 12% in Fall River/New Bedford (Figure 2a). Compared with the state as a whole, a similar percentage of Lawrence/Lowell adults reported that pain made it hard to do usual activities for at least 15 days of the previous month. The percentage of adults who had pain ranged from 6% in Boston to 11% in Fall River/New Bedford and Lawrence/Lowell (Figure 2b). Compared with the state as a whole, a similar percentage of Lawrence/Lowell adults felt full of energy for most of the previous month. Among the selected cities, adults reporting 15 or more days of full energy ranged from 65% in Fall River/New Bedford to 71% in Worcester (Figure 2c).
Questions on quality of life were not asked in the 1994 to 1996 surveys and therefore data on these measures are not available for comparison.
Comparison with State-wide data, National data, and Healthy People 2010 Objectives
15+ DAYS DEPRESSED 15+ DAYS PAIN 15+ DAYS FULL OF ENERGY % 95% CI % 95% CI % 95% CI
Lawrence/Lowell % 8.6% 5.5 – 11.7% 10.6% 6.8 – 14.5% 69.6% 64.6 – 74.6% Massachusetts % 6.3% 5.8 – 6.9% 7.0% 6.3 – 7.6% 72.0% 70.8 – 73.2% US Median % N/A N/A N/A N/A N/A N/A Healthy People 2010 N/A N/A N/A N/A N/A N/A
14
S E C T I O N 3 : H E A L T H A C C E S S A N D U T I L I Z A T I O N
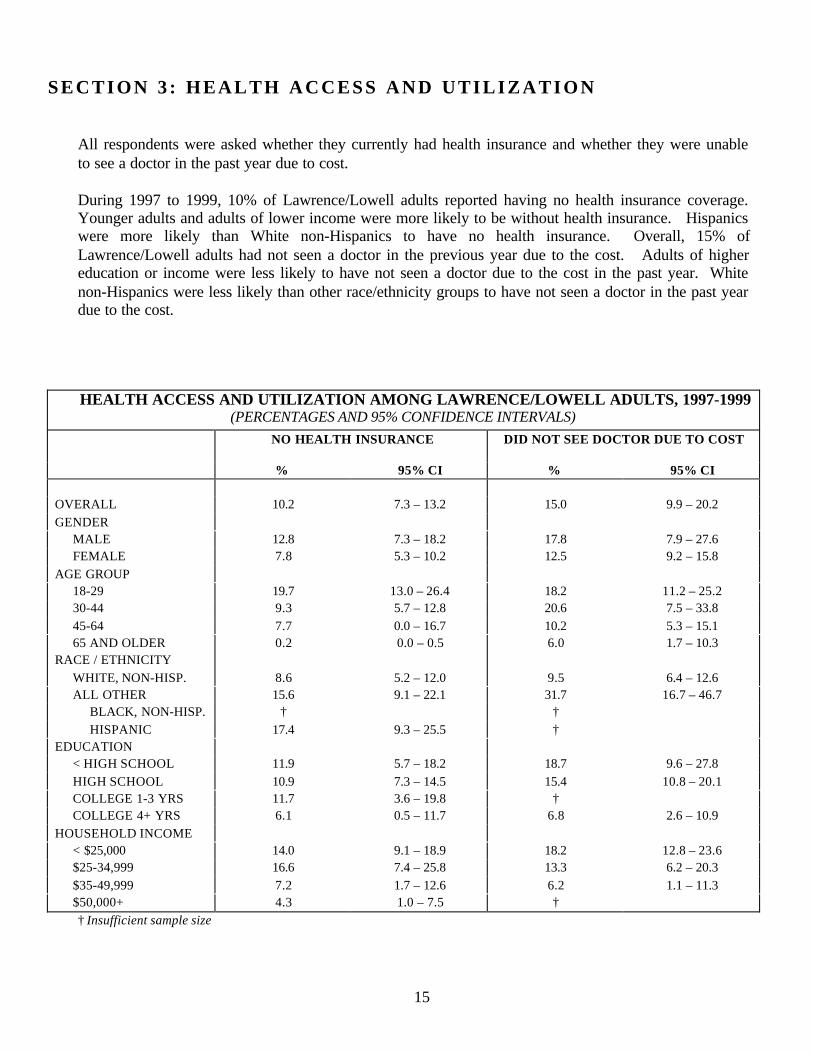
All respondents were asked whether they currently had health insurance and whether they were unable to see a doctor in the past year due to cost.
During 1997 to 1999, 10% of Lawrence/Lowell adults reported having no health insurance coverage. Younger adults and adults of lower income were more likely to be without health insurance. Hispanics were more likely than White non-Hispanics to have no health insurance. Overall, 15% of Lawrence/Lowell adults had not seen a doctor in the previous year due to the cost. Adults of higher education or income were less likely to have not seen a doctor due to the cost in the past year. White non-Hispanics were less likely than other race/ethnicity groups to have not seen a doctor in the past year due to the cost.
HEALTH ACCESS AND UTILIZATION AMONG LAWRENCE/LOWELL ADULTS, 1997-1999 (PERCENTAGES AND 95% CONFIDENCE INTERVALS)
NO HEALTH INSURANCE DID NOT SEE DOCTOR DUE TO COST
% 95% CI % 95% CI
OVERALL 10.2 7.3 – 13.2 15.0 9.9 – 20.2 GENDER
MALE FEMALE
AGE GROUP 18-29 30-44 45-64 65 AND OLDER
RACE / ETHNICITY WHITE, NON-HISP. ALL OTHER
BLACK, NON-HISP. HISPANIC
EDUCATION < HIGH SCHOOL HIGH SCHOOL COLLEGE 1-3 YRS COLLEGE 4+ YRS
HOUSEHOLD INCOME < $25,000 $25-34,999 $35-49,999
12.8 7.3 – 18.2 17.8 7.9 – 27.6 7.8 5.3 – 10.2 12.5 9.2 – 15.8
19.7 13.0 – 26.4 18.2 11.2 – 25.2 9.3 5.7 – 12.8 20.6 7.5 – 33.8 7.7 0.0 – 16.7 10.2 5.3 – 15.1 0.2 0.0 – 0.5 6.0 1.7 – 10.3
8.6 5.2 – 12.0 9.5 6.4 – 12.6 15.6 9.1 – 22.1 31.7 16.7 – 46.7
† † 17.4 9.3 – 25.5 †
11.9 5.7 – 18.2 18.7 9.6 – 27.8 10.9 7.3 – 14.5 15.4 10.8 – 20.1 11.7 3.6 – 19.8 † 6.1 0.5 – 11.7 6.8 2.6 – 10.9
14.0 9.1 – 18.9 18.2 12.8 – 23.6 16.6 7.4 – 25.8 13.3 6.2 – 20.3 7.2 1.7 – 12.6 6.2 1.1 – 11.3
$50,000+ 4.3 1.0 – 7.5 † † Insufficient sample size
15

Figure 3a: Percentage of adults who had no health insurance
7 10
7 10 10
6
0
5
10
15
20
25
Bos Spr Wor L/L FR/NB Other
% n
o he
alth
insu
ranc
e
Figure 3b: Percentage of adults who had wanted to see a doctor in the past year but could not due
to the cost
9 13
9
15 12
7
0
5
10
15
20
25
Bos Spr Wor L/L FR/NB Other
% n
o do
ctor
vis
it du
e to
co
st
Compared with the state as a whole, Lawrence/Lowell adults were more likely to have no health insurance coverage. Among the selected cities, adults reporting no health insurance ranged from 7% in Boston and Worcester to 10% in Springfield, Fall River/New Bedford, and Lawrence/Lowell (Figure 3a). Compared with the state as a whole, Lawrence/Lowell adults were more likely to have not visited the doctor in the past year due to the cost. Adults who had not been to the doctor in the previous year due to the cost ranged from 9% in Boston and Worcester to 15% in Lawrence/Lowell (Figure 3b).
Figure 3c: Comparison of health care access in Lawrence / Lowell over time
14 10
15
*** 0
5
10
15
20
25
no health insurance no doctor visit due to cost
1994-1996 1997-1999
*** Health insurance was calculated differently in 1999 compared with previous BRFSS reports. In previous reports respondents were classified as having no insurance if they answered no to the following question: “Do you have any kind of health care coverage, including health insurance, prepaid plans such as HMOs, or government plans such as Medicare?” In 1999, respondents were classified as having no insurance if they responded no to this question and no to the following question: “ There are some types of health insurance you may not have considered: Please tell me if you have any of the following:[respondent read list of types of insurance]”. Estimates generated for this report are therefore not comparable to estimates generated for earlier BRFSS reports. The effect of adding the second question was to lower the percentage of Lawrence/Lowell adults with no health insurance from 13% to 10% during 1997-1999.
CITY LEGEND Bos = Spr = Wor = L/L = FR/NB = Other =
Boston Springfield Worcester Lawrence/Lowell Fall River/New Bedford Other Localities
Compared with 1994-1996, the percentage of Lawrence/Lowell adults who did not see the doctor during the year due to the cost was similar during 1997-1999 (Figure 3c). Lawrence/Lowell did not meet the Healthy People 2010 objective for the percentage of adults who have no health insurance.
Comparison with State-wide data, National data, and Healthy People 2010 Objectives
NO HEALTH INSURANCE DID NOT SEE DOCTOR DUE TO COST % 95% CI % 95% CI
Lawrence/Lowell % 10.2% 7.3 – 13.2% 15.0% 9.9 – 20.2% Massachusetts % 6.4% 5.8 – 7.0% 7.6% 7.0 – 8.2% US Median % N/A N/A 9.6% N/A Healthy People 2010 0.0% N/A N/A N/A
16

S E C T I O N 4 : D E N T A L H E A L T H
All respondents were asked questions related to dental health. Respondents were asked when they had last visited a dentist and how many teeth they had lost due to decay or gum disease.
During 1998 to 1999, 66% of Lawrence/Lowell adults reported having gone to the dentist in the previous year. Adults of higher education and income were more likely to have been to the dentist in the previous year. Overall, 20% of Lawrence/Lowell adults reported having six or more teeth missing due to disease or decay. The percentage of Lawrence/Lowell adults who had six or more teeth missing increased with age. Adults of higher education were less likely to have six or more teeth missing due to disease or decay.
DENTAL HEALTH AMONG LAWRENCE/LOWELL ADULTS, 1998-1999 (PERCENTAGES AND 95% CONFIDENCE INTERVALS)
DENTAL VISIT IN PAST YEAR 6 OR MORE TEETH MISSING FROM DISEASE
% 95% CI % 95% CI
OVERALL 65.5 59.0 – 72.0 19.7 13.0 – 26.5 GENDER
MALE FEMALE
AGE GROUP 18-29 30-44 45-64 65 AND OLDER
RACE / ETHNICITY WHITE, NON-HISP. ALL OTHER
BLACK, NON-HISP. HISPANIC
EDUCATION < HIGH SCHOOL HIGH SCHOOL COLLEGE 1-3 YRS COLLEGE 4+ YRS
HOUSEHOLD INCOME < $25,000 $25-34,999 $35-49,999
59.4 48.0 – 70.8 16.4 3.2 – 29.5 71.3 65.8 – 76.8 22.9 17.9 – 27.9
71.7 62.5 – 80.9 0.4 0.0 – 1.1 62.6 47.9 – 77.3 14.0 0.0 – 32.3 68.7 58.8 – 78.6 30.4 20.8 – 40.0 55.4 43.7 – 67.2 51.8 39.8 – 63.8
70.0 64.8 – 75.3 20.2 15.8 – 24.5 † † † † † †
50.1 38.8 – 61.5 26.6 17.5 – 35.7 62.1 54.1 – 70.1 20.1 13.9 – 26.4
† † 83.5 76.0 – 91.0 4.1 0.9 – 7.4
63.4 54.8 – 72.1 21.2 14.4 – 27.9 63.8 50.6 – 77.0 21.1 10.8 – 31.3 82.6 71.3 – 93.9 11.4 2.3 – 20.5
$50,000+ † † † Insufficient sample size
17

Figure 4a: Percentage of adults who have visited a dentist in the past year
73 72 71 66 62
78
0
20
40
60
80
100
Bos Spr Wor L/L FR/NB Other
% d
enta
l vis
it pa
st y
ear
Figure 4b: Percentage of adults who had 6 or more teeth missing from disease
14
22 24 20
27
18
0
10
20
30
40
50
Bos Spr Wor L/L FR/NB Other
% 6
+ te
eth
mis
sing
fr
om d
isea
se
Compared with the state as a whole, Lawrence/ Lowell adults were less likely to have visited the dentist within the past year. Among the selected cities, the percentage of adults who had visited a dentist at least once in the previous year ranged from 62% in Fall River/New Bedford to 73% in Boston (Figure 4a). Compared with the state as a whole, a similar percentage of Lawrence/Lowell adults had at least six teeth missing due to disease or decay. Of the selected cities, the percentage of adults who have at least six or more teeth missing due to disease or decay ranged from 14% in Boston to 27% in Fall River/New Bedford (Figure 4b).
Figure 4c: Comparison of dental health in Lawrence / Lowell over time
63
22
66
20
0 15 30 45 60 75
dental visit past year 6+ teeth missing from disease
1995 1998-1999
Compared with the results from 1995, the percentage of those who had visited the dentist in the past year and the percentage of adults who have six or more teeth missing due to disease or decay were similar during 1998 and 1999 (Figure 4c).
CITY LEGEND Bos = Spr = Wor = L/L = FR/NB = Other =
Boston Springfield Worcester Lawrence/Lowell Fall River/New Bedford Other Localities
Comparison with State-wide data, National data, and Healthy People 2010 Objectives
DENTAL VISIT IN PAST YEAR 6+ TEETH MISSING FROM DISEASE
% % Lawrence/Lowell % 65.5% 59.0 – 72.0% 19.7% 13.0 – 26.5% Massachusetts % 76.8% 75.7 – 77.9% 17.8% 16.8 – 18.7% US Median % 68.1% N/A 19.9% N/A Healthy People 2010 N/A N/A N/A N/A
95% CI 95% CI
18
S E C T I O N 5 : T O B A C C O U S E
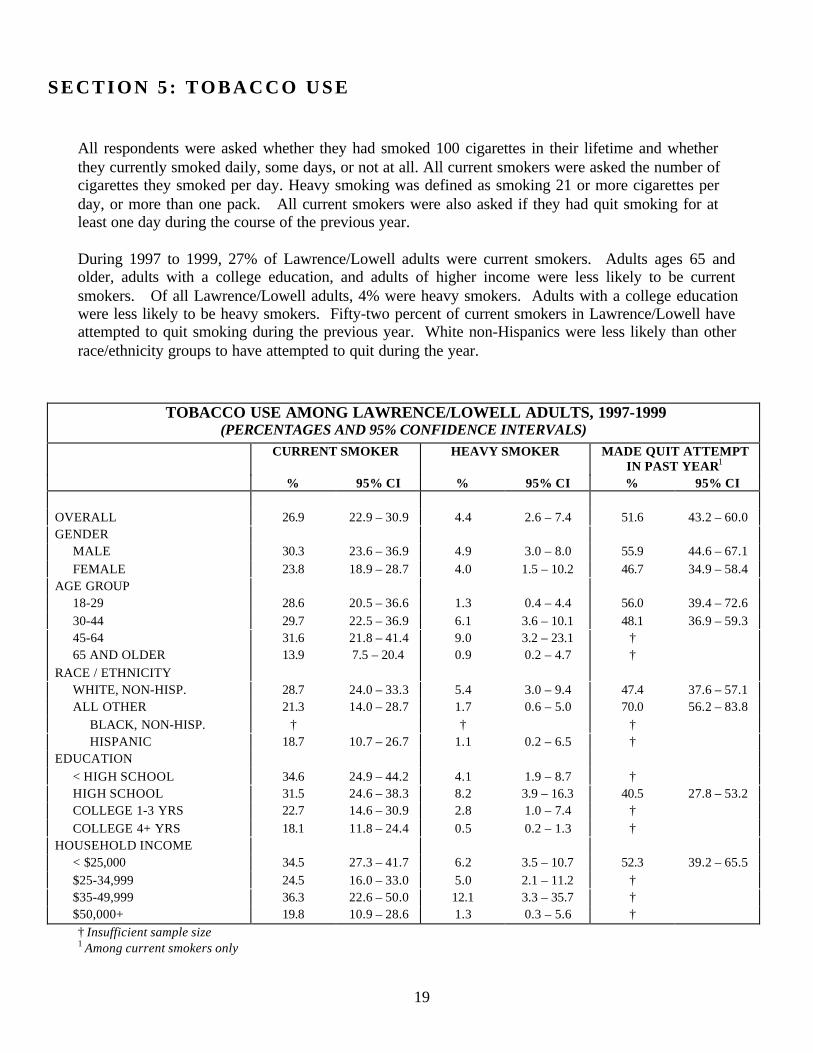
All respondents were asked whether they had smoked 100 cigarettes in their lifetime and whether they currently smoked daily, some days, or not at all. All current smokers were asked the number of cigarettes they smoked per day. Heavy smoking was defined as smoking 21 or more cigarettes per day, or more than one pack. All current smokers were also asked if they had quit smoking for at least one day during the course of the previous year.
During 1997 to 1999, 27% of Lawrence/Lowell adults were current smokers. Adults ages 65 and older, adults with a college education, and adults of higher income were less likely to be current smokers. Of all Lawrence/Lowell adults, 4% were heavy smokers. Adults with a college education were less likely to be heavy smokers. Fifty-two percent of current smokers in Lawrence/Lowell have attempted to quit smoking during the previous year. White non-Hispanics were less likely than other race/ethnicity groups to have attempted to quit during the year.
TOBACCO USE AMONG LAWRENCE/LOWELL ADULTS, 1997-1999 (PERCENTAGES AND 95% CONFIDENCE INTERVALS)
CURRENT SMOKER HEAVY SMOKER MADE QUIT ATTEMPT IN PAST YEAR1
% 95% CI % 95% CI % 95% CI
OVERALL 26.9 22.9 – 30.9 4.4 2.6 – 7.4 51.6 43.2 – 60.0 GENDER
MALE FEMALE
AGE GROUP 18-29 30-44 45-64 65 AND OLDER
RACE / ETHNICITY WHITE, NON-HISP. ALL OTHER
BLACK, NON-HISP. HISPANIC
EDUCATION < HIGH SCHOOL HIGH SCHOOL COLLEGE 1-3 YRS COLLEGE 4+ YRS
HOUSEHOLD INCOME < $25,000 $25-34,999
30.3 23.6 – 36.9 4.9 3.0 – 8.0 55.9 44.6 – 67.1 23.8 18.9 – 28.7 4.0 1.5 – 10.2 46.7 34.9 – 58.4
28.6 20.5 – 36.6 1.3 0.4 – 4.4 56.0 39.4 – 72.6 29.7 22.5 – 36.9 6.1 3.6 – 10.1 48.1 36.9 – 59.3 31.6 21.8 – 41.4 9.0 3.2 – 23.1 † 13.9 7.5 – 20.4 0.9 0.2 – 4.7 †
28.7 24.0 – 33.3 5.4 3.0 – 9.4 47.4 37.6 – 57.1 21.3 14.0 – 28.7 1.7 0.6 – 5.0 70.0 56.2 – 83.8
† † † 18.7 10.7 – 26.7 1.1 0.2 – 6.5 †
34.6 24.9 – 44.2 4.1 1.9 – 8.7 † 31.5 24.6 – 38.3 8.2 3.9 – 16.3 40.5 27.8 – 53.2 22.7 14.6 – 30.9 2.8 1.0 – 7.4 † 18.1 11.8 – 24.4 0.5 0.2 – 1.3 †
34.5 27.3 – 41.7 6.2 3.5 – 10.7 52.3 39.2 – 65.5 24.5 16.0 – 33.0 5.0 2.1 – 11.2 †
$35-49,999 36.3 22.6 – 50.0 12.1 3.3 – 35.7 † $50,000+ 19.8 10.9 – 28.6 1.3 0.3 – 5.6 † † Insufficient sample size 1 Among current smokers only
19

Figure 5a: Percentage of adults who were current smokers
18
26 26 27 28
20
0
10
20
30
40
50
Bos Spr Wor L/L FR/NB Other
% c
urre
nt s
mok
ing
Figure 5b: Percentage of adults who were heavy smokers
2 4 5 4
6 3
0
5
10
15
20
25
Bos Spr Wor L/L FR/NB Other
% h
eavy
sm
oker
s
Figure 5c: Percentage of current smokers who have attempted to quit in the past year
64 60 62 52 55 60
0
15
30
45
60
75
Bos Spr Wor L/L FR/NB Other
% q
uit a
ttem
pt
past
yea
r
Figure 5d: Comparison of tobacco use in Lawrence / Lowell over time
25
5
57
27
4
52
0
15
30
45
60
75
current smoker heavy smoker quit attempt
1994-1996 1997-1999
Compared with the state as a whole, Lawrence/Lowell adults were more likely to be current smokers. Among the selected cities, the percentage of adults who are current smokers ranged from 18% in Boston to 28% in Fall River/New Bedford (Figure 5a). Lawrence/ Lowell adults were as likely as adults of the state overall to be heavy smokers. The percentage of adults who were heavy smokers ranged from 2% in Boston to 6% in Fall River/New Bedford (Figure 5b). The percentage of Lawrence/ Lowell adults who had tried to quit smoking in the preceding year was similar to that of the state as a whole. Among the selected cities, the percentage of adults who attempted to quit in the past year ranged from 52% in Lawrence/Lowell to 64% in Boston (Figure 5c).
CITY LEGEND Bos = Spr = Wor = L/L = FR/NB = Other =
Boston Springfield Worcester Lawrence/Lowell Fall River/New Bedford Other Localities
Compared with the results from 1994 to 1996, the percentage of Lawrence/Lowell adults who were current smokers and percentage who were heavy smokers were similar during 1997 to 1999 (Figure 5d). The percentage of Lawrence/Lowell adults who tried to quit smoking in the past year decreased over the same time period. Lawrence/Lowell did not meet the Healthy People 2010 objective for current smoking level.
Comparison with State-wide data, National data, and Healthy People 2010 Objectives
CURRENT SMOKER HEAVY SMOKER MADE QUIT ATTEMPT PAST YEAR
% 95% CI % 95% CI % 95% CI Lawrence/Lowell % 26.9% 22.9 – 30.9% 4.4% 2.1 – 6.7% 51.6% 43.2 – 60.0% Massachusetts % 20.6% 19.7 – 21.5% 3.5% 3.1 – 3.9% 59.8% 57.4 – 62.1% US Median % 22.9% N/A N/A N/A 49.2% N/A Healthy People 2010 12.0% N/A N/A N/A N/A N/A
20

S E C T I O N 6 : E N V I R O N M E N T A L T O B A C C O
All respondents were asked whether they felt that smoking in restaurants should be allowed without restriction, only in designated areas, or not at all. Respondents were also asked whether smoking is allowed in their own home.
During 1997 to 1999, 57% of Lawrence/Lowell adults supported smoke-free restaurants. Overall, 51% of Lawrence/Lowell adults live in households where smoking is not allowed. Women and adults with less than a high school education were more likely to live in households where smoking is not allowed.
ENVIRONMENTAL TOBACCO AMONG LAWRENCE/LOWELL ADULTS, 1997-1999 (PERCENTAGES AND 95% CONFIDENCE INTERVALS)
SUPPORT SMOKE-FREE RESTAURANTS
LIVE IN HOUSEHOLD WHERE SMOKING NOT ALLOWED
% 95% CI % 95% CI
OVERALL 57.5 52.5 – 62.4 51.3 46.4 – 56.2 GENDER
MALE FEMALE
AGE GROUP 18-29 30-44 45-64 65 AND OLDER
RACE / ETHNICITY WHITE, NON-HISP. ALL OTHER
BLACK, NON-HISP. HISPANIC
EDUCATION < HIGH SCHOOL HIGH SCHOOL COLLEGE 1-3 YRS COLLEGE 4+ YRS
HOUSEHOLD INCOME < $25,000 $25-34,999 $35-49,999
52.8 44.4 – 61.1 45.6 37.6 – 53.6 61.8 56.6 – 67.1 56.7 51.4 – 62.0
63.2 55.2 – 71.2 55.6 47.2 – 64.0 52.3 42.2 – 62.4 42.9 33.9 – 51.9 59.3 49.4 – 69.2 52.2 42.0 – 62.3 55.9 46.6 – 65.3 58.6 49.4 – 67.9
54.1 49.1 – 59.0 48.3 43.3 – 53.3 67.5 52.8 – 82.1 60.7 46.5 – 74.8
† † † †
65.0 56.3 – 73.7 64.2 55.6 – 72.8 55.8 48.9 – 62.6 47.8 41.1 – 54.6 52.8 39.6 – 65.9 48.2 35.6 – 60.8 60.3 51.4 – 69.1 50.9 41.7 – 60.0
56.5 49.1 – 63.8 53.1 45.6 – 60.6 53.2 42.0 – 64.5 44.3 33.1 – 55.5 49.0 36.4 – 61.6 38.5 27.1 – 49.9
$50,000+ 54.8 40.2 – 69.3 54.9 40.2 – 69.5 † Insufficient sample size
21

Figure 6a: Percentage of adults who favor smoke-free restaurants
59 57 52
57 52 55
0
15
30
45
60
75
Bos Spr Wor L/L FR/NB Other
% f
avor
sm
oke-
free
re
stau
rant
s
Figure 6b: Percentage of adults who live in a household where smoking is not allowed
60 59 53 51 50
60
0
15
30
45
60
75
Bos Spr Wor L/L FR/NB Other
% li
ve in
hou
seho
ld w
here
sm
okin
g no
t allo
wed
Compared with the state as a whole, a similar percentage of Lawrence/Lowell adults support smoke-free restaurants. Among the selected cities, the percentage of adults support smoke-free restaurants ranged from 52% in Worcester and Fall River/New Bedford to 59% in Boston (Figure 6a). Compared with the state as a whole, Lawrence/ Lowell adults were less likely to live in a household where smoking was not allowed. Of the selected cities, the percentage of adults who live in a household where smoking was not allowed ranged from 50% in Fall River/New Bedford to 60% in Boston (Figure 6b).
Figure 6c: Comparison of environmental tobacco in Lawrence / Lowell over time
44 45 57 51
0 15 30 45 60 75
support smoke-free restaurants
live in household where smoking not allowed
1994-1996 1997-1999
Compared with 1994 to 1996, the percentage of Lawrence/Lowell adults who support smoke-free restaurants and the percentage who lived in a household where smoking was not allowed increased during 1997 to 1999 (Figure 6c).
CITY LEGEND Bos = Spr = Wor = Worcester L/L = FR/NB = Other =
Boston Springfield
Lawrence/Lowell Fall River/New Bedford Other Localities
Comparison with State-wide data, National data, and Healthy People 2010 Objectives
SUPPORT SMOKE-FREE RESTAURANTS
LIVE IN HOUSEHOLD WHERE SMOKING NOT ALLOWED
% 95% CI % 95% CI Lawrence/Lowell % 57.5% 52.5 – 62.4% 51.3% 46.4 – 56.2% Massachusetts % 55.2% 54.1 – 56.3% 59.3% 58.1 – 60.4% US Median % N/A N/A N/A N/A Healthy People 2010 N/A N/A N/A N/A
22
S E C T I O N 7 : A L C O H O L U S E
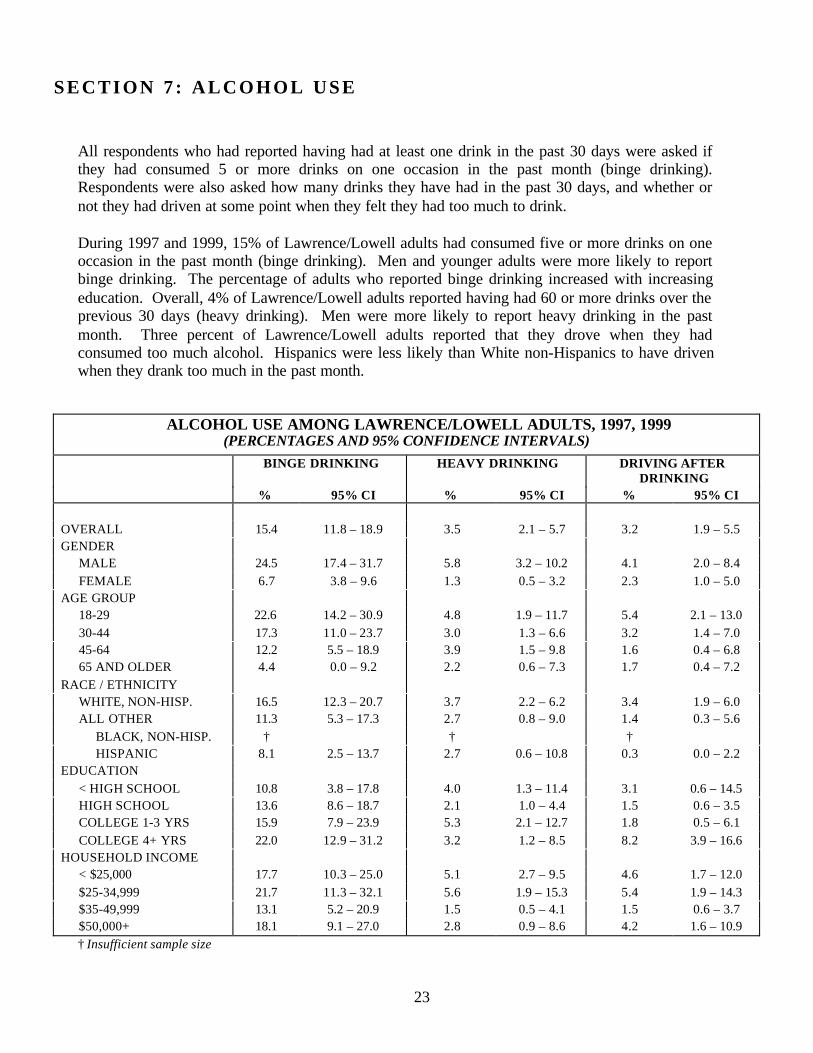
All respondents who had reported having had at least one drink in the past 30 days were asked if they had consumed 5 or more drinks on one occasion in the past month (binge drinking). Respondents were also asked how many drinks they have had in the past 30 days, and whether or not they had driven at some point when they felt they had too much to drink.
During 1997 and 1999, 15% of Lawrence/Lowell adults had consumed five or more drinks on one occasion in the past month (binge drinking). Men and younger adults were more likely to report binge drinking. The percentage of adults who reported binge drinking increased with increasing education. Overall, 4% of Lawrence/Lowell adults reported having had 60 or more drinks over the previous 30 days (heavy drinking). Men were more likely to report heavy drinking in the past month. Three percent of Lawrence/Lowell adults reported that they drove when they had consumed too much alcohol. Hispanics were less likely than White non-Hispanics to have driven when they drank too much in the past month.
ALCOHOL USE AMONG LAWRENCE/LOWELL ADULTS, 1997, 1999 (PERCENTAGES AND 95% CONFIDENCE INTERVALS)
BINGE DRINKING HEAVY DRINKING DRIVING AFTER DRINKING
% 95% CI % 95% CI % 95% CI
OVERALL 15.4 11.8 – 18.9 3.5 2.1 – 5.7 3.2 1.9 – 5.5 GENDER
MALE FEMALE
AGE GROUP 18-29 30-44 45-64 65 AND OLDER
RACE / ETHNICITY WHITE, NON-HISP. ALL OTHER
BLACK, NON-HISP. HISPANIC
EDUCATION < HIGH SCHOOL HIGH SCHOOL COLLEGE 1-3 YRS COLLEGE 4+ YRS
HOUSEHOLD INCOME < $25,000 $25-34,999
24.5 17.4 – 31.7 5.8 3.2 – 10.2 4.1 2.0 – 8.4 6.7 3.8 – 9.6 1.3 0.5 – 3.2 2.3 1.0 – 5.0
22.6 14.2 – 30.9 4.8 1.9 – 11.7 5.4 2.1 – 13.0 17.3 11.0 – 23.7 3.0 1.3 – 6.6 3.2 1.4 – 7.0 12.2 5.5 – 18.9 3.9 1.5 – 9.8 1.6 0.4 – 6.8 4.4 0.0 – 9.2 2.2 0.6 – 7.3 1.7 0.4 – 7.2
16.5 12.3 – 20.7 3.7 2.2 – 6.2 3.4 1.9 – 6.0 11.3 5.3 – 17.3 2.7 0.8 – 9.0 1.4 0.3 – 5.6
† † † 8.1 2.5 – 13.7 2.7 0.6 – 10.8 0.3 0.0 – 2.2
10.8 3.8 – 17.8 4.0 1.3 – 11.4 3.1 0.6 – 14.5 13.6 8.6 – 18.7 2.1 1.0 – 4.4 1.5 0.6 – 3.5 15.9 7.9 – 23.9 5.3 2.1 – 12.7 1.8 0.5 – 6.1 22.0 12.9 – 31.2 3.2 1.2 – 8.5 8.2 3.9 – 16.6
17.7 10.3 – 25.0 5.1 2.7 – 9.5 4.6 1.7 – 12.0 21.7 11.3 – 32.1 5.6 1.9 – 15.3 5.4 1.9 – 14.3
$35-49,999 13.1 5.2 – 20.9 1.5 0.5 – 4.1 1.5 0.6 – 3.7 $50,000+ 18.1 9.1 – 27.0 2.8 0.9 – 8.6 4.2 1.6 – 10.9 † Insufficient sample size
23

Figure 7c: Percentage of adults who have driven while under the influence of alcohol in the past
month
2 2 4 3 3 3
0
5
10
15
20
25
Bos Spr Wor L/L FR/NB Other
% d
rove
und
er in
flue
nce
Figure 7a: Percentage of adults who reported binge drinking in the past month
22
17 20
15 13
18
0
5
10
15
20
25
Bos Spr Wor L/L FR/NB Other
% 5
or
mor
e dr
inks
Figure 7b: Percentage of adults who reported heavy drinking in the past month
4 4 6
4 3 4
0
5
10
15
20
25
Bos Spr Wor L/L FR/NB Other
% 6
0+ d
rink
s <
1 m
onth
Figure 7d: Comparison of alcohol use in Lawrence / Lowell over time
16
4 2
15
4 3
0
5
10
15
20
binge drinking heavy drinking drive under influence
1995 1997, 1999
Compared with the state as a whole, a similar percentage of Lawrence/Lowell adults have had five or more drinks on at least one occasion inthe past 30 days. Among the selected cities, the percentage of adultswho reported binge drinking in the past month ranged from 13% in FallRiver/New Bedford to 22% in Boston (Figure 7d). Compared with thestate as a whole, a similar percentage of Lawrence/Lowell adultsreported heavy drinking in the past month.Among the selected cities, the percentage of adults who reported heavy drinking in the past month rangedfrom 3% in Fall River/New Bedford to 6% in Worcester (Figure 7b). Compared with the state as awhole, a similar percentage of Lawrence/Lowell adults have driven after drinking too much in the pastmonth. The percentage of individuals who drove after drinking too much ranged from 2% in Boston andSpringfield to 4% in Worcester (Figure 7c).
CITY LEGEND Bos = Spr = Wor = Worcester L/L = FR/NB = Other =
Boston Springfield
Lawrence/Lowell Fall River/New Bedford Other Localities
Compared with 1995, the percentage of Lawrence/Lowell adults who reported binge drinking, heavydrinking, or driving after having too much to drink in the past month were similar during 1997 and 1999(Figure 7d). Lawrence/Lowell did not meet the Healthy People 2010 objective for binge drinking.
Comparison with State-wide data, National data, and Healthy People 2010 Objectives
BINGE DRINKING HEAVY DRINKING DRIVING AFTER DRINKING
% 95% CI % 95% CI % 95% CI Lawrence/Lowell % 15.4% 11.8 – 18.9% 3.5% 1.8 – 5.2% 3.2% 1.5 – 4.9% Massachusetts % 17.7% 16.6 – 18.8% 4.2% 3.6 – 4.8% 2.7% 2.2 – 3.1% US Median % 14.7% N/A 3.3% N/A 4.3% N/A Healthy People 2010 6% N/A N/A N/A N/A N/A
24
S E C T I O N 8 : W E I G H T C O N T R O L
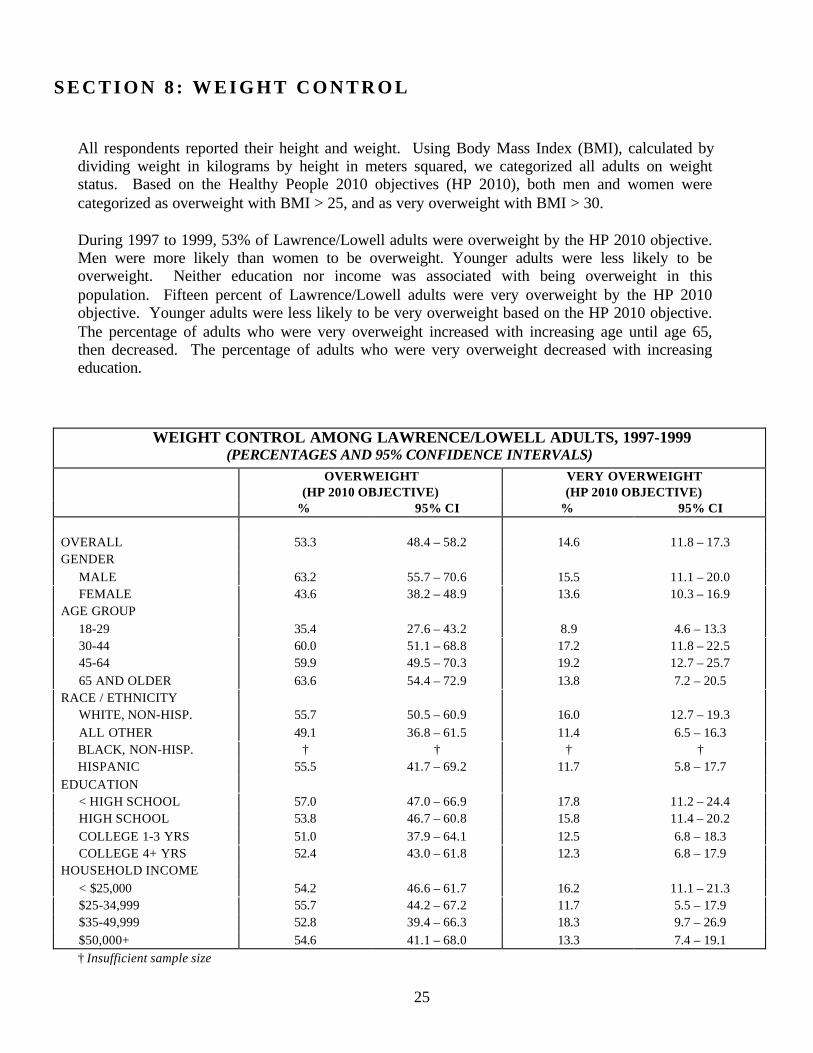
All respondents reported their height and weight. Using Body Mass Index (BMI), calculated by dividing weight in kilograms by height in meters squared, we categorized all adults on weight status. Based on the Healthy People 2010 objectives (HP 2010), both men and women were categorized as overweight with BMI > 25, and as very overweight with BMI > 30.
During 1997 to 1999, 53% of Lawrence/Lowell adults were overweight by the HP 2010 objective. Men were more likely than women to be overweight. Younger adults were less likely to be overweight. Neither education nor income was associated with being overweight in this population. Fifteen percent of Lawrence/Lowell adults were very overweight by the HP 2010 objective. Younger adults were less likely to be very overweight based on the HP 2010 objective. The percentage of adults who were very overweight increased with increasing age until age 65, then decreased. The percentage of adults who were very overweight decreased with increasing education.
WEIGHT CONTROL AMONG LAWRENCE/LOWELL ADULTS, 1997-1999 (PERCENTAGES AND 95% CONFIDENCE INTERVALS)
OVERWEIGHT (HP 2010 OBJECTIVE)
VERY OVERWEIGHT (HP 2010 OBJECTIVE)
% 95% CI % 95% CI
OVERALL 53.3 48.4 – 58.2 14.6 11.8 – 17.3 GENDER
MALE 63.2 55.7 – 70.6 15.5 11.1 – 20.0 FEMALE
AGE GROUP 18-29 30-44 45-64 65 AND OLDER
RACE / ETHNICITY WHITE, NON-HISP. ALL OTHER BLACK, NON-HISP. HISPANIC
EDUCATION < HIGH SCHOOL HIGH SCHOOL COLLEGE 1-3 YRS COLLEGE 4+ YRS
HOUSEHOLD INCOME < $25,000
43.6 38.2 – 48.9 13.6 10.3 – 16.9
35.4 27.6 – 43.2 8.9 4.6 – 13.3 60.0 51.1 – 68.8 17.2 11.8 – 22.5 59.9 49.5 – 70.3 19.2 12.7 – 25.7 63.6 54.4 – 72.9 13.8 7.2 – 20.5
55.7 50.5 – 60.9 16.0 12.7 – 19.3 49.1 36.8 – 61.5 11.4 6.5 – 16.3
† † † † 55.5 41.7 – 69.2 11.7 5.8 – 17.7
57.0 47.0 – 66.9 17.8 11.2 – 24.4 53.8 46.7 – 60.8 15.8 11.4 – 20.2 51.0 37.9 – 64.1 12.5 6.8 – 18.3 52.4 43.0 – 61.8 12.3 6.8 – 17.9
54.2 46.6 – 61.7 16.2 11.1 – 21.3 $25-34,999 55.7 44.2 – 67.2 11.7 5.5 – 17.9 $35-49,999 52.8 39.4 – 66.3 18.3 9.7 – 26.9 $50,000+ 54.6 41.1 – 68.0 13.3 7.4 – 19.1 † Insufficient sample size
25
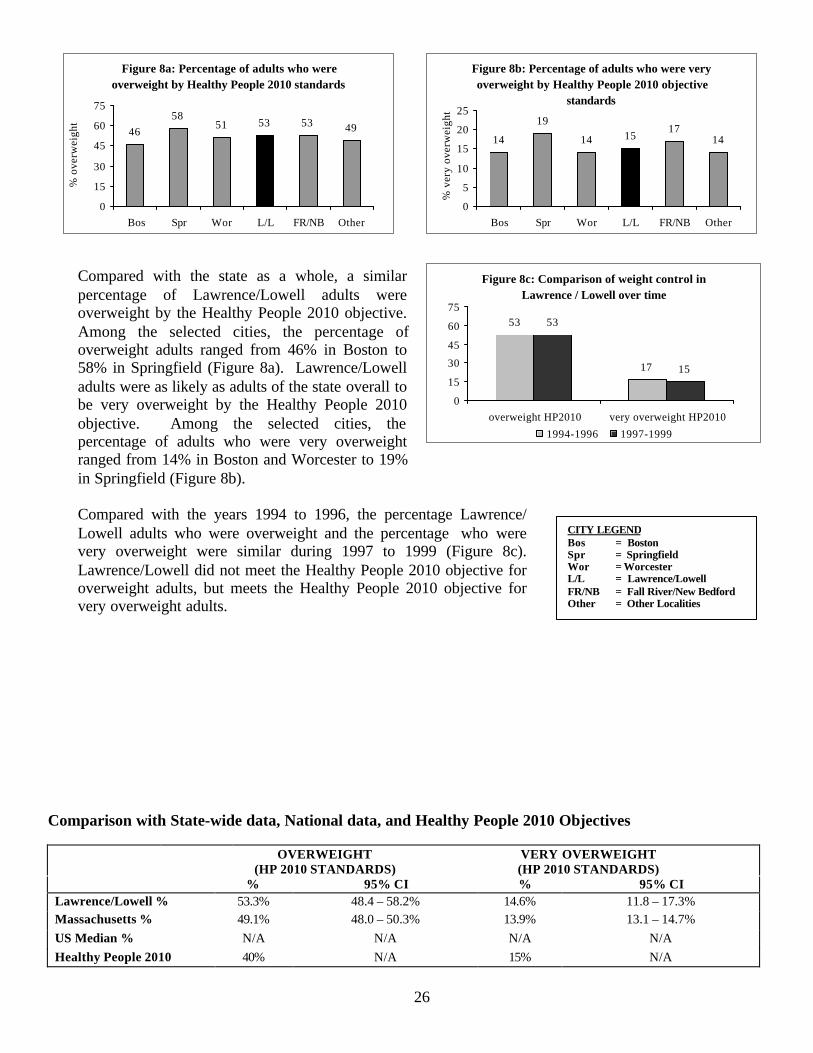
Figure 8a: Percentage of adults who were overweight by Healthy People 2010 standards
46 58
51 53 53 49
0
15
30
45
60
75
Bos Spr Wor L/L FR/NB Other
% o
verw
eigh
tFigure 8b: Percentage of adults who were very overweight by Healthy People 2010 objective
standards
14
19
14 15 17
14
0
5
10
15
20
25
Bos Spr Wor L/L FR/NB Other
% v
ery
over
wei
ght
Compared with the state as a whole, a similar percentage of Lawrence/Lowell adults were overweight by the Healthy People 2010 objective. Among the selected cities, the percentage of overweight adults ranged from 46% in Boston to 58% in Springfield (Figure 8a). Lawrence/Lowell adults were as likely as adults of the state overall to be very overweight by the Healthy People 2010 objective. Among the selected cities, the percentage of adults who were very overweight ranged from 14% in Boston and Worcester to 19% in Springfield (Figure 8b).
Figure 8c: Comparison of weight control in Lawrence / Lowell over time
53
17
53
15
0
15
30
45
60
75
overweight HP2010 very overweight HP2010
1994-1996 1997-1999
Compared with the years 1994 to 1996, the percentage Lawrence/ Lowell adults who were overweight and the percentage who were very overweight were similar during 1997 to 1999 (Figure 8c). Lawrence/Lowell did not meet the Healthy People 2010 objective for overweight adults, but meets the Healthy People 2010 objective for very overweight adults.
CITY LEGEND Bos = Spr = Wor = Worcester L/L = FR/NB = Other =
Boston Springfield
Lawrence/Lowell Fall River/New Bedford Other Localities
Comparison with State-wide data, National data, and Healthy People 2010 Objectives
OVERWEIGHT VERY OVERWEIGHT (HP 2010 STANDARDS) (HP 2010 STANDARDS)
% 95% CI % 95% CI Lawrence/Lowell % 53.3% 48.4 – 58.2% 14.6% 11.8 – 17.3% Massachusetts % 49.1% 48.0 – 50.3% 13.9% 13.1 – 14.7% US Median % N/A N/A N/A N/A Healthy People 2010 40% N/A 15% N/A
26
S E C T I O N 9 : H I G H B L O O D P R E S S U R E A W A R E N E S S
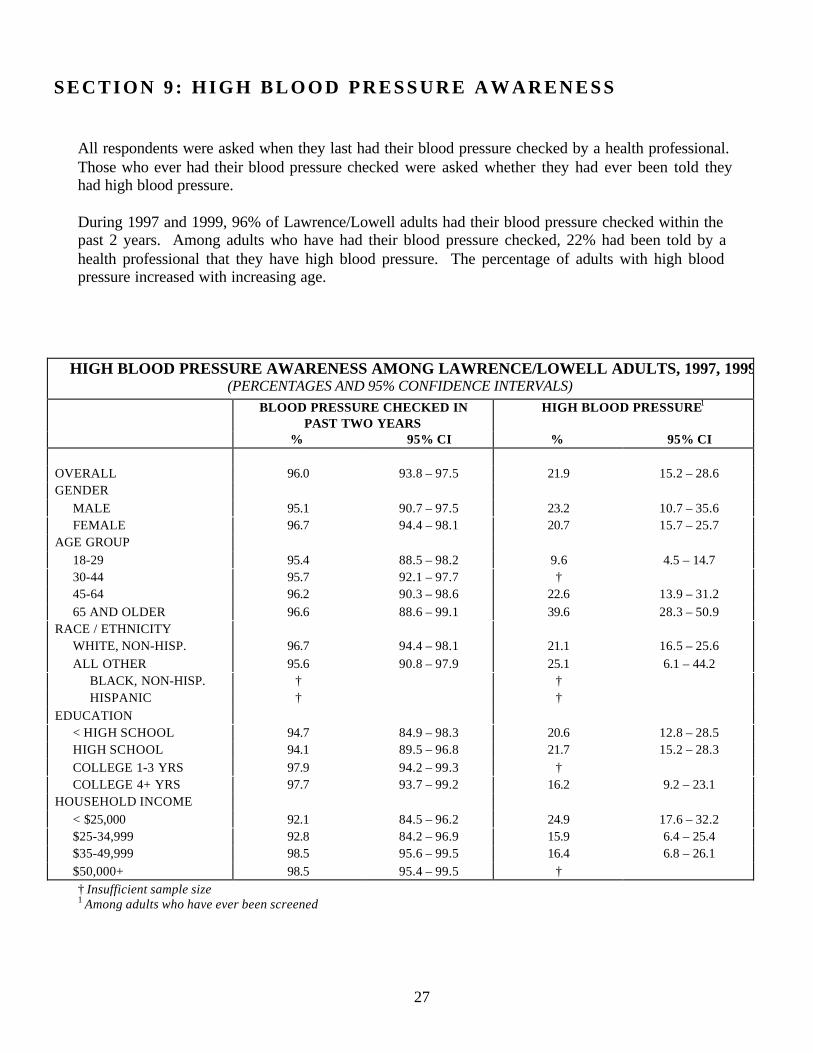
All respondents were asked when they last had their blood pressure checked by a health professional. Those who ever had their blood pressure checked were asked whether they had ever been told they had high blood pressure.
During 1997 and 1999, 96% of Lawrence/Lowell adults had their blood pressure checked within the past 2 years. Among adults who have had their blood pressure checked, 22% had been told by a health professional that they have high blood pressure. The percentage of adults with high blood pressure increased with increasing age.
HIGH BLOOD PRESSURE AWARENESS AMONG LAWRENCE/LOWELL ADULTS, 1997, 1999 (PERCENTAGES AND 95% CONFIDENCE INTERVALS)
BLOOD PRESSURE CHECKED IN PAST TWO YEARS
HIGH BLOOD PRESSURE1
% 95% CI % 95% CI
OVERALL 96.0 93.8 – 97.5 21.9 15.2 – 28.6 GENDER
MALE 95.1 90.7 – 97.5 23.2 10.7 – 35.6 FEMALE
AGE GROUP 18-29 30-44 45-64 65 AND OLDER
RACE / ETHNICITY WHITE, NON-HISP. ALL OTHER
BLACK, NON-HISP. HISPANIC
EDUCATION < HIGH SCHOOL HIGH SCHOOL COLLEGE 1-3 YRS COLLEGE 4+ YRS
HOUSEHOLD INCOME < $25,000
96.7 94.4 – 98.1 20.7 15.7 – 25.7
95.4 88.5 – 98.2 9.6 4.5 – 14.7 95.7 92.1 – 97.7 † 96.2 90.3 – 98.6 22.6 13.9 – 31.2 96.6 88.6 – 99.1 39.6 28.3 – 50.9
96.7 94.4 – 98.1 21.1 16.5 – 25.6 95.6 90.8 – 97.9 25.1 6.1 – 44.2
† † † †
94.7 84.9 – 98.3 20.6 12.8 – 28.5 94.1 89.5 – 96.8 21.7 15.2 – 28.3 97.9 94.2 – 99.3 † 97.7 93.7 – 99.2 16.2 9.2 – 23.1
92.1 84.5 – 96.2 24.9 17.6 – 32.2 $25-34,999 92.8 84.2 – 96.9 15.9 6.4 – 25.4 $35-49,999 98.5 95.6 – 99.5 16.4 6.8 – 26.1 $50,000+ 98.5 95.4 – 99.5 † † Insufficient sample size1 Among adults who have ever been screened
27

Figure 9a: Percentage of adults who have had their blood pressure checked in past 2 years
95 95 96 96 95 96
0 20
40 60
80 100
Bos Spr Wor L/L FR/NB Other
% B
P ch
eck
< 2
yrs
Figure 9b: Percentage of adults who were ever told they have high blood pressure
17 20 19
22 24
21
0
5
10
15
20
25
Bos Spr Wor L/L FR/NB Other
% h
igh
bloo
d pr
essu
re
Compared with the state as a whole, a similar percentage of Lawrence/Lowell adults have had their blood pressure checked in the past two years. Of the selected cities, the percentage of adults who have had their blood pressure checked in the past two years ranged from 95% in Boston, Springfield, and Fall River/New Bedford to 96% in Worcester and Lawrence/Lowell (Figure 9a). The percentage of adults with high blood pressure in Lawrence/ Lowell was similar to that of the state as a whole. Among the selected cities, the percentage of adults with high blood pressure ranged from 17% in Boston to 24% in Fall River/New Bedford (Figure 9b).
Figure 9c: Comparison of blood pressure awareness in Lawrence / Lowell over time
91
23
96
22
0 20 40 60 80
100
BP checked < 2 yrs high BP
1995 1997, 1999
Compared with 1995, the percentage of Lawrence/Lowell adults who have had their blood pressure checked in the past two years and the percentage who had high blood pressure were similar during 1997 and 1999 (Figure 9c). Lawrence/Lowell did not meet the Healthy People 2010 objective for percentage of adults with high blood pressure.
CITY LEGEND Bos = Spr = Wor = Worcester L/L = FR/NB = Other =
Boston Springfield
Lawrence/Lowell Fall River/New Bedford Other Localities
Comparison with State-wide data, National data, and Healthy People 2010 Objectives
BLOOD PRESSURE CHECKED, PAST TWO YEARS
HIGH BLOOD PRESSURE
% 95% CI % 95% CI Lawrence/Lowell % 96.0% 94.2 – 97.8% 21.9% 15.2 – 28.6% Massachusetts % 95.9% 95.4 – 96.5% 20.7% 19.6 – 21.8% US Median % 94.5% N/A 23.5% N/A Healthy People 2010 N/A N/A 16% N/A
28

S E C T I O N 1 0 : C H O L E S T E R O L A W A R E N E S S
All adults were asked if they had ever had their blood cholesterol checked, and if so, when the last time it was checked. Respondents who had ever had their cholesterol checked were also asked if a doctor or other health professional had ever told them that they had high cholesterol.
During 1997 and 1999, 71% of Lawrence/Lowell adults reported having had their blood cholesterol checked within the past 5 years. The percentage of adults who have had their blood cholesterol checked in the past five years increased with increasing age and education. Thirty-three percent of Lawrence/Lowell adults reported having been told that they had high cholesterol. The percentage of adults with high cholesterol increased with increasing age.
CHOLESTEROL AWARENESS AMONG LAWRENCE/LOWELL ADULTS, 1997, 1999 (PERCENTAGES AND 95% CONFIDENCE INTERVALS)
HAD BLOOD CHOLESTEROL CHECKED IN PAST 5 YEARS
EVER TOLD HAD HIGH CHOLESTEROL1
% 95% CI % 95% CI
OVERALL 71.2 66.0 – 76.4 33.1 24.6 – 41.7 GENDER
MALE FEMALE
AGE GROUP 18-29 30-44 45-64 65 AND OLDER
RACE / ETHNICITY WHITE, NON-HISP. ALL OTHER
BLACK, NON-HISP. HISPANIC
EDUCATION < HIGH SCHOOL HIGH SCHOOL COLLEGE 1-3 YRS COLLEGE 4+ YRS
HOUSEHOLD INCOME < $25,000 $25-34,999
66.7 57.4 – 76.0 34.3 18.1 – 50.6 75.6 70.5 – 80.7 32.1 24.6 – 39.7
54.4 43.7 – 65.0 16.4 6.9 – 25.9 69.4 60.3 – 78.5 † 82.1 69.8 – 94.4 32.0 18.3 – 45.7 85.5 77.9 – 93.1 47.4 35.2 – 59.5
75.5 69.7 – 81.4 32.2 25.4 – 38.9 61.4 49.0 – 73.8 †
† † 63.8 50.2 – 77.4 †
61.1 49.1 – 73.0 † 68.0 60.7 – 75.3 37.7 26.6 – 48.8 74.3 61.7 – 86.9 † 81.8 73.3 – 90.3 16.8 8.7 – 24.9
66.3 57.5 – 75.1 38.5 28.3 – 48.7 65.0 52.2 – 77.7 22.0 7.2 – 36.8
$35-49,999 78.5 68.0 – 89.0 † $50,000+ 81.3 70.3 – 92.4 † † Insufficient sample size1 Among respondents who had their cholesterol checked
29

Figure 10b: Percentage of adults who were ever told they have high cholesterol
21 23 25
33 32 28
0
10
20
30
40
50
Bos Spr Wor L/L FR/NB Other
% h
igh
chol
este
rol
Figure 10a: Percentage of adults who have had their cholesterol checked in past 5 years
76 69
77 71 72 77
0 15 30 45 60 75
Bos Spr Wor L/L FR/NB Other
% c
hole
ster
ol c
heck
pa
st 5
yrs
Compared with the state as a whole, a similar percentage of Lawrence/Lowell adults had their cholesterol checked in the past five years. Of the selected cities, the percentage of adults who had their cholesterol checked in the past five years ranged from 69% in Springfield to 77% in Worcester (Figure 10a). Lawrence/Lowell adults were as likely as adults of the state overall to have ever been told by a health professional that they have high cholesterol. High cholesterol in the selected cities ranged from 21% in Boston to 33% in Lowell / Lawrence (Figure 10b).
Figure 10c: Comparison of cholesterol awareness in Lawrence / Lowell over time
66
25
71
33
0 15 30 45 60 75
cholesterol check < 5 yrs high cholesterol
1995 1997, 1999
Compared with 1995, the percentage of Lawrence/Lowell adults who have had their cholesterol checked in the past five years and the percentage with high cholesterol were similar during 1997 and 1999 (Figure 10c). Lawrence/Lowell does not meet the Healthy People 2010 objectives for either cholesterol screening or percentage of adults with high cholesterol.
CITY LEGEND Bos = Spr = Wor = Worcester L/L = FR/NB = Other =
Boston Springfield
Lawrence/Lowell Fall River/New Bedford Other Localities
Comparison with State-wide data, National data, and Healthy People 2010 Objectives
HAD BLOOD CHOLESTEROL CHECKED IN PAST 5 YEARS
EVER TOLD HAD HIGH CHOLESTEROL
% 95% CI % 95% CI Lawrence/Lowell % 71.2% 66.0 – 76.4% 33.1% 24.6 – 41.7% Massachusetts % 76.1% 74.8 – 77.3% 27.0% 25.7 – 28.3% US Median % 69.2% N/A 29.4% N/A Healthy People 2010 80% N/A 16% N/A
30
S E C T I O N 1 1 : C O L O R E C T A L C A N C E R S C R E E N I N G
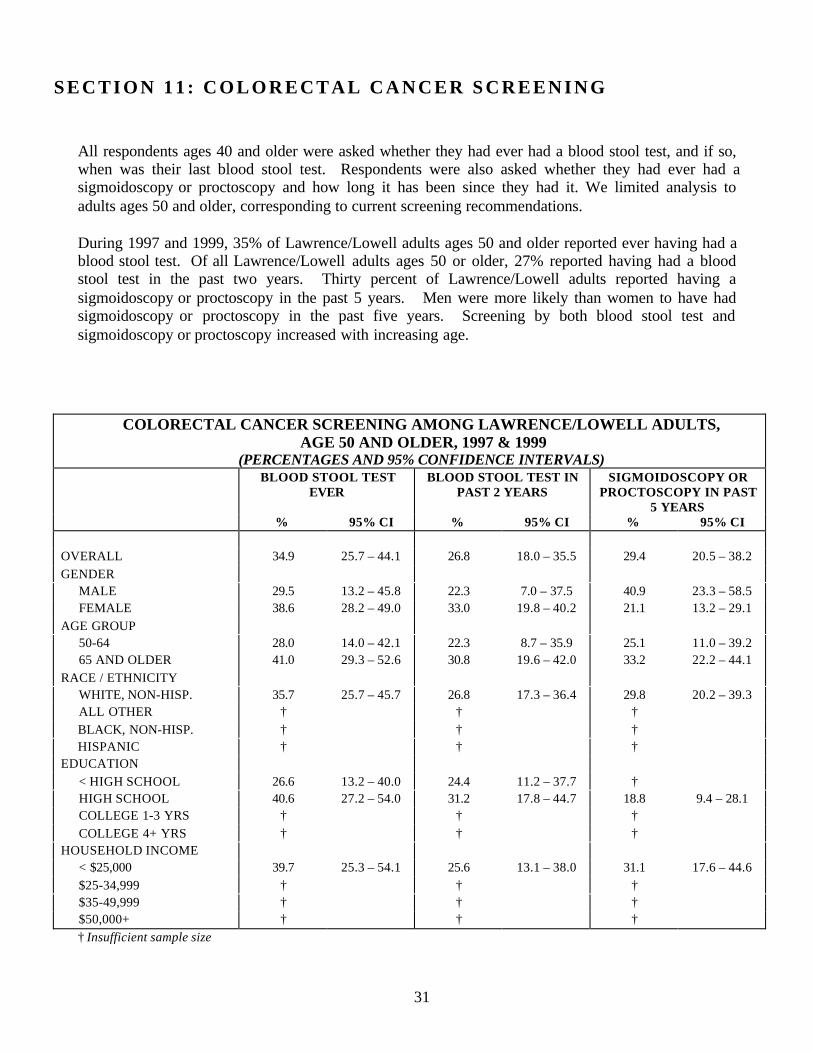
All respondents ages 40 and older were asked whether they had ever had a blood stool test, and if so, when was their last blood stool test. Respondents were also asked whether they had ever had a sigmoidoscopy or proctoscopy and how long it has been since they had it. We limited analysis to adults ages 50 and older, corresponding to current screening recommendations.
During 1997 and 1999, 35% of Lawrence/Lowell adults ages 50 and older reported ever having had a blood stool test. Of all Lawrence/Lowell adults ages 50 or older, 27% reported having had a blood stool test in the past two years. Thirty percent of Lawrence/Lowell adults reported having a sigmoidoscopy or proctoscopy in the past 5 years. Men were more likely than women to have had sigmoidoscopy or proctoscopy in the past five years. Screening by both blood stool test and sigmoidoscopy or proctoscopy increased with increasing age.
COLORECTAL CANCER SCREENING AMONG LAWRENCE/LOWELL ADULTS, AGE 50 AND OLDER, 1997 & 1999
(PERCENTAGES AND 95% CONFIDENCE INTERVALS) BLOOD STOOL TEST
EVER BLOOD STOOL TEST IN
PAST 2 YEARS SIGMOIDOSCOPY OR
PROCTOSCOPY IN PAST 5 YEARS
% 95% CI % 95% CI % 95% CI
OVERALL 34.9 25.7 – 44.1 26.8 18.0 – 35.5 29.4 20.5 – 38.2 GENDER
MALE FEMALE
AGE GROUP 50-64 65 AND OLDER
RACE / ETHNICITY WHITE, NON-HISP. ALL OTHER BLACK, NON-HISP. HISPANIC
EDUCATION < HIGH SCHOOL HIGH SCHOOL COLLEGE 1-3 YRS COLLEGE 4+ YRS
HOUSEHOLD INCOME < $25,000 $25-34,999
29.5 13.2 – 45.8 22.3 7.0 – 37.5 40.9 23.3 – 58.5 38.6 28.2 – 49.0 33.0 19.8 – 40.2 21.1 13.2 – 29.1
28.0 14.0 – 42.1 22.3 8.7 – 35.9 25.1 11.0 – 39.2 41.0 29.3 – 52.6 30.8 19.6 – 42.0 33.2 22.2 – 44.1
35.7 25.7 – 45.7 26.8 17.3 – 36.4 29.8 20.2 – 39.3 † † † † † † † † †
26.6 13.2 – 40.0 24.4 11.2 – 37.7 † 40.6 27.2 – 54.0 31.2 17.8 – 44.7 18.8 9.4 – 28.1
† † † † † †
39.7 25.3 – 54.1 25.6 13.1 – 38.0 31.1 17.6 – 44.6 † † †
$35-49,999 † † † $50,000+ † † † † Insufficient sample size
31

Figure 11a: Percentage of adults age 50 and older who have ever had a blood stool test
42 46 51
35 34 44
0
15
30
45
60
75
Bos Spr Wor L/L FR/NB Other
% e
ver
bloo
d st
ool t
est
Figure 11b: Percentage of adults age 50 and older who have had a blood stool test within past 2 years
34 36 41
27 28 35
0
10
20
30
40
50
Bos Spr Wor L/L FR/NB Other
% b
lood
sto
ol te
st
< 5
yrs
Figure 11c: Percentage of adults age 50 or older who have had sigmoidoscopy or proctoscopy
within past 5 years
33 28
33 29 26
35
0
10
20
30
40
50
Bos Spr Wor L/L FR/NB Other
% s
igm
oido
scop
y or
pr
octo
scop
y <
5 yr
s
Figure 11d: Comparison of colorectal cancer screening in Lawrence / Lowell over time
22 35
27 29
****** 0
15 30 45 60 75
ever blood stool test
blood stool test < 5 yrs
sigmoidoscopy or proctoscopy < 5
yrs1995 1997, 1999
*** Data not available for 1994-1996 Compared with the state as a whole, a similar percentage of Lawrence/ Lowell adults ages 50 and older have ever had a blood stool test. Among the selected cities, the percentage of adults ages 50 and older having had a blood stool test ranged from 34% in Fall River/New Bedford to 51% in Worcester (Figure 11a). Lawrence/Lowell adults ages 50 and older were about as likely to have had a blood stool test in the past two years as the state overall. Among the selected cities, the percentage of adults ages 50 and older who have had a blood stool test in the past two years ranged from 27% in Lowell / Lawrence to 41% in Worcester (Figure 11b). The percentage of Lawrence/Lowell adults ages 50 and older who have ever had sigmoidoscopy or proctoscopy in the past five years was similar to that of the state as a whole. Among the selected cities, the percentage of adults ages 50 and older who have had sigmoidoscopy or proctoscopy in the past five years ranged from 26% in Fall River/New Bedford to 33% in Boston and Worcester (Figure 11c).
CITY LEGEND Bos = Spr = Wor = Worcester L/L = FR/NB = Other =
Boston Springfield
Lawrence/Lowell Fall River/New Bedford Other Localities
Compared with 1995, the percentage of Lawrence/Lowell adults who have had a sigmoidoscopy or proctoscopy in the past 5 years was similar during 1997 and 1999 (Figure 11d). Lawrence/Lowell did not meet the Healthy People 2010 objective for the percentage of adults who have had a blood stool test in the past two years.
Comparison with State-wide data, National data, and Healthy People 2010 Objectives
BLOOD STOOL TEST EVER
BLOOD STOOL TEST IN PAST 2 YEARS
SIGMOIDOSCOPY OR PROCTOSCOPY PAST 5 YEARS
% 95% CI % 95% CI % 95% CI Lawrence/Lowell % 34.9% 25.7 – 44.1 26.8% 18.0 – 35.5 29.4% 20.5 – 38.2 Massachusetts % 43.5% 41.3 – 45.7 34.1% 32.0 – 36.2 33.9% 31.8 – 36.1 US Median % 30.7% N/A 25.1% N/A N/A N/A Healthy People 2010 N/A N/A 50% N/A N/A N/A
32

S E C T I O N 1 2 : C H R O N I C D I S E A S E
All respondents were asked if they had ever been told by a doctor that they have diabetes or heart disease. Women who had diabetes only during pregnancy were considered to not have diabetes. All women age 45 and older were asked if they had ever been told that they had osteoporosis.
During 1997 to 1999, 7% of Lawrence/Lowell adults had been told by a doctor that they have diabetes. Younger adults and adults of higher income were less likely to have ever been diagnosed with diabetes. Hispanics were less likely than White non-Hispanics to have been diagnosed with diabetes. Overall, 6% of Lawrence/Lowell adults had been told they have heart disease. Adults ages 45 or older were more likely to have heart disease. Fifteen percent of Lawrence/Lowell women ages 45 and older had been told they have osteoporosis. The percentage of women with osteoporosis increased with increasing age.
CHRONIC DISEASE AMONG LAWRENCE/LOWELL ADULTS, 1997-1999 (PERCENTAGES AND 95% CONFIDENCE INTERVALS)
DIABETES, ALL ADULTS
HEART DISEASE, ALL ADULTS
OSTEOPOROSIS 1 , WOMEN, AGE 45+
% 95% CI % 95% CI % 95% CI
OVERALL 7.0 4.8 – 9.3 6.2 3.9 – 8.4 14.6 4.8 – 24.5 GENDER
MALE FEMALE
AGE GROUP 18-29 30-44 45-64 65 AND OLDER
RACE / ETHNICITY WHITE, NON-HISP. ALL OTHER BLACK, NON-HISP. HISPANIC
EDUCATION < HIGH SCHOOL HIGH SCHOOL COLLEGE 1-3 YRS COLLEGE 4+ YRS
HOUSEHOLD INCOME < $25,000 $25-34,999
6.1 2.6 – 9.6 4.9 2.2 – 7.5 ** ** 7.9 5.0 – 10.9 7.5 4.0 – 11.1 14.6 4.8 – 24.5
0.4 0.0 – 1.3 0.7 0.0 – 1.5 ** ** 3.3 0.2 – 6.3 2.4 0.0 – 5.2 ** ** 17.5 9.8 – 25.2 7.9 3.3 – 12.5 5.7 0.1 – 11.3 12.9 6.8 – 19.0 19.5 10.0 – 29.0 25.1 7.0 – 43.1
8.5 5.5 – 11.4 7.0 4.3 – 9.7 14.8 4.3 – 25.3 3.4 1.2 – 5.7 3.4 0.4 – 6.5 † † † †
3.6 1.0 – 6.2 4.5 0.2 – 8.8 †
8.5 4.2 – 12.9 5.1 0.9 – 9.3 † 6.9 3.4 – 10.3 8.7 4.0 – 13.5 10.5 0.0 – 25.6 5.2 1.4 – 9.0 5.5 1.6 – 9.3 † 8.4 1.7 – 15.2 3.7 0.3 – 7.1 †
10.8 6.2 – 15.4 6.8 3.3 – 10.3 10.1 1.1 – 19.2 11.6 1.7 – 21.5 10.2 1.6 – 18.7 †
$35-49,999 4.0 0.0 – 8.0 3.4 0.0 – 6.8 † $50,000+ 2.5 0.0 – 5.4 2.2 0.0 – 4.8 †
† Insufficient sample size1 Data available for 1997 and 1998 only.
33

Figure 12a: Percentage of adults who have ever been diagnosed with diabetes
4 6
4 7 7
4
0
5
10
15
20
25
Bos Spr Wor L/L FR/NB Other
% d
iabe
tes
Figure 12b: Percentage of adults who were ever told they have heart disease
5 5 8
6 8
6
0
5
10
15
20
25
Bos Spr Wor L/L FR/NB Other
% h
eart
dis
ease
Figure 12c: Percentage of women age 45 or older who have osteoporosis
9 12 13
15 13
11
0
5
10
15
20
25
Bos Spr Wor L/L FR/NB Other
% o
steo
poro
sis,
w
omen
45+
Figure 12d: Comparison of chronic disease in Lawrence / Lowell over time
6 87 6
15
*** 0
5
10
15
20
25
diabetes heart disease osteoporosis, women 45+
1994-1996 1997-1999
*** Data unavailable for 1994-1996 Compared with the state as a whole, Lawrence/Lowell adults were more likely to have diabetes. Among the selected cities, the percentage of adults with diabetes ranged from 4% in Boston and Worcester to 7% in Fall River/New Bedford and Lawrence/Lowell (Figure 12a). Compared with the state as a whole, a similar percentage of Lawrence/ Lowell adults had heart disease. Among the selected cities, the percentage of adults with heart disease ranged from 5% in Boston and Springfield to 8% in Worcester and Fall River/ New Bedford (Figure 12b). Compared with the state as a whole, a similar percentage of Lawrence/Lowell women age 45 and older had osteoporosis. Among the selected cities, the percentage of women age 45 or older who have osteoporosis ranged from 9% in Boston to 15% in Lawrence/Lowell (Figure 12c).
CITY LEGEND Bos = Spr = Wor = Worcester L/L = FR/NB = Other =
Boston Springfield
Lawrence/Lowell Fall River/New Bedford Other Localities
Compared with 1994 to 1996, the percentage of Lawrence/Lowell adults with diabetes and the percentage with heart disease were similar during 1997 to 1999 (Figure 12d). Osteoporosis data were unavailable for 1994 to 1996. Lawrence/Lowell did not meet the Healthy People 2010 objective for diabetes.
Comparison with State-wide data, National data, and Healthy People 2010 Objectives
DIABETES, ALL ADULTS
HEART DISEASE, ALL ADULTS
OSTEOPOROSIS 1 , ALL WOMEN
% 95% CI % 95% CI % 95% CI Lawrence/Lowell % 7.0% 4.8 – 9.3% 6.2% 3.9 – 8.4% 14.6% 4.8 – 24.5% Massachusetts % 4.4% 4.0 – 4.9% 6.2% 5.4 – 6.9% 11.4% 9.5 – 13.4% US Median % 5.2% N/A N/A N/A N/A N/A Healthy People 2010 2.5% N/A N/A N/A N/A N/A
34

S E C T I O N 1 3 : D I S A B I L I T Y A N D L I M I T A T I O N S
All respondents were asked about their disabilities and activity limitations. Respondents were defined as having a limitation or disability if they had an impairment or health problem that limited activities or caused cognitive difficulties, if they used special equipment or help from others to get around, or if they said they had a disability of any kind. Individuals who reported a limitation or disability were asked how long they had the impairment and if they needed help in handling routine needs or personal care.
During 1997 to 1999, 19% of Lawrence/Lowell adults reported having a disability or limitation for at least one year. Adults ages 18 to 29 were less likely to have a disability or limitation. Adults of lower income or less than a high school education were more likely to have a disability. Seven percent of Lawrence/Lowell adults reported having a limitation or disability that required help with daily activities. The percentage of adults with disability and in need of help with daily activities increased with increasing age. Adults of lower education or income were more likely to have a disability or limitation and need help with daily activities.
DISABILITY AND LIMITATIONS AMONG LAWRENCE/LOWELL ADULTS, 1997-1999 (PERCENTAGES AND 95% CONFIDENCE INTERVALS)
WITH DISABILITY OR LIMITATION WITH DISABILITY OR LIMITATION AND NEED HELP WITH ACTIVITIES
% 95% CI % 95% CI
OVERALL 18.8 15.4 – 22.2 7.2 5.2 – 9.3 GENDER
MALE FEMALE
AGE GROUP 18-29 30-44 45-64 65 AND OLDER
RACE / ETHNICITY WHITE, NON-HISP. ALL OTHER
BLACK, NON-HISP. HISPANIC
EDUCATION < HIGH SCHOOL HIGH SCHOOL COLLEGE 1-3 YRS COLLEGE 4+ YRS
HOUSEHOLD INCOME < $25,000 $25-34,999 $35-49,999
20.0 14.5 – 25.6 6.1 3.1 – 9.1 17.7 13.6 – 21.7 8.3 5.5 – 11.1
8.1 3.8 – 12.4 1.6 0.0 – 3.2 18.0 11.8 – 24.2 6.1 2.3 – 9.9 17.8 11.6 – 24.1 9.4 5.0 – 13.8 40.2 30.3 – 50.1 15.9 8.8 – 22.9
20.7 16.7 – 24.7 7.6 5.1 – 10.1 14.2 8.2 – 20.2 6.4 2.7 – 10.0
† † 13.5 6.5 – 20.4 6.1 2.0 – 10.3
32.4 23.4 – 41.4 17.3 10.7 – 23.9 16.3 11.3 – 21.3 6.3 3.2 – 9.4 19.4 11.6 – 27.3 5.4 1.6 – 9.3 11.8 5.7 – 17.9 3.1 0.0 – 7.0
30.2 22.9 – 37.6 11.7 7.1 – 16.4 17.0 8.1 – 25.9 4.8 0.0 – 10.5 13.5 5.9 – 21.2 0.8 0.0 – 2.1
$50,000+ 7.7 3.0 – 12.3 1.4 0.0 – 3.2 † Insufficient sample size
35

Figure 13a: Percentage of adults who have a disability or limitation
16 18 19 19
22
16
0
5
10
15
20
25
Bos Spr Wor L/L FR/NB Other
% d
isab
ility
or
limita
tion
Figure 13b: Percentage of adults who have a disability/limitation and need help with activities
4 4 5 7
9 5
0
5
10
15
20
25
Bos Spr Wor L/L FR/NB Other
% w
ith d
isab
ility
&
nee
d he
lp
Compared with the state as a whole, a similar percentage of Lawrence/Lowell adults have some type of disability or limitation. Of the selected cities, the percentage of adults with a disability or limitation ranged from 16% in Boston to 22% in Fall River/New Bedford (Figure 13a). Compared with the state as a whole, adults in Lawrence/Lowell were more likely to have a disability and need help with their daily activities. Among the selected cities, the percentage of adults who have a disability or limitation and need help with their daily activities ranged from 4% in Boston and Springfield to 9% in Fall River/New Bedford (Figure 13b).
Disability and limitation data are not available for 1994 to 1996.
CITY LEGEND Bos = Spr = Wor = Worcester L/L = FR/NB = Other =
Boston Springfield
Lawrence/Lowell Fall River/New Bedford Other Localities
Comparison with State-wide data, National data, and Healthy People 2010 Objectives
WITH DISABILITY OR LIMITATION
WITH DISABILITY OR LIMITATION AND NEED HELP WITH ACTIVITIES
% 95% CI % 95% CI Lawrence/Lowell % 18.8% 15.4 – 22.2% 7.2% 5.2 – 9.3% Massachusetts % 16.4% 15.6 – 17.3% 4.8% 4.3 – 5.3% US Median % N/A N/A N/A N/A Healthy People 2010 N/A N/A N/A N/A
36
S E C T I O N 1 4 : B R E A S T C A N C E R S C R E E N I N G
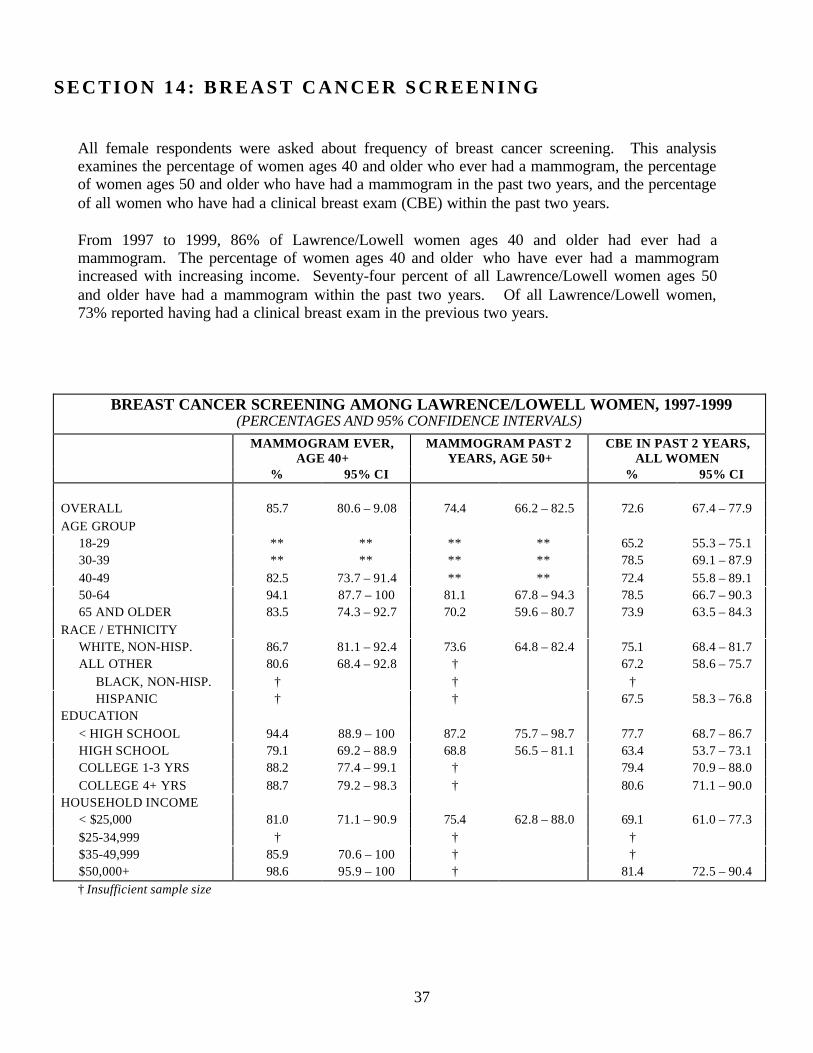
All female respondents were asked about frequency of breast cancer screening. This analysis examines the percentage of women ages 40 and older who ever had a mammogram, the percentage of women ages 50 and older who have had a mammogram in the past two years, and the percentage of all women who have had a clinical breast exam (CBE) within the past two years.
From 1997 to 1999, 86% of Lawrence/Lowell women ages 40 and older had ever had a mammogram. The percentage of women ages 40 and older who have ever had a mammogram increased with increasing income. Seventy-four percent of all Lawrence/Lowell women ages 50 and older have had a mammogram within the past two years. Of all Lawrence/Lowell women, 73% reported having had a clinical breast exam in the previous two years.
BREAST CANCER SCREENING AMONG LAWRENCE/LOWELL WOMEN, 1997-1999 (PERCENTAGES AND 95% CONFIDENCE INTERVALS)
MAMMOGRAM EVER, AGE 40+
MAMMOGRAM PAST 2 YEARS, AGE 50+
CBE IN PAST 2 YEARS, ALL WOMEN
% 95% CI % 95% CI
OVERALL 85.7 80.6 – 9.08 74.4 66.2 – 82.5 72.6 67.4 – 77.9 AGE GROUP
18-2930-3940-4950-6465 AND OLDER
RACE / ETHNICITY WHITE, NON-HISP. ALL OTHER
BLACK, NON-HISP. HISPANIC
EDUCATION < HIGH SCHOOL HIGH SCHOOL COLLEGE 1-3 YRS COLLEGE 4+ YRS
HOUSEHOLD INCOME < $25,000 $25-34,999
** ** ** ** 65.2 55.3 – 75.1 ** ** ** ** 78.5 69.1 – 87.9
82.5 73.7 – 91.4 ** ** 72.4 55.8 – 89.1 94.1 87.7 – 100 81.1 67.8 – 94.3 78.5 66.7 – 90.3 83.5 74.3 – 92.7 70.2 59.6 – 80.7 73.9 63.5 – 84.3
86.7 81.1 – 92.4 73.6 64.8 – 82.4 75.1 68.4 – 81.7 80.6 68.4 – 92.8 † 67.2 58.6 – 75.7
† † † † † 67.5 58.3 – 76.8
94.4 88.9 – 100 87.2 75.7 – 98.7 77.7 68.7 – 86.7 79.1 69.2 – 88.9 68.8 56.5 – 81.1 63.4 53.7 – 73.1 88.2 77.4 – 99.1 † 79.4 70.9 – 88.0 88.7 79.2 – 98.3 † 80.6 71.1 – 90.0
81.0 71.1 – 90.9 75.4 62.8 – 88.0 69.1 61.0 – 77.3 † † †
$35-49,999 85.9 70.6 – 100 † † $50,000+ 98.6 95.9 – 100 † 81.4 72.5 – 90.4 † Insufficient sample size
37

Figure 14a: Percentage of women age 40 or older who have ever had a mammogram
90 92 90 86 90 91
0
20
40
60
80
100
Bos Spr Wor L/L FR/NB Other
% e
ver
mam
mog
ram
, 40
+
Figure 14b: Percentage of women age 50 or older who have had a mammogram in the past two years
85 82 82 74
85 83
0
20
40
60
80
100
Bos Spr Wor L/L FR/NB Other % m
amm
ogra
m <
2 y
rs, a
ge
50+
Figure 14c: Percentage of women, all ages, who have had a clinical breast exam in the past 2 years
84 78 82 73 78 83
0
20
40
60
80
100
Bos Spr Wor L/L FR/NB Other
% e
ver
CB
E, a
ge 5
0+
Figure 14d: Comparison of breast cancer screening in Lawrence / Lowell over time
80 68 71
86 74 73
0 20 40 60 80
100
ever mammogram, 40+
mammogram < 2 yrs, 50+
CBE < 2 years
1994-1996 1997-1999
Compared with the state as a whole, Lawrence/ Lowell women ages 40and older were less likely to have had a mammogram. Among theselected cities, the percentage of women ages 40 and older who had amammogram ranged from 86% in Lawrence/Lowell to 92% inSpringfield (Figure 14a). Compared with the state as a whole,Lawrence/Lowell women ages 50 and older were less likely to havehad a mammogram in the past two years.The percentage of women ages 50 and older who had a mammogram in the past two years ranged from74% in Lawrence/Lowell to 85% in Boston and Fall River/New Bedford (Figure 14b). Compared with thestate as a whole, Lawrence/Lowell women were less likely to have had a clinical breast exam in the pasttwo years. Among the selected cities, the percentage of women who have had a clinical breast exam in thepast two years ranged from 73% in Lawrence/Lowell to 84% in Boston (Figure 14c).
CITY LEGEND Bos = Spr = Wor = Worcester L/L = FR/NB = Other =
Boston Springfield
Lawrence/Lowell Fall River/New Bedford Other Localities
Compared with 1994 to 1996, the percentage of Lawrence/Lowell women ages 40 and older who ever hada mammogram, ages 50 and older who had a mammogram in the past two years, or all ages who had aclinical breast exam in the past two years were similar during 1997 to 1999 (Figure 14d).
Comparison with State-wide data, National data, and Healthy People 2010 Objectives
MAMMOGRAM EVER, AGE 40+ MAMMOGRAM IN PAST TWO YEARS, AGE 50+
CBE IN PAST 2 YEARS, ALL WOMEN
% 95% CI % 95% CI % 95% CI Lawrence/Lowell % 85.7% 80.6 – 90.8% 74.4% 66.2 – 82.5% 72.6% 67.4 – 77.9% Massachusetts % 90.5% 89.4 – 91.5% 82.8% 81.1 – 84.5% 82.8% 81.6 – 83.9% US Median % 84.7% N/A 75.2% N/A 76.9% N/A Healthy People 2010 N/A N/A N/A N/A N/A N/A
38
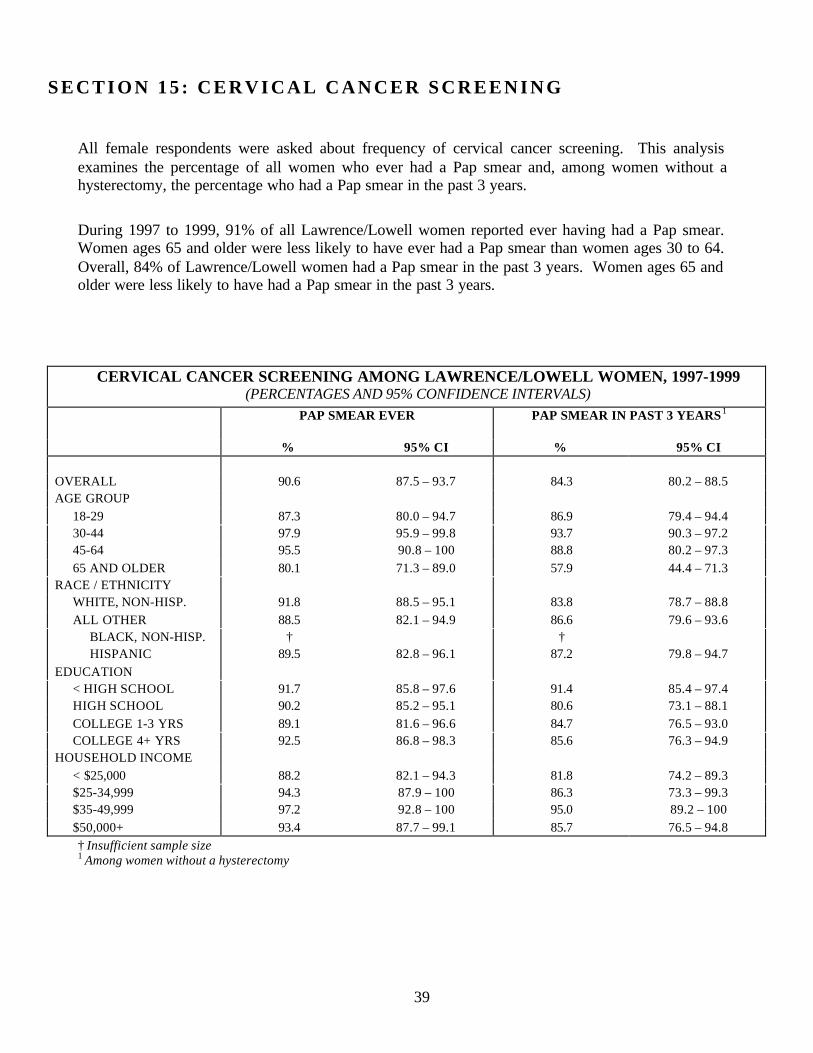
S E C T I O N 1 5 : C E R V I C A L C A N C E R S C R E E N I N G
All female respondents were asked about frequency of cervical cancer screening. This analysis examines the percentage of all women who ever had a Pap smear and, among women without a hysterectomy, the percentage who had a Pap smear in the past 3 years.
During 1997 to 1999, 91% of all Lawrence/Lowell women reported ever having had a Pap smear. Women ages 65 and older were less likely to have ever had a Pap smear than women ages 30 to 64. Overall, 84% of Lawrence/Lowell women had a Pap smear in the past 3 years. Women ages 65 and older were less likely to have had a Pap smear in the past 3 years.
CERVICAL CANCER SCREENING AMONG LAWRENCE/LOWELL WOMEN, 1997-1999 (PERCENTAGES AND 95% CONFIDENCE INTERVALS)
PAP SMEAR EVER PAP SMEAR IN PAST 3 YEARS 1
% 95% CI % 95% CI
OVERALL 90.6 87.5 – 93.7 84.3 80.2 – 88.5 AGE GROUP
18-29 87.3 80.0 – 94.7 86.9 79.4 – 94.4 30-4445-6465 AND OLDER
RACE / ETHNICITY WHITE, NON-HISP. ALL OTHER
BLACK, NON-HISP. HISPANIC
EDUCATION < HIGH SCHOOL HIGH SCHOOL COLLEGE 1-3 YRS COLLEGE 4+ YRS
HOUSEHOLD INCOME < $25,000
97.9 95.9 – 99.8 93.7 90.3 – 97.2 95.5 90.8 – 100 88.8 80.2 – 97.3 80.1 71.3 – 89.0 57.9 44.4 – 71.3
91.8 88.5 – 95.1 83.8 78.7 – 88.8 88.5 82.1 – 94.9 86.6 79.6 – 93.6
† † 89.5 82.8 – 96.1 87.2 79.8 – 94.7
91.7 85.8 – 97.6 91.4 85.4 – 97.4 90.2 85.2 – 95.1 80.6 73.1 – 88.1 89.1 81.6 – 96.6 84.7 76.5 – 93.0 92.5 86.8 – 98.3 85.6 76.3 – 94.9
88.2 82.1 – 94.3 81.8 74.2 – 89.3 $25-34,999 94.3 87.9 – 100 86.3 73.3 – 99.3 $35-49,999 97.2 92.8 – 100 95.0 89.2 – 100 $50,000+ 93.4 87.7 – 99.1 85.7 76.5 – 94.8 † Insufficient sample size1 Among women without a hysterectomy
39
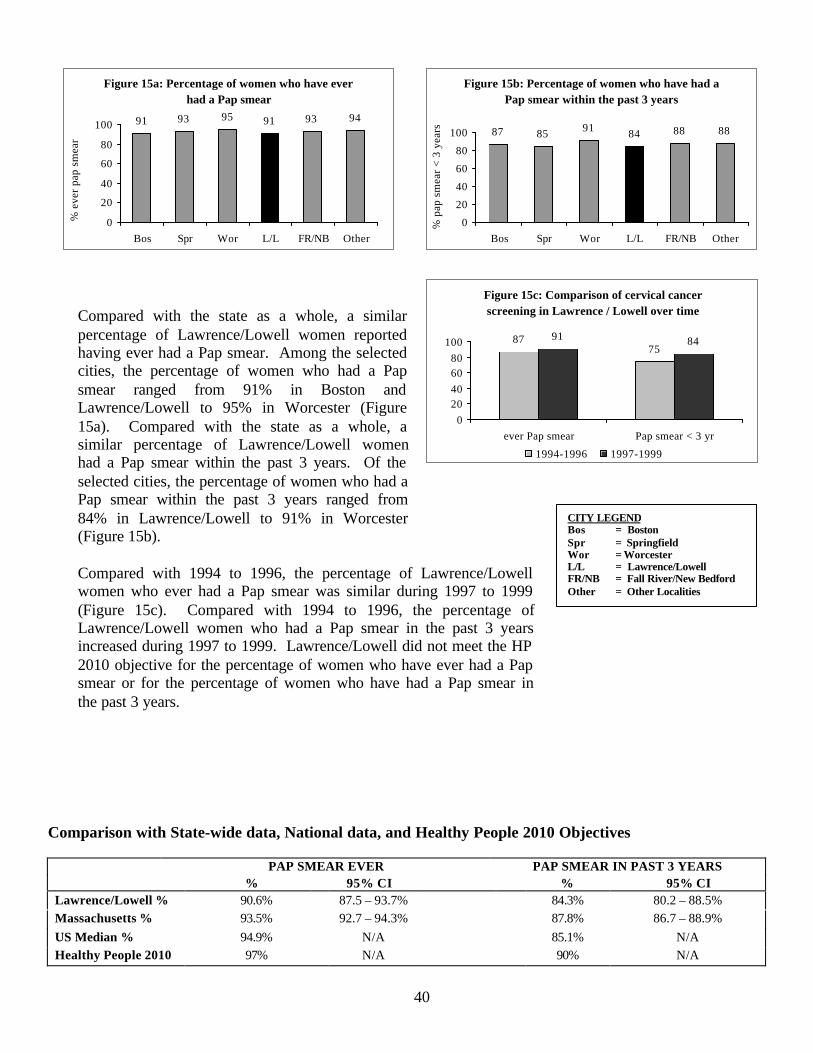
Figure 15a: Percentage of women who have ever had a Pap smear
91 93 95 91 93 94
0
20
40
60
80
100
Bos Spr Wor L/L FR/NB Other
% e
ver
pap
smea
rFigure 15b: Percentage of women who have had a
Pap smear within the past 3 years
87 85 91 84 88 88
0
20
40
60
80
100
Bos Spr Wor L/L FR/NB Other
% p
ap s
mea
r <
3 ye
ars
Compared with the state as a whole, a similar percentage of Lawrence/Lowell women reported having ever had a Pap smear. Among the selected cities, the percentage of women who had a Pap smear ranged from 91% in Boston and Lawrence/Lowell to 95% in Worcester (Figure 15a). Compared with the state as a whole, a similar percentage of Lawrence/Lowell women had a Pap smear within the past 3 years. Of the selected cities, the percentage of women who had a Pap smear within the past 3 years ranged from 84% in Lawrence/Lowell to 91% in Worcester (Figure 15b).
Figure 15c: Comparison of cervical cancer screening in Lawrence / Lowell over time
87 75
91 84
0 20 40 60 80
100
ever Pap smear Pap smear < 3 yr
1994-1996 1997-1999
Compared with 1994 to 1996, the percentage of Lawrence/Lowell women who ever had a Pap smear was similar during 1997 to 1999 (Figure 15c). Compared with 1994 to 1996, the percentage of Lawrence/Lowell women who had a Pap smear in the past 3 years increased during 1997 to 1999. Lawrence/Lowell did not meet the HP 2010 objective for the percentage of women who have ever had a Pap smear or for the percentage of women who have had a Pap smear in the past 3 years.
CITY LEGEND Bos = Spr = Wor = Worcester L/L = FR/NB = Other =
Boston Springfield
Lawrence/Lowell Fall River/New Bedford Other Localities
Comparison with State-wide data, National data, and Healthy People 2010 Objectives
PAP SMEAR EVER PAP SMEAR IN PAST 3 YEARS % 95% CI % 95% CI
Lawrence/Lowell % 90.6% 87.5 – 93.7% 84.3% 80.2 – 88.5% Massachusetts % 93.5% 92.7 – 94.3% 87.8% 86.7 – 88.9% US Median % 94.9% N/A 85.1% N/A Healthy People 2010 97% N/A 90% N/A
40
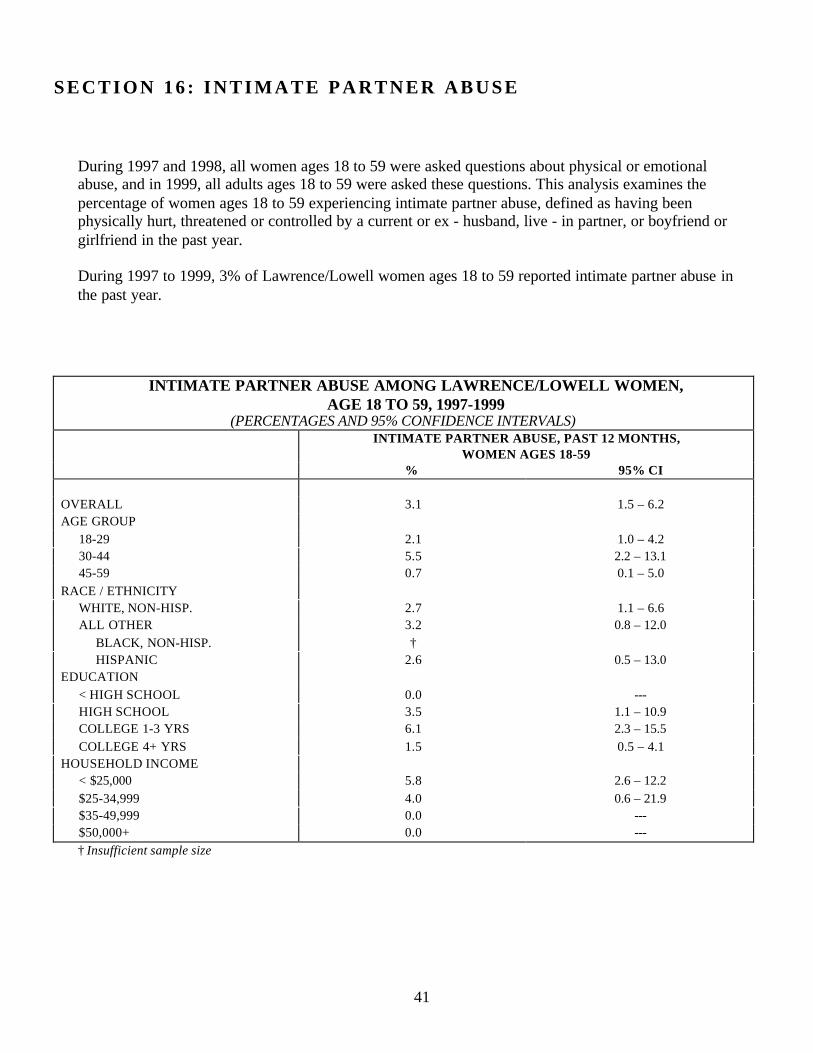
---
------
S E C T I O N 1 6 : I N T I M A T E P A R T N E R A B U S E
During 1997 and 1998, all women ages 18 to 59 were asked questions about physical or emotional abuse, and in 1999, all adults ages 18 to 59 were asked these questions. This analysis examines the percentage of women ages 18 to 59 experiencing intimate partner abuse, defined as having been physically hurt, threatened or controlled by a current or ex - husband, live - in partner, or boyfriend or girlfriend in the past year.
During 1997 to 1999, 3% of Lawrence/Lowell women ages 18 to 59 reported intimate partner abuse in the past year.
INTIMATE PARTNER ABUSE AMONG LAWRENCE/LOWELL WOMEN, AGE 18 TO 59, 1997-1999
(PERCENTAGES AND 95% CONFIDENCE INTERVALS) INTIMATE PARTNER ABUSE, PAST 12 MONTHS,
WOMEN AGES 18-59 % 95% CI
OVERALL 3.1 1.5 – 6.2 AGE GROUP
18-29 2.1 1.0 – 4.2 30-44 45-59
RACE / ETHNICITY WHITE, NON-HISP. ALL OTHER
BLACK, NON-HISP. HISPANIC
EDUCATION < HIGH SCHOOL HIGH SCHOOL COLLEGE 1-3 YRS COLLEGE 4+ YRS
HOUSEHOLD INCOME < $25,000 $25-34,999
5.5 2.2 – 13.1 0.7 0.1 – 5.0
2.7 1.1 – 6.6 3.2 0.8 – 12.0 †
2.6 0.5 – 13.0
0.03.5 1.1 – 10.96.1 2.3 – 15.51.5 0.5 – 4.1
5.8 2.6 – 12.2 4.0 0.6 – 21.9
$35-49,999 0.0 $50,000+ 0.0 † Insufficient sample size
41

CITY LEGEND Bos = Spr = Wor = Worcester L/L = FR/NB = Other =
Figure 16a: Percentage of adults who have eperienced intimate partner abuse in the past
year
6
10 8
3 6 5
0
5
10
15
20
25
Bos Spr Wor L/L FR/NB Other
% in
timat
e pa
rtne
r ab
use
Boston Springfield
Lawrence/Lowell Fall River/New Bedford Other Localities
Compared with the state as a whole, Lawrence/ Lowell women ages 18 to 59 were less likely to have had experienced intimate partner abuse in the past 12 months. Of the selected cities, the percentage of women ages 18 to 59 who have experienced partner abuse in the past year ranged from 3% in Lawrence/Lowell to 10% in Springfield (Figure 16a).
Data regarding intimate partner abuse is not available for 1994 to 1996.
Comparison with State-wide data, National data, and Healthy People 2010 Objectives
INTIMATE PARTNER ABUSE, PAST 12 MONTHS WOMEN AGES 18-59
% 95% CI Lawrence/Lowell % 3.1% 1.4 – 4.9% Massachusetts % 5.5% 4.6 – 6.4% US Median % N/A N/A Healthy People 2010 N/A N/A
42
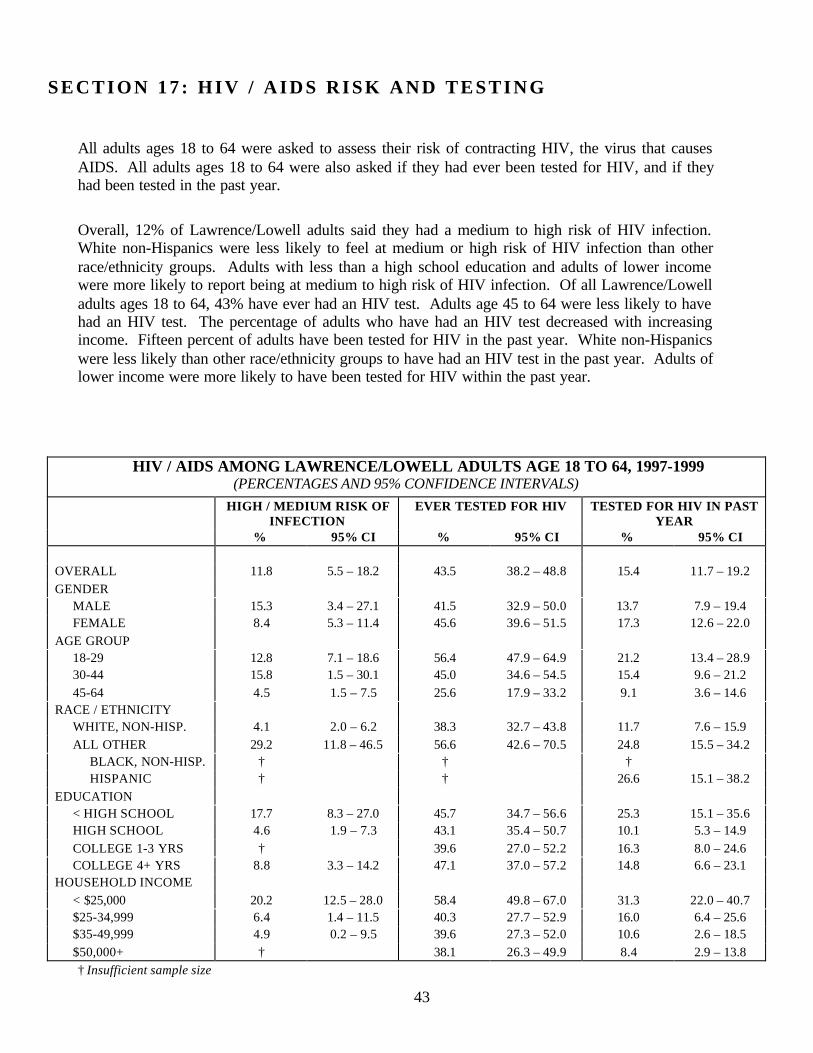
S E C T I O N 1 7 : H I V / A I D S R I S K A N D T E S T I N G
All adults ages 18 to 64 were asked to assess their risk of contracting HIV, the virus that causes AIDS. All adults ages 18 to 64 were also asked if they had ever been tested for HIV, and if they had been tested in the past year.
Overall, 12% of Lawrence/Lowell adults said they had a medium to high risk of HIV infection. White non-Hispanics were less likely to feel at medium or high risk of HIV infection than other race/ethnicity groups. Adults with less than a high school education and adults of lower income were more likely to report being at medium to high risk of HIV infection. Of all Lawrence/Lowell adults ages 18 to 64, 43% have ever had an HIV test. Adults age 45 to 64 were less likely to have had an HIV test. The percentage of adults who have had an HIV test decreased with increasing income. Fifteen percent of adults have been tested for HIV in the past year. White non-Hispanics were less likely than other race/ethnicity groups to have had an HIV test in the past year. Adults of lower income were more likely to have been tested for HIV within the past year.
HIV / AIDS AMONG LAWRENCE/LOWELL ADULTS AGE 18 TO 64, 1997-1999 (PERCENTAGES AND 95% CONFIDENCE INTERVALS)
HIGH / MEDIUM RISK OF INFECTION
EVER TESTED FOR HIV TESTED FOR HIV IN PAST YEAR
% 95% CI % 95% CI % 95% CI
OVERALL 11.8 5.5 – 18.2 43.5 38.2 – 48.8 15.4 11.7 – 19.2 GENDER
MALE FEMALE
AGE GROUP 18-29 30-44 45-64
RACE / ETHNICITY WHITE, NON-HISP. ALL OTHER
BLACK, NON-HISP. HISPANIC
EDUCATION < HIGH SCHOOL HIGH SCHOOL COLLEGE 1-3 YRS COLLEGE 4+ YRS
HOUSEHOLD INCOME < $25,000
15.3 3.4 – 27.1 41.5 32.9 – 50.0 13.7 7.9 – 19.4 8.4 5.3 – 11.4 45.6 39.6 – 51.5 17.3 12.6 – 22.0
12.8 7.1 – 18.6 56.4 47.9 – 64.9 21.2 13.4 – 28.9 15.8 1.5 – 30.1 45.0 34.6 – 54.5 15.4 9.6 – 21.2 4.5 1.5 – 7.5 25.6 17.9 – 33.2 9.1 3.6 – 14.6
4.1 2.0 – 6.2 38.3 32.7 – 43.8 11.7 7.6 – 15.9 29.2 11.8 – 46.5 56.6 42.6 – 70.5 24.8 15.5 – 34.2
† † † † † 26.6 15.1 – 38.2
17.7 8.3 – 27.0 45.7 34.7 – 56.6 25.3 15.1 – 35.6 4.6 1.9 – 7.3 43.1 35.4 – 50.7 10.1 5.3 – 14.9 † 39.6 27.0 – 52.2 16.3 8.0 – 24.6
8.8 3.3 – 14.2 47.1 37.0 – 57.2 14.8 6.6 – 23.1
20.2 12.5 – 28.0 58.4 49.8 – 67.0 31.3 22.0 – 40.7 $25-34,999 6.4 1.4 – 11.5 40.3 27.7 – 52.9 16.0 6.4 – 25.6 $35-49,999 4.9 0.2 – 9.5 39.6 27.3 – 52.0 10.6 2.6 – 18.5 $50,000+ † 38.1 26.3 – 49.9 8.4 2.9 – 13.8 † Insufficient sample size
43
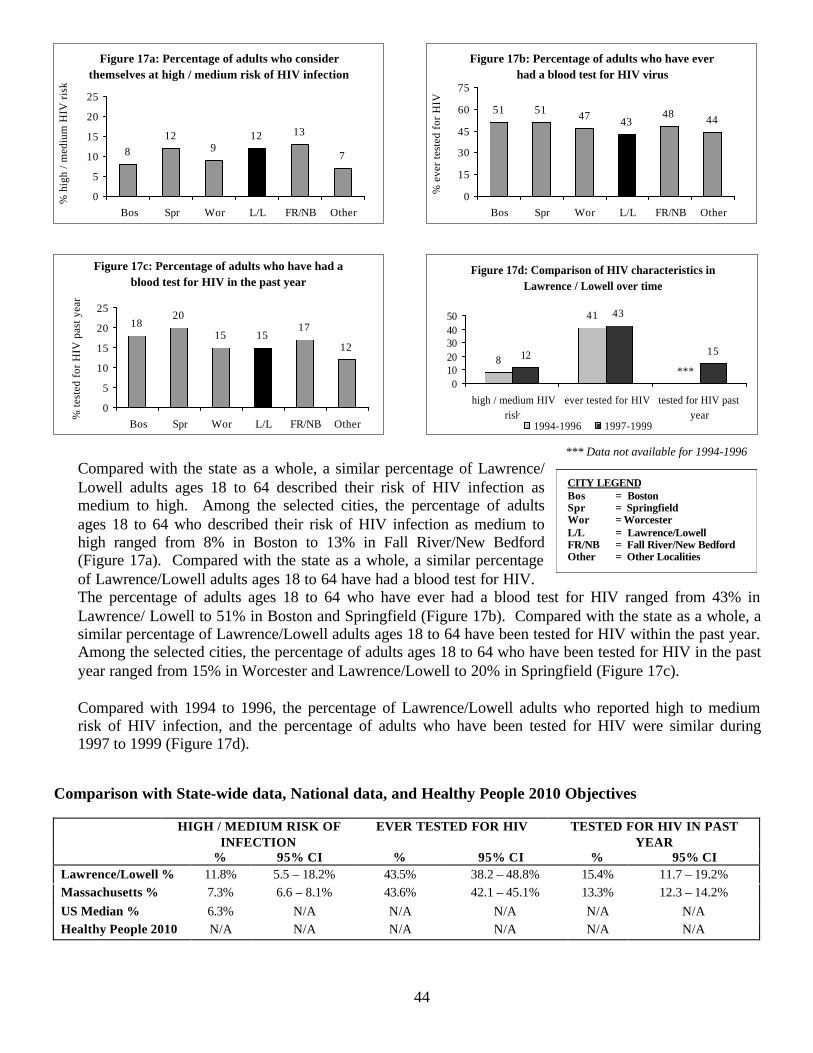
Figure 17a: Percentage of adults who consider themselves at high / medium risk of HIV infection
8 12
9 12 13
7
0
5
10
15
20
25
Bos Spr Wor L/L FR/NB Other
% h
igh
/ med
ium
HIV
ris
kFigure 17b: Percentage of adults who have ever
had a blood test for HIV virus
51 51 47 43 48 44
0
15
30
45
60
75
Bos Spr Wor L/L FR/NB Other
% e
ver
test
ed f
or H
IV
Figure 17c: Percentage of adults who have had a blood test for HIV in the past year
18 20
15 15 17
12
0
5
10
15
20
25
Bos Spr Wor L/L FR/NB Other
% te
sted
for
HIV
pas
t yea
r
Figure 17d: Comparison of HIV characteristics in Lawrence / Lowell over time
8
41
12
43
15
*** 0
10 20 30 40 50
high / medium HIV risk
ever tested for HIV tested for HIV past year
1994-1996 1997-1999
*** Data not available for 1994-1996 Compared with the state as a whole, a similar percentage of Lawrence/ Lowell adults ages 18 to 64 described their risk of HIV infection as medium to high. Among the selected cities, the percentage of adults ages 18 to 64 who described their risk of HIV infection as medium to high ranged from 8% in Boston to 13% in Fall River/New Bedford (Figure 17a). Compared with the state as a whole, a similar percentage of Lawrence/Lowell adults ages 18 to 64 have had a blood test for HIV.
CITY LEGEND Bos = Spr = Wor = Worcester L/L = FR/NB = Other =
Boston Springfield
Lawrence/Lowell Fall River/New Bedford Other Localities
The percentage of adults ages 18 to 64 who have ever had a blood test for HIV ranged from 43% in Lawrence/ Lowell to 51% in Boston and Springfield (Figure 17b). Compared with the state as a whole, a similar percentage of Lawrence/Lowell adults ages 18 to 64 have been tested for HIV within the past year. Among the selected cities, the percentage of adults ages 18 to 64 who have been tested for HIV in the past year ranged from 15% in Worcester and Lawrence/Lowell to 20% in Springfield (Figure 17c).
Compared with 1994 to 1996, the percentage of Lawrence/Lowell adults who reported high to medium risk of HIV infection, and the percentage of adults who have been tested for HIV were similar during 1997 to 1999 (Figure 17d).
Comparison with State-wide data, National data, and Healthy People 2010 Objectives
HIGH / MEDIUM RISK OF INFECTION
EVER TESTED FOR HIV TESTED FOR HIV IN PAST YEAR
% 95% CI % 95% CI % 95% CI Lawrence/Lowell % 11.8% 5.5 – 18.2% 43.5% 38.2 – 48.8% 15.4% 11.7 – 19.2% Massachusetts % 7.3% 6.6 – 8.1% 43.6% 42.1 – 45.1% 13.3% 12.3 – 14.2% US Median % 6.3% N/A N/A N/A N/A N/A Healthy People 2010 N/A N/A N/A N/A N/A N/A
44

G L O S S A R Y
Confidence Interval: The BRFSS surveys a random sample of the Massachusetts adult population andgeneralizes the results to estimate the true prevalence of disease or behaviors of the entire population. Twosuccessive surveys of the same population may not yield the same estimate of a health behavior, simply due tothe random selection process. For example, if we conduct two identical surveys of smoking prevalence at thesame time, we may have two different estimates smoking prevalence, even though the true underlyingproportion of smokers in the population is unchanged.
The percent estimate usually provides a good approximation of the underlying truth, although there are arange of values that may be consistent with the data. This range iscalled a confidence interval. A 95% confidence interval can beconsidered to be a range of values that has a 95% chance of includingthe true proportion, given that the data were not biased in any way. Theconfidence interval describes the precision of an observed estimate ofthe underlying proportion, with a wider interval indicating less certainty about this estimate. The main factoraffecting the width of the confidence interval is the number of respondents.
A 95% confidence interval can be considered a range of values that has a 95% chance of including the true proportion.
Readers should note that not all values within the confidence interval are equally likely. Values close to theestimate are more likely than values near the end points of the confidence interval. For example, the estimatefor the percent of adults in Massachusetts who are current smokers is 20.2%. The 95% confidence interval forthis estimate is 18.9 - 21.5%. However, upon repeated surveys, half of the values would be expected to fallwithin the range 19.7- 20.6%.
Healthy People 2010 Objectives: The Healthy People 2010: National Health Promotion and Disease Prevention Objectives are a national agenda that aim to significantly improve the health of Americans in the decade preceding the year 2010. Developed through an extensive governmental, professional, and public
national process, Healthy People 2010 defined two broad national goals: to increase quality and years of healthy life and to eliminate health disparities. These goals were supported by 476 specific objectives that set priorities for public health during first decade of the 2000’s. The objectives were organized into 28 priority areas such as tobacco, overweight, and diabetes. For each objective, a numeric national target for the year 2010 was set. For
Healthy People 2010 seeks to: increase quality and years of healthy life, to reduce health disparities.
each health status indicator in this report that has a corresponding Healthy People 2010 Objective, the year 2010 target is shown in the relevant graphs and tables.
Median: The median is the middle observation for a set of observations; i.e. the value that divides the frequency distribution into halves. It is also equal to the 50th percentile. For example, the US median represents the point at which half of the states have a higher estimate than the median and half have a lower estimate.
45
KEY LINKS
Health Survey Program: The Health Survey Program is part of the Bureau of Health Statistics, Research and Evaluation at the Massachusetts Department of Public Health. Additional information about the program including other state publications can be found on our website located at: http://www.state.ma.us/dph/bhsre/cdsp/brfss/brfss.htm, link to our program.
MassCHIP: Data on selected variables from the Massachusetts BRFSS are available through the Massachusetts Community Health Information Profile (MassCHIP), an Internet - accessible information service available from the Massachusetts Department of Public Health. Information about how to register as a MassCHIP user is available at: http://masschip.state.ma.us/.
National BRFSS data: There is a national BRFSS website as part of the Centers for Disease Control and Prevention, which provides information about the BRFSS, includes listings of publications and questionnaires, provides national data on selected variables, and includes links to relevant websites. The national BRFSS website is located at: www.cdc.gov/nccdphp/brfss/. A downloadable document that describes all aspects of the BRFSS and survey methodology is located at: http://www.cdc.gov/nccdphp/brfss/pdf/userguide.pdf.
Healthy People 2010 website: The Healthy People Objectives has been coordinated by the U.S. Department of Health and Human Services, Office of Disease Prevention and Health Promotion. Information on the health prevention goals, priority areas, measuring progress in the health indicators and other pertinent information can be found on the Healthy People 2010 homepage at: http://www.health.gov/healthypeople/.
ACKNOWLEDGEMENTS
This report was prepared by the staff of the Health Survey Program:
Jason Yeaw, BS, Research AnalystLorelei Mucci, MPH, Research AnalystPhyllis Brawarsky, MPH, Research AnalystBrian Bradbury, MPH, Research AnalystKaren Clements, MPH, Research Analyst
We wish to express our gratitude to the residents of Massachusetts who participated in this survey, and to ORC Macro, Inc. and the dedicated interviewers who helped make this survey possible.
For further information about this report, about the BRFSS, or the Health Survey Program, please contact: Zi Zhang, MPH. Health Survey Program. Bureau of Health Statistics, Research, and Evaluation. Massachusetts Department of Public Health. 250 Washington Street, 6th floor. Boston, MA 02108 - 4619. telephone: (617) 624 - 5623. email: [email protected].
46

47