a process for producing refined guar splits
TRANSCRIPT

A PROCESS FOR PRODUCING
REFINED GUAR SPLITS
A Thesis
by
KEVIN PAUL EDWARDS
Submitted to the Office of Graduate and Professional Studies of
Texas A&M University
in partial fulfillment of the requirements for the degree of
MASTER OF SCIENCE
Chair of Committee, Willam Brock Faulkner
Committee Members, Elena Castell-Perez
Mian Riaz
Head of Department, Stephen W. Searcy
May 2016
Major Subject: Biological and Agricultural Engineering
Copyright 2016 Kevin Paul Edwards

ABSTRACT
Guar (Cyamopsis tetragonoloba) is a warm-season, annual, leguminous crop that
was introduced to the United States in 1903. Guar is harvested with a combine at which
time seed pods and leaves are removed. Seeds are processed after harvesting to obtain
refined guar splits. A primary use for guar is the production of guar (galactomannon)
gum from the refined splits. Guar seed processing equipment primarily originates in
India, where the crop has been grown for many years. The purpose of this research is to
develop a scalable system for producing refined guar splits that will reach a minimum
viscosity of 6500 cP at a 0.92% solids concentration and a white color. Two pilot scale
process streams including heating, milling, sieving, and polishing were developed to
produce refined splits.
The target viscosity of 6500 cP was achieved under certain conditions for both
processes. A white color was not achieved, however predictive models were developed
to determine the effects of experimental factors on color and viscosity response
variables. Impurities in refined split samples greatly decrease viscosity of the final
solution. Thoroughly cleaning and polishing splits is critical to achieving a consistently
high viscosity.
Quality metrics vary by end user and affect process parameters. Increasing
polishing time increased viscosity but with lower yields of polished splits. Increasing
heating temperature had some desirable effects on viscosity and color, but extra costs
will be associated with higher energy demands. Raw bean color appeared to affect the
ii

iii
color of the refined splits. Darker splits are not as desired by end users and are often
purchased from processors at discounted rates. Gum content is not affected by
darkening of the seed coat. However, darker color is not as desired by industries where
aesthetics is a concern, such as food and pharmaceuticals. Darkening of seed coats can
be reduced during the growing and reproducing of the crop. In addition, alternative
polishing technologies can be considered to improve yield and efficiency.
iv
DEDICATION
I would like to dedicate this paper to the family of Dr. William Brock Faulkner.
Throughout my time at Texas A&M, Dr. Faulkner was my greatest mentor. Without his
guidance and support, I would not have the professional experience that I do today.. I
received my first internship under Dr. Faulkner’s recommendation. At the time, I was his
student and he made a strong recommendation to the company on my behalf.. I spent
the summer in Seguin, TX working for a machine design company where I was able to
apply much of the knowledge that I gained while in school.
I later went on to work for Dr. Faulkner as a student worker. I worked on a
variety of research projects ranging from air quality to material processing. As
graduation neared, I was still unsure of what path I wanted to pursue in full time
employment. I continued work with agricultural material processing into graduate
school under Dr. Faulkner’s guidance. Through this, I found my passion in process and
design engineering.
Dr. Faulkner was a dedicated Christian who loved helping others and loved
teaching. He was one of strongest and hard working men I have ever met. I am honored
to have been given the chance to work under his leadership for so many years. As I
move on to a professional career, I will strive to be a role model to young professionals
as Dr. Faulkner was to me.

v
ACKNOWLEDGEMENTS
I have had many great mentors, advisors, and friends throughout my life and
college career. My family has always worked to instill good character and an
unstoppable work ethic in me. While it was not a smooth road, they always stood
behind me and pushed me to succeed. All of those long days in show barn and late
nights working on Ag mechanics projects taught me how hard work pays off and that
ribbons don’t always make the award.
The Biological and Agricultural Engineering family has been important to me
during my time at Texas A&M University. I would like to thank my committee chair,
Dr. Faulkner, for believing in me and giving me the opportunity to pursue graduate
school. I am forever grateful for the experience I gained through these many projects.
Many of the opportunities I have been given are largely thanks to you and your desire to
help students. From the first day in BAEN 365 to now, you have always been a great
mentor and role model to me and many other students. I would also like to thank Dr.
Castell-Perez, Dr. Riaz, Chris Mack, and the staff at the Food Protein Research and
Development Center for their guidance and support throughout my thesis research.
In addition to my committee members, I would like to thank Ashlea Schroeder,
Stormy Kretzschmar, Dr. Lacey, Dr. Searcy, Richard Epting, Russel McGee, and Paulo
Fortez Da Silva for their support and guidance throughout the various adventures during
my college career and for always keeping me on the straight-and-narrow. Many of the
life skills I have learned, particularly in time and project management, are in large
thanks to these individuals. When I arrived to Texas A&M in the Fall of 2010, I never

vi
imagined I would have the privilege to serve as the President of two student
organizations. I certainly would not have been successful in these leadership roles
without these advisors and mentors. To my classmates, friends, and colleagues, thank
you for the continued support and for always keeping things interesting. From tractors
to Mexico, I certainly could not have made it through this without your help!
And to my parents, without a good foundation, none of this would matter. Thank
you for teaching me the importance of hard work, respecting others, and of course for
your never ending support. I know I have a tendency to overload my plate, but you have
always supported me and encouraged me to keep pushing forward. I know those long
days in the show barn weren’t always the most pleasant, but I think they have certainly
paid off.
Also, thanks to Southwest Agriculture and Texas Agrilife Research for helping
sponsor my research.

vii
TABLE OF CONTENTS
Page
ABSTRACT .......................................................................................................................ii
DEDICATION ................................................................................................................. iv
ACKNOWLEDGEMENTS .............................................................................................. .v
TABLE OF CONTENTS .................................................................................................vii
LIST OF FIGURES ...........................................................................................................ix
LIST OF TABLES ............................................................................................................ .x
CHAPTER I INTRODUCTION AND LITERATURE REVIEW ................................... 1
CHAPTER II DEVELOPMENT OF A PILOT SCALE PROCESS FOR
PRODUCING REFINED GUAR SPLITS ........................................................................ 8
Objective ........................................................................................................................ 8 Introduction .................................................................................................................... 8 Methods .......................................................................................................................... 9
Initial Aspiration ......................................................................................................... 9 Disk Attrition Mill .................................................................................................... 10 Tangential Abrasion Disk Dehuller (TADD) ........................................................... 16
Viscosity Testing ...................................................................................................... 19 Results and Discussion ................................................................................................. 20
Initial Aspiration Data .............................................................................................. 20
Disk Attrition Mill .................................................................................................... 21 Conclusion .................................................................................................................... 24
CHAPTER III A PROCESS FOR PRODUCING REFINED GUAR SPLITS .............. 25
Introduction .................................................................................................................. 25
Methods ........................................................................................................................ 27 Processing ................................................................................................................. 27 Quality Measures ...................................................................................................... 30

viii
Experimental Design ................................................................................................ 31 Results .......................................................................................................................... 32
Viscosity ................................................................................................................... 32 Color ......................................................................................................................... 34
Summary and Conclusion ............................................................................................ 38
CHAPTER IV SUMMARY AND CONCLUSION ....................................................... 41
REFERENCES ................................................................................................................. 44
APPENDIX A ADDITIONAL DISK ATTRITION MILL PLATES ............................. 45

ix
LIST OF FIGURES
Page
Figure 1. Guar seeds and pods. .......................................................................................... 2
Figure 2. Guar bean composition. ...................................................................................... 2
Figure 3. General process flow for producing refined guar splits. ..................................... 5
Figure 4. Refined guar splits. ............................................................................................. 6
Figure 5. Disk attrition mill. ............................................................................................. 11
Figure 6. Plate 3 (left) is a less aggressive plate while plate 1 (right) is a more
aggressive plate. ................................................................................................ 11
Figure 7. Aspirator. .......................................................................................................... 13
Figure 8. Chopin bran finisher. ........................................................................................ 15
Figure 9. Recommended process flow diagram for disk attrition mill process. ............... 15
Figure 10. Bench Scale Tangential Abrasive Disk Dehuller (TADD). ............................ 17
Figure 11. Recommended process flow diagram for TADD mill. ................................... 19
Figure 12. Moisture content versus heating time. ............................................................ 22
Figure 13. Bauer mill plate 6908. .................................................................................... 28
Figure 14. Process flow for experimental procedure. ...................................................... 29
Figure 15. Effect of heating temperature and mass loss on viscosity. ............................. 34
Figure 16. Effect of heating temperature and heating time on L*. .................................. 35
Figure 17. Processing time vs target mass loss during polishing. .................................... 36
Figure 18. Effect of heating temperature and heating time on b*. ................................... 37
Figure 19. Bauer disk attrition mill plate 6945. ............................................................... 45
Figure 20. Bauer disk attrition mill "plate 4." ................................................................. 46

x
LIST OF TABLES
Page
Table 1. Initial aspiration results. ..................................................................................... 20
Table 2. Process data for TADD machine. ....................................................................... 23
Table 3. Factors of interest for experimental design. ....................................................... 32
Table 4. ANOVA table for response factors. .................................................................. 38

1
CHAPTER I
INTRODUCTION AND LITERATURE REVIEW
Guar (Cyamopsis tetragonoloba) is a warm-season, annual, leguminous crop that
was introduced to the United States in 1903. Commercial production of guar began in
the 1950’s and has been concentrated in the Texas panhandle and Oklahoma
(Undersander et al., 2015). Guar is known for its drought tolerance, which makes it
ideal for arid climates, and as a legume, is excellent in a crop rotation program since it
improves soil properties (Undersander et al., 2015).
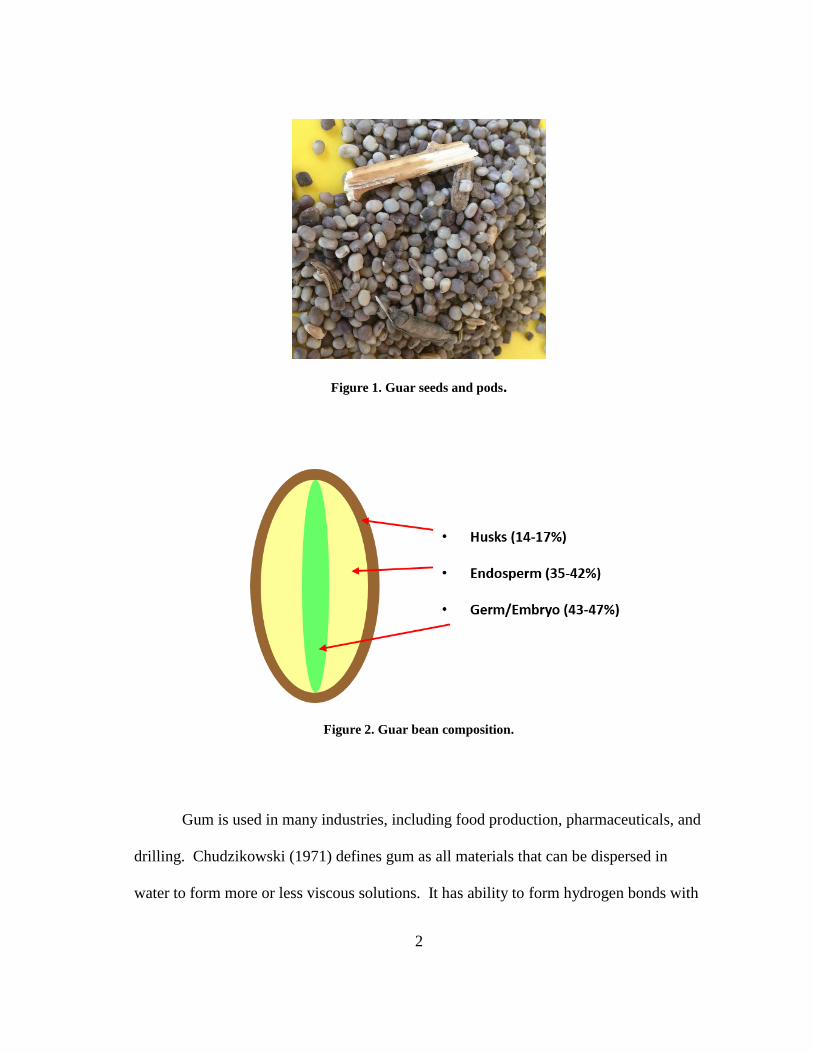
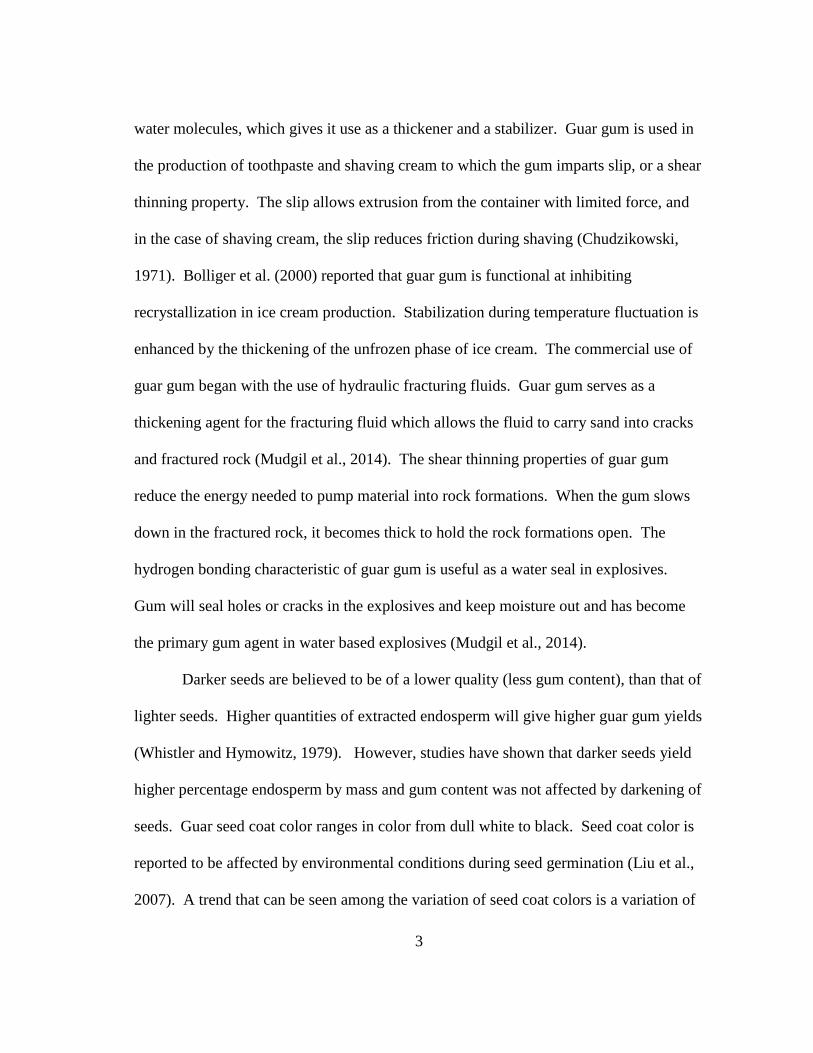
Guar (Figure 1) is harvested with a combine at which time the seed pods and
leaves are removed. Seeds are processed after harvesting to obtain refined guar splits
(polished endosperm). Guar seed is composed of three main components: seed coat,
endosperm, and embryo (Figure 2). Guar (galactomannan) gum is produced from
dehulled endosperm, which accounts for 35-42% of the seed weight (Goldstein et al.,
1959).
2
Figure 1. Guar seeds and pods.
Figure 2. Guar bean composition.
Gum is used in many industries, including food production, pharmaceuticals, and
drilling. Chudzikowski (1971) defines gum as all materials that can be dispersed in
water to form more or less viscous solutions. It has ability to form hydrogen bonds with
3
water molecules, which gives it use as a thickener and a stabilizer. Guar gum is used in
the production of toothpaste and shaving cream to which the gum imparts slip, or a shear
thinning property. The slip allows extrusion from the container with limited force, and
in the case of shaving cream, the slip reduces friction during shaving (Chudzikowski,
1971). Bolliger et al. (2000) reported that guar gum is functional at inhibiting
recrystallization in ice cream production. Stabilization during temperature fluctuation is
enhanced by the thickening of the unfrozen phase of ice cream. The commercial use of
guar gum began with the use of hydraulic fracturing fluids. Guar gum serves as a
thickening agent for the fracturing fluid which allows the fluid to carry sand into cracks
and fractured rock (Mudgil et al., 2014). The shear thinning properties of guar gum
reduce the energy needed to pump material into rock formations. When the gum slows
down in the fractured rock, it becomes thick to hold the rock formations open. The
hydrogen bonding characteristic of guar gum is useful as a water seal in explosives.
Gum will seal holes or cracks in the explosives and keep moisture out and has become
the primary gum agent in water based explosives (Mudgil et al., 2014).
Darker seeds are believed to be of a lower quality (less gum content), than that of
lighter seeds. Higher quantities of extracted endosperm will give higher guar gum yields
(Whistler and Hymowitz, 1979). However, studies have shown that darker seeds yield
higher percentage endosperm by mass and gum content was not affected by darkening of
seeds. Guar seed coat color ranges in color from dull white to black. Seed coat color is
reported to be affected by environmental conditions during seed germination (Liu et al.,
2007). A trend that can be seen among the variation of seed coat colors is a variation of

4
hardness. White seeds are ‘harder’ than darker beans, which tend to absorb water slowly
and have a lower germination rate, which is a concern for growers and buyers (Liu el al.,
2007).
Guar seed processing equipment primarily originates in India, where the crop has
been grown for many years. Specifics of unit operations in the process of producing
refined guar splits are maintained as trade secrets. The general process (Figure 3) is to
split the beans using a size reduction milling machine, sieve by size, roast and polish the
split seeds to obtain polished ‘splits’(Figure 4).

5
Figure 3. General process flow for producing refined guar splits.
The milling machine splits the beans and removes the embryo from the
endosperm. Sieving separates material based on size after splitting. After sieving, the
split beans are roasted and polished to remove the seed coat. Many agricultural products
such as soybeans are roasted prior to dehulling to separate the husk from the endosperm
because the beans shrink at a faster rate than the husk, thus gently separating the two
components. Roasting soybeans at 71°C (160°F) makes hulls fragile and allows easy
separation from the kernels, thus making the hulling process more efficient (Moran,

6
1964). Similarly, it was expected that heating guar would increase the efficiency of the
polishing step.
Figure 4. Refined guar splits.
Techniques for polishing, or finishing, grains exist, but little information is
available in the literature for polishing guar. Removing the husks from endosperm
seems to be the challenging step in processing guar. Patents have been filed in India for
the process of dehulling, or dehusking, endosperm. Vishwakarma et al. (2003)
developed a process for pretreating raw beans in a chemical aqueous solution to assist in
separating hull from endosperm. A machine developed by Vishwakarma et al. (2015)
involves pretreatment of guar seeds in an aqueous solution. Unsplit guar seeds are fed
into the machine, dehusked, split, and germ is separated after splitting of the seeds. The
machine uses two parallel horizontal disks. One disk is stationary and one is rotating.
7
Centrifugal force causes the seeds to “roll” outward rubbing the husks off. A burr mill is
then used to split the beans. A pin mill is used to separate germ from polished splits.
Air aspiration is also used to separate lightweight material from heavier materials. Little
information is available in academic literature on processing raw guar to produce refined
guar splits.
The objective of this experiment was to develop a pilot-scale process for
producing refined guar splits that will reach a minimum viscosity of 6500 cP and a
‘white’ color with the intention to scaling up to a commercial-scale. Equipment was
identified and tested to perform operations of the process, similar to that shown in Figure
3. Equipment settings were analyzed and recommendations will be made for a
commercial-scale process.

8
CHAPTER II
DEVELOPMENT OF A PILOT SCALE PROCESS FOR PRODUCING REFINED
GUAR SPLITS
Objective
The objective of Phase 1 of this project was to develop a pilot-scale process and
identify machines for unit operations to obtain polished splits from raw guar beans with
the intent to scale to commercial production rates in Phase II. The general process is to
split the beans using a size reduction milling machine, sieve by size, roast and polish the
split seeds to obtain polished ‘splits.’ Specific equipment was tested and settings were
established for pilot-scale equipment. The desired outcome was for polished splits to
reach a minimum viscosity of 6,500 cP when dissolved in water at a 0.92% solids
concentration according to the Rhodia UV-9.0 method. A process using a disk attrition
mill to split raw guar beans, mechanical and pneumatic separation of the germ from
endosperm, and polishing of the husk from the endosperm yielded polished splits that,
based on the Rhodia UV-9.0 method, yielded a final solution having a viscosity of
11,340 ± 1,670 cP (mean ± 95% confidence interval.
Introduction
Guar (Cyamopsis tetragonoloba) is a warm-season leguminous crop used to
produce guar gum. Guar was introduced into the United States from India in 1903, and
production has been primarily concentrated in southern Oklahoma and north Texas. The

9
endosperm of the guar seed consists largely of a polysaccharide of galactose and
mannose (guar gum), which can be extracted from the endosperm and used in various
applications, including food production and as a thickening agent for hydraulic
fracturing fluids. The husk and germ are insoluble and reduce the viscosity of guar gum
solutions if they remain with the endosperm after processing. The meal that remains
after extraction of the gum contains approximately 35% protein and is highly digestible,
thereby making a good animal feed product (Undersander et al., 2015). In this study,
different processes were evaluated to split and polish guar beans to obtain dehusked
splits. A disk attrition mill and a tangential abrasion disk dehuller (TADD) were tested
as methods to split and polish the beans. The final products were tested for viscosity to
determine if the products would meet required quality specifications.
Methods
Initial Aspiration
Guar beans received from Alice, Texas; West Texas Guar; Knox City, Texas;
and Bradley, Oklahoma, were aspirated prior to splitting and polishing to remove lighter
foreign matter picked up during harvest, including sticks, leaves, seed pods, and dust.
After aspirating, the guar beans underwent several experimental processes to remove the
husks, split the beans, and separate the germ from the endosperm. The specific variety
of guar from each supplier is unknown.

10
Disk Attrition Mill
The first method that was tested was a Bauer disk attrition mill (Figure 5; Model
1482; The Bauer Bros. Co. Manufacturing; Springfield, OH). Disk attrition mills are
common in the grain processing industry, and commercial-scale equipment is easily
obtainable. Prior to milling, beans from West Texas Guar were heated to aid in
loosening the endosperm from the husks. Beans were heated at 54°C (130°F) and 71°C
(160°F) using a batch pan drying oven using stainless steel pans (Model 062; SGM
Corporation: Philadelphia, PA), and a control sample with no heat was also tested. Four
different mill plates were initially tested for the splitting process. Plate spacing was
adjusted subjectively prior to processing the material to yield the maximum number of
splits without pulverizing the endosperm. Bauer Mill plate 6945 (plate 2 from appendix
A) and a more aggressive plate (plate 4 from appendix A) performed poorly at splitting
the beans. Two different mill plates were chosen for further testing, including a Bauer
Mill plate 6929 (plate 1 from Figure 6) and a less aggressive plate (plate 3 from Figure
6).

11
Figure 5. Disk attrition mill.
Figure 6. Plate 3 (left) is a less aggressive plate while plate 1 (right) is a more aggressive plate.
Samples were heated in 4.5 kg (10 lbs.) batches. The first trials conducted were
with “plate 1.” Samples were heated at 54°C (130°F) for 5, 10, 15, and 20 minutes and
milled. The next trials were heated at 71°C (160°F) for 10, 15, and 20 minute intervals.
12
Samples were not milled directly after being removed from the oven. The material was
stored in plastic bags to maintain moisture content. Moisture contents were determined
on approximately 680 g (1.5 lbs.) samples using an oven drying method (ASABE, 2012).
Moisture content samples were heated at 105°C for 24 hours, or until mass remained
constant to determine moisture content. Samples processed with “plate 1” were being
over-milled, such that it appeared the plate was grinding the material rather than splitting
the beans. After these observations were made “plate 3” was tested. Visual inspection
of samples after milling with “plate 1” determined that the heating intervals chosen did
not affect the milling process. For these trials, the samples were heated at 71°C (160°F)
for 15, 30, 45, and 60 minute intervals. All treatments were analyzed with single
replicates. After milling, the samples were processed with an air aspirator to separate
foreign material from splits (Figure 7). Air aspirators are commonly used in
commercial-scale processing systems. Several trials were conducted to determine the
appropriate operational parameters for this process. It was determined that the material
would need to be processed with the aspirator twice after milling. Samples were
aspirated once to remove dust generated during the milling process (air velocity ~ 3.81
m/s (750 fpm)) and a second time to separate un-split beans (air velocity ~ 6.6 m/s (1300
fpm)). These parameters are not directly applicable to a commercial scale aspiration
system, however the separation is representative of what should be expected in a
commercial system.

13
Figure 7. Aspirator.
Viscosity analysis was performed on samples (3 replicates from each treatment)
after the milling and aspirating process and results showed that viscosity was below the
minimum requirement. The Bauer mill successfully split the beans, but further
processing was required to polish the husks from the endosperm. Beans from Bradley,
OK, were used to analyze a polishing process. The beans were processed using the disk
attrition mill without heating prior to milling. The samples were aspirated as described
above to remove foreign materials that will negatively affect viscosity. A bran finisher
(Figure 8; Chopin Technologies, Villeneuve-la-Garenne Cedex, France) was used to
polish beans that were split with “plate 3.” Raw splits were heated at 71°C (160⁰F) for
30 minutes to loosen the husks and were then processed in the bran finisher. A single
replication of the process was performed in this experiment.
Based on previous viscosity observations, it was determined that further
separation was needed to remove foreign materials from the samples after polishing.
14
Larger germ particles are very close in density to endosperm, thus the air aspiration
machine was not effective at separating the germ from splits. Well-polished, clean splits
were selected by hand from the final product for viscosity testing to determine if the
described milling and polishing process would yield refined splits capable of meeting
project objectives. In a commercial-scale facility, a mechanical separation process will
be needed to separate guar splits from the germ before polishing. A vibratory conveyor
was tested for this step, however the resulting separation was inadequate. Beans from
Knox City, TX, were used to identify a separation process. Samples were milled,
aspirated, and sent to Carrier Vibrating Equipment, Inc. where separation was achieved
by sieving to remove the germ (a 3/16 inch mesh screen was used for the separation in
phase 1) and air classification was used to remove un-split beans from guar splits. A
process flow diagram for the tested process is shown in Figure 9.

15
Figure 8. Chopin bran finisher.
Figure 9. Recommended process flow diagram for disk attrition mill process.

16
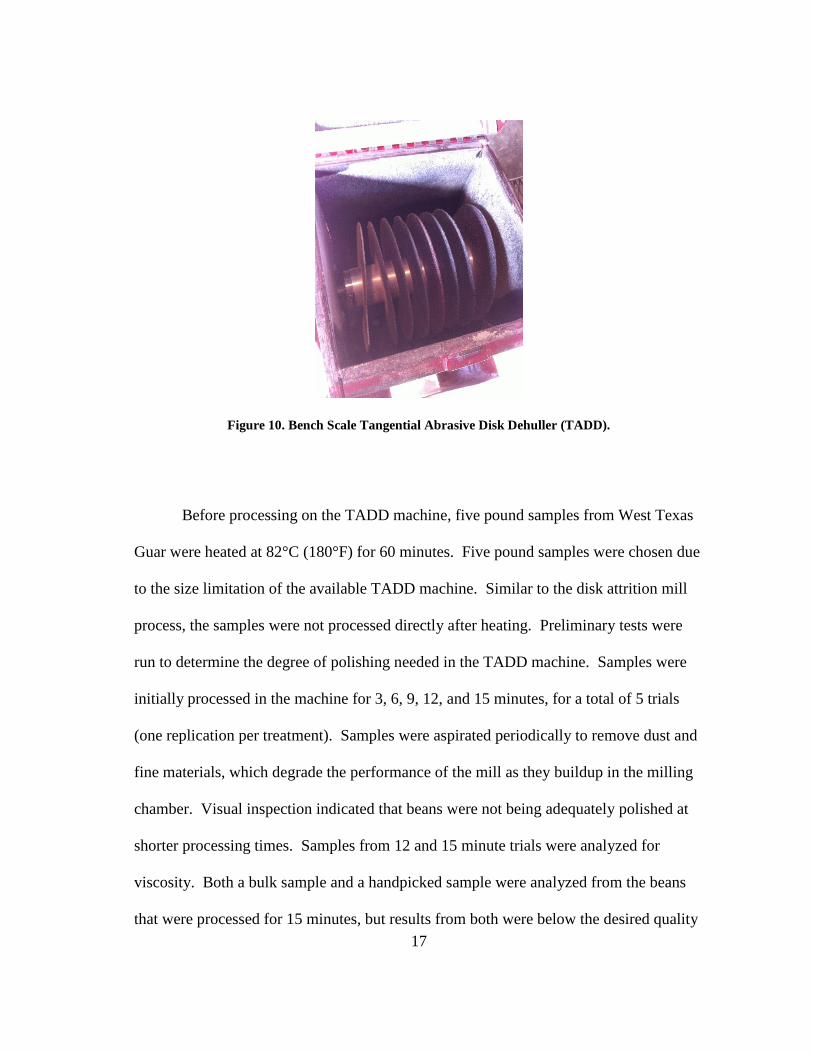
Tangential Abrasion Disk Dehuller (TADD)
The TADD mill was tested as an alternative to the disk attrition mill. As tested,
the attrition mill did a good job of splitting the beans and separating the germ from the
husked endosperm, but it did not remove the husks from the splits without additional
processing (i.e., processing through the bran finisher). The TADD has eight abrasive
disks that rotate inside a drum that holds the material (Figure 10). As the disks rotate,
the beans are rubbed against the disks, husks are polished off, and the beans are split.
TADD mills are very effective for polishing grains, but, to our knowledge, they are
currently only commercially available at bench-scale. (Nutana Machine in
Saskatchewan, Canada has previously produced a commercial-scale mill based on the
same principle. They retain the plans for the mill and have expressed interest in selling
the plans and/or manufacturing a commercial-scale mill for further testing).
17
Figure 10. Bench Scale Tangential Abrasive Disk Dehuller (TADD).
Before processing on the TADD machine, five pound samples from West Texas
Guar were heated at 82°C (180°F) for 60 minutes. Five pound samples were chosen due
to the size limitation of the available TADD machine. Similar to the disk attrition mill
process, the samples were not processed directly after heating. Preliminary tests were
run to determine the degree of polishing needed in the TADD machine. Samples were
initially processed in the machine for 3, 6, 9, 12, and 15 minutes, for a total of 5 trials
(one replication per treatment). Samples were aspirated periodically to remove dust and
fine materials, which degrade the performance of the mill as they buildup in the milling
chamber. Visual inspection indicated that beans were not being adequately polished at
shorter processing times. Samples from 12 and 15 minute trials were analyzed for
viscosity. Both a bulk sample and a handpicked sample were analyzed from the beans
that were processed for 15 minutes, but results from both were below the desired quality
18
(280 cP for the bulk sample and 3,590 cP for the handpicked sample with one replication
from each).
After initial trials, samples were tested in which the effects of heating on
processing time and viscosity were characterized. Samples from Bradley, OK, were
used for the second set of tests to prevent further contamination of equipment from the
dye used by West Texas Guar to mark their beans. These samples were processed in
TADD until 30% and 40% mass losses were achieved. All samples were aspirated to
remove whole beans that were not split in the processing (air velocity ~ 6.6 m/s (1300
fpm)). Figure 11 shows the process flow diagram for this process. The dehusked-but-
unsplit beans were split using the disk attrition mill with “plate 3.” Viscosity was not
conducted on these samples, tests were conducted to only evaluate if endosperm would
be damaged in a splitting process after husks are removed.

19
Figure 11. Recommended process flow diagram for TADD mill.
Viscosity Testing
The quality of polished splits was determined based on the Rhodia UV-9.0
method obtained from Solvay. This method is used to determine the viscosity of a
water-guar gum mixture based on a 0.92% solids concentration. Samples were hydrated
in approximately 500mL of water, and viscosity was measured using a Brookfield LV
viscometer (LVDV-III, Brookfield Engineering Laboratories, Middleboro, MA). There
were modifications to the water bath conditions and the shearing times to ensure
complete hydration of the tested splits. To ensure the guar splits were fully hydrated and

20
dissolved, the splits were soaked for 30 minutes longer than specified in the hot water
bath. Also, shearing times were increased by approximately 20 seconds to ensure that
the components of the sample were uniformly distributed in the solution. Viscosity was
measured after solution reached room temperature.
Results and Discussion
Initial Aspiration Data
Guar samples from four locations were provided by Southwest Agriculture.
Table 1 shows results of the initial aspiration. Useable yields of raw beans after initial
cleaning varied substantially by source and have the potential to dramatically effect final
yields of polished splits per unit of incoming product.
Table 1. Initial aspiration results.
Sample Initial
Mass
of
Guar
(lbs)
Mass of
Cleaned
Guar
(lbs)
Trash
(lbs)
% Mass
Guar
Alice, TX (variety 1) 28.3 23.5 4.85 82.9%
Alice, TX (variety 2) 58.0 55.0 3.04 94.8%
West TX Guar 45.6 44.8 0.76 98.3%
Bradley, OK 128 117 9.11 92.8%
Knox City (Sample 1)* 150.1 140.4 8.84 94.1%
Knox City (Sample 2)* 127.5 122.3 4.90 96.1%
*Samples are from same batch

21
Disk Attrition Mill
Two different plates and various heating conditions were tested in a disk-
attrition-mill-based process. After milling, it was subjectively determined that a less
aggressive plate (“plate 3”) was the best option for splitting the beans and removing the
germ from the splits. The more aggressive mill setup (“plate 1”) pulverized rather than
split the beans.
Moisture content decreased linearly with increased heating time (Figure 12), but
no trends were observed between moisture content after heating and yield of splits and
husks, indicating that heating prior to milling is unnecessary. After aspiration it was
determined by visual inspection that the splits were not being polished enough with the
milling process alone. A bran polisher was used to polish the husks from the heated
splits. After polishing, three samples of polished splits (from Bradley, OK beans) were
handpicked from the final product stream and analyzed for viscosity. The resulting
viscosity was 15,390 ± 1,890 cP (mean ± 95% confidence interval based on 3
replications), indicating that the process shown in Figure 9 is capable of meeting product
quality specifications assuming the separations process adequately separates the germ
and husk from the endosperm
Samples from Knox City were milled, aspirated, and sent to Carrier Vibrating
Equipment, Inc. for separation of germ and un-split beans from the raw splits. Splits
separated by Carrier were heated at 82°C (180⁰F) for 60 minutes followed by polishing.
Three samples were picked and analyzed for viscosity using the Rhodia UV-9.0 method

22
and yielded an average viscosity of 11,340 ± 1,670 cP (mean ± 95% confidence
interval), exceeding project objectives of minimum viscosity of 6500 cP.
Figure 12. Moisture content versus heating time.
Tangential Abrasion Disk Dehuller (TADD)
The TADD was tested as a method to split the beans and polish the splits in one
step. Tests were conducted with heated and unheated samples from Bradley, OK.
Samples were processed until 30% and 40% of the raw bean mass was polished off.
Heating the samples reduced the time required to reach the desired mass loss and the
percentage of un-split beans. Samples were aspirated to remove the whole beans that
were not split during the process.
Table 2 shows the processing time, percent whole beans from each sample, and
handpicked viscosities (3 replications for viscosity). No statistically significant
y = -0.0199x + 9.618R² = 0.9611
8.2
8.4
8.6
8.8
9
9.2
9.4
9.6
9.8
0 10 20 30 40 50 60 70
Mo
istu
re C
on
ten
t (%
wb
)
Heating Time at 71°C (160°F )(min)

23
differences were seen between viscosities from the four treatments, but additional
replicates are needed to achieve a desired statistical power of 0.80. The processing time
required to achieve the desired mass loss decreased with addition of a heating step prior
to milling. Also, percent mass of beans that were un-split during polishing was
decreased with the addition of a heating step.
This process was also capable of meeting product quality specifications
(assuming the separations process adequately separates the germ and husk from the
endosperm) and shows promise for improvement through optimization. The next stage
in the development of this process would be mechanically separating the germ and husks
from polished splits (using the process developed by Carrier) and then determining
yields and product viscosities on the fully-mechanized process. Due to time and funding
constraints, samples after aspirating were not able to be sent to Carrier for the separation
step.
Table 2. Process data for TADD machine.
Treatment Target
Mass
Loss
(%)
Processing
Time
(min)
Mass
Loss
Achieved
Percent
Mass
of
Unsplit
Beans
Viscosity
(cP)[a]
Heated 40% 15 38.4% 10.5% 19,630 ± 3850
30% 12 30.0% 12.7% 19,380 ± 2660
Unheated 40% 28 40.1% 21.4% 20,130 ± 905
30% 20 30.9% 32.7% 17,730 ± 1350
[a] Mean ± 95% confidence interval

24
Conclusion
The two processes explored both yielded polished guar splits which exceeded the
required quality specifications. Viscosity results from the TADD exceeded project
objectives when analyzing handpicked samples. Heated and unheated samples reached
viscosities of 19,630 ± 3850 and 20,130 ± 905 cP, respectively. Although the results
from the TADD are promising, commercial-scale equipment is not readily available. All
of the equipment required for processing guar using the disk attrition mill is
commercially available, and the final quality of the polished splits exceeded the project
objectives when processing beans from Knox City. Viscosity of handpicked samples
were 15,390 ± 1,890 cP and viscosities for samples are mechanized separation were
11,340 ± 1,670 cP (mean ± 95% confidence interval). Thus, the process described using
the disk attrition mill (Figure 9) is recommended for the initial scale up. Optimization of
the commercial-scale equipment (in particular heating and polishing processes) is also
recommended to ensure efficient and quality controlled operation of the commercial-
scale plant. Furthermore, additional plate designs for the disk attrition mill should be
investigated.
25
CHAPTER III
A PROCESS FOR PRODUCING REFINED GUAR SPLITS
Introduction
Guar (Cyamopsis tetragonoloba) is a warm-season, annual, leguminous crop that
was introduced to the United States in 1903. Commercial production of guar in the US
began in the 1950’s and has been concentrated in the Texas Panhandle and Oklahoma
(Undersander et al., 2015). Guar is known for its drought tolerance, which makes it
ideal for arid climates and, as a legume, is excellent for improving soil properties in a
crop rotation program if seed are effectively inoculated (Undersander et al., 2015).
The primary use for guar is the production of galactomannan gum, or guar gum.
Guar seed is composed of three main components: seed coat, endosperm, and embryo.
Guar gum is produced from dehulled endosperm, which accounts for 35-42% of the seed
weight (Goldstein et al., 1959). Guar gum is used as a thickening agent and a stabilizer
in many industries, including food production, pharmaceuticals, and drilling operations
(Mudgil et al., 2014). Guar processing equipment primarily originates in India, where
most of the global guar production is centered. Methods for processing guar into refined
guar splits are maintained as trade secrets, but the general process is to split the seeds
using an attrition mill, sieve to separate by size, roast, and then polish to remove the
husks. The husks and germ are insoluble and reduce the viscosity of guar gum solutions
if they remain with the endosperm after processing. The meal that remains after

26
extraction of the endosperm contains approximately 35% protein and is highly
digestible, thereby making a good animal feed product (Undersander et al., 2015).
Guar seed coats range in color from dull white to black. Darker seeds are
believed to be of a lower quality (less gum content) than lighter seeds and are often sold
at lower prices than lighter beans. However, studies have shown that darker seeds yield
higher percentage endosperm by mass, and gum content is not affected by darkening of
seeds (Liu et al., 2007). However, darker beans may not be as desirable for making
light-colored foods (e.g., cream cheese or ice cream) or other products where color is an
aesthetic concern.
The objective of this experiment was to design an experimental process to
produce refined guar splits. Tests were conducted to analyze attrition mill settings for
splitting the beans, heating intervals, and methods for polishing split beans. Refined
splits were analyzed for quality by measuring viscosity and color of a 0.92% solids
solution. Quality metrics desired by industry are not available in literature, however,
based on feedback from several end users, the current experiments were designed to
achieve a target viscosity of at least 6500 cP and a white color based on the three
dimensional “CIE” system (commition intenatioale de l’Eclairage). Information
regarding color parameters were not provided during initial development of the pilot-
scale system.
27
Methods
Processing
Guar beans obtained from a commercial elevator were aspirated prior to heating,
splitting, and polishing to remove lightweight foreign matter picked up during harvest,
including sticks, leaves, seed pods, and dust. After aspirating, the guar beans were
weighed into 2.27 kg (5 lbs.) samples to be heated. Samples were dried at 93°C (200°F),
121°C (250°F), or 149°C (300°F) for 10, 20, or 30 minute intervals with a batch drying
oven (Model 31-350ER; Quincy Lab, INC.; Chicago, Ill). Higher heating temperatures
were tested than those used previously to determine if higher heating temperatures
would positively affect quality parameters.
It was predicted that heating time and temperature would be significant in the
predictive models for the viscosity and processing time. Many agricultural products
such as soybeans are roasted prior to dehulling to separate the husk from the endosperm
because the beans shrink at a faster rate than the husk, thus gently separating the two
components. Roasting soybeans at 71°C (160°F) makes hulls fragile and allows easy
separation from the kernels, thus making the hulling process more efficient (Moran,
1964). Similarly, it was expected that heating guar would increase the efficiency of the
polishing step.
After heating, the samples were processed with a Bauer Disk Attrition Mill
(Model 1482; The Bauer Bros. Co. Manufacturing; Springfield, OH). A mildly abrasive
plate (Bauer Mill plate 6908) was used for the splitting process (Figure 13). Plate

28
spacing was adjusted subjectively prior to processing the material to yield the maximum
number of splits without pulverizing the endosperm.
Figure 13. Bauer mill plate 6908.
After the splitting process, it was determined by visual observation that further
processing was necessary to remove fines from the samples and polish the husks from
the endosperm. Samples were sieved on a Ro-Tap mechanical sieve (Model RX-94;
W.S. Tyler; Mento, OH) according to ASTM Standard C136M. Sieves were tested, and
a number 12 sieve was selected for sieving fine particles from the split beans.
Sieved samples were polished using a tangential abrasive disk dehuller (TADD)
until target mass losses of 20%, 30% or 40% were achieved. The TADD has six
abrasive disks that rotate inside a drum that holds the material. As the disks rotate, the

29
beans are rubbed against the disks, and the husks are polished off. Samples were
aspirated periodically to remove dust and fine materials, which degrade the performance
of the mill as they buildup in the milling chamber. The process flow diagram for the
tested process is shown in Figure 14. While the TADD is not readily available on a
commercial-scale, the Chopin bran finisher discussed in chapter 2 for polishing is
limited in scale and variability compared to a commercial bran finisher.
Figure 14. Process flow for experimental procedure.
30
Quality Measures
Refined splits were added to approximately 150mL of water and placed in a
water bath for thirty minutes. The solution was then sheared for one minute using a
Waring blender (Model 31BL92, Dynamics Corporation of America, New Hartford,
CT). After shearing, the solution was placed in an 85°C water bath (Type 89032-226,
VWR International, West Chester, PA) for approximately one hour. After one hour,
visual inspection was used to ensure that all solids were hydrated, and soaking times
were adjusted if needed. Solutions were sheared for a second time, and water was added
to reach a solids concentration of 0.92%. After water was added, the solutions were
placed in a water bath at room temperature to cool and allow the solutions to stabilize.
Viscosity was measured using a Brookfield LV viscometer (LVDV-III, Brookfield
Engineering Laboratories, Middleboro, MA) after the solutions reached room
temperature.
After viscosity tests were conducted, solution colors were analyzed with a
spectrophotometer (Model LSXE; Hunter Associates Laboratory; Reston, Va.) to
determine if differences in heating intervals and polishing affected color. The equipment
was calibrated prior to analyzing samples each day using a calibration kit (Hunter
Laboratory; Reston, VA). Approximately 150mL of solution was transferred to a glass
sample cup which was then placed on the instrument for analysis. A light source
illuminates a sample to be measured, and the light reflected by the object passes through
a grating where the light is split into its spectral components. A diode array measures
the wavelength of the components, and the instrument measures sample color against an

31
internal reference standard. Color is defined in a three dimensional space consisting of
lightness, saturation, and hue. These parameters are mathematically converted to a three
dimensional spherical space (the commition intenatioale de l’Eclairage or “CIE”) that is
easier to discuss. The CIE includes lightness (L*), red-green (a*), and blue-yellow (b*)
parameters, which were used for statistical analysis. A pure white sample, which is most
desirable for many food applications, would have values of L*, a*, and b* of “zero.”
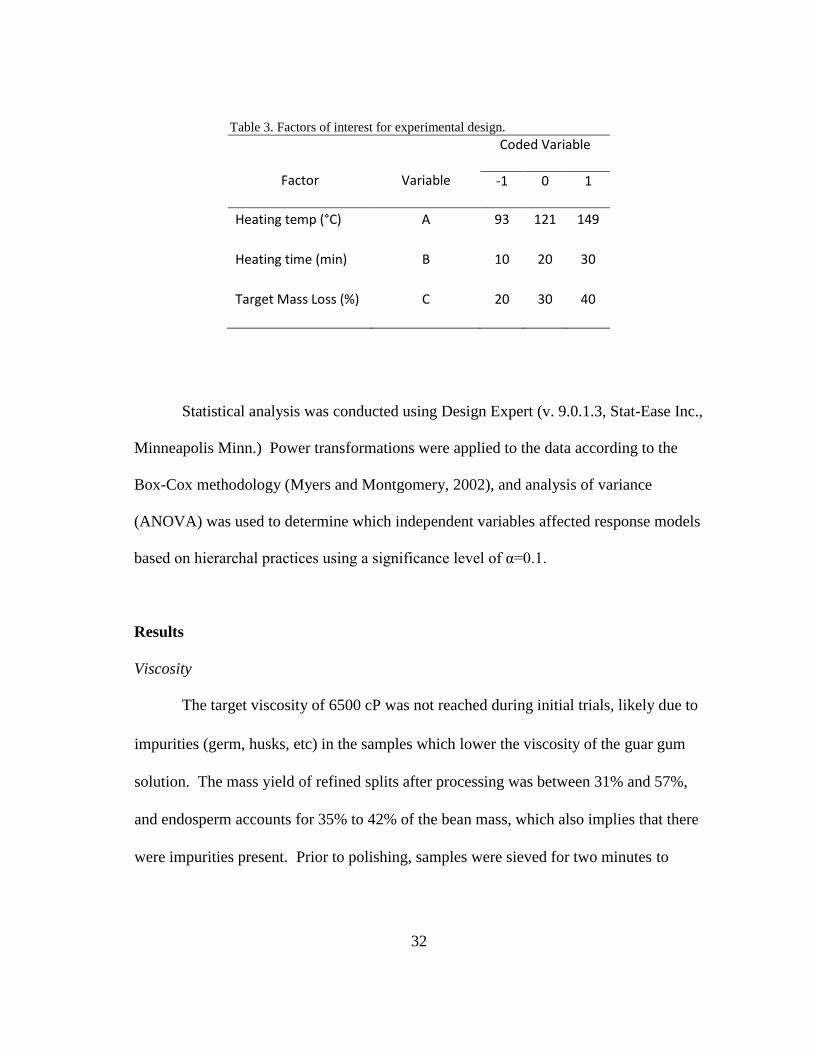
Experimental Design
A two-level, three factorial response surface experimental design with three
center points was used to develop predictive models relating heating time, heating
temperature, and target mass loss during polishing, to polishing time, viscosity and color
of the refined guar split solution (Table 3). Factorial designs are used in experiments
where it is necessary to investigate the effects of factors on a response variable, which
include main effects and interactions (Myers and Montgomery, 2002). A full-factorial
response surface design was chosen to efficiently collect response data for the factors of
this experiment.
32
Table 3. Factors of interest for experimental design.
Factor Variable
Coded Variable
-1 0 1
Heating temp (°C) A 93 121 149
Heating time (min) B 10 20 30
Target Mass Loss (%) C 20 30 40
Statistical analysis was conducted using Design Expert (v. 9.0.1.3, Stat-Ease Inc.,
Minneapolis Minn.) Power transformations were applied to the data according to the
Box-Cox methodology (Myers and Montgomery, 2002), and analysis of variance
(ANOVA) was used to determine which independent variables affected response models
based on hierarchal practices using a significance level of α=0.1.
Results
Viscosity
The target viscosity of 6500 cP was not reached during initial trials, likely due to
impurities (germ, husks, etc) in the samples which lower the viscosity of the guar gum
solution. The mass yield of refined splits after processing was between 31% and 57%,
and endosperm accounts for 35% to 42% of the bean mass, which also implies that there
were impurities present. Prior to polishing, samples were sieved for two minutes to
33
remove fines from the samples. After polishing, an additional sieving step of one minute
was added to remove more foreign materials and an increase in viscosity was seen for all
samples. The target viscosity was reached for some of the samples. Mass yield of
refined splits after additional sieving was between 27% and 55%.
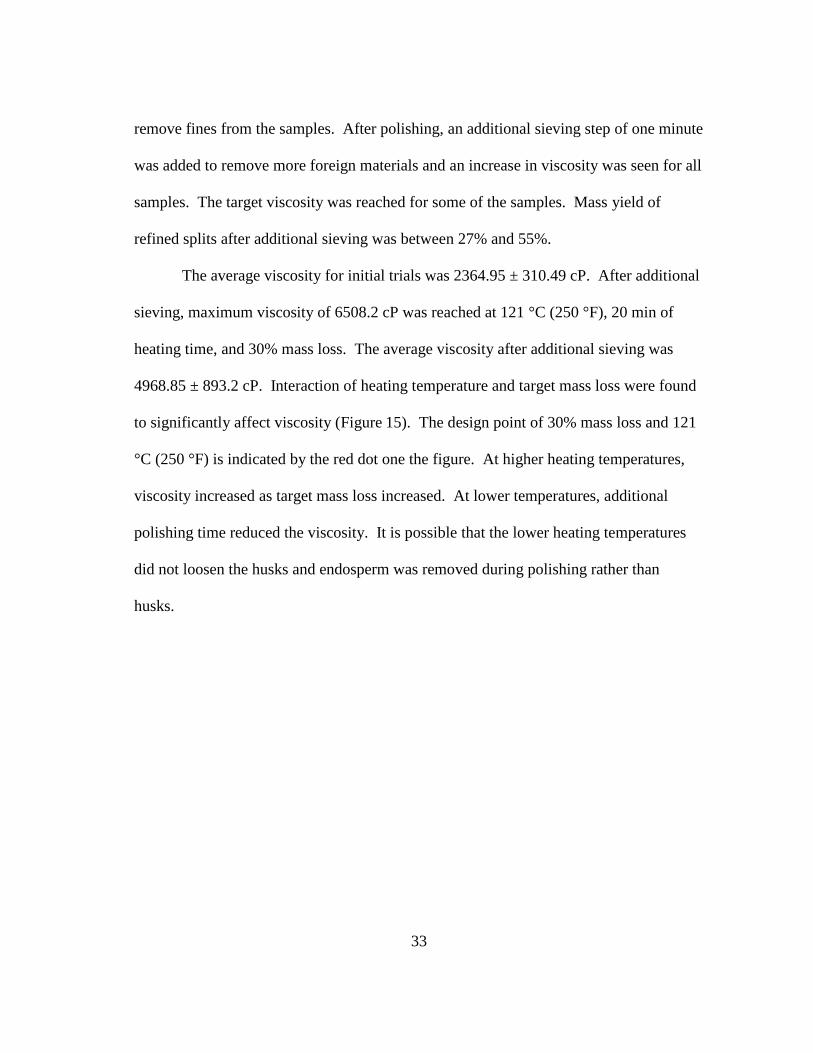
The average viscosity for initial trials was 2364.95 ± 310.49 cP. After additional
sieving, maximum viscosity of 6508.2 cP was reached at 121 °C (250 °F), 20 min of
heating time, and 30% mass loss. The average viscosity after additional sieving was
4968.85 ± 893.2 cP. Interaction of heating temperature and target mass loss were found
to significantly affect viscosity (Figure 15). The design point of 30% mass loss and 121
°C (250 °F) is indicated by the red dot one the figure. At higher heating temperatures,
viscosity increased as target mass loss increased. At lower temperatures, additional
polishing time reduced the viscosity. It is possible that the lower heating temperatures
did not loosen the husks and endosperm was removed during polishing rather than
husks.

34
Figure 15. Effect of heating temperature and mass loss on viscosity.
Color
Results for a*, b*, and L* after initial trials were 20.9, -0.57, and -0.46,
respectively. After additional sieving, the interaction of heating temperature and target
mass loss were found to significantly affect the lightness (L*) color parameter (Figure
16). At lower heating temperatures, increased polishing resulted in a “whiter” sample
indicating that husk material was removed during polishing. At higher heating
temperatures, increased mass loss resulted in a “less white” sample. Longer processing
Design-Expert® Software
Factor Coding: Actual
Viscosity
Design Points
X1 = C: MassLoss
X2 = A: RoastingTemp
Actual Factor
B: RoastingTime = 20
20 25 30 35 40
200
220
240
260
280
300Viscosity (cP)
C: MassLoss (%)
A: R
oast
ingT
emp
(F)
4000
5000
6000
4618.16
5115.3
5115.3
3

35
time is required to remove more mass during polishing (Figure 17). Additional heat
exposure in the polishing chamber likely darkened the samples.
Figure 16. Effect of heating temperature and heating time on L*.
Design-Expert® Software
Factor Coding: Actual
Color L
X1 = C: MassLoss
X2 = A: RoastingTemp
Actual Factor
B: RoastingTime = 17.037
20 25 30 35 40
200
220
240
260
280
300Color L
C: MassLoss (%)
A: R
oast
ingT
emp
(F)
16
16
17
17
16.2001
16.2001
16.8401
16.8401
16.6616
16.6616
16.4881
16.4881

36
Figure 17. Processing time vs target mass loss during polishing.
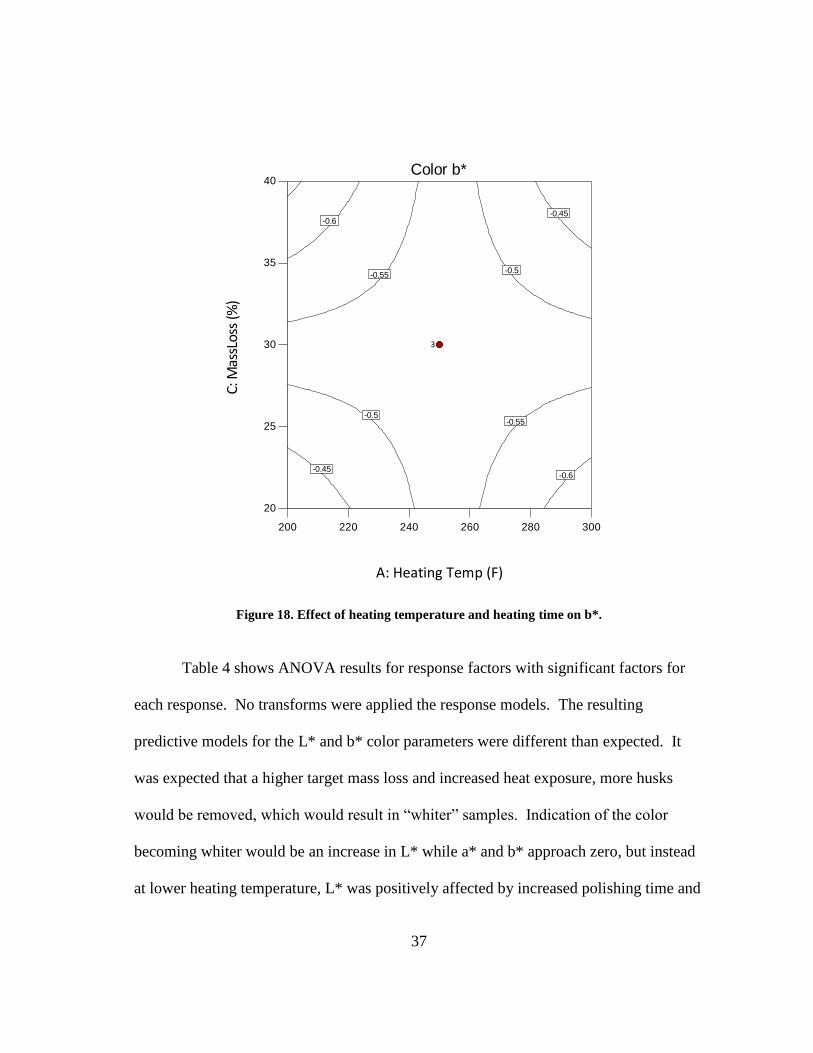
The interaction of heating temperature and target mass loss was significant to the
model for b* (Figure 18). The design point of 121 °C (250 °F) and 30% mass loss is
shown on the figure. At higher heating temperatures, additional processing time
increased the value of b* toward zero, which results in a “whiter” sample. At lower
temperatures, increased processing time decreased the value of b*. It is expected that
the husks are not as brittle at lower temperatures and endosperm is removed as well as
husks during polishing, having a negative effect on b*. There were no significant factors
in the model for the color parameter a*.
0
5
10
15
20
25
30
35
40
45
50
15 20 25 30 35 40 45
Pro
cess
ing
tim
e (m
in)
Target mass loss (%)
37
Figure 18. Effect of heating temperature and heating time on b*.
Table 4 shows ANOVA results for response factors with significant factors for
each response. No transforms were applied the response models. The resulting
predictive models for the L* and b* color parameters were different than expected. It
was expected that a higher target mass loss and increased heat exposure, more husks
would be removed, which would result in “whiter” samples. Indication of the color
becoming whiter would be an increase in L* while a* and b* approach zero, but instead
at lower heating temperature, L* was positively affected by increased polishing time and
Design-Expert® Software
Factor Coding: Actual
Color b
Design Points
X1 = A: RoastingTemp
X2 = C: MassLoss
Actual Factor
B: RoastingTime = 20
200 220 240 260 280 300
20
25
30
35
40Color b*
A: Heating Temp (F)
C: M
assL
oss
(%)
-0.6
-0.6
-0.55
-0.55
-0.5
-0.5
-0.45
-0.45
3

38
b* was negatively affected by increased polishing time. L* was negatively affected by
increased polishing at higher temperatures and b* was positively affected by increased
polishing at higher heating temperatures.
Table 4. ANOVA table for response factors.
Response Factor
Significant Factors
df F-value p-value Mean
Square Error
Viscosity A*C 1 4.9 0.0625 4.02E+06
Color L A*C 1 7.4 0.0298 8.3
Color b A*C 1 5.36 0.0537 0.12
Averages for L*, a*, and b* were 16.4, -0.27 and -0.52, respectively. It is
expected that increased heat exposure made the husks brittle and more were removed
during polishing but the samples were darkened with increased heat exposure, causing
the unexpected predictive models. The beans used for this experiment contained both
dark and light beans. Processing samples with a uniform color would remove some
variation from the experiment.
Summary and Conclusion
The objective this experiment was to develop and analyze a pilot scale system to
produce refined guar splits that will reach a minimum viscosity of 6500cP as well as a
white color using the CIE system. The CIE includes lightness (L*), red-green (a*), and

39
blue-yellow (b*) parameters, which were used for statistical analysis and communication
of results. Predictive models were developed to determine the effect of heating
temperature, heating time, and mass loss during polishing on quality and processing
parameters. Viscosity and color of a guar gum-water solution were measured and
processing time during polishing was measured. This experiment used disk attrition,
heating, polishing, and sieving to produce refined guar splits. Disk attrition was nearly
100% effective in splitting the beans and separating germ from split beans but not
removing the husk, which negatively effects both viscosity and color. Polishing was
achieved with a tangential abrasive disk dehuller.
It was expected that heating time, heating temperature, and degree of polishing
would significantly affect solution viscosity and color, however heating time had no
effect on the quality metrics. Viscosity was affected by heating temperature and target
mass loss during polishing. At higher temperatures, increased polishing time positively
affected viscosity. At lower temperatures, viscosity was negatively affected by
increasing polishing time (and, therefore, mass removed). Additional polishing at lower
temperatures likely removed endosperm in addition to husks, which resulted in lower
viscosities. Color parameters had mixed results. L* was negatively affected by
increased polishing at lower temperatures. At higher temperatures, L* was positively
affected by additional polishing time. B* was positively affected by increased polishing
time at higher temperatures and negatively affected by increased polishing time at lower
temperatures. It was expected that increased heat exposure would result in a whiter
color, indicating that more husks was removed during the polishing step, but color had
40
mixed results. The samples used for this experiment contained both light and dark
beans. Dark beans have a darker endosperm which could have caused the unexpected
color results. Raw seed color, therefore, is expected to have a significant effect on the
value of guar seed and the ability of processors to reach target colors. Viscosity was
positively affected by increasing polishing intervals. Splits that were exposed to longer
polishing resulted in higher viscosity, which indicates that more husks were removed
during the polishing step, but this came at the expense of split yield.
The desired viscosity of 6500cP was reached during this experiment under
certain conditions. Mass yields of refined spits indicated that there were impurities in
the samples used for analyzing viscosity and color, which likely caused low viscosity
results and unexpected color results. Impurities in a sample greatly affect the viscosity
of guar gum solutions. Viscosity drastically decreases by any impurities that are in the
sample. Thoroughly cleaning and polishing splits is critical to achieving a consistently
high viscosity.
The process developed in this experiment is commercially scalable. Increasing
polishing time increased viscosity but reduced mass yield. Increased heating
temperature had some desirable effects on viscosity and color but additional heating will
increase energy costs. Quality metrics from end users could be used to develop
desirability functions for significant process parameters in order to determine the degree
of polishing and heating intervals that should be used. Process parameters can be
optimized to reduce processing costs and maximize yield based on desired quality.

41
CHAPTER IV
SUMMARY AND CONCLUSION
Quality metrics for guar gum desired by industry are not available in literature,
however, based on feedback from several end users, the current experiments were
designed to achieve a target viscosity of at least 6500 cP. Results from phase I showed
that the target viscosity can be reached with the two designed processes. The first
method that was tested was a disk attrition mill. Samples were split, heated, separated to
remove foreign matter, and polished to remove husks. The second method that was
tested was a tangential abrasive disk dehuller (TADD). Samples from both methods
exceeded the project objectives when polished splits were handpicked. Bulk samples
were also analyzed; however, foreign material (i.e. husks and embryo) in the samples
lowered the solution viscosity. Additional cleaning was needed to remove more foreign
materials and produce cleaner samples. Parameters of the heating and polishing
processes were not optimized in this experiment.
The objective of the second experiment was to develop and analyze a pilot scale
system to produce refined guar splits that will reach a minimum viscosity of 6500cP as
well as a white color using the CIE system. The CIE includes lightness (L*), red-green
(a*), and blue-yellow (b*) parameters, which were used for statistical analysis and
communication of results. Predictive models were developed to determine the effect of
heating temperature, heating time, and mass loss during polishing on quality and
processing parameters. Viscosity and color of a guar gum-water solution were measured
42
and processing time during polishing was measured. The desired viscosity of 6500cP
was reached during this experiment under certain conditions. Viscosity was affected by
heating temperature and target mass loss during polishing. At higher temperatures,
increased polishing time positively affected viscosity. At lower temperatures, viscosity
was negatively affected by increasing polishing time. The average viscosity after was
4968.85 ± 893.2 cP. Color parameters had mixed results. L* was negatively affected by
increased polishing at lower temperatures. At higher temperatures, L* was positively
affected by additional polishing time. B* was positively affected by increased polishing
time at higher temperatures and negatively affected by increased polishing time at lower
temperatures. Averages for L*, a*, and b* were 16.4, -0.27 and -0.52, respectively. It
was expected that increased heat exposure would result in a whiter color, indicating that
more husks were removed during the polishing step, but color had mixed results.
Analysis of variance (ANOVA) was used to determine which independent variables
affected response models based on hierarchal practices using a significance level of
α=0.1.
Mass yields of refined spits indicated that there were impurities in the samples
used for analyzing viscosity and color, which likely caused low viscosity results and
unexpected color results. Impurities in a sample greatly affect the viscosity of guar gum
solutions. Viscosity is drastically decreased by any impurities that are in the sample.
Thoroughly cleaning and polishing splits is critical to achieving a consistently high
viscosity. In phase I, handpicked samples and bulk samples from a mechanical
separation process were analyzed for viscosity. These samples exceeded the project

43
requirements. In phase II, bulk samples were analyzed for viscosity. The separation
technology used in phase I to separate germ and split beans was able to be used in phase
II due to funding constraints from the project sponsor. Sieving was used in conjunction
with air aspiration to remove contaminants, however some impurities were in the
samples, which lowered the viscosity.
Increasing polishing time increased viscosity but reduced mass yield. Increased
heating temperature had some desirable effects on viscosity and color but additional
heating will increase energy costs. Quality metrics from end users should be obtained to
determine the degree of polishing and heating intervals that should be used. Process
parameters can be optimized to reduce processing costs and maximize yield based on
desired quality. Darker splits are not as desired by end users and are often purchased at
a discounted rate from processors. Viscosity is not affected by raw bean color, however
darker splits from dark beans will reduce the value of refined splits.

44
REFERENCES
ASABE Standards. (2012). S352.2: Moisture Measurement-Unground Grain and Seeds.
St. Joseph, Mich: ASABE.
ASTM International. (2014). C136/C136M. Standard Test Method for Sieve Analysis of
Fine and Coarse Aggregates. West Conshohocken, PA.: ASTM International
Bolliger, S., H. Wildmoser, H. D. Goff and B. W. Tharp. 2000. Relationships between
ice cream mix viscoelasticity and ice crystal growth in ice cream. International Dairy
Journal 10(11): 791-797.
Chudzikowski, R. (1971). Guar gum and its applications. J Soc Cosmet Chem, 22, 43-60
Goldstein, A. M. and E.N. Alter., R.L. Whistler (Ed.), Industrial Gums, Polysaccharides,
and Their Derivatives, Academic Press, New York (1959)
Liu, W., Peffley, E. B., Powell, R. J., Auld, D. L., & Hou, A. (2007). Association of
Seed Coat Color With Seed Water Uptake, Germination, and Seed Components in Guar
(cyamopsis tetragonoloba (L.) Taub). Journal of Arid Environments, 70(1), 29-38.
doi:http://dx.doi.org/10.1016/j.jaridenv.2006.12.011
Moran, D. F. (1964). Method of dehulling soybeans. U.S. Patent No. 3126932 A.
Mudgil, D., S. Barak and B. Khatkar. 2014. Guar gum: processing, properties and food
applications—A Review. Journal of Food Science and Technology 51(3): 409-418.
Undersander, D.J., D.H. Putnam, A.R. Kaminski, K.A. Kelling, J.D. Doll, E.S. Oplinger,
and J.L. Gunsolus. (2015). Guar. Retrieved from
https://www.hort.purdue.edu/newcrop/afcm/guar.html
Vishwakarma, R., S. K. Nanda, U. S. Shivhare. (2003) Abstract for patent process for
duhulling guar seed from refined guar split production. Application no. 1283/06/14.
Accessed March 21, 2016. Retrieved from http://ipindiaservices.gov.in/publicsearch/
Vishwakarma, R., S. K. Nanda, U. S. Shivhare. (2015). Design of guar dehulling
machine for gaur gum split production. India Patent No. IN121DE2012,
Whistler, R. L. and T. Hymowitz, 1979. Guar: Agronomy, Production, Industrial Use,
and Nutrition. Purdue University Press, West Lafayette, Indiana.

45
APPENDIX A
ADDITIONAL DISK ATTRITION MILL PLATES
Figure 19. Bauer disk attrition mill plate 6945.

46
Figure 20. Bauer disk attrition mill "plate 4."