a probabilistic room location service for wireless networked
TRANSCRIPT

A Probabilistic Room Location Service forWireless Networked Environments
Paul Castro1, Patrick Chiu2, Ted Kremenek1, Richard Muntz1
1UCLA, Department of Computer Science, Los Angeles, CA, 90095, USA{castrop, kremenek, muntz}@cs.ucla.edu
2FX Palo Alto Laboratory, 3400 Hillview Ave, Bldg 4, Palo Alto, CA 94304, [email protected]
Abstract. The popularity of wireless networks has increased in recent years andis becoming a common addition to LANs. In this paper we investigate a noveluse for a wireless network based on the IEEE 802.11 standard: inferring thelocation of a wireless client from signal quality measures. Similar work hasbeen limited to prototype systems that rely on nearest-neighbor techniques toinfer location. In this paper, we describe Nibble, a Wi-Fi location service thatuses Bayesian networks to infer the location of a device. We explain the generaltheory behind the system and how to use the system, along with describing ourexperiences at a university campus building and at a research lab. We alsodiscuss how probabilistic modeling can be applied to a diverse range ofapplications that use sensor data.
1. Introduction
One approach to ubiquitous computing is enabling applications and devices to detectand make use of changing environmental conditions. Such systems are also calledcontext-aware, and important aspects of context include location, nearby people, andaccessible resources (e.g. see [7], [15], [18]). In this paper, we address the problem ofinferring the room location of a device such as a laptop or PDA in a wirelessnetworked environment. Such environments are becoming more prevalent due to thepopularity of wireless local area network products based on the IEEE 802.11 standard(Wi-Fi). These products offer good bandwidth and affordability for office buildings,university campuses, and homes.
Location-aware applications that have been explored or proposed include tour guides[1], interaction with or control of nearby computers, displays, and printers [18], andelectronic Post-it notes associated with a location [3]. Like most existing locationbased systems, these require special hardware to detect the location of the devicerunning the application. For example, one method to do location sensing is to employan infrared transceiver system, as [18]. Another way to obtain location information iswith commercially available GPS, which only works outdoors. By following thedevice until it enters a building, it can locate the nearest building in a research park orcampus.

Providing a location service that requires no extra hardware would make it easier tobuild location-aware application systems and enable more people to use them. In aWi-Fi environment, it is possible to use software to infer the location of a wirelessnetworked device by analyzing the signal strength or signal-noise-ratio of the wirelessaccess points with respect to that device. By using software to infer location, noadditional hardware needs to be attached to a laptop or PDA beyond a wirelessnetwork PC card.
Some techniques that may be applied to inferring location are multilateration, nearestneighbor, and Bayesian networks. For example, in multilateration, an object can inferits location by calculating its range from beacons with known locations using sometype of signal measure like radio frequency (RF) or ultrasound. This works fine inenvironments of uniform density, but the walls and other structural as well as non-structural matter inside a building makes calculating ranges from signal measuresdifficult. In a sense, the space is warped. A nearest neighbor approach that comparessignal samples in a table of values can work, but lacks a well-defined model forcombining data from multiple sources. Our choice is to apply Bayesian networks,which can “learn” the room locations of a building, and its modular structure providesflexibility when the access points are added/removed or spatially reconfigured. Afurther advantage is that other contextual information such as the likelihood that theowner of the device will inhabit a particular location can be easily incorporated intothe Bayesian network model.
Another important consideration is that the wireless signals undulate, which is causedby people walking around and other changes in the ambient space. This “noise” ishandled by a Bayesian network, which assigns probabilities to locations.
The UCLA Multimedia Systems Lab has devised and implemented the Multi-useSensor Environment (MUSE), a middleware architecture for sensor smart spacesemploying Bayesian networks [4]. A location service for Wi-Fi networkedenvironments was prototyped on top of this architecture, and a stand-alone version ofthis location service called Nibble was built. Nibble has been installed for evaluationat Boelter Hall, a university campus building at UCLA, and more recently at anindustrial research lab, FXPAL. In this paper, we will describe how this locationservice works (section 2), our experiences with this system (section 3), and we willdiscuss ways of extending the MUSE sensor model, which is inherently simplebecause of the structure of the Bayesian networks, to compose component-basedlocation services (section 4). Finally, we discuss plans for future work (section 5).
2. Location Service System
The IEEE 802.11 Wi-Fi wireless network infrastructure consists of many wirelessclients and several access points that act as bridges between the wireless network andthe local LAN. Clients primarily use, or “associate,” with the access point that
provides them with the strongest RSSI (received signal strength). As a clients roams,it periodically does a site survey of signal quality measures to determine the bestaccess point with which to associate. As reported in [2] and [16], it is possible toinfer the location of a client from these signal measures. Past approaches have beenlimited to nearest neighbor or error-minimization techniques to infer location fromsignal strengths. In this section we describe a modular probabilistic approach forinferring location that uses Bayesian networks. Through probabilistic modeling wecan create a robust location service with a general, quantifiable measure ofperformance, easily incorporate additional data such as movement histories of users,as well as provide a flexible means to compose a location service out ofheterogeneous components.
2.1 System Overview
Nibble is a stand-alone version of a Wi-Fi location service that is derived from anindoor location service prototyped within the MUSE pervasive sensor infrastructure[4]. Nibble relies on a fusion service to infer the location of a laptop from signalstrength measures between itself and access points in the environment. A fusionservice has two components: 1) an evidential reasoning model that aggregates andinterprets (i.e. fuses) information from sensors and 2) a resource optimization modelfor minimizing the “cost” of gathering data. Sensor data is characterizedprobabilistically and inputted into the fusion service. The output of the fusion serviceis a probability distribution over a random variable that represents some context data.This process is necessary since sensor information, such as Wi-Fi signal qualitymeasures, is fundamentally noisy, subject to intermittent availability, and typicallytoo-low level to be immediately useful to an application.
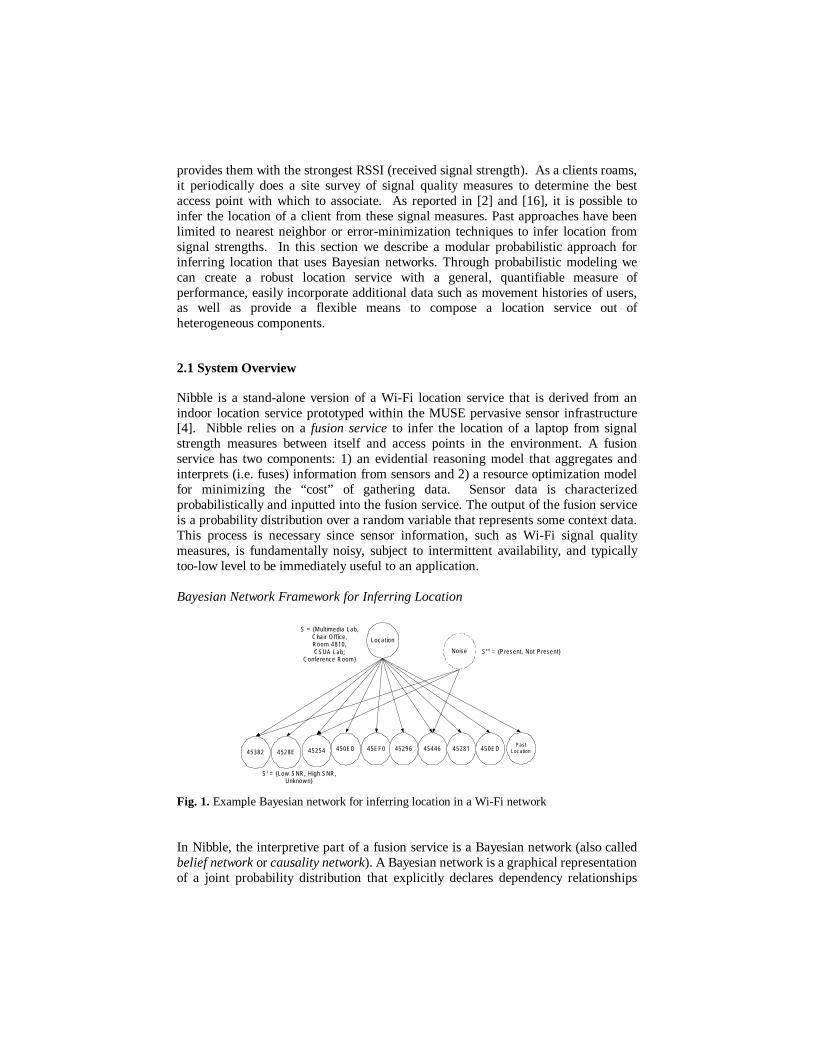
Bayesian Network Framework for Inferring Location
Location
4528E 45254 450ED4528145382 450ED 45EF0 45296 45446
Noise
S = {Multimedia Lab,Chair Office,Room 4810,CSUA Lab;
Conference Room}
S' = {Low SNR, High SNR,Unknown}
S''' = {Present, Not Present}
PastLocation
Fig. 1. Example Bayesian network for inferring location in a Wi-Fi network
In Nibble, the interpretive part of a fusion service is a Bayesian network (also calledbelief network or causality network). A Bayesian network is a graphical representationof a joint probability distribution that explicitly declares dependency relationships
between random variables in the distribution [12]. Because these relationships aredeclared, a joint probability distribution can be constructed modularly thus makingcomputation on this distribution feasible. In our view, the modular structure ofBayesian networks also eases the construction of component-based systems where theoutputs of one fusion service can be used as an input to another.
Figure 1 shows a simple Bayesian network we can use to infer location from the Wi-Fi infrastructure. The network is a rooted tree with directed arcs going from the rootto several terminal nodes. These arcs signify a dependency relationship between theroot node and the terminal nodes. The root node is the “query” variable that describesp(L), the a priori distribution over a set of locations L={v1,…,vi}. The terminal nodesin the network represent “observable” variables that describe p(E|L), the marginalconditional probability that you observe values E={e1…,en} from a sensor given thatyou are in location v in L. Given this network, we can get sensor readingsR={e1,…,em}, for sensors 1 thru m, and calculate p(L|R), the a posterior probabilitydistribution over L, the probability that we are in any location vi given R. In general,any node in the network can be a query variable. For example, we could ask p(s1=e1|L=v3 ,s2= e3), the probability that sensor s1 will read e1 given we are in location v3 andsensor s2 reads e3. The figure also includes a noise node that could affect the outcomeof several sensors.
In the Bayesian network for determining location, values for L and E are quantizedinto discrete values. Nibble can theoretically distinguish ns different locations in a Wi-Fi network where n is the number of output values from a sensor and s is the numberof access points. However, the topology and construction of the building, as well asvarious noise effects, influence the actual number of locations Nibble can distinguish.For Boelter Hall, n=4 and s=10 and for FXPAL, n=4 and s=4.
Nibble has been used to calculate the probability that a laptop is in one of 14 adjacentlocations 10-15 feet apart in an area covering two floors in Boelter Hall, a largebuilding on the UCLA campus. In the current implementation of our system,E={High, Medium, Low, None}, where None=[0], Low=(0,16), Medium=(16,30),High=(30,70) representing the ranges of signal-to-noise ratios (SNR) at eachquantized level as measured between a laptop with a wireless card and an accesspoint. These quantizations are based on early experiments at UCLA. Futureimplementations could have quantizations that are more sensitive to the exponentialattenuation characteristics of the RSSI. It may be beneficial to have more levels withsmaller ranges for quantizations at the higher end of the scale.
Training the Bayesian Network
To infer location using the Bayesian network in Figure 1, it is necessary to providevalues for the a priori distribution p(L) and the marginal distribution p(E|L) for eachaccess point. While it is possible to construct an analytical model to get the marginals,empirical measurements seem to work best [2]. For one of our sites, we took samplesof SNRs for 14 locations over several days. We sampled twice a day in the mid-
morning and early evening. However, we observed that Nibble could correctly inferlocation with even just a few samples at each location.
Calibration can be tedious. Nibble does not require that all locations be declared apriori. Instead, L can be built incrementally. Locations can be added and deleted atanytime. Sampling occurs when a location is initially recorded and “re-sampling” canbe done at anytime. Re-sampling allows the user to adjust the marginal distributionsfor an access point if there is a change that invalidates the current calibration, e.g. achange in the configuration of access points.
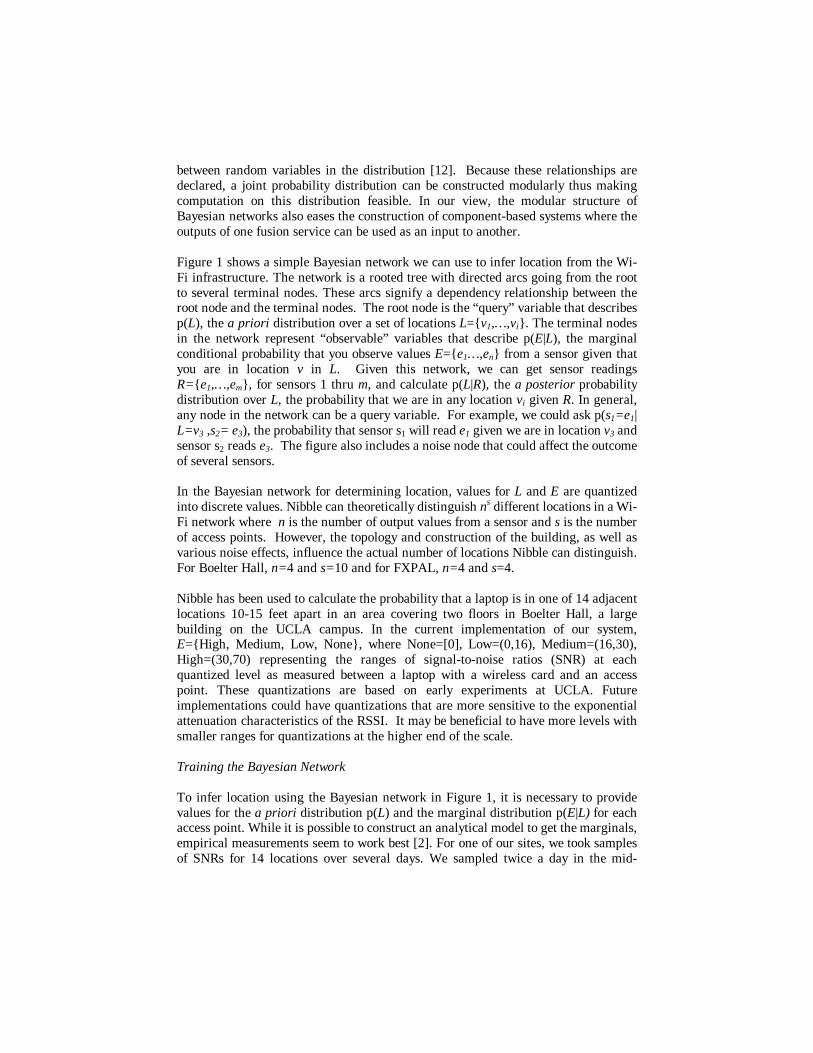
Fig. 2. Main Display of Nibble (top) and display for recording, calibrating, and deletinglocations (bottom).
The default distribution for p(L) is uniform. However, certain people are more likelyto be in some locations rather than others. Profiles of people’s preferences forlocations can easily be incorporated into the Bayesian framework by changing the apriori distribution p(L). Although not part of the current implementation, Nibblecould create a profile automatically by recording the frequency a client is at a certainlocation and updating the distribution over time. This same process could also be usedto detect adjacency relationships between locations and used to more accuratelypinpoint the location of a user. For example, it may be physically impossible for atransition to occur between locations v1 to v2. Nibble models this similar to a HiddenMarkov model where an additional node in the Bayesian network records thetransition probabilities for all locations. Currently, these adjacency relationships arerecorded manually.
2.2 Using Nibble
Nibble is implemented using Java JDK 1.3 and currently works with Lucent OrinocoWi-Fi cards running under MS Windows (see Appendix). The basic Nibble packageincludes a GUI that allows users to build and calibrate a location service as well asdisplay and log the results of the fusion service. There is also a simple API thatprogrammers can use to interface their applications to Nibble and make themlocation-aware (see Appendix).
Figure 2 shows the main display screen in the Nibble GUI while it is running. Nibbleinfers location from the SNR measures received from the Wi-Fi network card everytwo seconds. Nibble timestamps and then prints the resulting probability distributionover the set of locations in the large text area at the bottom half of the screen. Themost likely location value is printed at the top of the text box. In the figure, Nibble istracking 5 locations and the most likely location is the “media lab (3514).”
Adding a location can be accomplished at the “Locations” screen. It is useful to thinkof locations in two ways when using Nibble. First, there are distinguishable physicallocations such as offices, closets, hallways, etc. Second, there are distinguishablesignal locations where the signal quality measures are probabilistically consistentwithin a location. Nibble identifies signal locations rather than physical locations.These two types of locations do not necessarily map one-to-one but since physicalcharacteristics of the space affect the signal measures there is a correlation. However,there may be physical locations that are indistinguishable from a signal perspectiveand conversely, there may be physical locations that encompass many signallocations.
To record a location, the user should go to that location and type in a name for it.When the user clicks the “remember” button Nibble will take signal quality samplesat 1 per second for 10 seconds. When sampling is complete, the new location is addedto the location list and is included in all future inferences. Nibble does not enforce anynaming schemes so multiple labels can be given to the same location or multiplelocations can have the same name. The latter is useful when there are many signallocations for one physical location. The former is useful if you want to add attributesto location labels such as “Media lab (evening)” and “Media lab (morning).” Thisassumes that the signal measures are different in the morning and evening.
If Nibble is unable to infer a location, it will display “???” as the most likely location.This usually occurs for locations that are “under-sampled” (or not calibrated at all).When a location is under-sampled, the initial 10 samples for a single location are notsufficient and the calculated marginal conditional probabilities are incorrect. Userscan remedy this by “reinforcing” a location by selecting a location value in thelocation list and clicking the “reinforce” button. Reinforcing is the same as samplingexcept new samples are added to modify the current marginals.
Reinforcement of locations may be insufficient to rectify incorrect location inferencesparticularly if there is a drastic change in the placement or configuration of access
points. In this case, users can elect to delete locations from the location list using the“forget” button and build a new location model. Though not part of the currentimplementation, it is also possible to eliminate an access point from the model (e.g. ifit moves). Locations can then be re-sampled and this will put the access point back inthe model but with new marginals.
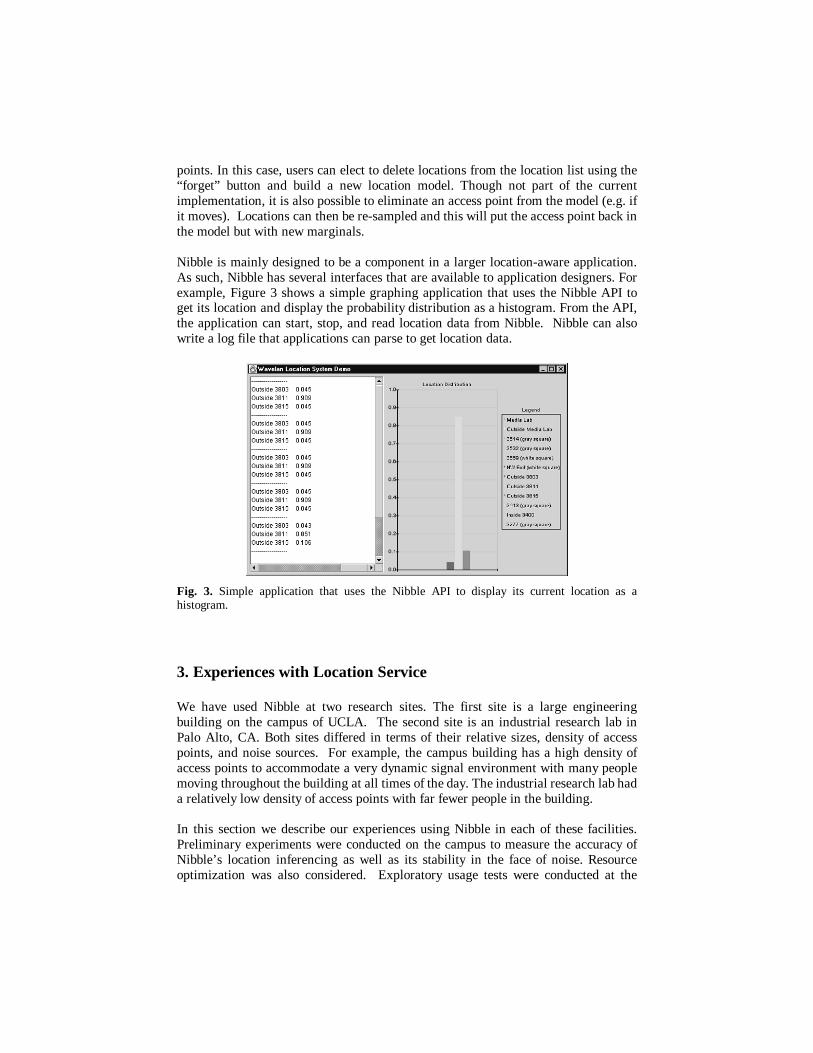
Nibble is mainly designed to be a component in a larger location-aware application.As such, Nibble has several interfaces that are available to application designers. Forexample, Figure 3 shows a simple graphing application that uses the Nibble API toget its location and display the probability distribution as a histogram. From the API,the application can start, stop, and read location data from Nibble. Nibble can alsowrite a log file that applications can parse to get location data.
Fig. 3. Simple application that uses the Nibble API to display its current location as ahistogram.
3. Experiences with Location Service
We have used Nibble at two research sites. The first site is a large engineeringbuilding on the campus of UCLA. The second site is an industrial research lab inPalo Alto, CA. Both sites differed in terms of their relative sizes, density of accesspoints, and noise sources. For example, the campus building has a high density ofaccess points to accommodate a very dynamic signal environment with many peoplemoving throughout the building at all times of the day. The industrial research lab hada relatively low density of access points with far fewer people in the building.
In this section we describe our experiences using Nibble in each of these facilities.Preliminary experiments were conducted on the campus to measure the accuracy ofNibble’s location inferencing as well as its stability in the face of noise. Resourceoptimization was also considered. Exploratory usage tests were conducted at the
industrial site and we report on the performance of Nibble in its support of a novellocation-aware application.
3.1 Boelter Hall at UCLA
Boelter Hall is one of three engineering buildings on the UCLA campus. The hall is alarge, 8-story building, which houses 4 engineering departments, the engineeringlibrary, and many classrooms. The building is square shaped, and in the center is anopen-sky courtyard. During the daytime there are hundreds of students in Boelter Hallattending lectures and labs, and in-between classes the halls are filled with people.The Department of Computer Science is located on the third and fourth floors ofBoelter Hall. Within the department there are 14 Wi-Fi access points that provideinfrastructure support for many laptops.
The construction of the building causes severe attenuation of RF signal strength so ahigh density of access points is necessary. The current configuration allowsconnectivity to the wireless network in almost all locations in the department andeven the courtyard. However, the density of access points varies in different parts ofthe building so some locations always have weak signals.
Hallway Tracking Tests
We conducted initial experiments to test the ability of Nibble to distinguish betweendifferent locations of a laptop as the user moves through the building at walkingspeeds. We conducted the tests primarily in the hallways of the building whereconnectivity was fair. To aid us in our experiments we implemented a distributiondisplay that showed the probability distribution over locations as a histogram. Werecorded 12 adjacent locations in the system and tested two different paths throughthese locations. There were a total of 10 access points that could be detected in thesepaths. The first path was a simple straight-line path from one end of the hallway toanother. The second path went around the circumference of the building. This pathwent through different hallways and went from areas where the density of accesspoints was high to areas where the density was lower. Part of the path also crossed anoutdoor walkway.
We calibrated the system over a few days. For each location we took about 50 to 100samples. In some locations we took fewer samples because we did not have access tothe location after hours. Areas with weaker connectivity also prevented us from takingas many samples since our original implementation required connectivity to theMUSE infrastructure [4]. This is not an issue with the current implementation ofNibble.
We measured the performance of the system by tabulating the correct, incorrect, and“don’t know” readings. Correct readings corresponded to when the most likelyinferred location was the actual location as observed by the user. Incorrect readingscorresponded to when the most likely location was not the actual location. “Don’t

know” readings occurred if Nibble could not infer any location; this primarilyhappened in locations where we could not take enough samples. We defined anaccuracy metric as the #correct readings/(#readings − #don’t knows).
We experienced very good performance overall. Nibble achieved an accuracy ofaround 97% for the two different paths. The total number of “don’t know” readingsaccounted for about 15% of all the readings. However, these readings mostly occurredfor the same parts in the building indicating either an under-sampled condition forthose locations or a noisy space. For example, one of these spaces was near largemetal fan ducts on an outdoor balcony.
The location service updates its inferred location every three seconds. As we changedour actual locations, the service sometimes took several inference cycles to update themost likely location to the correct one. This is most likely due to our sampling methodwhere we concentrated mostly on the “center” of a physical space. We wouldgenerally have to come close to the center of the space for the location service toregister the correct location. Later, we altered our sampling method to includesamples from the boundaries (as perceived by the user) of the space. This generallyproduced more consistent results.
Several locations we recorded in the hallways of Boelter Hall could confuse thesystem. This is due to generally weak connectivity (all signal measures look similar)and noise. However, the system performed well in localizing our position in thehallway to several adjacent locations with one of those locations being correct. Evenwithout adjacency information in the Bayesian network, the location service inferredwe were in a location close to our actual location.
3.2 Research Lab at FXPAL
The FX Palo Alto Laboratory (FXPAL) resides on the second floor of a building thatis rectangular in shape and measures 224 by 96 feet. There are about 40 offices, threesmall clusters of cubicles, and several conference rooms (see Figure 4). The FXPALWi-Fi environment consists of 4 WaveLAN access points and a number of wirelesslaptops. There are also 3 iPAQ Wi-Fi access points and wireless iPAQ PDAs; thesehave not yet been integrated with a location service.
Room Location Visualizer
We designed a room location visualizer and integrated it with the location datastreamed out by Nibble. This visualizer is based on a blueprint of the building. Theprobabilities are quantized into 5 intervals: (0.0, 0.2], (0.2, 0.4], …, (0.8, 1.0]. Roomsare show in different shading levels according to their probability (see Figure 5). Asubset of the rooms is targeted for each device, and the targeted rooms are shaded inlight gray. Restricting to a subset of rooms increases the accuracy of the location

service because this leaves fewer rooms in close proximity. Nibble updates thelocation probabilities every two seconds.
Accuracy
We tested the Nibble location service by having one of the FXPAL researchers carry alaptop whenever he went to a meeting or to work in another room other than his ownoffice. There are 9 room locations that are frequented by Patrick: 3 conference rooms,2 collaborators' offices (cubicles), his own office, his manager’s office, a lounge, anda patio outside the building near a coffee area.
We found Nibble always able to distinguish between the 3 conference rooms. Theprobabilities usually fell in (0.6, 0.8] and (0.8, 1.0]. One factor is that the conferencerooms are not adjacent to each other. The nearest two are diagonally across ahallway. Another factor is that conference rooms are larger than offices and cubicles.
Fig. 4. Room location visualizer with floor plan of FXPAL.
Sometimes Nibble was confused between adjacent offices (dimensions are 8 x 14feet). The probabilities usually fell in the range (0.4, 0.6]. Nibble is able todistinguish offices that are separated by another office, with probabilities in (0.8, 1.0].In our evaluation, this level of accuracy was sufficient, because the researcher didwork on his laptop in his office and not his neighbor’s.
Cubicle clusters tested the limits of Nibble. Nibble was able to locate a cluster, butnot able to distinguish between the cubicles within a cluster. A cubicle’s dimension isabout 6 x 8 feet, with 2 to 4 cubicles per cluster. The clusters are dispersed far fromeach other on the building floor. Like the uncertainty caused by adjacent offices,accuracy can be improved for cubicles in the same cluster if we know which cubiclein that cluster a user and his laptop are more likely to frequent.
A Room-Aware Application at FXPAL
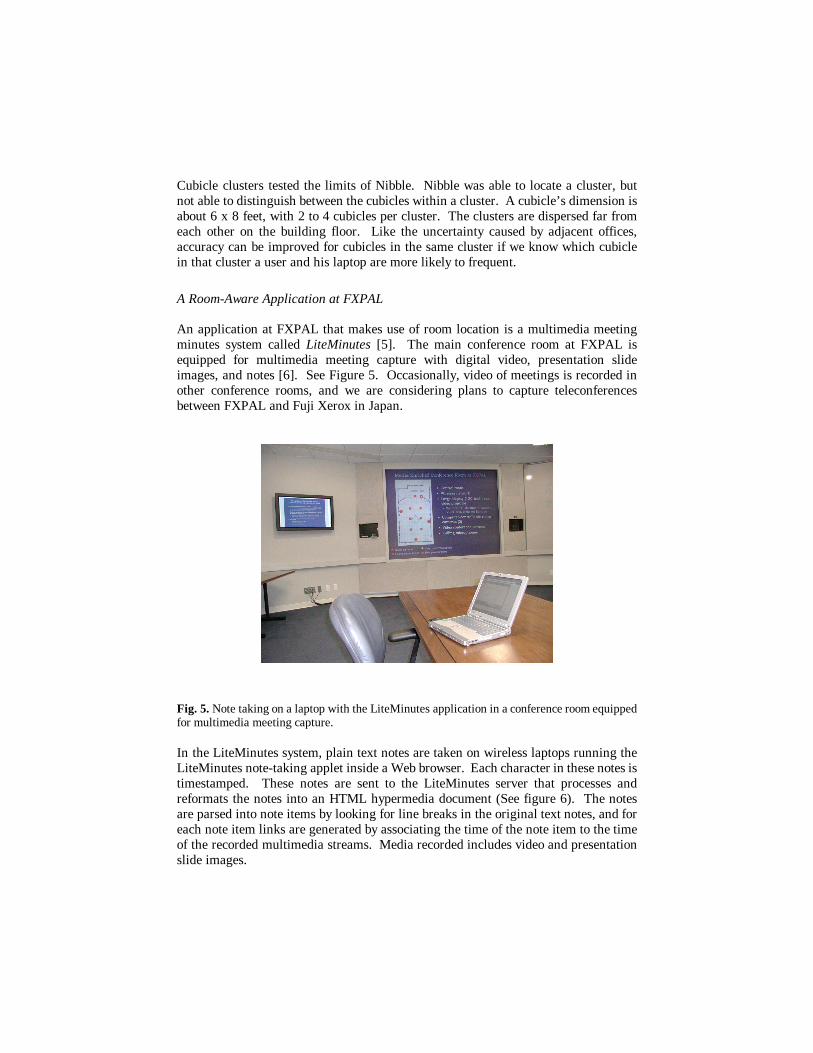
An application at FXPAL that makes use of room location is a multimedia meetingminutes system called LiteMinutes [5]. The main conference room at FXPAL isequipped for multimedia meeting capture with digital video, presentation slideimages, and notes [6]. See Figure 5. Occasionally, video of meetings is recorded inother conference rooms, and we are considering plans to capture teleconferencesbetween FXPAL and Fuji Xerox in Japan.
Fig. 5. Note taking on a laptop with the LiteMinutes application in a conference room equippedfor multimedia meeting capture.
In the LiteMinutes system, plain text notes are taken on wireless laptops running theLiteMinutes note-taking applet inside a Web browser. Each character in these notes istimestamped. These notes are sent to the LiteMinutes server that processes andreformats the notes into an HTML hypermedia document (See figure 6). The notesare parsed into note items by looking for line breaks in the original text notes, and foreach note item links are generated by associating the time of the note item to the timeof the recorded multimedia streams. Media recorded includes video and presentationslide images.
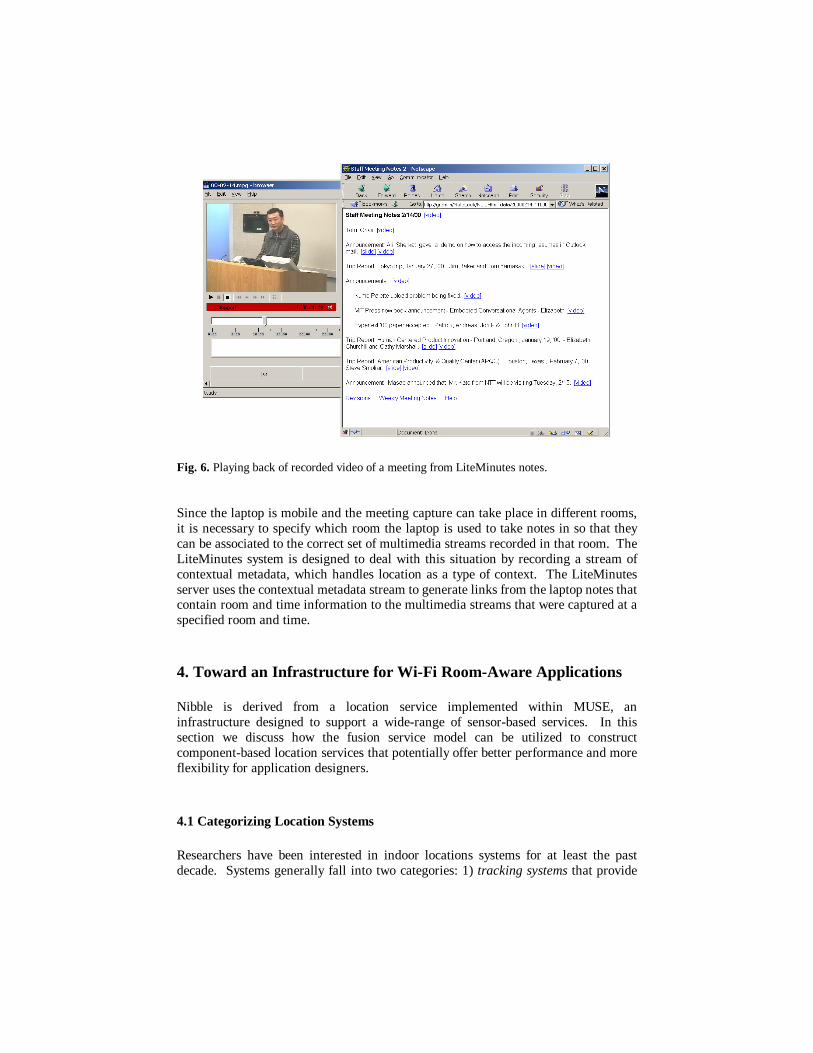
Fig. 6. Playing back of recorded video of a meeting from LiteMinutes notes.
Since the laptop is mobile and the meeting capture can take place in different rooms,it is necessary to specify which room the laptop is used to take notes in so that theycan be associated to the correct set of multimedia streams recorded in that room. TheLiteMinutes system is designed to deal with this situation by recording a stream ofcontextual metadata, which handles location as a type of context. The LiteMinutesserver uses the contextual metadata stream to generate links from the laptop notes thatcontain room and time information to the multimedia streams that were captured at aspecified room and time.
4. Toward an Infrastructure for Wi-Fi Room-Aware Applications
Nibble is derived from a location service implemented within MUSE, aninfrastructure designed to support a wide-range of sensor-based services. In thissection we discuss how the fusion service model can be utilized to constructcomponent-based location services that potentially offer better performance and moreflexibility for application designers.
4.1 Categorizing Location Systems
Researchers have been interested in indoor locations systems for at least the pastdecade. Systems generally fall into two categories: 1) tracking systems that provide
location information from a central infrastructure and 2) distributed beacon systemsthat allow a client to infer location from beacons they see in the environment.
In the first case, the location system depends on identification messages from trackedobjects that get processed in an infrastructure specific way to infer the location of theclient. For example, the Xerox ParcTab and Active Badge system can localize a userto a room based on the physical location of the receiver node that detects client’sidentification message [18][17]. More precise location systems such as BATS and3D-iD use arrays of RF sensors capable of locating specially tagged objects in three-dimensional space within centimeters [8][13]. User identification is also possible intracking systems. The SmartFloor project can identify and track a user using HiddenMarkov models based on “footfall” signatures acquired from a floor equipped withload sensors [11].
In the second case, the environment provides beacons from which a client can infer itscurrent location. Early examples of this include the CyberGuide that used IR beaconsas proximity sensors [1]. A more recent example is the Cricket location system fromM.I.T. [14] that uses RF and ultrasonic beacons that send out location identificationstrings that can be detected by a mobile user.
At first glance, a Wi-Fi –based location system such as Nibble is a beacon system.This is not necessarily true. For example, it is possible to implement a process at eachaccess point that collects all SNR data from clients. Then a backend process couldinfer the location of any Wi-Fi client by considering all access point data. RADARwas implemented in this way [2]. One consequence of this implementation is thatdevices can easily know the location of other devices in the network. Privacy in thiscase is an important concern. The current “beacon” implementation of Nibble allowsthe device to be “invisible” as long as it just monitors the network and does nottransmit any network packets.
4.2 Component-based location systems
The fusion service model used in Nibble is not limited to a Wi-Fi indoor locationsystem. Other location systems are compatible with probabilistic formulations. Forexample, Cricket beacons use radio frequency (RF) and ultrasonic signals to broadcasta string to nearby clients that identifies the current spatial location of the client. Sincemultiple beacons can be heard, the client assumes that the beacon that it is closest toidentifies the correct location. One useful assumption is that the beacons are onlyplaced near entranceways or partitions between spaces; this ensures that the closest(and hence correct) beacon can be identified with a high probability.
A fusion service utilizing Cricket beacons does not require exact placement ofbeacons though the trade-off is the need to calibrate the Bayesian network to get themarginals. For Cricket, the beacon values can be quantized as E={Heard and Closest,Heard, Not Heard}, and the fusion service would calculate the P (L|R), the probability

that it is in some location in L given that it observes R={E1,…,Em} from the Cricketbeacons. This potentially increases the resolution of Cricket from s locations to 3s
locations since the original system requires one beacon per location. Given the limitedrange of the beacons, however, at anytime you will see less than s beacons at alocation.
Cricket
Beacon Beacon Beacon
Cricket-Nibble
Nibble
AccessPoint
AccessPoint
AccessPoint
Fig. 7. Composing two location services
One distinct advantage of the fusion service approach is the ability to composeservices together. Composability is a major reason MUSE adopts a general model ofdata aggregation and interpretation. For example, Figure 7 shows a possible Bayesiannetwork that combines Cricket and Nibble into a new Cricket-Nibble fusion servicethat utilizes both. The Cricket-Nibble service can be used by applications in place ofjust Nibble or Cricket since the output is still a probability distribution over locations,and the resource optimizations possible in Nibble can be applied to Cricket-Nibble.
Composability is a step towards providing different degrees of privacy for a user of alocation system. For example, a user may allow less privileged users access to coarselocation information (e.g. the building level) about her and allow a restricted set ofusers higher resolution data (e.g. the room level). To set up this partition theinfrastructure allows different permissions on accessing each fusion service wheresome users can only get “low quality” information while other users get “highquality” information.
Characterizing Information Quality
In many physical sensor systems, power or communication bandwidth is highlyconstrained [10]. Having a quantifiable measure of quality for a fusion service allowsapplications the ability to choose between fusion services based on a unified measureof expected performance for a given “cost.” For example, there may be two differentfusion services capable of inferring location but one service may consume a lot of

power or bandwidth and be 90% accurate while another is only 75% accurate butconsumes far less resources.
We define the term “Quality-of-Information” (QoI) to characterize the performance ofa fusion service in terms of: 1) accuracy of the inference as measured by an outsideobserver and 2) the level of confidence it has in its measure [4]. For example, auniform distribution over all possible locations is an undesirable result. The best resultwould be an “impulse” for a single value v in L and p(v)=1.0. We capture thisintuition using the information theoretic concept of entropy, which we approximate bythe probability of the most likely outcome of the query variable. Intuitively, a fusionservice that infers a most likely location with p=90% is better than a service thatinfers a most likely location with p=50%. Note that there is a difference between the“confidence” of the system and the “resolution” of the system. A location service thatcan only distinguish between 2 large locations (e.g. 2 floors in a building) is notnecessarily worse than a location service that can distinguish many small locations. Ifboth are always 90% sure of their inferences and are 90% accurate, then we say theyhave the same QoI regardless of their resolution differences. Of course, someone mayprefer higher resolution location information but QoI is a measure relative to thedesired or specified resolution of the “query variable” (e.g. location).
Given a measure of quality, we can pose an optimization problem: achieve a high QoIat minimal cost. This is similar to the “trouble-shooting” optimization problem in [9].In Nibble, we assume a unit cost for consulting an access point and now we wouldlike to get accurate location information by consulting the minimal number of accesspoints. Our approach is to consult one access point at a time until we reach a userspecified level of QoI or we run out of access points. We consult access points thatcontain the “most information” about location before we consult access points with“less information.” To measure the amount of information we can potentially getfrom consulting an access point we use a heuristic based on an off-line sensitivityanalysis of the Bayesian network [4]. Note that this resource optimization approachcan be generalized to all fusion services.
Optimizing QoI for a Wi-Fi Location Service
To test our ideas we used an enhanced version of the location service where the clientcan specify a desired level of quality for the inferred location information. The fusionservice would attempt to achieve this quality but consult the minimal number ofaccess points. For example, the client could specify a quality setting Y=0.9 whichmeans that the most likely location should have a probability of 0.9. The locationservice will consult access points (ordered by our heuristic) one at a time until itachieves this quality setting.

Accuracy vs Precision
0.00%
20.00%
40.00%
60.00%
80.00%
100.00%
120.00%
Precision Y
Precision (1-H(X)/Hmax(X)
Acc
ura
cy Y=.1
Y=.5
Y=.9
All Sensors
Number of Sensor Readings vs Time
0
100
200
300
400
500
600
Time (ms)
Y=.1Y=.5Y=.9All Sensors
Fig. 8. Accuracy vs. QoI (left) and Cost vs. QoI
Figure 8 shows the effect on accuracy and cost for quality settings ofY={0.1,0.5,0.9,ALL} where ALL means consult all access points. For a qualitysetting of Y=ALL, the location service was 97% accurate but it was the mostexpensive since it consulted all access points for each inference. For a quality settingof Y=0.9, the location service was 96% accurate but it was considerable lessexpensive because it only consulted around three access points for each inference. Forthe other settings, the location service was about 50% accurate.

5. Conclusions and Future Work
In this paper we described our experiences using Nibble, a probabilistic locationservice for a Wi-Fi networked environment. We explained the MUSE sensor fusionmodel and how it is possible to build component-based fusion services to inferlocation. We are currently implementing an enhanced version of Nibble that inferslocation using a heterogeneous set of sensors. The UCLA Multimedia SystemsLaboratory has constructed a small, inexpensive sensor board that can communicatewith a PC through a standard serial port. The sensor board is capable of measuringtemperature, humidity, orientation, and acceleration. The inclusion of this sensor datacan improve the overall performance and resolution of Nibble. As an example,oftentimes when a user enters a room they will place their laptop in a specificlocation. If two locations are nearly indistinguishable from Wi-Fi measurements butthe laptop is placed at each location with different orientations, we can use the digitalcompass to get the laptop location. This is also useful if we need to discriminatelocations within a single physical space. Similarly, temperature and humidity can beused to distinguish colder and warmer environments (e.g. a machine room versus anoffice). The more general problem of “grafting” together services in an automatedfashion is a topic of research we plan to investigate.
References
1. Abowd, G., Atkeson, C., Hong, J., Long, S., Kooper, R., and Pinkerton, M. Cyberguide: Amobile context-aware tour guide. ACM Wireless Networks, 3 (1997), pp. 421-4333.
2. Bahl, P., Padmananbhan, V. RADAR: An In-Building RF-based User Location andTracking System. In Proceedings of IEEE INFOCOM 2000, Tel-Aviv, Israel, March 2000.IEEE Computer Society Press.
3. Brown, P.J. The stick-e document: a framework for creating context-aware applications. InProceedings of Electronic Publishing ’96, pp. 259-272.
4. Castro, P. and Muntz, R. Managing context for smart spaces, IEEE PersonalCommunications, vol.7, no. 5, October 2000.
5. Chiu, P., Boreczky, J., Girgensohn, A., Kimber, D. LiteMinutes: An Internet-basedsystem for multimedia minutes. Proceedings of Tenth World Wide Web Conference(2001, pp. 140-149. See http://www10.org.
6. Chiu, P., Kapuskar, A., Reitmeier, S., and Wilcox, L. Room with a Rear View: MeetingCapture in a Multimedia Conference Room. IEEE Multimedia Magazine, vol. 7, no. 4,Oct-Dec 2000, pp. 48-54.
7. Dey, A. Providing Architectural Support for Building Context-Aware Applications. PhDThesis. Georgia Institute of Technology, Department of Computer Science.
8. Harter, A., Hopper, A., Steggles, P., Ward, A., Webster, P. The Anatomy of a Context-Aware Application. In Proceedings of the Fifth Annual ACM/IEEE InternationalConference on Mobile Computing and Networking, Seattle, Washington, USA, August1999. ACM Press.
9. Heckerman, D., Breese, J., Rommelse, K. "Troubleshooting Under Uncertainty," DX-94-5th Int'l. Workshop on Principles of Diagnosis, AAAI, 1994, pp. 121-130.
10. Intanagonwiwat, C., Govindan, R., Estrin, D., Directed Diffusion: A Scalable and RobustCommunication Paradigm for Sensor Networks. In Proceedings of the Sixth Annual
International Conference on Mobile Computing and Networks, Boston, MA, August 2000.ACM Press.
11. Orr, R., Abowd, G. The Smart Floor: A Mechanism for Natural User Identification andTracking. In Proceedings of the 2000 Conference on Human Factors in ComputingSystems), The Hague, Netherlands, April 1-6, 2000.
12. Pearl, J. CAUSALITY: Models, Reasoning, and Inference, Cambridge University Press,2000.
13. PinPoint, http://www.pinpointco.com14. Priyantha, N., Chakraborty, A., Balakrishnan, H. The Cricket Location Support System. In
Proceedings of the Sixth Annual ACM International Conference on Mobile Computing andNetworking, Boston, MA, August 2000. ACM Press.
15. Schilit, B., Adams, N., and Want, R. Context-aware computing applications. InProceedings of the Workshop on Mobile Computing Systems and Applications, SantaCruz, CA, December 1994. IEEE Computer Society.
16. Small, J., Smailagic, A., Siewiorek, D. Determining User Location For Context AwareComputing Through the Use of a Wireless LAN Infrastructure. Project Aura report.htttp://www.cs.cmu.edu/~aura/docdir/small00.pdf
17. Want, R., Hopper, A., Falcao, V., Gibbons, J. The Active Badge Location System. ACMTransactions on Information Systems, 10(1):91-102, January 1992.
18. Want, R., Schilit, B., Adams, N., Gold, R., Petersen, K., Goldberg, D., Ellis, J., Weiser, M.The ParcTab Ubiquitous Computing Experiment. Technical Report CSL-95-1, Xerox PaloAlto Research Center, March 1995. Also appears In Mobile Computing, H. F. Korth andT. Imielinski, eds., Kluwer Academic Press, 1996.
Appendix: Getting Nibble
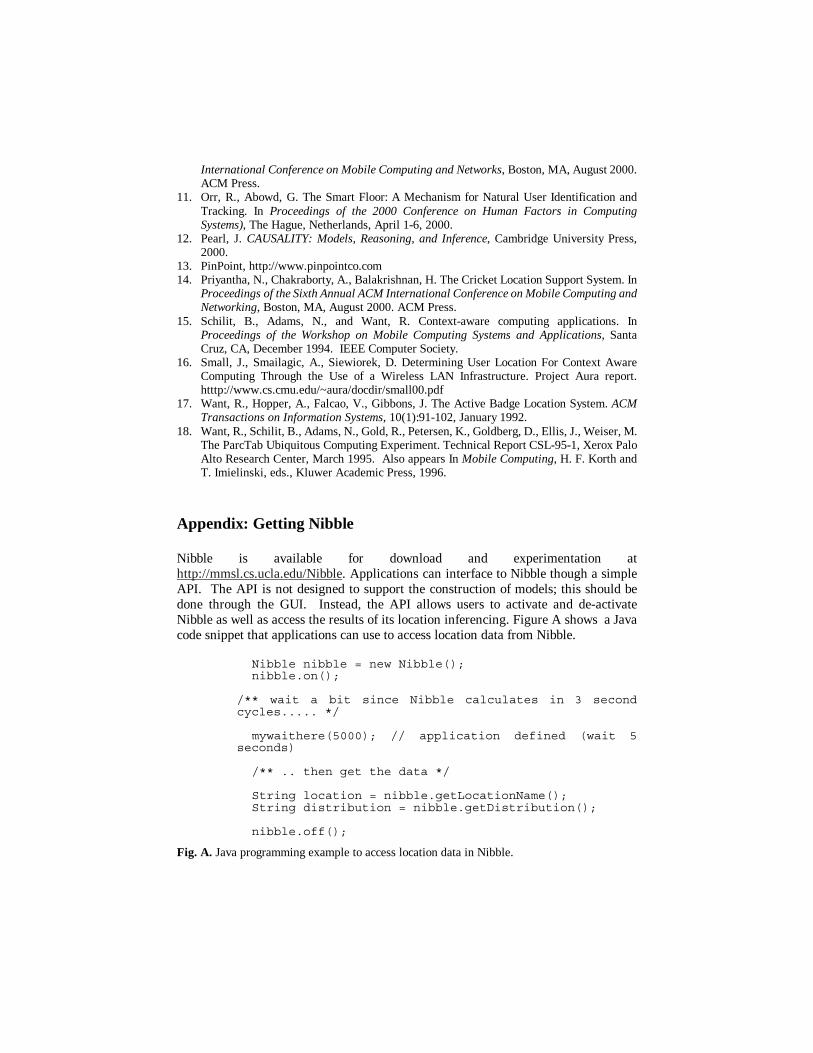
Nibble is available for download and experimentation athttp://mmsl.cs.ucla.edu/Nibble. Applications can interface to Nibble though a simpleAPI. The API is not designed to support the construction of models; this should bedone through the GUI. Instead, the API allows users to activate and de-activateNibble as well as access the results of its location inferencing. Figure A shows a Javacode snippet that applications can use to access location data from Nibble.
Nibble nibble = new Nibble();nibble.on();
/** wait a bit since Nibble calculates in 3 secondcycles..... */
mywaithere(5000); // application defined (wait 5seconds)
/** .. then get the data */
String location = nibble.getLocationName();String distribution = nibble.getDistribution();
nibble.off();
Fig. A. Java programming example to access location data in Nibble.