a primer in statistical discovery
TRANSCRIPT

Copyright © 2013, SAS Insti tute Inc. Al l r ights reserved.
A PRIMER IN STATISTICAL DISCOVERY
ECSITE ANNUAL CONFERENCE 2015
Dr. Ian Cox, [email protected]
Copyright © 2013, SAS Insti tute Inc. Al l r ights reserved.
ABSTRACT
• This presentation introduces ’Statistical Discovery’, a process that allows you
to work with data to discover new, useful, insights that drive cycles of
learning.
• After a brief overview to introduce the concept, an example involving property
prices in the US will be used to demonstrate the how the process works in
practice.
• Through this example we also exemplify the skills and aptitudes required to
exercise the process successfully.

Copyright © 2013, SAS Insti tute Inc. Al l r ights reserved.
AGENDA
• Why?
• What?
• How?
• Who?

Copyright © 2013, SAS Insti tute Inc. Al l r ights reserved.
AGENDA
• Why?
• What?
• How?
• Who?

Copyright © 2013, SAS Insti tute Inc. Al l r ights reserved.
ECSITE VALUES
• We believe that science is part of culture and that curious minds make for
better societies.
• We are convinced that science needs fair, open-minded, democratic societies
and active citizenship to thrive.
• We know that citizens and scientists working together with other
stakeholders can make research more relevant.
• We find science is fascinating and we are dedicated to making it a source of
inspiration for everyone.
Copyright © 2013, SAS Insti tute Inc. Al l r ights reserved.
PREMISE OF THIS
PRESENTATION
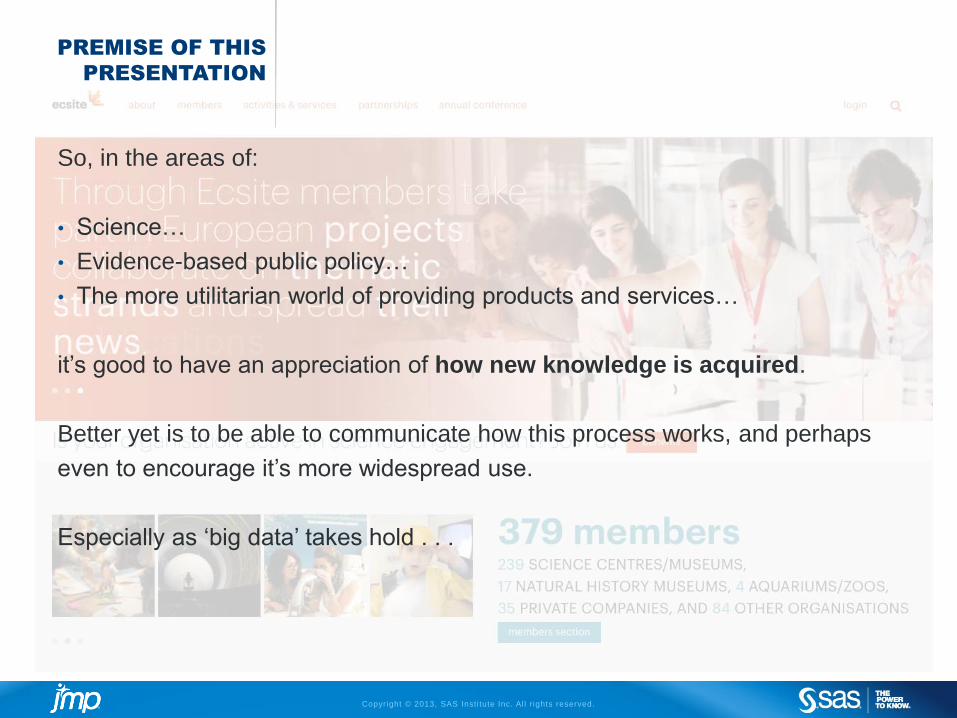
So, in the areas of:
• Science…
• Evidence-based public policy…
• The more utilitarian world of providing products and services…
it’s good to have an appreciation of how new knowledge is acquired.
Better yet is to be able to communicate how this process works, and perhaps
even to encourage it’s more widespread use.
Especially as ‘big data’ takes hold . . .

Copyright © 2013, SAS Insti tute Inc. Al l r ights reserved.
SCIENTIFIC
METHOD TIMELINE

Copyright © 2013, SAS Insti tute Inc. Al l r ights reserved.
A COLLOQUIAL
VIEW
http://idea.ucr.edu/documents/flash/scientific_method/story.htm

Copyright © 2013, SAS Insti tute Inc. Al l r ights reserved.
‘MAKE
OBSERVATIONS’
PRODUCES DATA,
AND …
• All data is contextual.
• Any analysis that does not understand the data context is pointless, or worse.
• Making new discoveries is not ‘algorithmic’, and never could be.
• Only people understand ‘context’, ‘relevance’ and ‘utility’.

Copyright © 2013, SAS Insti tute Inc. Al l r ights reserved.
AGENDA
• Why?
• What?
• How?
• Who?

Copyright © 2013, SAS Insti tute Inc. Al l r ights reserved.
A ‘QUALITY’
PERSPECTIVE
All value-adding activity occurs in a system of interconnected processes,
each of which has suppliers, owner(s) and customers.
Variation exists in all processes.
Causes of process variation can be segregated into ‘common’ and ‘special’
causes.
Understanding the unique nature of common and special causes is the key to
reducing process variation,
and
Reducing process variation is the key to improving product and service
quality, productivity and profitability.

Copyright © 2013, SAS Insti tute Inc. Al l r ights reserved.
UNIVERSAL MODEL
OF A PROCESS
System of InterestCauses We Understand
Causes We Don’t Understand, Know About, or Care About
Measured Effects or Outcomes of
Interest
X1
X2
X3
X4 X5 X6
Y1
Y2
Y1 = Signal Function1(X1, X2, X3) + Nuisance Function1(X4, X5, X6)
Y2 = Signal Function2(X1, X2, X3) + Nuisance Function2(X4, X5, X6)
The ‘Nuisance Functions’ are what give rise to the Variation
in the process outputs.
‘Statistics’ can be seen as the study of variation.

Copyright © 2013, SAS Insti tute Inc. Al l r ights reserved.
‘STATISTICS’ IS . . . LEARNING IN THE PRESENCE OF VARIATION
(Adapted from Box,
Hunter and Hunter).
What we think
is happening
What is really
happening
Situation
Appraisal
Measurement and
Data Collection
Situation
Appraisal
Situation
AppraisalMeasurement and
Data Collection
Sta
tisti
cs
Able to Consistently Meet Customer Requirements
Real
WorldModel
Unable to Consistently Meet Customer Requirements
There is no ‘free lunch’ – The cost of gaining new knowledge must be
offset by its perceived or expected value

Copyright © 2013, SAS Insti tute Inc. Al l r ights reserved.
STATISTICAL DISCOVERY WITH JMP

Copyright © 2013, SAS Insti tute Inc. Al l r ights reserved.
CDA EDA

Copyright © 2013, SAS Insti tute Inc. Al l r ights reserved.
STATISTICAL
DISCOVERY
Frame Problem
or Opportunity Collect DataUncover
Relationships
Model
Relationships
Utilize
Knowledge
Revise
Knowledge
“Statistics as
Detective” or EDA
“Statistics as
Lawyer” or CDA
Copyright © 2013, SAS Insti tute Inc. Al l r ights reserved.
STATISTICAL
DISCOVERY
1. Data visualization, done properly, is very powerful and effective.
2. Statistical analysis, done properly, and defined broadly to include things
like experimental design and predictive modeling, is also very powerful
and effective, but in a different way.
3. Tightly integrating the two creates a synergy that is much more
powerful and effective than either one alone.
Copyright © 2013, SAS Insti tute Inc. Al l r ights reserved.
AGENDA
• Why?
• What?
• How?
• Who?

Copyright © 2013, SAS Insti tute Inc. Al l r ights reserved.

Copyright © 2013, SAS Insti tute Inc. Al l r ights reserved.
AGENDA
• Why?
• What?
• How?
• Who?

Copyright © 2013, SAS Insti tute Inc. Al l r ights reserved.
JMP …
• Aims to provide ‘Statistical Discovery’ on
the desktop of Researchers, Engineers
and Scientists.
• Is characterized by interactivity and agility
in usage.
• Is a SAS product which has been in
development since 1989.
• Aspires to support users who:
• Have specific research questions, or are
simply curious.
• Have access to, or can generate, somewhat
relevant data.
• Do not necessarily have specialist statistical
training.
Copyright © 2013, SAS Insti tute Inc. Al l r ights reserved.

Copyright © 2013, SAS Insti tute Inc. Al l r ights reserved. www.SAS.com