a presentation for the european real estate society annual conference stockholm, 2009 qiulin ke* and...
TRANSCRIPT
A Presentation for the European Real Estate Society Annual Conference
Stockholm, 2009
Qiulin Ke* and Michael White**
*Nottingham Trent University, Nottingham**Heriot-Watt University, Edinburgh

Motivations for the research
There is a rich body of literature on office market analysis in western developed economies such as the US and UK.
Limited empirical studies on emerging markets such as Shanghai, though they have experienced rapid growth and attracted global capital.
Research objectives:Extend analysis of Shanghai office market
to examine submarket behaviourTo identify Long run relationshipsShort run rent adjustment and Interaction between Shanghai office
submarketsDoes disequilibrium in one submarket affect
other submarkets?Is there convergence in rental performance
between submarkets?

Literature and methodologyGrigsby (1963 and 1987) defined sub-markets in terms of
the “close substitutability” of dwellings and properties within submarkets should be more “similar” than properties across submarkets
Property market is segmented into two distinct categories, spatial and structural.
Hedonic model applied in office market research (e.g. Glascock, et al.1990 and 1993; Mills, 1992; Wheaton and Torto, 1994; Bollinger et al. 1998), with submarkets denoted by dummy variables. These studies failed to test substitutability across submarkets.
Stevenson (2007) adopted error correction modelling to examine the rental adjustment in four submarkets in central London and modelled the interactive effects among the submarkets.

Methods of Analysis
Long-run equilibrium model
Short-run dynamic adjustment model
Model linking error correction terms across submarkets
Testing for Convergence
tuvStockDR )1ln(lnlnlnln 22100
ttttt vStockDR )1ln(lnlnln 3210
ttttttt uuvStockDR ,11,251,14,13,12,110,1 )1ln(lnlnln

Shanghai Office Submarkets: Puxi and Pudong
Source: DTZ Shanghai
Nanjing Road West
Huaihai Road
People’s Square
Lujiazui, Pudong
Huangpu River

Central Puxi submarketTraditional CBD.Multi-national companies regional headquarter office
and large professional services companies’ location.Representing 30% of total Grade A Shanghai office stock.
Lujiazui, Pudong submarketEmerged since 1990 and was driven by government planning and development
strategy to build it as Financial and Trade Centre of ChinaOver 500 financial institutions settled there.Representing 30% of total Grade A Shanghai office stock.

GDP Growth Rate (1993-2008)
-10.0020.0030.0040.0050.0060.0070.0080.0090.00
%
Shanghai
Pudong

Pudong Real Estate Investment
-
5.00
10.00
15.00
20.00
25.00
30.00
35.00
1994 1995 1996 1997 1998 1999 2000 2001 2002 2003 2004 2005 2006 2007 2008
Inve
stm
ent (
RMB
billi
on)
-
500,000
1,000,000
1,500,000
2,000,000
2,500,000
Offi
ce s
tock
(sq.
m)
Real estate investment
Office stock

Real Rents in Puxi and Pudong
Source: DTZ, Shanghai

Vacancy rate in Puxi and Pudong
Source: DTZ, Shanghai

Long Run Models Puxi Pudong Constant 9.842
(13.387) 6.284
(18.281) Gross Value Added 1.053
(5.683) 0.453
(6.705) Stock -0.793
(-7.959) -0.220
(-5.765) FDI 0.431
(2.829) 0.146
(3.252) Adjusted R2 0.723 0.738 DW 0.908 0.538 Prob of F-statistic 0.000 0.000 Note: t-statistics are in parentheses.

Short Run Models Puxi Pudong Constant 0.011
(0.678) 0.003
(0.289) ∆Gross Value Added 0.082
(0.662) 0.209
(1.683) ∆Stock -0.228
(-1.486) -0.077
(-1.807) ∆FDI 0.004
(0.055) 0.029
(0.952) Error Correction Term – Puxi -0.205
(-2.217) 0.006
(0.119) Error Correction Term - Pudong -0.004
(-0.029) -0.185
(-2.132) Adjusted R2 0.153 0.119 DW 2.082 1.763 Prob of F-statistic 0.028 0.046 Note: t-statistics are in parentheses.
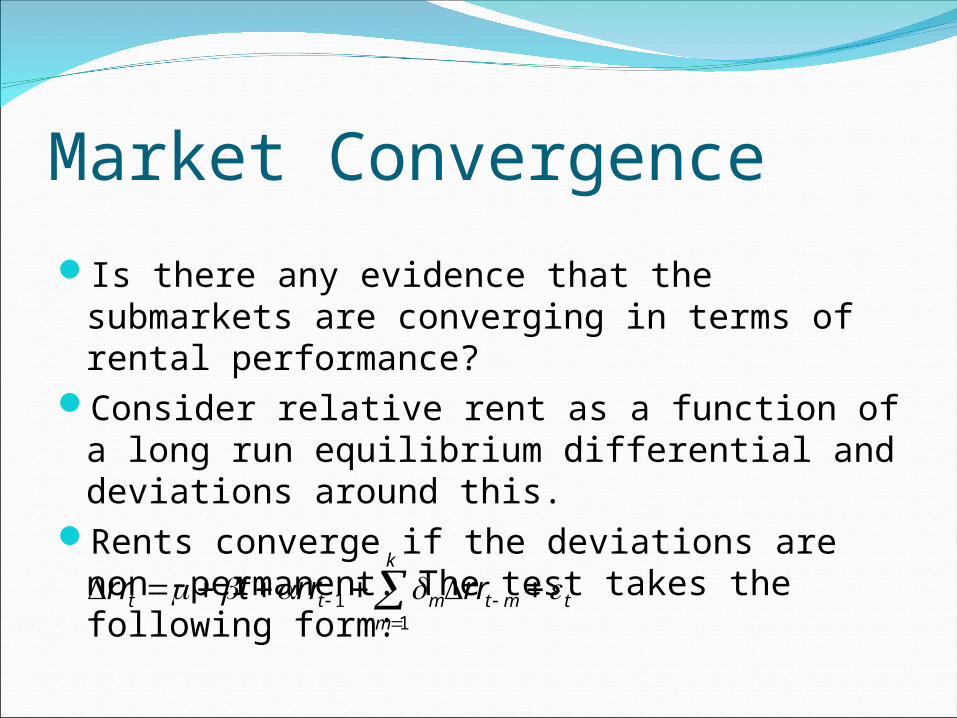
Market ConvergenceIs there any evidence that the submarkets
are converging in terms of rental performance?
Consider relative rent as a function of a long run equilibrium differential and deviations around this.
Rents converge if the deviations are non -permanent. The test takes the following form:
tmt
k
mmtt rrrrtrr
11

Test for Convergence
Variable Coefficient Std. Error t-Statistic Prob.
Constant -0.071372 0.032080 -2.224858 0.0307
Time Trend 0.001902 0.000931 2.042764 0.0465
Lagged relative rent (-1) -0.073207 0.047801 -1.531491 0.1321
Δ Lagged relative rent (-1) -0.393032 0.138112 -2.845757 0.0065
Δ Lagged relative rent (-2) -0.167641 0.136801 -1.225433 0.2263
R-squared 0.252174 Mean dependent var -0.010982
Adjusted R-squared 0.191127 S.D. dependent var 0.090154
S.E. of regression 0.081082 Akaike info criterion -2.098689
Sum squared resid 0.322141 Schwarz criterion -1.914524
Log likelihood 61.66461 F-statistic 4.130814
Durbin-Watson stat 1.994650 Prob(F-statistic) 0.005809

Conclusions
We find no interaction between the two submarkets in Shanghai.
Cointegration tests do not support evidence of a valid long run relationship in Pudong.
We did not find convergence in rental performance between the two submarkets.
These findings may be due to the shortness of the time series available and or be due to differences in the submarkets that imply a lack of substitutability for office occupiers.