a preliminary study of nonpoint source … · in the little chazy river watershed northeastern new...
TRANSCRIPT

A PRELIMINARY STUDY OF NONPOINT SOURCE NUTRIENT RUNOFF
IN THE LITTLE CHAZY RIVER WATERSHED NORTHEASTERN NEW YORK
David A. Franzi and Robert D. Fuller State University of New York at Plattsburgh, 101 Broad St. Plattsburgh, 12901
and
Stephen R. Kramer William H. Miner Agricultural Research Institute, 586 Ridge Road, Chazy, NY 12921
Project Report for
New York State Department of Environmental Conservation and The Nature Conservancy, June 2009

Table of Contents INTRODUCTION …………………………………………………...……………………. 1
Geological Setting ……………………………………….……………….............. 5
METHODS ……………………….……………………………………….……………… 7
River Channel Morphology ………………………………..……………………..….. 7
Hydrology …………………………………...…………………………..…………… 8
Water Quality Field and Analytical Methods ……………….……..…………………. 8
RESULTS ……………………………………………………………………………….. 10
River Channel Morphology …………..………………………………………...…... 10
Hydrology ………………………………………...………………………………… 12
Water Quality ………..…………………..…………………………………………. 13
Mainstream Nitrate, Total Phosphorus and Soluble Reactive Phosphorus ….… 13
Tributary Nitrate, Total Phosphorus and Soluble Reactive Phosphorus ……..… 18
Total Kjeldahl Nitrogen …………………………...……………………………. 23
Nutrient Loads …………………………………..……………………………… 25
DISCUSSION …………………………...………………………………………………. 26
ACKNOWLEDGEMENTS ……...………………………………………………………. 29
REFERENCES ………………………………………………………………………….. 30 Appendix A: Mean Daily Discharge for Little Chazy River Gaging Stations.….…....A1–A6
Appendix B: Nitrate Concentrations……………………….………..…….……….…B1-B4
Appendix C: Total Phosphorus Concentrations……………………...………………C1-C4
Appendix D: Soluble Reactive Phosphorus Concentrations……………….……...…D1-D4
Appendix E: Total Kjeldahl Nitrogen Concentrations…………….……………………..E1
p. 1
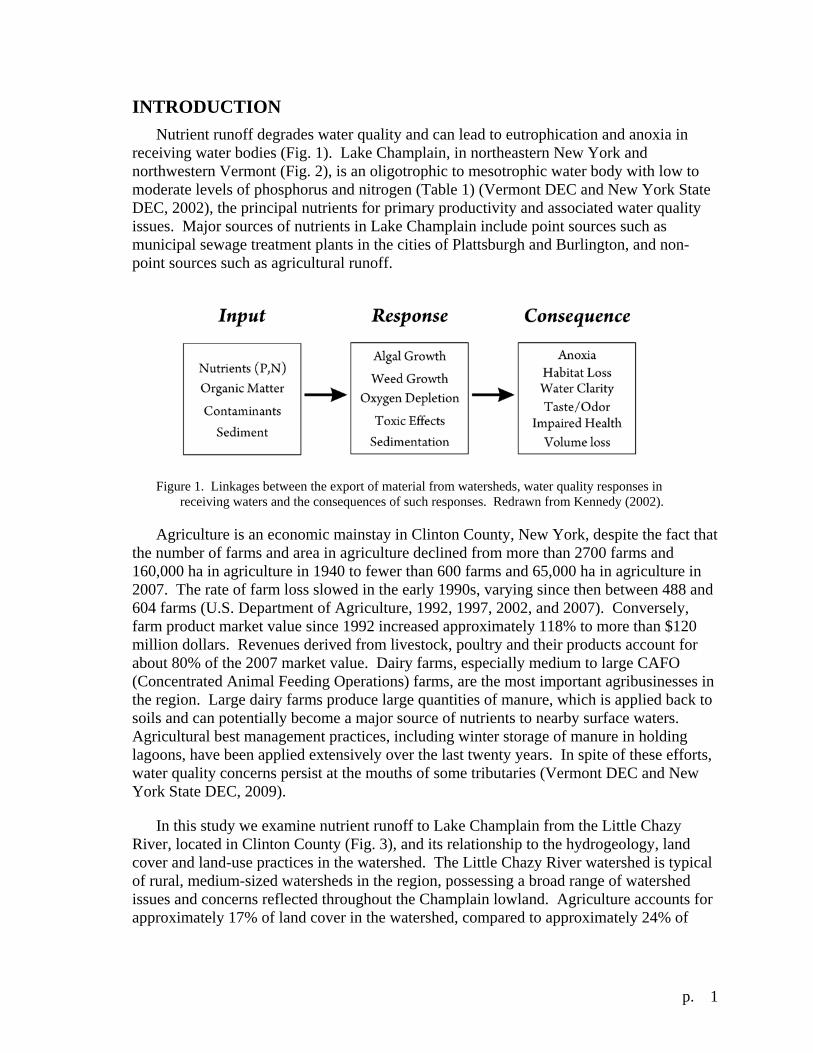
INTRODUCTION Nutrient runoff degrades water quality and can lead to eutrophication and anoxia in
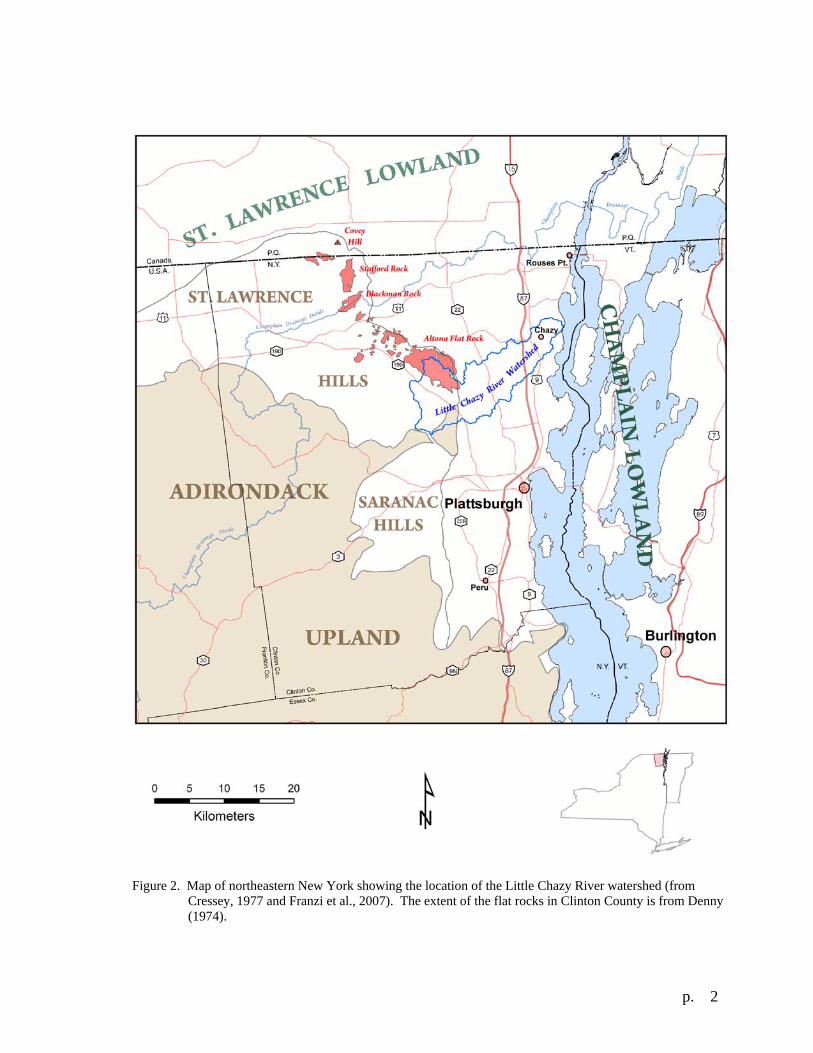
receiving water bodies (Fig. 1). Lake Champlain, in northeastern New York and northwestern Vermont (Fig. 2), is an oligotrophic to mesotrophic water body with low to moderate levels of phosphorus and nitrogen (Table 1) (Vermont DEC and New York State DEC, 2002), the principal nutrients for primary productivity and associated water quality issues. Major sources of nutrients in Lake Champlain include point sources such as municipal sewage treatment plants in the cities of Plattsburgh and Burlington, and non-point sources such as agricultural runoff.
Agriculture is an economic mainstay in Clinton County, New York, despite the fact that the number of farms and area in agriculture declined from more than 2700 farms and 160,000 ha in agriculture in 1940 to fewer than 600 farms and 65,000 ha in agriculture in 2007. The rate of farm loss slowed in the early 1990s, varying since then between 488 and 604 farms (U.S. Department of Agriculture, 1992, 1997, 2002, and 2007). Conversely, farm product market value since 1992 increased approximately 118% to more than $120 million dollars. Revenues derived from livestock, poultry and their products account for about 80% of the 2007 market value. Dairy farms, especially medium to large CAFO (Concentrated Animal Feeding Operations) farms, are the most important agribusinesses in the region. Large dairy farms produce large quantities of manure, which is applied back to soils and can potentially become a major source of nutrients to nearby surface waters. Agricultural best management practices, including winter storage of manure in holding lagoons, have been applied extensively over the last twenty years. In spite of these efforts, water quality concerns persist at the mouths of some tributaries (Vermont DEC and New York State DEC, 2009).
In this study we examine nutrient runoff to Lake Champlain from the Little Chazy River, located in Clinton County (Fig. 3), and its relationship to the hydrogeology, land cover and land-use practices in the watershed. The Little Chazy River watershed is typical of rural, medium-sized watersheds in the region, possessing a broad range of watershed issues and concerns reflected throughout the Champlain lowland. Agriculture accounts for approximately 17% of land cover in the watershed, compared to approximately 24% of
Figure 1. Linkages between the export of material from watersheds, water quality responses in
receiving waters and the consequences of such responses. Redrawn from Kennedy (2002).
p. 2
Figure 2. Map of northeastern New York showing the location of the Little Chazy River watershed (from Cressey, 1977 and Franzi et al., 2007). The extent of the flat rocks in Clinton County is from Denny (1974).

p. 3
Figure 3. Map of the Little Chazy River watershed showing principal tributaries and the locations of stream gaging stations.
land cover county-wide, most of which is concentrated near the lake shore east of Chazy village. The watershed was identified on the 1996 Lake Champlain Basin Waterbody Inventory/Priority Waterbodies List Report as a class C river with possible impaired fish survival (NYSDEC, 2001). Karim (1997) cited on-site septic problems, particularly in Chazy and West Chazy, and high levels of livestock and crop agriculture as water pollution concerns in the watershed. The Little Chazy River has the highest median nutrient concentrations and median unit nutrient load (nutrient load per unit area of watershed) of any New York tributary to Lake Champlain that is monitored as part of the Lake Champlain Long-term Water Quality and Biological Monitoring Program (Table 1) (Vermont DEC and New York DEC, 2009). Our objectives are to evaluate the present geomorphic, hydrologic and water quality condition of the watershed using a high-resolution synoptic water quality strategy in nested subwatersheds and determine nutrient concentrations and loads from different parts of the basin. The study encompasses the entire watershed with a principal focus on an approximately 6-km-long reach of the Little Chazy River between the villages of West Chazy and Chazy. The database may be used to identify principal sources and sinks for nutrients, develop and calibrate nutrient runoff models and assess the efficacy of future changes in land management or runoff remediation efforts in the basin.

p. 4
Table 1. Mean and median total nitrogen and total phosphorus concentrations (mg/L), loads (kg/d) and unit loads (kg/d/km2) for northwestern Lake Champlain and principal tributaries in New York. Data are from the Lake Champlain Long-Term Water Quality and Biological Monitoring Program (Vermont DEC and New York State DEC, 2009).

p. 5
Geological Setting The Little Chazy River originates in upland forests in the northeastern foothills of the
Adirondack Mountains and flows eastward through the Champlain lowland to its mouth at Lake Champlain. It has two principal tributaries, Farrell Brook (basin area = 27 km2) and Tracy Brook (basin area = 25 km2). The headwater region is a predominantly forested area of moderate relief (<400 m) that is underlain by thin glacial soils (generally <3m thick), Cambrian clastic sedimentary rocks and high-grade Mesoproterozoic metamorphic rocks. This region includes a large area of exposed sandstone bedrock, or sandstone pavement, known locally as Altona Flat Rock (Fig. 2). Mainstream gradient in the headwater region commonly exceeds 10 m/km (Fig. 4, Table 2).
The river descends steeply through dense headwater woodlands to the Champlain lowland and flows through a patchwork of forested and agricultural lands before emptying into Lake Champlain. The Champlain lowland is underlain by thick glacial, glacial-lacustrine, and glacial-marine sediments, and lower Paleozoic sedimentary rocks. Local relief in the lowland is generally less than 100 m and the mainstream channel gradient averages approximately 1 m/km. Prominent knickpoints (locations where stream gradient increases abruptly) on the Little Chazy River occur in the lowland portion of the watershed at the villages of Chazy and West Chazy (Fig. 4, Table 2), where the river flows across bedrock obstructions. Smaller knickpoints, underlain by bedrock or glacial till, are also evident in stream profiles (Fig. 4). Dams at Route 9 and the Fiske Road in the village of Chazy create consecutive narrow, nearly sediment-filled impoundments that extend roughly 6 km upstream from Route 9. Other flow-control structures in the watershed include a series of small dams or weirs that extend downstream from Lake Alice on Tracy Brook to the Village of Chazy and abandoned dams, either flood damaged or otherwise compromised, on the Little Chazy River at West Chazy and two large dams at
Figure 4. Stream profiles for the Little Chazy River and its principal tributaries.

p. 6
Table 2. Geomorphology of Little Chazy River subwatersheds (see Figure 3 for station locations and tributary names).

p. 7
Altona Flat Rock. Most of the flow-control structures in the watershed date to the early 20th century when William H. Miner constructed several hydroelectric projects in the region (Dawson et al., 1981; Landing et al., 2007).
METHODS
River Channel Morphology River channel morphology was evaluated at four reference reaches in the principal
study area between Chazy and West Chazy (Fig. 5). Channel cross-section morphology and stream gradient were measured over a distance of approximately 20-times the channel width using standard surveying methods. At least three measured channel cross were established in each reach. Bank-full water level was measured wherever possible from the elevation of alluvial surfaces, measurement of boundary features (e.g. lower limit of perennial vegetation), or analysis of measured cross sections (Dunne and Leopold, 1973; Williams, 1978). These data were used to perform a Rosgen Level II geomorphic
Figure 5. Little Chazy River watershed map showing the locations of reference reaches within the study area.

p. 8
characterization of each reach (Rosgen, 1996). The Rosgen classification uses three numeric indices; entrenchment ratio, bank-full width to depth ratio and sinuosity; to classify channels into one of eight principal stream types. Channel morphology class may be further defined by channel gradient and substrate. An approximation of the flood-prone area adjacent to the channel was made using the method described by Rosgen (Rosgen, 1996). Despite its shortcomings (e.g. Miller and Ritter, 1996; Thorne et al. 1997; Roper et al., 2008), the Rosgen classification provides a convenient mechanism to compare channel morphology and it or its variants are widely used for river management.
Hydrologic Network SUNY Plattsburgh and Miner Institute (SUNY/Miner) currently operate and maintain
stream-gaging stations at 15 locations in the Little Chazy River watershed (Fig. 3). Note that the stations FLUME and COLD , depicted on Figure 3, were not operated as part of this study. The stations are equipped with Tru-Trac WT-HR water height (stage) dataloggers and operate during ice-free periods only. Rating curves for each station are calibrated using the midsection method for determining discharge (Rantz et al. 1982). Gage records vary in length depending upon data needs and available resources. Records for the U.S. Geological Survey (USGS) gaging station near the river mouth east of Chazy (Fig.3) were obtained from the USGS Water Resources Division office in Troy, New York. Stream discharge was used to estimate nutrient loads at gaged subwatersheds.
Water Quality Field and Analytical Methods A high-resolution synoptic water-sampling strategy was adopted to determine the
spatial and longitudinal (along channel) distribution of nutrient concentrations in streams within the Little Chazy River watershed. Synoptic sampling involves the collection of closely spaced water samples in a short time period to provide a snapshot of nutrient concentrations and loadings throughout the watershed. Sample spacing along the mainstream, tributaries and other inflows varied with accessibility and land use. Channel distance between samples varies from more than 5 km in forested upland regions to a few hundred meters in the principal study reach between West Chazy and Chazy near villages or agricultural lands where anthropogenic inputs such as ditches and drains are more common.
We collected 16 synoptic sample suites at approximately four-week intervals from January 2008–April 2009 at approximately 64 sites on the mainstream, tributaries and agricultural ditches and tile drains (Fig. 6). Water samples were collected in acid-washed 500 ml polyethylene bottles within a period of approximately four hours to minimize temporal variations in nutrient concentrations. Samples were transported in coolers back to the lab and immediately split into two fractions; one which was filtered through a 0.47 mm membrane filter to remove particulates and the other left unfiltered (Fig. 7). Filtered subsamples were analyzed for nitrate using a Dionex Ion Chromatograph with conductimetric detection and for soluble-reactive phosphorus (primarily phosphate) colorimetrically using a UV-Vis spectrophotometer with the ascorbic acid method (APHA, 1998). Unfiltered subsamples for total Kjeldahl nitrogen were digested on a block digester using sulfuric acid with a copper sulfate catalyst (APHA, 1998), followed by analysis for ammonium using the salicylate-nitroprusside-hypochlorite procedure on a flow injection

p. 9
Figure 6. Locations of gaging stations and other water-quality sampling locations.
Figure 7. Flow chart for water quality analyses.

p. 10
analyzer (APHA, 1998) modified for a Bran-Luebbe (Technicon) autoanalyzer. For total phosphorus, unfiltered water samples are digested using potassium persulfate in sulfuric acid on a block digester (APHA, 1998), followed by analysis for soluble-reactive phosphorus.
RESULTS
River Channel Morphology
Main channel segments at the four reference reaches classify as Rosgen types B, C and E (Table 3). Morphological data from the ChaLiz reach (Fig. 8) serves as an example of the Rosgen method. The LC87 and South Field reaches have type B channels that are moderately entrenched and riffle-dominated. Sporadic limestone bedrock outcrops occur at the upper and lower ends of the LC87 reach but most of the channel is underlain by a veneer of cobble and boulder gravel. The upper bedrock outcrops serve as a threshold for the channel above the LC87 reach to the WOOD gaging station, where the channel is underlain by fine-grained glacial marine sediment, has a low gradient and high sinuosity. The mainstream at South Field is underlain by glacial till and is characterized by a high gradient, riffle-dominated channel. The ChaLiz and Kinsley reaches have low-relief channels that are underlain by relatively thick (> 3 meters) glacial, glacial lacustrine or glacial marine deposits. The ChaLiz channel is slightly entrenched with a moderate width to depth ratio, sinuosity and gradient. The ChaLiz channel has many characteristics of a Rosgen type C stream; however, it lacks a well-developed floodplain and in-channel point
Table 3. Rosgen classification for reference channel reaches.

p. 11
Figure 8. Channel morphology at the ChaLiz reach. A. Orthoimage (0.6-meter resolution) of the ChaLiz reach, showing the locations of measured cross sections. The approximate limits of the floodprone area (from Rosgen, 1996) are indicated by with dashed lines. Note the encroachment of row crops into the flood-prone area near cross section A-A’. B. Longitudinal profile of streambed and water-surface elevations. C. Measured cross sections showing bankfull and flood-prone stages and channel widths as estimated using the Rosgen (1996) method.

p. 12
bars. The morphology of the Kinsley channel lies near the boundary of Rosgen types E and C streams. Row-crop agriculture encroaches into the flood-prone area at the Kinsley and Chaliz reaches.
Hydrology
The U.S. Geological Survey gaging station at Stetson Road in Chazy provides the only continuous discharge record for the entire study period, 1 January 2008 to 30 April 2009 (Fig.9). Only one minor tributary, Rovers Creek, enters below the Stetson Road gage (Fig. 3), so these data provide a good estimate of outflow to Lake Champlain from the watershed. The record is derived from unit values (15-minute discharge records) provided by the USGS Water Sciences Center in Troy. Little Chazy River discharge averaged 2.61 m3/s, with a median of 1.57 m3/s, during the study period. The largest flows, which occurred in
two separate events on 10 January and 13 April 2008, exceeded 23 m3/s, while the lowest flows, around 0.120 m3/s, occurred in September and early October 2008.
Most SUNY-maintained gaging stations operated from mid-April 08 to mid-November 2008. New gages were installed below the Farrell Brook confluence in West Chazy (GUEST) and in the reach between the LANG and WOOD gages (CHALIZ) (Fig. 3) to provide better resolution for assessing longitudinal variations of discharge in the principal
Figure 9. Hydrograph for the U.S. Geological Survey gaging station at Stetson Road, Chazy, New York for the study period 1 January 2008 – 30 April 2009. Median discharge is indicated by the horizontal red line and the discharge range between the 25th and 75th percentiles is shown by the red-sghaded area between solid red lines. Red circles indicate the mean daily discharge on synoptic water-quality sampling days.

p. 13
study reach. All gages were operational by mid-June 2008. Mean daily discharges for all main channel gaging stations were grouped into three classes bounded by the 25th and 75th percentile discharge magnitudes at the USGS gaging station. High mean daily flows occur when discharge at the USGS gage exceeds the 75th percentile discharge (QUSGS > 2.99 m3/s (n = 17 days) (Fig. 9)) and generally correspond to runoff-producing rainfall or snowmelt events. Moderate mean daily flows (0.69 m3/s < QUSGS < 2.99 m3/s (n = 58 days)), approximate median or most-probable flow regime in the watershed. Low flows (QUSGS < 0.69 m3/s (n = 114 days)) correspond to prolonged periods of baseflow. Note that low flow conditions predominate during the period of record because SUNY gages only operate when the channel is ice-free.
Effluent (baseflow input) conditions predominate in all flow regimes in the reach between Miner Dam (MDAM gage) and West Chazy (LANG gage), where river descends more than 130 meters from the uplands at Altona Flat Rock to the Champlain lowland (average gradient = 13.4 m/km) (Fig. 10). Flow in this reach is augmented by inflow from several high-discharge springs that occur in this part of the watershed (Lehman et al. 2006). The longitudinal pattern of discharge in the lowland below West Chazy is more complex and varies with flow regime. An influent zone (an area where the stream loses discharge) occurs in the channel between the WOOD and LC-87 gages, where the river crosses an area of complex geological structure in Champlain lowland (Fisher, 1968). Stream gradient in this reach is very low (< 0.73 m/km) and is controlled by a bedrock threshold at the upper end of the LC-87 reference reach. The influent zone expands upstream during low-magnitude baseflows (Fig. 10). Inflows from minor tributaries are negligible during low flow conditions and nearly all stream flow is generated in the upper reaches of the watershed. As stream flow increases following runoff events, a greater proportion of baseflow is generated in lowland agricultural regions.
Water Quality
Mainstream Nitrate, Total Phosphorus and Soluble Reactive Phosphorus
Nitrate, total phosphorus and soluble reactive phosphorus concentrations in headwater forests were typically low (< 1 mg/L NO3,< 10 μg/L P) and increased substantially upon entering lowland agricultural regions (Figs. 11–13). Occasional abrupt increases in nitrate concentrations within the agricultural areas may be attributed to high concentrations in agricultural ditches or tiles, but this trend was not consistent due to the low discharges measured in many of these tributaries. Nitrate concentrations generally leveled off at 2-3 mg/L in the agricultural area between West Chazy and Chazy and actually decreased in two small, narrow impoundments in the village of Chazy. Nitrate decrease in the impoundment is most likely due to dilution or sequestration in algae, aquatic macrophytes and sediments, particularly during the growing season. Nutrient concentrations increased substantially in the 7 km-long reach between the village of Chazy and Lake Champlain, where the river traverses a low-relief, intensively managed agricultural area developed on relatively deep glacial-marine soils. The Chazy wastewater treatment facility is also located in this reach.
Downstream changes in phosphorus (total phosphorus and soluble-reactive phosphorus) (Figs. 12 and 13) concentrations below West Chazy generally mirror those observed in

p. 14
Figure 10. Longitudinal variability of Little Chazy River mean daily discharge with flow regime. Flow
regime class is defined by the 25th and 75th percentile discharges at the USGS gaging station at Stetson Road: High Flow–QUSGS > 75th percentile (QUSGS > 2.99 m3/s); Median Flow–25th percentile < QUSGS < 75th percentile (0.69 m3/s < QUSGS < 2.99 m3/s), Low Flow– QUSGS < 25th percentile (QUSGS < 0.69 m3/s).

p. 15
Figure 11. Mainstream monthly nitrate concentrations for sample points on the Little Chazy River. The ranges between the 25th and 75th percentile and the 5th
and 95th percentile values for each sample point are indicated by boxes and whiskers, respectively. The heavy line connects sample station means. Outlying points are indicated by circles. Sample size is 16 unless otherwise indicated. The principal study reach is highlighted on the adjacent inset map.

p. 16
Figure 12. Mainstream variability of monthly total phosphorus concentrations for sample points on the Little Chazy River. Box plot symbols and notations
are the same as Fig.11. Snowmelt runoff in February 2009 produced anomalously high total phosphorus concentrations in the Little Chazy River. Consequently, mean concentration plot above the 75th percentile and outlying points are off-scale for several stations. The 95th percentile value for the Lakeshore Road sample is also off-scale.

p. 17
Figure 13. Mainstream variability of monthly soluble phosphorus concentrations for sample points on the Little Chazy River main channel. Box plot symbols
and notations are the same as Fig.11. Snowmelt runoff in February 2009 produced anomalously high total phosphorus concentrations in the Little Chazy River. Consequently, mean concentration plot above the 75th percentile and outlying points are off-scale for several stations. The 95th percentile value for the Lakeshore Road sample is also off-scale. percentile value for the Lakeshore Road sample is also off-scale.
p. 18
nitrate concentrations but exhibited substantially more variability, an effect of variable manure applications, overland transport during storm events or possibly measurement errors associated with relatively low phosphorus concentrations (10-100 μg/L). Large increases in nutrient concentrations in the lowermost reaches of the Little Chazy River, especially phosphorus, may be related to surface-drained agricultural field near the lake (Fig. 14).
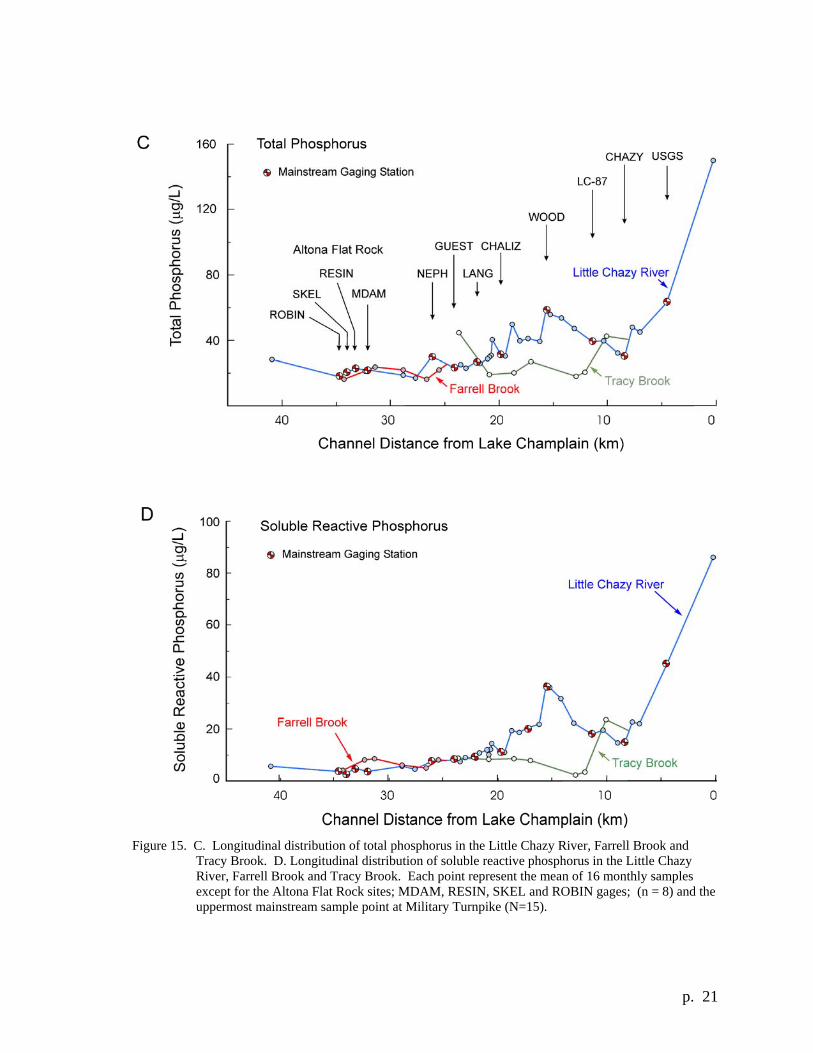
Tributary Nitrate, Total Phosphorus and Soluble Reactive Phosphorus
Spatial and longitudinal variability of nutrient concentrations in the Little Chazy River basin generally follows agricultural land-use patterns (Figs. 14 and 15). Nitrate concentrations in the lower reaches of Farrell Brook rise to levels close to that found in the mainstream and thus do not markedly change Little Chazy River concentrations at their confluence. The longitudinal patterns of total and soluble reactive phosphorus concentrations in Farrell Brook are similar to the upper Little Chazy River. Low nitrate concentrations in Tracy Brook may contribute to the decrease in nitrate observed in the Chazy impoundments, where dilution and nutrient sequestration are suspected (Fig. 15B). Tracy Brook nitrate, total phosphorus and soluble reactive phosphorus reach their lowest levels at the outflow from Lake Alice, suggesting that dilution and sequestration also occurs in Lake Alice.
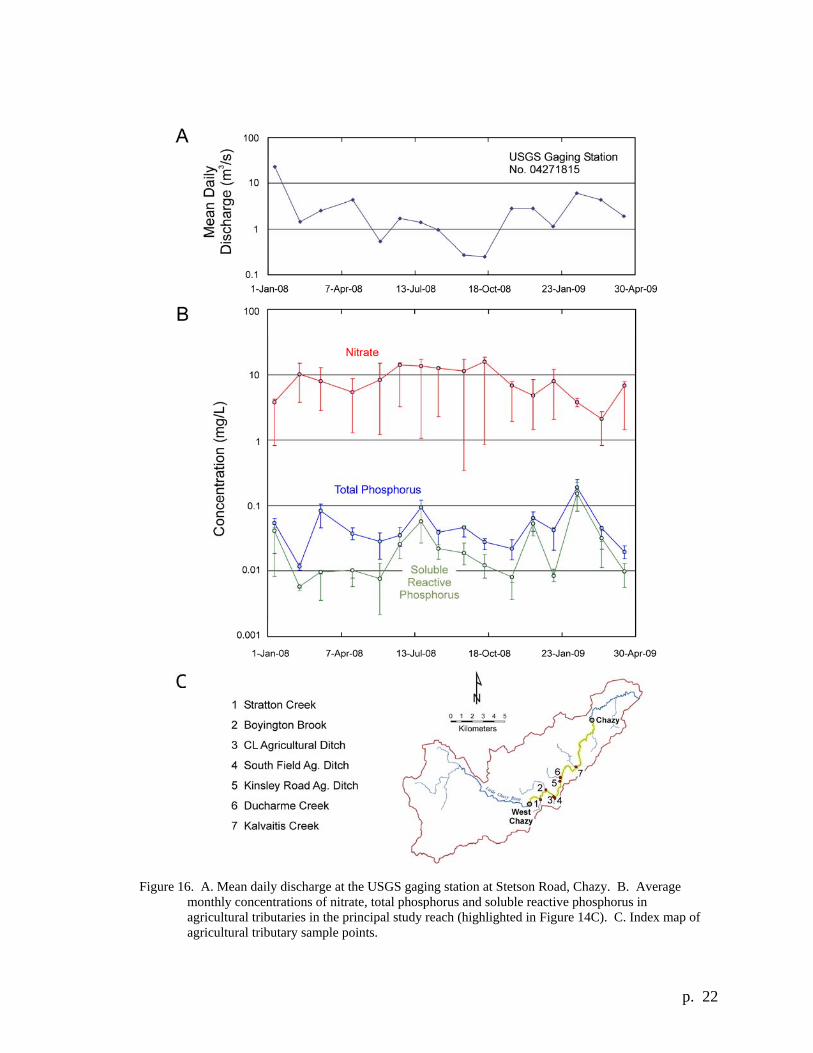
Nitrate, total phosphorus and soluble reactive phosphorus concentrations were also measured monthly in seven small agricultural tributaries in the principal study reach (Fig. 16). Many of these inflows are channelized natural streams or ditches fed by tile drain pipes. The lower ends of the tributary channels are often back-flooded by water from the main channel during high flow events but tile drain flow is an increasingly important, if not exclusive, source of water as main channel flow diminishes. Smaller tributaries or edge-of-field ditches often dry-up during prolong periods of baseflow in late summer and early fall. As a result, during some periods of the year, these samples may represent a combination of tile-drain flow and runoff, tile-drain flow only or may not have been sampled.
Nitrate concentrations in agricultural tributaries varied over three orders of magnitude, with the average being 8.46 ± 4.11 mg/L (mean ± 1 standard deviation). Average nitrate concentrations peaked during the growing season into early fall (June – October), particularly in terms of maximum values (Fig. 16b). The highest nitrate concentrations for tributary inflows roughly correspond to elevated concentrations of nitrate in the Little Chazy main channel. On average, nitrate concentrations in tributaries were 5.9 times greater than those in the main river channel, ranging from 1.2 to 23.9 times greater on a given sample day.
Total phosphorus concentrations in the six agricultural tributaries also varied greatly by site (Fig. 15b) with an average of 54.7 ± 43.0 μg/L (mean ± 1 standard deviation). It is noteworthy that two of the five highest total phosphorus concentrations in the agricultural tributaries occurred during major snowmelt events, in January 2008 and February 2009, with no corresponding increase in nitrate. Soluble reactive phosphorus accounts for a greater proportion of total phosphorus when total phosphorus concentrations are highest, e.g. January 2008, July 2008 and February, 2009 (Figs. 16B and 17).

p. 19
Figure 14. Distribution of agricultural land in the Little Chazy River watershed, showing fields that are drained by tiles, surface runoff or unknown mechanisms
(Drainage information from Steve Mahoney, personal communication, 2009).

p. 20
Figure 15. A. Cumulative upstream area in agriculture at gaging stations in the Little Chazy River watershed. Mainstream gaging station names and locations are provided on Figures 15 A and C. Locations are also referenced in Figure 3. B. Longitudinal distributions of nitrate in the Little Chazy River, Farrell Brook and Tracy Brook. Each point represent the mean of 16 monthly samples except for the Altona Flat Rock sites; MDAM, RESIN, SKEL and ROBIN gages; (n = 8) and the uppermost mainstream sample point at Military Turnpike (N=15).
p. 21
Figure 15. C. Longitudinal distribution of total phosphorus in the Little Chazy River, Farrell Brook and Tracy Brook. D. Longitudinal distribution of soluble reactive phosphorus in the Little Chazy River, Farrell Brook and Tracy Brook. Each point represent the mean of 16 monthly samples except for the Altona Flat Rock sites; MDAM, RESIN, SKEL and ROBIN gages; (n = 8) and the uppermost mainstream sample point at Military Turnpike (N=15).
p. 22
Figure 16. A. Mean daily discharge at the USGS gaging station at Stetson Road, Chazy. B. Average monthly concentrations of nitrate, total phosphorus and soluble reactive phosphorus in agricultural tributaries in the principal study reach (highlighted in Figure 14C). C. Index map of agricultural tributary sample points.

p. 23
Figure 17. Average total phosphorus vs. soluble reactive phosphorus in agricultural tributaries and the Little
Chazy River mainstream. Mainstream nutrient concentration is determined from nutrient concentrations at the nine mainstream gaging stations from MDAM to USGS for each synoptic sample suite.
The relationship between nutrient concentrations in agricultural tributaries and the mainstream differed greatly between the two solutes. Nitrate concentrations showed no relationship with an r2 of only 0.05 (Fig. 18A). Phosphorus concentrations however, exhibited a noteworthy relationship between tributary and main channel concentrations, with an r2 of 0.86 (Fig. 18B). Although much of the phosphorus correlation can be explained by a single high flow event, the relationship was still evident when this event was removed (r2 = 0.49).
Total Kjeldahl Nitrogen
Total Kjeldahl Nitrogen, which primarily reflects ammonium and particulate-bound nitrogen, was measured on a subset of eight mainstream and six agricultural tributary water samples from the principal study reach for six monthly sample suites (June, July, October, November and December 2008 and February 2009). The TKN:Nitrate N ratio generally ranged between 2:1 and 1:2 for most stations but the ratio was greater for two agricultural tributary sample sites with higher overall nitrogen concentrations (Fig. 19). The higher ratio may reflect a greater proportion of particulate-bound nitrogen in surface runoff or denitrification at these sites.

p. 24
Figure 18. A. Comparison of average nitrate concentrations in agricultural tributaries and the Little Chazy
River mainstream. B. Comparison of average total phosphorus concentrations in agricultural tributaries and the Little Chazy River mainstream. Mainstream nutrient concentration is determined from nutrient concentrations at the nine mainstream gaging stations from MDAM to USGS for each synoptic sample suite.

p. 25
Nutrient Loads
Nitrate, total phosphorus and soluble reactive phosphorus loads for nine mainstream gaging stations were determined for ten monthly sample suites in 2008. The sample population size for nutrient load calculations was limited primarily by the inability to estimate discharge at SUNY gages confidently when the channel was ice affected. Discharge estimates at SUNY gages for January and February 2008 were determined from manual measurement of stage at the time of water-quality sampling. The channel was ice-free during the January snowmelt-rainfall event and was about 80% ice-free in February. The gages were ice-affected in March 2008 so no discharge estimates are available. Discharge estimates for water-quality sample days in April through November 2008 are
Figure 19. Plot of average nitrate nitrogen (nitrate N) vs. average total Kjeldahl nitrogen for eight
mainstream gage sites (NEPH to CHAZY) and six agricultural tributaries in the principal study reach. The averages represent six monthly samples for which both nitrate and total Kjeldahl nitrogen were analyzed.
p. 26
daily averages determined from stage records at each gaging stations. Ice conditions prevented discharge estimates for December 2008 to March 2009 (ice-affected) and April 2009 datalogger records are not yet available.
Nitrate, total phosphorus and soluble reactive phosphorus loads increase logarithmically with channel distance through the principal study reach (Fig. 20). Average nutrient loads do not decrease in the Chazy impoundments as were observed with average concentrations (Figs. 11–13), suggesting that a combination of dilution and reservoir mixing account for most of the observed relationships. The average downstream nutrient load gradients from West Chazy (GUEST gage) to Chazy (USGS gage) are 41 kg/d/km (kilograms per day per kilometer of channel) for nitrate, 0.64 kg/d/km for total phosphorus and 0.34 kg/d/km for soluble reactive phosphorus.
The highest nutrient loads occurred during high-magnitude storm runoff events due to moderately elevated concentrations combined with high discharge. During these periods, bankfull and overbank conditions in some reaches and overland stormflow probably contributed to contamination of surface waters due to erosion of surface applied manure in flood-prone areas. Manure application immediately prior to large runoff events may also contribute to higher nutrient loads during high-magnitude events as observed during the February 2009 snowmelt and rainfall event. During low-flow conditions, tile-drain systems provide much of the agricultural loading and macropore flow in agricultural soils may exacerbate nutrient loss to surface waters.
DISCUSSION Nutrient runoff in the Little Chazy River is a complex function of watershed
hydrogeology and land management. Stream flow generation in the Little Chazy River is longitudinally heterogeneous and seasonally variable. Influent reaches occur in the headwater region on Altona Flat Rock and in the principal study reach between West Chazy and Chazy. The extent of the lower influent zone is restricted to the section between the WOOD and LC-87 gaging stations at high flow (QUSGS > 2.99 m3/s (75th percentile)) but expands upstream to the LANG gage at median and low flows. Evapotranspiration alone cannot account for the water loss in this zone. Losses to groundwater may be related to the proximity of the mainstream to the southeastern basin divide, complex geological structure south of Chazy and seasonal changes in groundwater levels, which also affect possible surface water sources such as wetlands, agricultural tributaries and tile drains. Nearly all stream flow in the Champlain lowland is generated in the upper reaches of the watershed during prolonged periods of baseflow, generally in the late summer or early fall. A greater proportion of stream flow is generated in the lowland portion of the watershed at higher flows as groundwater levels rise and surface reservoirs (e.g. wetlands and flow to tile drains) are replenished.
The spatial variability of nutrient concentration and load generally follow agricultural land use patterns in the watershed. Nutrient concentration and load are low in the forested headwater regions of the Little Chazy River and its principal tributaries and increase as these streams enter the Champlain lowland. Nutrient levels in the mainstream increase sharply upstream of West Chazy (NEPH gage) and increase logarithmically to

p. 27
Figure 20. Longitudinal variability of mean and median nitrate, total phosphorus and soluble reactive phosphorus loads for mainstream gaging stations in the principal study reach. Discharge data are available for ice-free sample days only.

p. 28
Lake Champlain. Mainstream locations that show consistent abrupt increases in nutrients are commonly related to input from tile drains, ditches and natural tributaries, however, nutrient inputs from these sources vary greatly with flow regime and fertilizer (manure) application. Nutrient concentrations decrease in the Chazy impoundments, presumably due to dilution by groundwater, reservoir mixing or sequestration in biomass. Average nutrient loads, however, do not reflect similar losses of solute mass suggesting that large-scale sequestration does not occur in these impoundments.
Nutrient concentrations increased substantially in the 7 km-long reach between the village of Chazy and Lake Champlain. Agriculture is widespread in this reach, accounting for more than 65% of land cover in the LAKE and USGS subwatersheds (Fig. 3). These subwatersheds include two tributary inputs, Tracy Brook and Rovers Creek. Other possible sources of nutrients include nonpoint source runoff from the village of Chazy and the Chazy municipal wastewater treatment plant, both of which lie upstream from the USGS gaging station at Stetson Road. Measured total nitrogen and total phosphorus loads from the wastewater treatment plant are relatively low (Fred Dunlap, NYSDEC, personal communication, 2008) and neither the village nor wastewater treatment plant sources account for the nutrient load increases below the USGS gage. Nutrient load increases below the USGS gage are most likely linked to agricultural runoff, which may be exacerbated by low-permeability marine soils and surface-drained (untiled) fields near the lake, especially for phosphorus.
Nutrient loads are highest during high-magnitude rainfall or snowmelt runoff events but the relationship is not consistent, as demonstrated by two combined snowmelt and rainfall events at the USGS gaging station on 10 January 2008 (Jan-08) and 12 February 2009 (Feb-09) (Table 4; Fig. 9). Nitrate load for the Jan-08 event (7310 kg/d) was nearly three-times
Table 4. Comparison of nitrate and total phosphorus concentrations and loads for two snowmelt-rainfall
events.
10-Jan-08 12-Feb-09
Discharge 23.2 m3/s 5.5 m3/s
Nitrate Concentration 3.65 mg/L 5.49 mg/L
Nitrate Load 7310 kg/d 2609 kg/d
Total Phosphorus Concentration 0.050 mg/L 0.416 mg/L
Total Phosphorus Load 100 kg/d 198 kg/d
that of the Feb-09 event (2609 kg/d), despite having lower nitrate concentration. The higher discharge of the Jan-08 event accounts for the greater nitrate load. Conversely, total phosphorus load for the Feb-09 event (198 kg/d) was nearly twice that of the Jan-08 event (100 kg/d), despite having a discharge less than one quarter of the Jan-08 event (Table 4). High total phosphorus concentration, related to widespread manure application
p. 29
immediately prior to the Feb-09 event, accounts for the high total phosphorus load. Nutrient loads for both events commonly exceed median and low flow (QUSGS < 2.99 m3/s) loads by more than an order of magnitude.
These relationships underscore the complexity of nutrient load generation and transport in the Little Chazy River and the difficulties involved in finding management options to reduce nutrient loads to Lake Champlain. General management strategies that may improve water quality include optimizing manure management in flood-prone areas or during times of potentially high runoff, especially in winter or early spring when much of the nutrient load is generated. Given the spatial and temporal complexity of nutrient runoff process, however, site-specific remediation strategies may be necessary. Possible management strategies will benefit from improved understanding of event-driven runoff processes and their nutrient loads, better delineation of flood-prone areas and “edge-of-field” studies of nutrient runoff generation in fields along the Little Chazy River corridor.
ACKNOWLEDGEMENTS We gratefully acknowledge the contributions from all of the many students who
participated in research in the Little Chazy River watershed over the past two decades, especially Ethan Sullivan, Brian Huber and Derek Smith, who were our principal student research assistants and Joel Brandt, Sean Keenan, Kevin Kieper, Michelle Ruan, Krystal Tremblay, and Sarah Wharton, who were directly involved in the current study. Special thanks to the Office of Sponsored Programs and the Lake Champlain Research Institute at SUNY Plattsburgh. Graduate student Amanda Lamb and Jeff Jones (Lake Champlain Research Institute) provided TKN analyses. We also extend our thanks to Charles LaMontagne (Ministrie du développement durable, de l’environment et des parcs du Quebec), Guy Morin (Environment Canada) and Margaret Phillips (USGS) for providing provisional streamflow data for the Richelieu and Little Chazy rivers. This study was funded by the New York State Department of Environmental Conservation and The Nature Conservancy through the New York State Environmental Benefits Program.
p. 30
REFERENCES Clesceri, L.S. A.E. Greenberg and A.D. Eaton (Editors),1998, Standard Methods for the
Examination of Water and Wastewater, 20th Edition: American Public Health Association.
Cressey, G.B., 1977, Land Forms, in Thompson, J.H. (ed.), Geography of New York: Syracuse University Press, Syracuse, New York, p.19–53.
Dawson, J.C., Heintz, J.F., Friedrichs, C., and West, L., 1981, William H. Miner and hydroelectric power development at Heart’s Delight Farm, Chazy, New York, p.3-32, in Dawson, J.C., (ed.), Proceedings 1981 Eighth Annual Lake Champlain Basin Environmental Conference, Miner Center, Chazy, New York, June 9,–10, 1981.
Denny, C.S., 1974, Pleistocene geology of the northeastern Adirondack region, New York: United States Geological Survey Professional Paper 786, 50p.
Dunne, T., and Leopold, L.B., 1973; Water in Environmental Planning: W.H. Freeman and Company, New York, 818p.
Fisher, D.W., 1968, Geology of the Plattsburgh and Rouses Point, New York-Vermont quadrangles: New York State Museum and Science Service, Map and Chart Ser. No. 10, 51p.
Franzi, D.A., Rayburn, J.A., Knuepfer, P.L.K., and Cronin, T.M., 2007, Late Quaternary history of northeastern New York and adjacent parts of Vermont and Quebec: 70th Reunion of the Northeast Friends of the Pleistocene, Plattsburgh, New York, 70p.
Karim, A.M., 1997, Clinton County, New York Priority Area Assessment Report 1997: Clinton County, New York, 11p.
Kennedy, R., 2002, Watershed best management practices for water quality management and restoration: Wetlands Regulatory Assistance Program (WRAP) Technical Notes Collection (ERDC TN-WRAP-02004), U.S. Army Engineer Resource and Development Center, Vicksburg, MS, 10p.
Landing, E., Franzi, D.A., Hagadorn, J.W., Westrop, S.R., Kröger, B., and Dawson, J.C., 2007, Cambrian of East Laurentia—Field workshop in eastern New York and Vermont, p.25-80, in Landing, E., (ed.), Ediacaran–Ordovician of east Laurentia, S.W. Ford Memorial Volume: New York State Museum Bulletin 510, p.25–71.
Lehman, N., Aumer, R., Katz, D., Stewart, L., Molaroni, S., Braimoh, K., Albert, K., Romanowicz, E., and Franzi, D.A., 2006, Baseflow generation and loss in the Little Chazy River watershed, northeastern New York: Geological Society of America, 2006 Abstracts with Programs, Northeastern Section, V.38, No.2.
Miller, J.R., and Ritter, J.B., 1996, An examination of the Rosgen classification of natural rivers: Catena, V.27, p.295–299.
NYSDEC, 2001, The 2000 Lake Champlain Basin Waterbody Inventory and Priority Waterbodies List, Encompassing all or portions of Clinton, Essex, Franklin and Washington Counties: Bureau of Watershed Assessment and Research, Division of Water, NYS Department of Environmental Conservation, 309p.
p. 31
Rantz, S.E., et al., 1982, Measurement and computation of streamflow: Volume 1, Measurement of stage, and Volume 2, Computation of discharge: U.S. Geological Survey Water-Supply Paper 2175, v. 1, p. 1-284, v. 2, p.285–631.
Roper, B.B., Buffington, J.M., Archer, E., Moyer, C., and Ward, M., 2008, The role of observer variation in determining Rosgen stream types in northeastern Oregon mountain streams: Journal of the American Water Resources Association, V.44, No.2, p. 417–427. DOI: 10.1111/j.1752-1688.2008.00171.x
Rosgen, D., 1996, Applied River Morphology, Second Edition: Wildland Hydrology, Pagosa Springs, Colorado.
Shanley, J.B., and Denny, C.S., 1999, The hydrology of the Lake Champlain basin, in Manley, T.O., and Manley, P.L., (eds.), Lake Champlain in Transition, From Research Toward Restoration: Water Science and Applications, Volume 1, American Geophysical Union, p.41-66.
Thorne, C.R., Hey, R.D., and Newson, M..D., 1997, Applied Fluvial Geomorphology for River Engineering and Management: John Wiley and Sons, New York, 376p.
United States Department of Agriculture, 1994, 1992 Census of Agriculture, New York, State and County Data, Volume 1, Geographic Area Series, Part 32: United States Department of Agriculture, National Agricultural Statistics Service, 163p.
------------1999, 1997 Census of Agriculture, New York, State and County Data, Volume 1, Geographic Area Series, Part 32: United States Department of Agriculture, National Agricultural Statistics Service, 523p.
------------2004, 2002 Census of Agriculture, New York, State and County Data, Volume 1, Geographic Area Series, Part 32: United States Department of Agriculture, National Agricultural Statistics Service, 569p.
------------2009, 2007 Census of Agriculture, New York, State and County Data, Volume 1, Geographic Area Series, Part 32: United States Department of Agriculture, National Agricultural Statistics Service, 641p.
Vermont DEC and New York State DEC, 2002, Lake Champlain Long-Term Water Quality and Biological Monitoring Program–Program Description: Vermont Agency of Natural Resources, Department of Environmental Conservation, New York State Department of Environmental Conservation and the Lake Champlain Basin Program, 11p.
Vermont DEC, 2009a, Lake Champlain Long-Term Monitoring, Tributary Monitoring Website: < http://www.anr.state.vt.us/dec//waterq/cfm/champlain/lp_longterm-tribs.cfm >
------------, 2009b, Lake Champlain Long-Term Monitoring, Lake Monitoring Website: < http://www.anr.state.vt.us/dec/waterq/cfm/champlain/lp_longterm-lakes.cfm >
Williams, G.P., 1978, Bank-full discharge of rivers: Water Resources Research, V.14, No.6, (Paper no. 8W0446), p. 1141–1154.

Appendix A A–1

Appendix A A–2

Appendix A A–3
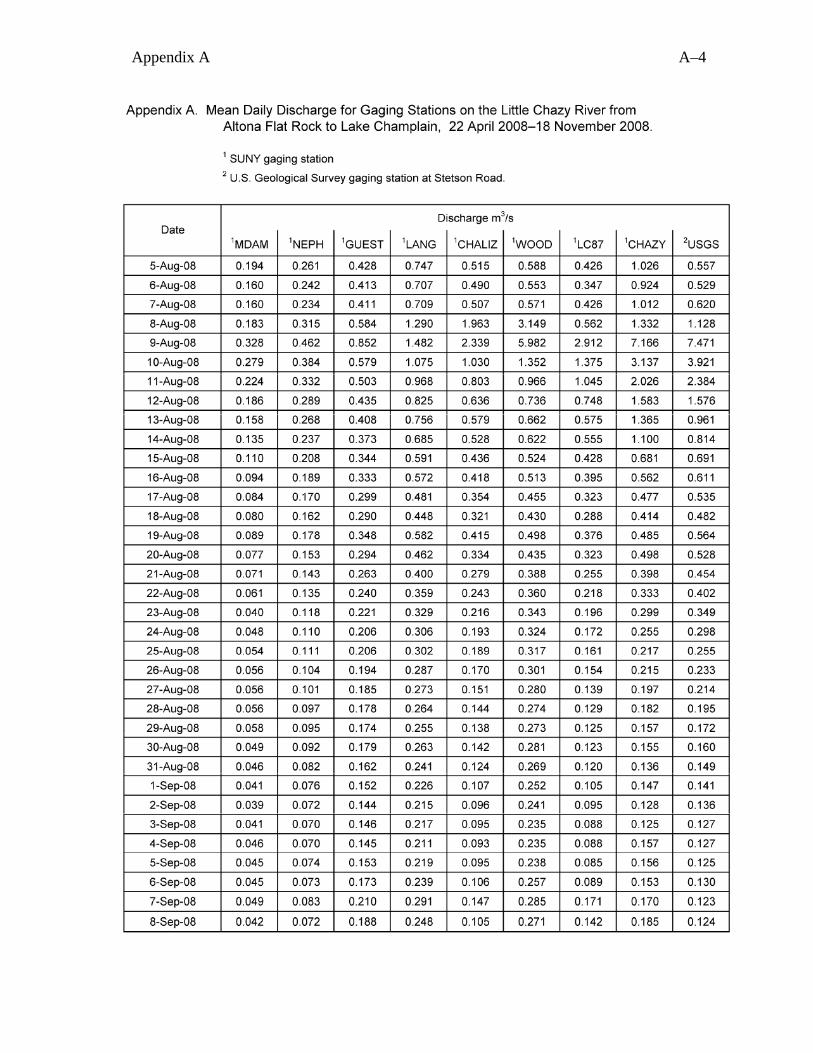
Appendix A A–4

Appendix A A–5

Appendix A A–6

Appendix B B-1

Appendix B B-2
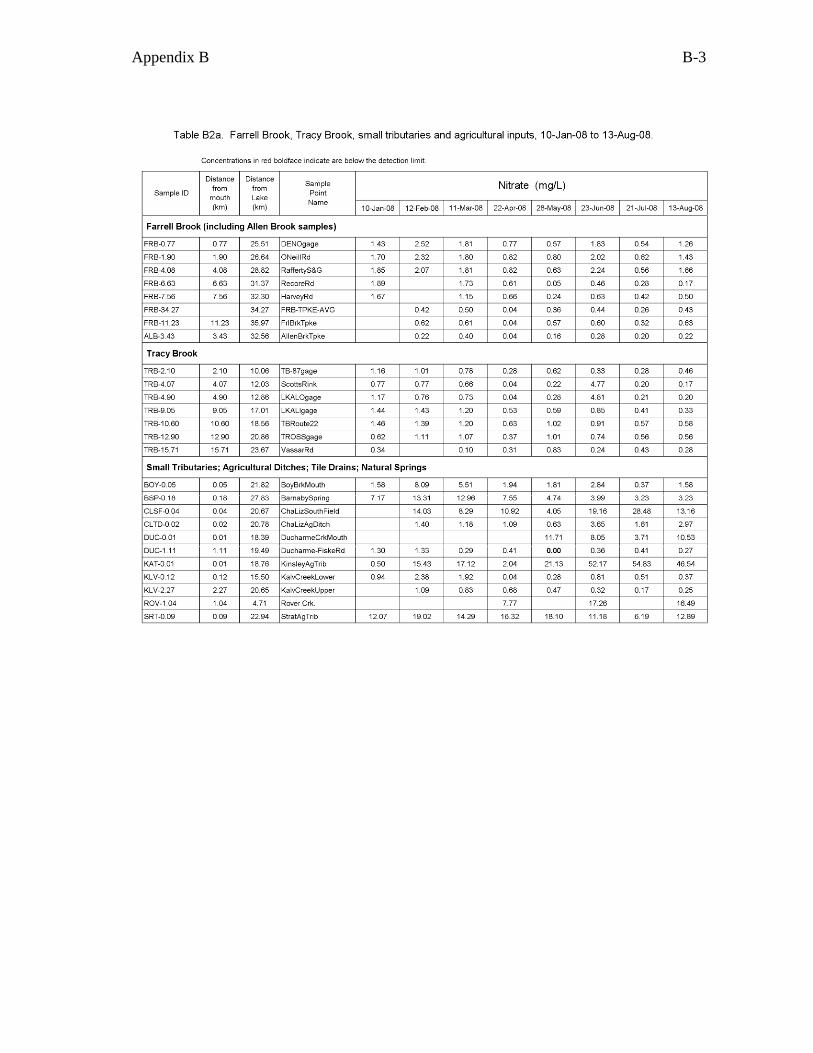
Appendix B B-3

Appendix B B-4
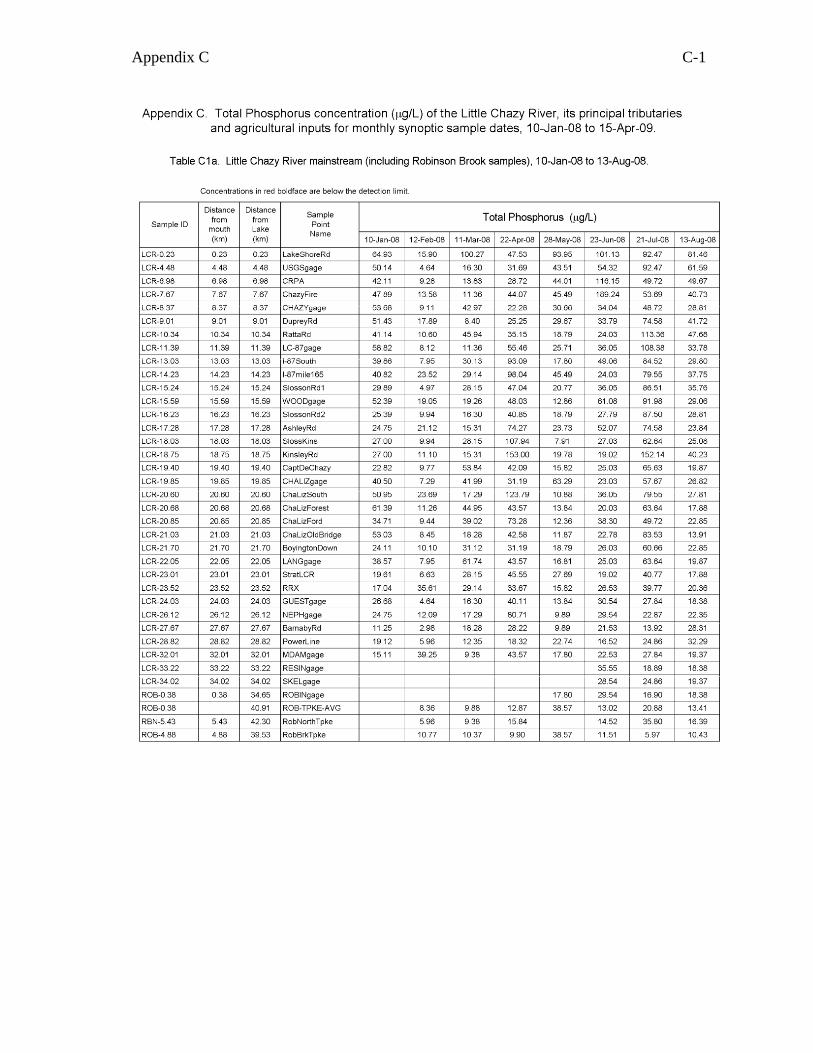
Appendix C C-1

Appendix C C-2
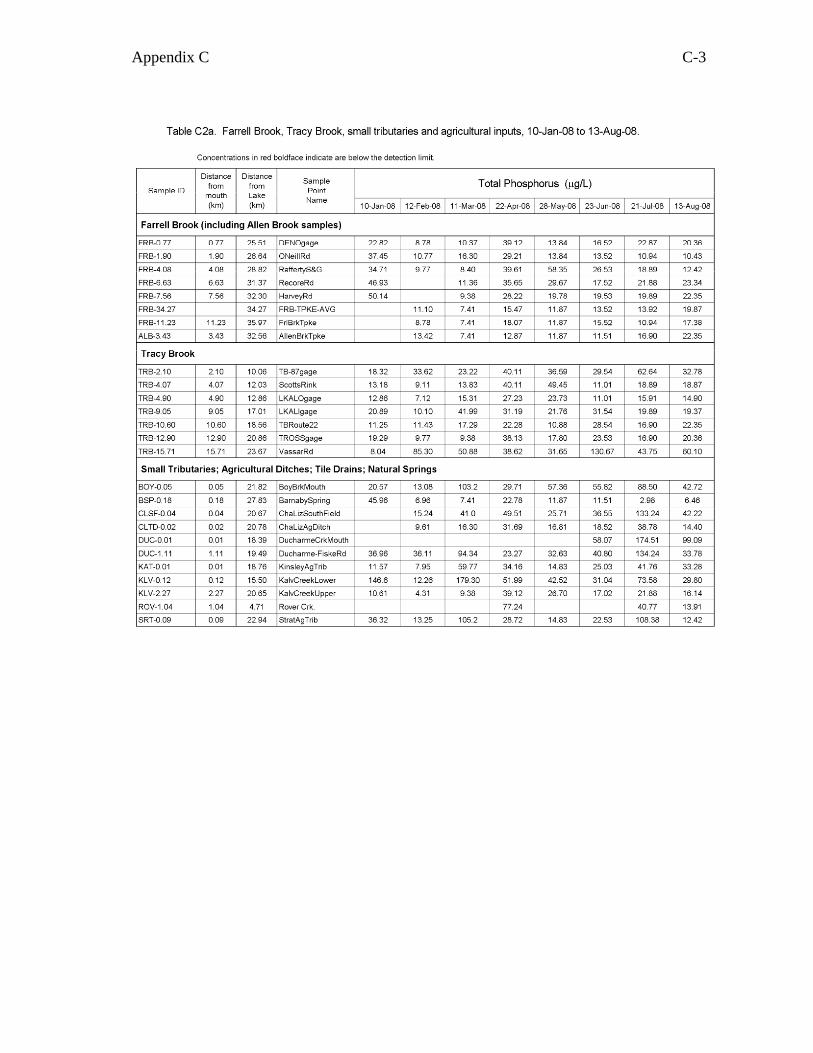
Appendix C C-3
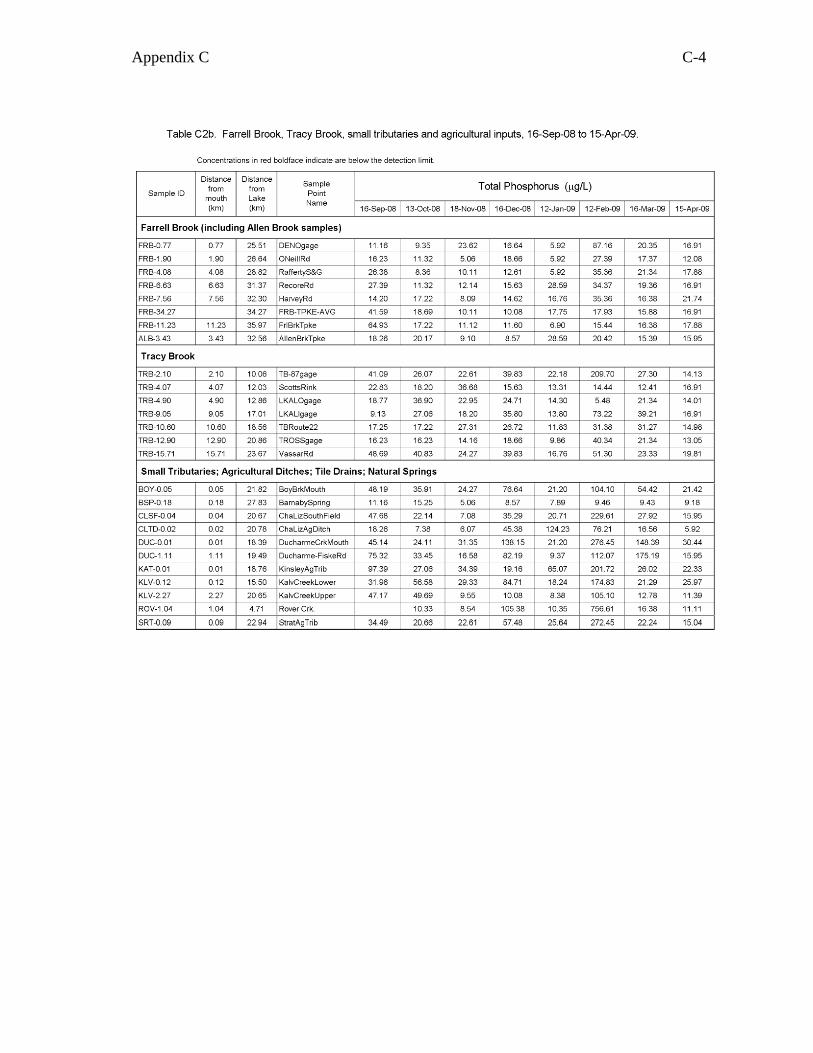
Appendix C C-4

Appendix D D-1
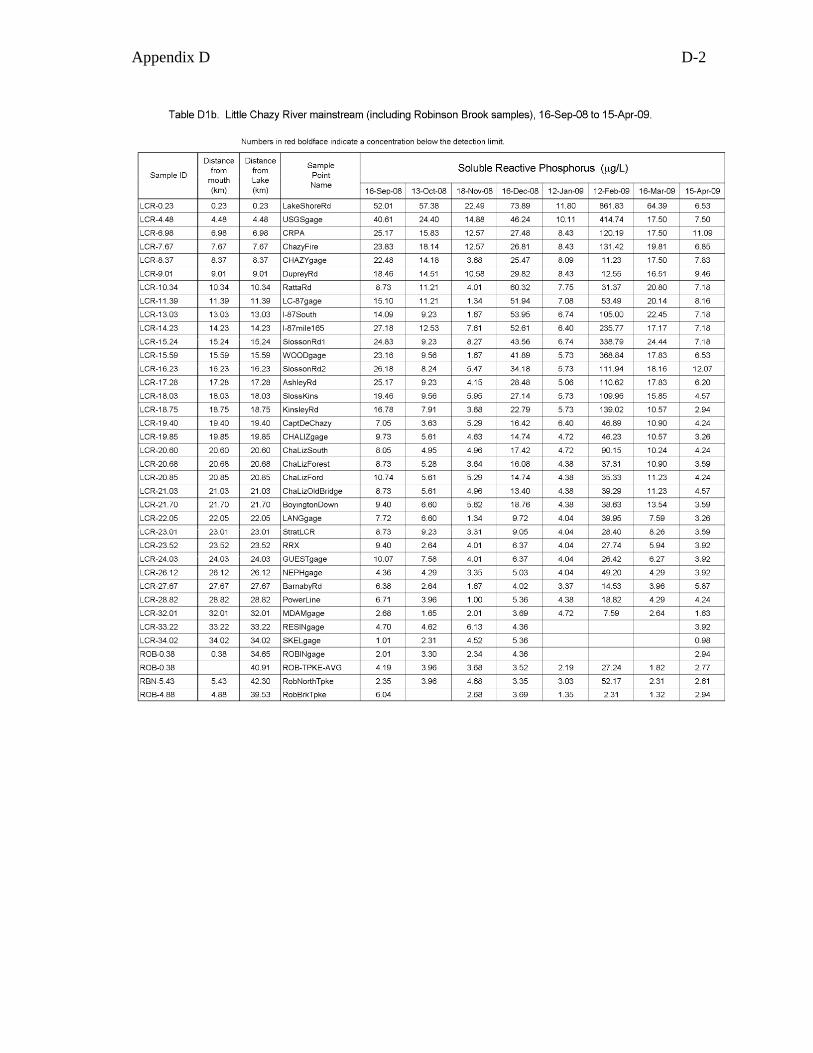
Appendix D D-2
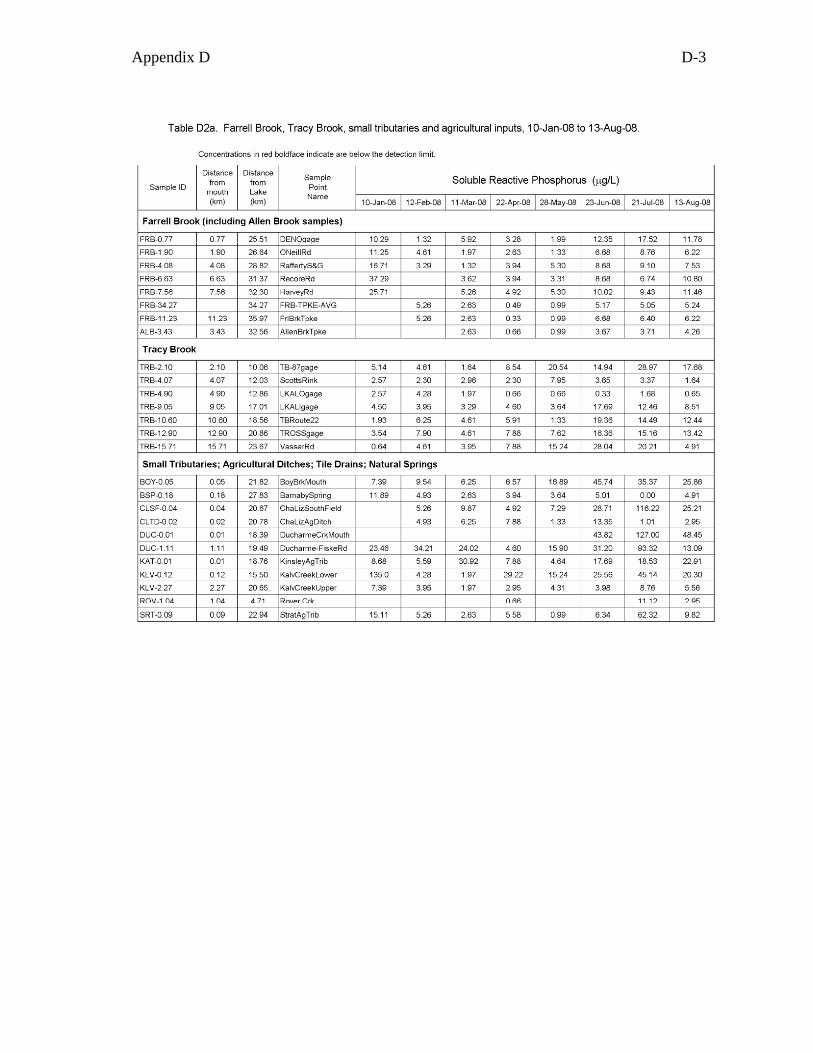
Appendix D D-3
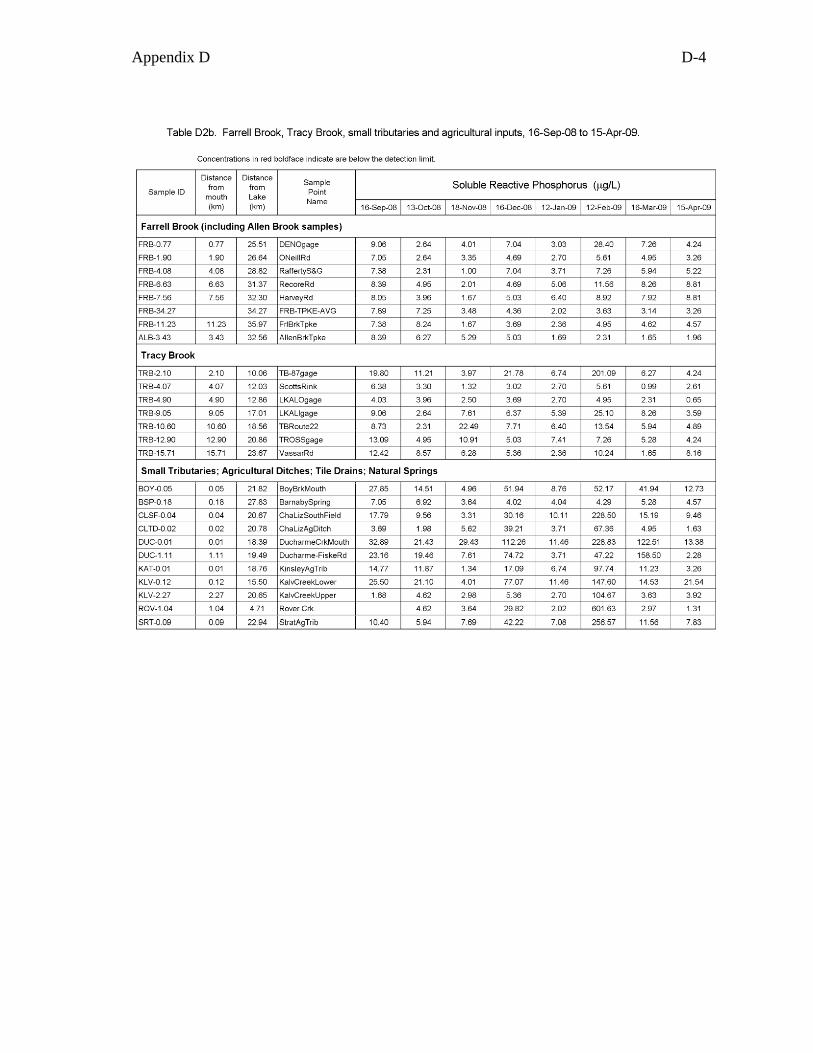
Appendix D D-4

Appendix E E1–1