a practical method to fabricate gold substrates for surface-enhanced raman spectroscopy
TRANSCRIPT

A Practical Method to Fabricate Gold Substrates forSurface-Enhanced Raman Spectroscopy
RATNA TANTRA,* RICHARD J. C. BROWN, MARTIN J. T. MILTON, and DIPAK GOHILNational Physical Laboratory, Analytical Sciences, Hampton Road, Teddington, Middlesex TW11 0LW, United Kingdom
We describe a practical method of fabricating surface-enhanced Raman
spectroscopy (SERS) substrates based on dip-coating poly-l-lysine
derivatized microscope slides in a gold colloidal suspension. The use of
only commercially available starting materials in this preparation is
particularly advantageous, aimed at both reducing time and the
inconsistency associated with surface modification of substrates. The
success of colloid deposition has been demonstrated by scanning electron
microscopy (SEM) and the corresponding SERS response (giving
performance comparable to the corresponding traditional colloidal SERS
substrates). Reproducibility was evaluated by conducting replicate
measurements across six different locations on the substrate and assessing
the extent of the variability (standard deviation values of spectral
parameters: peak width and height), in response to either Rhodamine
6G or Isoniazid. Of particular interest is the observation of how some
peaks in a given spectrum are more susceptible to data variability than
others. For example, in a Rhodamine 6G SERS spectrum, spectral
parameters of the peak at 775 cm�1 were shown to have a relative
standard deviation (RSD) % of ,10%, while the peak at 1573 cm�1 has a
RSD of �10%. This observation is best explained by taking into account
spectral variations that arise from the effect of a chemisorption process
and the local nature of chemical enhancement mechanisms, which affects
the enhancement of some spectral peaks but not others (analogous to
resonant Raman phenomenon).
Index Headings: Surface-enhanced Raman spectroscopy; SERS; Solid
supports; Colloids.
INTRODUCTION
To date, attempts to improve the reproducibility of surface-enhanced Raman spectroscopy (SERS) have concentrated onthe use of nanostructures on solid supports, as opposed to thetraditional approach of colloids and their subsequent aggrega-tion.1–3 The increasing popularity of such solid supports isprobably explained by their ease of use and the removal of anaggregation step in the measurement. Unless very wellcontrolled, the aggregation step in colloidal SERS can producedifferent shapes and sizes of metal clusters, which subsequentlywill result in a difference in the electromagnetic enhancementcontribution, thereby affecting the irreproducibility observedon the intensity scale.4 The use of solid supports as SERSsubstrates is not new and the idea was introduced in 1995 byFreeman and co-workers,5 in which the use of self-assembledgold and silver particles onto monolayers of functionalized(such as cyanide, amine, and thiol) coated substrates waspresented. Since then, variations of this idea have emerged withthe use of silver-coated porous glass ceramic substrates,6 gold-coated three-dimensional ordered colloidal crystal films,7 andgold nanostructured films deposited on polystyrene colloidalcrystal templates.8 Moreover, more sophisticated technologies,such as e-beam lithography, have been employed in an attempt
to have better control in producing ordered nanostructures on asurface.9,10
The use of sophisticated technologies such as e-beamlithography may not be attractive as they are expensive andnot accessible to many researchers, particularly if a high-resolution instrument is required. Solid supports fabricatedthrough the use of colloid adsorption on chemically modifiedsubstrates (as first introduced by Freeman et al.5) seems to offersubstantial potential for use as a much cheaper alternative.Nonetheless, the fabrication steps associated with suchsubstrates are not without flaws. Firstly, the preparation stepsused to chemically modify the substrate can be laborious.Secondly, surface modification protocols to be carried out inthe laboratory are not trivial and surface inhomogeneities aftersuch chemical treatment are likely.11 Inhomogeneous substratemodification will contribute towards inhomogeneous deposi-tion of the colloids on the surface, which will subsequentlycontribute towards variations in electromagnetic enhancement;this will eventually result in batch-to-batch irreproducibility aswell. The difficulty of achieving nanostructures that arehomogeneous in nature across a surface has been confirmedby Seitza et al.12 They have indicated that the SERS effectbased on such substrates will be critically dependent upon thesurface treatment of the substrate by a chemical modificationstep on the surface. Apart from this, irreproducible contribu-tions can also arise from the colloidal suspension used as thestarting material. Cook et al.13 have shown that the widevariety of preparative methods used to synthesize the colloids(for example, variations in stirring rates during the colloidsynthesis) can have a contributory role towards the irrepro-ducibility of SERS.
In this paper, we report an easy and low cost method forfabricating SERS substrates, without the need to carry outlaborious steps such as substrate modification and colloidsynthesis. This was achieved by taking advantage ofcommonly, commercially available products, i.e., poly-l-lysinecoated glass substrate and gold colloids. Gold particles weredeposited onto the substrates via dip-coating into the colloidalsuspension. Upon successful colloid adhesion, the poly-l-lysinewill act as a ‘‘linker’’ molecule between the glass substrate andgold colloids. As previously reported, the strong linkageprovided is via strong interactions between e-amino groups ofthe l-lysine and the gold.14 Overall, the fabrication processpresented in this study attempts to not only cut downpreparation time (by using ‘‘off-the-shelf’’ materials) but willalso eliminate potential irreproducibilities associated with ‘‘in-house protocols’’ that are highly operator dependent. Thesubstrate presented will be particularly useful for the novice inSERS and surface modification technology.
Researchers have previously demonstrated that reproduc-ibility in the SERS intensity signal is influenced by bothelectromagnetic and chemical enhancement effects. However,
Received 26 February 2008; accepted 5 June 2008.* Author to whom correspondence should be sent. E-mail: [email protected].
992 Volume 62, Number 9, 2008 APPLIED SPECTROSCOPY0003-7028/08/6209-0992$2.00/0
� 2008 Society for Applied Spectroscopy
it is thought that the electromagnetic contribution is dominantover the chemical contribution.15 The theory of electromag-netic enhancement is better understood than those arising fromchemical effects and it is thought that variations in electro-magnetic enhancement are governed by the size and morphol-ogy of the nanostructures.16,17 It is, therefore, of interest toinvestigate the SERS activity of the presented substrates and tocompare this with their corresponding surface morphology.
In this study, scanning electron microscopy (SEM) images willbe presented in order to not only evaluate the success of thecolloid deposition but also to investigate the homogeneity of thesurface. As the substrate had to be gold coated prior to SEMimaging (to avoid problems associated with charging effects),this will in effect modify the morphology of the substrate byforming a thin layer of gold on top. From a practical point ofview, the potential of having sputtered gold coating on top ofnanoparticle assemblies is an attractive application, as thepresence of such a coating on the surface can improve adhesionand reduce problems associated with colloids otherwisedetaching from the substrate. This is particularly advantageousfor liquid sampling, as colloids may leach into the solution. As aresult, the SERS performance of the native substrate versus thecorresponding sputter-coated substrate was compared in relationto two probe analytes: Rhodamine 6G and Isoniazid (besidesissues of practicality, there is also interest of novelty, in that noprevious studies have examined the effect of such gold sputtercoating on the SERS spectrum). Rhodamine 6G was chosen as a‘‘model’’ analyte as it is one of the most extensively studied probemolecules in SERS.18,19 Isoniazid, although not so well studiedin conjunction with SERS, has a very important application in theprevention of tuberculosis.20 As the main goal of developingsolid supports is to improve reproducibility of the SERSenhancement factor,21 we will therefore show results fromreplication experiments. Performance of the substrates will beevaluated based on the analysis of extracted spectral parametersof the peak center position, width, and height; the mechanismsaffecting reproducibility of the dataset will also be proposed.
METHOD
Substrate and Sample Preparation. Reagents. Reagentsemployed in the present study (potassium chloride, Isoniazid,and Rhodamine 6G) were purchased from Sigma-Aldrich (UK)and used as received; chemicals employed were of analytical-reagent grade or better. Deionized water (DI, Millipore, MilliQ)was used for preparing all aqueous solutions. Stock solutions ofRhodamine 6G (20 3 10�6 M) and Isoniazid (87 3 10�5 M)were prepared in deionized water. These were made up days inadvance and stored in the fridge (4 8C) until needed. Allsolutions were allowed to reach room temperature for 1 hourprior to their use.
The poly-l-lysine coated microscope glass slides used in thisstudy were purchased from Fisher Scientific UK and goldcolloid solution (17–23 nm mean particle size, monodisperse)was obtained from Sigma Aldrich, UK. Gold colloid solutions(contained in a plastic bottle) were stored in the fridge (at 4 8C)overnight before their immediate use. This minimizes anyeffects that may have resulted from the variation of the sizedistribution/dispersion of the colloids through time (variationswith purchased colloids can occur, especially with age). Ifcolloids are not used immediately after purchase, then it is bestto check the quality with light scattering or extinction spectra tomonitor the size and dispersion of the colloids.
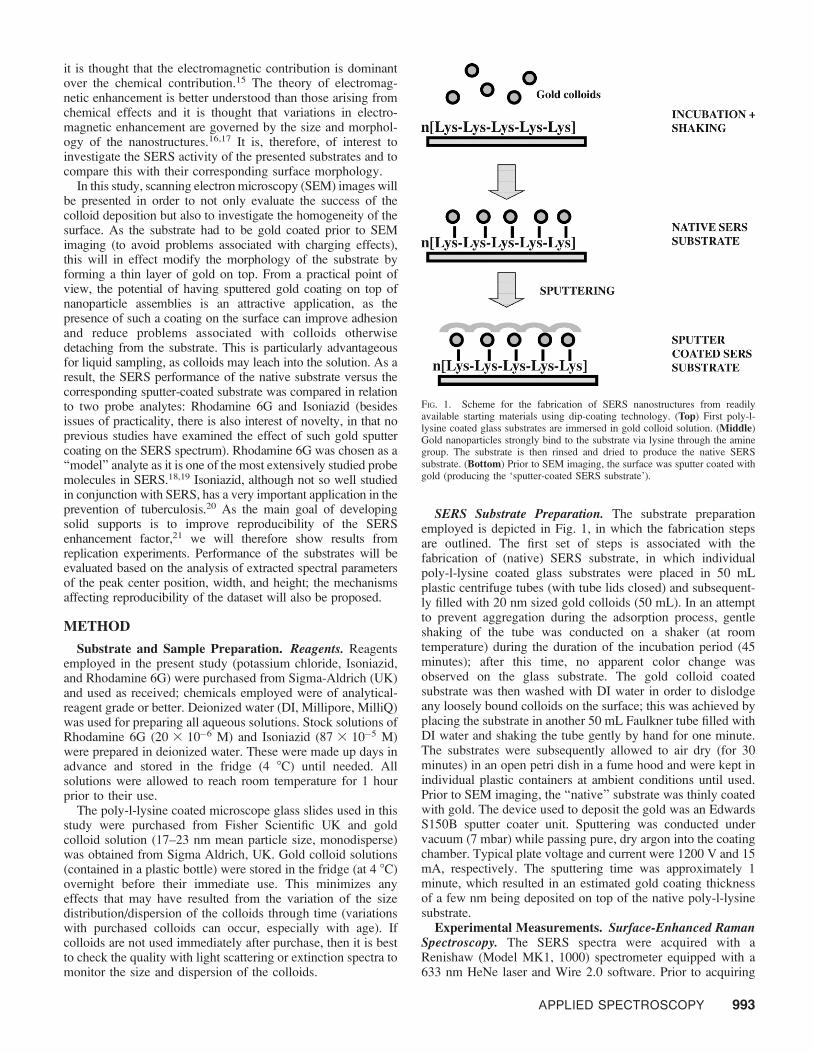
SERS Substrate Preparation. The substrate preparationemployed is depicted in Fig. 1, in which the fabrication stepsare outlined. The first set of steps is associated with thefabrication of (native) SERS substrate, in which individualpoly-l-lysine coated glass substrates were placed in 50 mLplastic centrifuge tubes (with tube lids closed) and subsequent-ly filled with 20 nm sized gold colloids (50 mL). In an attemptto prevent aggregation during the adsorption process, gentleshaking of the tube was conducted on a shaker (at roomtemperature) during the duration of the incubation period (45minutes); after this time, no apparent color change wasobserved on the glass substrate. The gold colloid coatedsubstrate was then washed with DI water in order to dislodgeany loosely bound colloids on the surface; this was achieved byplacing the substrate in another 50 mL Faulkner tube filled withDI water and shaking the tube gently by hand for one minute.The substrates were subsequently allowed to air dry (for 30minutes) in an open petri dish in a fume hood and were kept inindividual plastic containers at ambient conditions until used.Prior to SEM imaging, the ‘‘native’’ substrate was thinly coatedwith gold. The device used to deposit the gold was an EdwardsS150B sputter coater unit. Sputtering was conducted undervacuum (7 mbar) while passing pure, dry argon into the coatingchamber. Typical plate voltage and current were 1200 V and 15mA, respectively. The sputtering time was approximately 1minute, which resulted in an estimated gold coating thicknessof a few nm being deposited on top of the native poly-l-lysinesubstrate.
Experimental Measurements. Surface-Enhanced RamanSpectroscopy. The SERS spectra were acquired with aRenishaw (Model MK1, 1000) spectrometer equipped with a633 nm HeNe laser and Wire 2.0 software. Prior to acquiring
FIG. 1. Scheme for the fabrication of SERS nanostructures from readilyavailable starting materials using dip-coating technology. (Top) First poly-l-lysine coated glass substrates are immersed in gold colloid solution. (Middle)Gold nanoparticles strongly bind to the substrate via lysine through the aminegroup. The substrate is then rinsed and dried to produce the native SERSsubstrate. (Bottom) Prior to SEM imaging, the surface was sputter coated withgold (producing the ‘sputter-coated SERS substrate’).
APPLIED SPECTROSCOPY 993

data, the instrument was allowed to warm up for at least 1 hourand a spectrum of silicon was acquired to calibrate theinstrument (signal centered around 520 cm�1) and optimize theinstrument’s performance. Each SERS measurement was madewith laser excitation (at source) of 13 mW, a 203 objectivelens, detection time of 10 seconds, and a spectral range of 200–1800 cm�1. The spectral resolution was set to 4 cm�1 and eachspectrum consisted of 1 scan.
In order to perform experiments on the SERS substrates, analiquot of Rhodamine (20 3 10�6 M) or Isoniazid (87 3 10�5
M) was directly deposited on the surface of the substrate. Withthe laser light focused on the surface of the substrate, the SERSspectrum was acquired after the drop was left on the surface for1 minute. We estimated the size of the droplet before and afterdata acquisition under the optical microscope. Within thetimeframe required to acquire the necessary data afterdepositing the droplet solution on the SERS substrate, it wasobserved that the droplet size on the surface of the SERSsubstrate did not seem to change, and we thus assumed that thedrying process does not significantly affect the concentration ofthe Rhodamine within the droplet. In order to conductreproducibility studies, replicates (six times) of this measure-ment were taken across different areas of the surface (chosen atrandom).
For recording the SERS spectra of aqueous Rhodamine 6G(20 3 10�6 M) with the use of colloidal (20 nm) gold from
Sigma, the following protocol was used (having previouslyoptimized the protocol in-house). Ten microliters (10 lL) of0.5 M KCl were added to 50 lL of water in a small plastic vial.The vial was vortexed quickly before adding 40 lL ofRhodamine 6G (from 0.1 mM stock). After vortexing again (2seconds) to ensure mixing, 100 lL of gold colloids was thenadded rapidly in one portion (at the same time generatingintense turbulence in the mixture) and the whole mixture wasvortexed for a further 10 s. An 80 lL aliquot of this finalmixture was quickly introduced into a quartz cell and SERSdata acquired after a 1 minute incubation time (this is the totaltime after the colloid addition step).
Scanning Electron Microscope. In order to check the shapeand the lateral size of the particles and also surfacehomogeneity across a region of deposition, scanning electronmicroscope images of the SERS substrates were collectedusing a Carl Zeiss Supra 40 electron microscope. Anaccelerating voltage of 10 kV was used. The spatial resolutionof the microscope was 1–2 nm when images were recordedwith an in-lens secondary electron detector.
Data Preprocessing and Curve Fitting. For SERS spectralcharacterization, all datasets were subjected to the samepreprocessing procedure (carried out using Excel 7.0 software),prior to extraction of spectral information using curve-fittingmethods. Data preprocessing included the removal of baselinecontributions, as a ‘‘flat baseline’’ is needed in order to fit acurve successfully. As previously documented,22 this was doneby taking a ‘‘running minimum’’ across a predefined spectralrange (in our case by 630 points) to obtain the baseline profile;removing the baseline profile from the raw data will thusachieve a baseline corrected data. Each baseline correctedspectrum is then normalized by setting the maximum value ofthe spectrum to unity in order to take into account any baselineoffsets that may occur during data acquisition. The processeddata is therefore a baseline corrected spectrum normalized tomaximum intensity. To deduce spectral band characteristics,each dataset is then processed in Wire 2.0, in which thesoftware curve fits spectral peaks to a mixture of Lorentzianand Gaussian functions; algorithms were employed toautomatically perform many iterations until the best fit wasachieved (Wire 2.0 software, Renishaw, manual). Three mainspectral peak parameters were obtained (frequency position,peak width, and peak height). Figure 2 shows a typicalspectrum and the steps depicting these data preprocessing andcurve-fitting steps; for the purpose of illustration, only theRhodamine spectrum is considered.
RESULTS AND DISCUSSION
SERS Profile of Rhodamine 6G and Isoniazid on theSERS Substrates (Native and Sputter Coated). Figure 3ashows the R6G (20 3 10�6 M) SERS profile of the nativesubstrate, i.e., the substrate with no sputtered coating. Thefigure shows three spectra that correspond to the raw dataset,the corresponding background signal (blank of native sub-strate), and the background corrected data (raw minusbackground). The background profile (showing mainly asloping background with a weak, broad peak at ;1650cm�1) shows the spectral fingerprint contribution that arisesfrom the presence of a poly-l-lysine coating. We are certain thatthe observed signal did not arise from the gold itself; we havechecked the signal from the gold colloid solution and have notobserved this kind of fingerprint. By looking at the spectral
FIG. 2. Effect of data pretreatment and subsequent curve fitting on the originaldata: (a) Data was baseline corrected, (b) followed by normalization tomaximum intensity, and then curve fitting was performed (to a Gaussian–Lorentzian line shape function) in order to extract the spectral peak parameters.
994 Volume 62, Number 9, 2008

difference between the three spectra, it is clear that thebackground spectrum is responsible for slope and offset effectsobserved in the raw spectrum. Apart from this slope/baselineoffset effect, there is very little difference between the raw andbackground corrected data.
Figure 3b shows the corresponding SERS spectrum ofIsoniazid (87 3 10�5 M) on the native substrate. As before,three spectra are displayed: raw, background, and backgroundcorrected data. As with the Rhodamine 6G case, a similar trendis observed, i.e., background removal did not significantlychange the spectral fingerprint of the raw spectrum, apart frombaseline slope and offset contributions. The insignificantfingerprint contributions from poly-l-lysine are not surprisingand others who have used poly-l-lysine as an aggregating agentin SERS have reported similar observations.23,24 According toCunningham,25 its use as an aggregating agent is favored as itdoes not have an appreciable fingerprint, as well as being ableto aggregate colloids in a controlled manner. The weakbackground from poly-l-lysine is most likely due to theinherently small Raman cross-section of the molecule itselfwith a particular laser excitation, i.e., in this case, 633 nm. Suchan interpretation of the results makes sense, as in the past,Raman scattering cross-section of such biologicals could beachieved most effectively by laser excitation using a shorterlaser wavelength, in which workers have employed ultraviolet(UV) lasers for excitation.26
Figure 3a shows the SERS spectra of Rhodamine 6G, whichis similar to those previously obtained by past workers.18,19
Unlike Rhodamine 6G, the SERS of Isoniazid has not beenwell documented and it is important to confirm the ‘‘fingerprintidentity’’ of such a new analyte, firstly under normal Ramanand then under SERS conditions (shown in Fig. 3c). Figure 3ccompares three spectral fingerprints of Isoniazid: SERS at aconcentration of 87 3 10�5 M (a concentration shown not toexhibit any spectral fingerprint under normal Raman condi-tions) using the SERS (native) substrate and the correspondingRaman spectra (of solid and saturated aqueous solution ;87 310�2 M). For comparative purposes, the three spectra havebeen normalized to maximum intensity. From the results, it wasobserved that some of the unique spectral fingerprints could beexplained by the dissolution of the solid in aqueous solution.Firstly, sharp spectral features found in the solid spectrumbecome less pronounced and broader when the solid isdissolved in solution. Secondly, shifts (e.g., peak 1348 cm�1)and the disappearance (e.g., 1681 cm�1) of spectral peaks werealso observed. These results are not surprising and may beindicative of loss of crystallinity and subsequent hydrationeffects on the molecule.27 Most of the spectral peaks identifiedin the solid spectrum exist in the liquid spectrum and there is acomparative closeness between the SERS and liquid spectrum;this confirms that the SERS fingerprint of the Isoniazid wasindeed observed. Nonetheless, it is clear there is a furtherchange in the spectral fingerprint in the SERS spectrum.Results show more disappearance of certain spectral features(e.g., 900 cm�1), the appearance of new peaks (e.g., 1495cm�1), and Raman shifts occurring (e.g., 1023 cm�1) underSERS conditions. In addition, there is evidence of two peaksemerging (1193 and 1126 cm�1) to form a main peak andshoulder in the spectrum (circled in Fig. 3c). Such spectralchanges observed under SERS conditions can predominantlyarise due to the presence of an analyte–metal complex duringchemisorption, the formation of a new optical transition state,
and subsequent charge-transfer excitation in the chemicalSERS mechanism.28
Having established the characteristic SERS fingerprint forboth Rhodamine 6G and Isoniazid on the native substrate,spectral differences using native versus sputter-coated sub-strates were then evaluated. Figures 4a and 4b show the SERSspectra of Rhodamine 6G (20 3 10�6 M) and Isoniazid (87 310�5 M), respectively; each plot consists of two separate SERSplots corresponding to the use of native versus sputter-coatedsubstrates. At first glance, there appears to be very littledifference between the two substrates in terms of the spectralfingerprints in response to a particular analyte. This is also truein terms of the magnitude of the signal obtained, indicating thatthey have comparable enhancements from the SERS effect.However, upon closer examination of the results, thisobservation would appear to be an over implication. There
FIG. 3. SERS spectra of (a) R6G (20 3 10�6 M ) on the native SERSsubstrate. Three plots are shown corresponding to the raw (unprocessed)spectrum, the background spectrum, and the difference spectrum of the two. (b)Isoniazid (87 3 10�5 M) on the native SERS substrate. Three plots are showncorresponding to the raw (unprocessed) spectrum, the background spectrum,and the difference spectrum. (c) A comparison of the SERS Isoniazid (87 310�5 M) response using the native SERS substrate and the correspondingnormal Raman spectra (taken from the saturated solution and solid). All plotsare normalized with their corresponding maximum intensity.
APPLIED SPECTROSCOPY 995

are spectral differences, in particular the emergence of newpeaks in the case of one substrate but not the other. Forexample, in the case of Rhodamine 6G (Fig. 4a), a small/broad/weak peak at 1025 cm�1 (arrow) exists in the native substratebut not in the sputter-coated substrates; there is also anoticeable shift at ;1600 cm�1. These bands at 1025 cm�1
and 1600 cm�1 are weak and are thought to be attributed to thering vibration (of the ortho-disubstituted benzene ring) and thering stretches (doublet) of benzene derivatives, respectively.29
In the case of the Isoniazid, the presence of new peaks is moreapparent; peaks at Raman shifts of 1289 and 1524 cm�1
(circled) exist with the sputter-coated substrate but are missingin the native substrate. We have hypothesized that the peaks at1289 cm�1 and 1524 cm�1 are thought to be attributed theamide functional group. In summary, differences in spectrabetween the two substrates for a particular analyte are mainlycaused by the emergence of new peaks rather than by changesin overall intensity. This again is indicative that the source ofvariation is predominantly coming from chemical rather thanelectromagnetic enhancement effects, i.e., the presence of achemisorption step, in which the result of new chemicalbonding states of the molecule on the metal surface is detectedby peak shift or the appearance of new peaks. As proposed byLombardi et al.,30 the emergence of new peaks that can beassociated with the formation of new electronic states at theinterface will serve as resonant intermediate energy levels thatthen allow charge transfer to occur. Such a ‘‘chemical effect’’ ismore difficult to control (compared to an electromagnetic one)as it will be affected by orientation of the molecule and itsinteraction with the metal surface.28,31,32
Frequently quoted in the literature to indicate the magnitudeof the SERS effect, the enhancement factor (EF) is a useful
indication of performance comparison between different SERSsubstrates. However, recently the accurate definition of thisvalue has been the subject of much debate, which according toLe Ru and co-workers33 has led to the spread of EF values overseveral orders of magnitude in the literature, thus implying thatthe value is not universal. In an attempt to have some idea ofthe enhancement from our substrates, we have compared theperformance relative to corresponding colloidal SERS. Theenhancement analysis was done using the raw spectra andevaluated with no normalization. Figure 4a shows thecorresponding SERS signal (solution of Rhodamine havingthe same concentration) obtained from a colloidal solution ofgold particles (the same kind of gold particles that have beenused to produce the SERS substrates in this study). It is clearfrom the result that the observed fluorescence that was presentin previous spectra associated with the SERS substrates hasdisappeared, which was expected due to the absence of thepoly-l-lysine background. Results show that the SERSspectrum from the corresponding colloids shows comparablefrequency fingerprint and intensity response to the poly-l-lysineSERS substrate (minus the sloping background). Past work-ers34,35 have proposed that average SERS enhancement (withadsorbed non-resonant molecules), from such colloidal systemsis estimated to be 105 to 106, and hence, it would be reasonableto assume that the fabricated SERS substrates will have similarEF values. This equivalence will only be true if Rhodaminepossess similar adsorption/surface coverage properties on bothtypes of SERS substrates, which should be the same in bothcases as it is mainly governed by inherent properties of theanalyte and subsequent analyte–metal interactions.
Surface Morphology of the SERS Substrates. Scanningelectron microscopy images (top view) of the sputter-coatedsubstrate are presented in Fig. 5; sputtering was necessary aswithout the gold coating it was impossible to acquire the imagesuccessfully due to problems associated with charging effects.A low magnification view of 352 740 magnification (thatshows approximately a 5 lm 3 5 lm area) is given in Fig. 5a.The image indicates that the deposition protocol has lead to auniform distribution of gold nanoparticles on the substrate.Figure 5b shows a higher magnification view of 3201 680 thatshows that most of the particles have an average particle sizeon the order of 20 nm (diameter) and particle shapes rangingfrom spherical to ellipsoidal in nature. The particles exist eithersingly or in small aggregates (of two to five colloids) and onaverage there are approximately six gold particles in a 200 nm2
area (or 30 000 particles in a 1 lm2 area); the particleconcentration in the colloidal solution was 4.6 3 1011 particlesper mL (as documented from the datasheet). The largeraggregates (clusters of up to ;250 nm) are few and wereobserved in the lower magnification image in Fig. 5a. Thepresence of (small and large) aggregates can be formed inseveral ways during the fabrication process. It may be that thecommercially obtained materials have certain flaws, as thesewere used without further modifications; small aggregates mayalready be present in the colloidal suspension or surfacemodification of glass substrates may not display molecular-level homogeneity. Furthermore, conditions during the dip-coating step may not be very well controlled and may requirefurther modification/optimization. Ultimately, this wouldinclude finding the optimal population of colloids on thesurface that would result in optimum SERS enhancement.36
Although no studies have been done in the past to verify this, it
FIG. 4. A comparison of SERS spectra of (a) R6G (20 3 10�6 M) on SERSsubstrates (native and sputter coated) and colloidal SERS. (b) Isonizid (87 310�5 M) on SERS substrates (native and sputter coated).
996 Volume 62, Number 9, 2008

is reasonable to assume that conditions such as dip-coatingtimes can affect the population of the aggregates on the surface.Thus, it can be hypothesized that after sufficient dipping times,aggregates can ‘‘grow’’ on the surface and the poly-l-lysinemolecules (that have been employed as an aggregating agent inthe past)25 may also act as ‘‘nucleation sites’’ where colloidalaggregates can grow. However, it should be noted that theaggregates observed in the SEM image are spaced fairly evenlyacross the substrate and it may be that variations in themeasured SERS signal will be minimized due to the ‘‘averagingeffect’’ across the enclosed laser spot area (;1–2 lm indiameter).
Reproducibility Performance of SERS Substrates: Na-tive versus Sputter Coated Substrates. It is clear from theSEM images that the SERS substrate produced using thismethod has irregularities in its surface in the form of particleaggregates and it is of interest to observe how (and to whatextent) such nanostructural irregularities can contribute to-wards data irreproducibility. In this respect, spectral peakcharacteristics (from six replicate measurements) were used to
evaluate the reproducibility performance of the substrates. Asdetailed in the Method section, the spectral characteristics ofeach spectrum were deduced from baseline corrected andmaximum intensity normalized data, followed by curve fittingof the resultant peaks; error bars associated with themeasurement of replicates have been calculated and correspondto plus or minus one standard deviation.
In terms of Raman fingerprints (center of frequencymaximum of each peak) acquired for both Rhodamine andIsoniazid, there is little difference between the use of nativeversus sputter-coated substrates. It was found that in both probeanalytes, the standard deviation of the Raman shift is between1–3 cm�1, which corresponds to less than 1%, relative standarddeviation (RSD), indicating that Raman shift information foranalyte identification (for both substrates) is extremelyaccurate. Of course, this high accuracy in the wavenumberidentification for a particular analyte, which makes the toolsuitable for production identification, is not surprising as itarises from unique molecular vibrations that are specific to amolecular bond.10,37 This is unlike the intensity scale, whichhas always been prone to irreproducibility,1 the cause of whichhas been the subject of much debate.38
Figures 6a and 6b display a set of two plots of the meanwidth and the mean intensity, respectively, of spectral peaks atselected spectral bands in the Rhodamine 6G spectrum when
FIG. 5. SEM images of (sputter-coated) SERS substrate taken at (a) lowmagnification (352 740), with the circled portions showing nanoparticleaggregates on the surface, and (b) high magnification (3201 680).
FIG. 6. Spectral response of Rhodamine 6G (20 3 10�6 M) on SERSsubstrates (native and sputter coated). Comparison of (a) peak line width and(b) peak height, obtained from eight identified spectral lines. A mean valuewith error bars (showing plus/minus one standard deviation) of six independentreplicate experiments is depicted.
APPLIED SPECTROSCOPY 997

using either native or sputter-coated substrates; the plots alsodisplay the corresponding standard deviation (among the sixreplicates). These plots show that there is comparableperformance between native versus sputter-coated substratesin terms of their mean values and corresponding standarddeviations for a particular spectral peak. A similar trend is alsoobserved when Isoniazid was used as a probe analyte instead.Such observations indicate that the SERS effect responsible forenhancing the signal is not dependent on which substrate wasused; this suggests that the sputtering of a thin layer of goldcoating on top of the device does not have profound effects onthe SERS spectra. As no difference between native versussputter-coated substrates was observed, this also verifies thatthe surface features/morphology observed under the SEM(sputter coated) is also responsible for the SERS effectobserved in the native substrate. This observation is readilyexplained by the fact that the presence of the thin layer willhave changed the morphology (radii of curvature and thecloseness of the colloids) of the surface only slightly and suchsmall changes have not sufficiently affected the conditions forplasmon resonance in the metal (electromagnetic contributiongoverning the enhancement39). On a practical note, such afinding may prove to be of practical importance for futureSERS devices, in that the thin gold-sputtered coating can havethe potential to improve the robustness of such substrates, aspreviously pointed out by Maya and co-workers, who havemade SERS substrates solely using sputtered gold coating.40
As previously pointed out by Natan,41 an important step ingaining the market acceptance of SERS as an analytical tool is
to address the issue of ‘‘acceptance criteria’’ for reproducibility.One way is to state the relative standard deviation (% RSD)value as estimates for uncertainty,42 a convenient term as itrefers to the absolute value of the coefficient of variation,expressed as a percentage, and has been previously used toexpress measurement of reproducibility on SERS sub-strates.43,44 In this study, the % RSD values of spectralparameters of six replicates from a set of peaks (seven peaksfor Rhodamine 6G and eight peaks for Isoniazid) wereevaluated.
Figures 7a and 7b show the RSD of spectral characteristicsfrom the seven main peaks for Rhodamine 6G (across thespectral region of 775–1650 cm�1), for native versus sputter-coated substrates, respectively. Results show that for bothsubstrates, it is the ‘‘width’’ parameter that has a smallervariability compared to the corresponding height, suggestingthat as a parameter it is less sensitive to enhancement variations(with none of the bars on the chart exceeding the 20% RSDmark). One very interesting observation from the plots showslarge differences in the % RSD values of the different spectralpeaks, with some peak frequencies having higher % RSD thanothers. This suggests that some peaks are more prone tovariations in the enhancement contributions from the SERSeffects than others. For example, for both substrates, peak 775cm�1 has the least % RSD data in all of its spectral bandcharacteristics compared to other peaks such as the 1573 cm�1
peak. Comparing the results to Isoniazid (Figs. 8a and 8b, forSERS substrates: native versus sputter-coated, respectively),the same trend is also observed. Firstly, as before, the smallervariability in the peak width (compared to the height) is
FIG. 7. The % RSD (spectral peak width and height) amongst (six) replicateresponses of Rhodamine 6G (20 3 10�6 M) on (a) native SERS substrate, and(b) sputter-coated SERS substrate.
FIG. 8. The % RSD (spectral peak width and height) amongst (six) replicateresponses of Isoniazid (87 3 10�5 M) on (a) native SERS substrate, and (b)sputter-coated SERS substrate.
998 Volume 62, Number 9, 2008

apparent (with no bars exceeding the 15% mark). Such anobservation may be attributed to the fact that the width of thepeak is associated with values of the variables on the x-axis,which relates more to the molecular vibration information thatis responsible for the unique fingerprint of the analyte andtherefore less affected by variations affecting the (SERS)intensity scale (y-axis). Secondly, as also observed with theRhodamine case, there is an apparent variability in the % RSDamongst different peaks, with some peaks, e.g., that at 1018cm�1, showing smaller % RSD (,10%) than others, e.g., thatat 1489 cm�1 (some parameters showing % RSD of .20%).The fact that some peaks are more susceptible to irreproduc-ibility than others (in both native and sputter-coated substrates,as well as for both analytes) can only be explained byvariations in the chemical enhancement rather than in theelectromagnetic effect (if data variability is predominantly fromelectromagnetic contributions, then we can expect the varia-tions in % RSD among the different spectral peaks to becomparable). In addition, there exists no correlation betweenpeak height and the corresponding % RSD.
The chemical enhancement effect can be thought of asanalogous to the resonance Raman (RR) scattering effect.30 InRR, a ‘‘selective enhancement’’ of certain vibrational modes isexpected.45 It is not surprising, therefore, that if a chemicalenhancement contribution is dominating the variations ob-served in a dataset, then such variation will be ‘‘selective’’, inthat it will affect certain vibrational peaks in the spectrum. Ithas been recognized that the chemical enhancement mecha-nism cannot be easily controlled experimentally as there arevarious factors that will influence the magnitude of itscontribution to the SERS intensity. As the chemical enhance-ment mechanism is highly specific to the type of metal–analytecomplex formed during the chemisorption step, factors such asbonding interactions (between the adsorbed molecule andsurface metal atoms), orientation, and coverage of the adsorbedmolecules, will influence the type of charge transfer mecha-nism involved.46 Due to the extreme sensitivity of the SERSenhancement to the properties of the (local) chemical–metalcomplex species, it would seem that achieving reproduciblechemical enhancement contributions would be a big challenge.
CONCLUSION
We have shown that SERS substrates can be easilyfabricated using starting materials that are commerciallyavailable, which was intended to save time and money andminimize variations associated with ‘‘in-house’’ preparations.Their relative ease of preparation and use was shown to offersignificant advantages over colloidal SERS. The SEM imageshows that colloid deposition on the poly-l-lysine coatedsubstrate is uniform in nature, with evidence of aggregates(small and large) present on the surface. The performance ofthe fabricated SERS substrates was evaluated by recording thespectra of R6G and Isoniazid as probe molecules. In order toextract peak parameters (peak center, width, and height) from agiven spectrum, a combination of data preprocessing (remov-ing baseline followed by normalization at peak maxima) andcurve fitting was conducted. Reproducibility was assessed byconducting replicate measurements, from which estimates ofthe mean and standard deviation (of the replicates) werepresented. As a consequence of acquiring the image in SEM, athin gold coating was sputtered on the surface of the SERSsubstrates, resulting in the formation of a sputter-coated
substrate. Results however, show comparable performancebetween the sputter-coated and native substrate for thedetection of both probe analytes, i.e., the presence of a thingold coating did not affect variations in enhancementcontributions. On a practical level, the presence of this goldcoating could prove beneficial, as the platform is potentiallymore robust. Of particular interest in the study was theobservation that some peaks in a given spectrum are moreprone to data variability than others, with some peaks beingprone to .10% RSD and other peaks with RSD ,10%. Thisobservation was attributed to variations in chemical enhance-ment mechanism contributions. It was proposed that in theevent of charge transfer occurring during the chemisorptionstep, some peaks (vibrational modes) will be more susceptible(in resonance to this charge transfer) than others. It is not theintention of this paper to investigate in detail the kind ofanalyte coverage that exists on the surface. However, SERS ismainly a ‘‘short-range effect’’ and so we can assume that theobserved Raman spectrum is mainly due to the monolayer incontact with the gold surface. It will be very interesting,however, to see how the signal will vary with respect toconcentration and whether the signal would show linearity withrespect to concentration.
We have demonstrated the feasibility of this platform, whichoffers ease of fabrication. Optimization of the proceduredescribed can include variations in dipping time and colloidalconcentration, as well as different optical properties of thenanoparticles used, which will be dependent on the type, size,and shape of the nanoparticles.47 Such an optimization step isone for further study and will be incorporated into futureversions of the protocol. After such optimization, it would thenbe of interest to evaluate the inter-substrate (not just intra-substrate) reproducibility.
ACKNOWLEDGMENTS
We gratefully acknowledge the following individuals for their support andadvice: Drs. I. Gilmore, N. Harrison, L. Rogers, and D. Roy. This project hasbeen funded by Department for Innovation, Universities and Skills (DIUS), theformer Department of Trade and Industry (DTI).
1. J. W. Hu, B. Zhao, W. Q. Xu, Y. G. Fan, B. Li, and Y. Ozaki, Langmuir18, 6839 (2002).
2. G. A. Baker and D. S. Moore, Anal. Biochem. 382, 1751 (2005).3. X. L. Li, W. Q. Xu, J. H. Zhang, H. Y. Jia, B. Yang, B. Zhao, B. F. Li, and
Y. Ozaki, Langmuir 20, 1298 (2004).4. K. Kneipp and H. Kneipp, Israel J. Chem. 46, 299 (2006).5. R. G. Freeman, K. C. Grabar, K. J. Allison, R. M. Bright, J. A. Davis, A. P.
Guthrie, M. B. Hommer, M. A. Jackson, P. C. Smith, D. G. Walter, and M.J. Natan, Science (Washington, D.C.) 267, 1629 (1995).
6. Z. Pan, S. H. Morgan, A. Ueda, R. Mu, Y. Cui, M. Guo, A. Burger, and Y.Yeh, J. Raman Spectrosc. 36, 1082 (2005).
7. L. H. Lu, I. Randjelovic, R. Capek, N. Gaponik, J. H. Yang, H. J. Zhang,and A. Eychmuller, Chem. Mater. 17, 5731 (2005).
8. M. Baia, L. Baia, and S. Astilean, Chem. Phys. Lett. 404, 3 (2005).9. M. Kahl, E. Voges, S. Kostrewa, C. Viets, and W. Hill, Sens. Actuator, B
51, 285 (1998).10. A. V. Whitney, R. P. Van Duyne, and F. Casadio, J. Raman Spectrosc. 37,
993 (2006).11. C. M. Halliwell and A. E. G. Cass, Anal. Chem. 73, 2476 (2001).12. O. Seitz, M. M. Chehimi, E. Cabet-Deliry, S. Truong, N. Felidj, C.
Perruchot, S. J. Greaves, and J. F. Watts, Colloids Surf. A 218, 225 (2003).13. J. C. Cook, C. M. P. Cuypers, B. J. Kip, R. J. Meier, and E. Koglin, J.
Raman Spectrosc. 24, 609 (1993).14. L. Xu, Y. Guo, R. G. Xie, J. Q. Zhuang, W. S. Yang, and T. J. Li,
Nanotechnology 13, 725 (2002).15. R. J. C. Brown, J. Wang, R. Tantra, R. E. Yardley, and M. J. T. Milton,
Faraday Discuss. 132, 201 (2005).16. Z. Q. Tian, B. Ren, and D. Y. Wu, J. Phys. Chem. B 106, 9463 (2002).
APPLIED SPECTROSCOPY 999

17. N. P. W. Pieczonka and R. F. Aroca, Chem. Phys. Chem. 6, 2473 (2005).18. D. Pristinski, S. L. Tan, M. Erol, H. Du, and S. Sukhishvili, J. Raman
Spectrosc. 37, 762 (2006).19. A. Kudelski, Chem. Phys. Lett. 414, 271 (2005).20. T. S. Moulding, H. Q. Le, D. Rikleen, and P. Davidson, Int. J. Tuberculosis
Lung Disease 8, 743 (2004).21. A. C. Sant’Ana, P. Corio, and M. L. A. Temperini, Quim. Nova 29, 805
(2006).22. R. Tantra, J. C. Brown, and M. J. T. Milton, J. Raman Spectrosc. 38, 1469
(2007).23. C. Rodger, V. Rutherford, P. C. White, and W. E. Smith, J. Raman
Spectrosc. 29, 601 (1998).24. C. H. Munro, W. E. Smith, and P. C. White, Analyst (Cambridge, U.K.)
118, 731 (1993).25. D. Cunningham, R. E. Littleford, W. E. Smith, P. J. Lundahl, I. Khan, D.
W. McComb, D. Graham, and N. Laforest, Faraday Discuss. 132, 135(2006).
26. A. V. Mikhonin, N. S. Myshakina, S. V. Bykov, and S. A. Asher, J. Am.Chem. Soc. 127, 7712 (2005).
27. T. F. Cooney, L. Wang, S. K. Sharma, R. W. Gauldie, and A. J. Montana,J. Polym. Sci. Part B: Polym. Phys. 32, 1163 (1994).
28. Z. Q. Niu and Y. Fang, Spectrochim. Acta, Part A 66, 712 (2007).29. D. Lin-Vien, N. B. Colthup, W. G. Fateley, and J. G. Grasselli, The
Handbook of Infrared and Raman Characteristic Frequencies of OrganicMolecules (Academic Press, New York, 1991), 1st ed.
30. J. R. Lombardi, R. L. Birke, T. H. Lu, and J. Xu, J. Chem. Phys. 84, 4174(1986).
31. B. Pergolese and A. Bigotto, J. Raman Spectrosc. 33, 646 (2002).
32. A. Bigotto and B. Pergolese, J. Raman Spectrosc. 32, 953 (2001).
33. E. C. Le Ru, E. Blackie, M. Meyer, and P. G. Etchegoin, J. Phys. Chem. C111, 13794 (2007).
34. M. Moskovits, Rev. Mod. Phys. 57, 783 (1985).
35. A. Otto, Phys.: Condens. Mat. 4, 1143 (1992).
36. L. G. Olson, Y.-S. Lo, T. P. Beebe, and J. M. Harris, Anal. Chem. 73, 4268
(2001).
37. M. Leona and J. R. Lombardi, J. Raman Spectrosc. 38, 853 (2007).
38. S. Kruszewski, Cryst. Res. Technol. 41, 562 (2006).
39. I. W. Sztainbuch, J. Chem. Phys. 125, 124707 (2006).
40. L. Maya, C. E. Vallet, and Y. H. Lee, J. Vac. Sci. Technol. A 15, 238
(1997).
41. M. Natan, Faraday Discuss. 132, 321 (2006).
42. J. M. Green, Anal. Chem. 68, A305 (1996).
43. C. H. Munro, W. E. Smith, M. Garner, J. Clarkson, and P. C. White,
Langmuir 11, 3712 (1995).
44. K. Faulds, W. E. Smith, D. Graham, and R. J. Lacey, Analyst (Cambridge,
U.K.) 127, 282 (2002).
45. R. Schnepf, A. Sokolowski, J. Muller, V. Bachler, K. Wieghardt, and P. J.
Hildebrandt, J. Phys. Chem. 120, 2352 (1998).
46. R. Birke, J. Lombardi, and R. E. Gale, Spectroelectrochemistry: Theoryand Practice (Plenum Press, New York, 1988).
47. R. J. C. Brown, J. Wang, and M. J. T. Milton, J. Nanomater. 10, 3712
(2007).
1000 Volume 62, Number 9, 2008