a practical guide to introductory geology
TRANSCRIPT


A Practical Guide to Introductory Geology
SIOBHAN MCGOLDRICK
MOUNT ROYAL UNIVERSITY
CALGARY, ALBERTA

Lab Policies
Welcome GEOL 1101 students!
This is your laboratory manual for GEOL 1101 – The Dynamic Earth at Mount Royal University. We are excitedto share our passion for geology with you, and the best way to do that is through practical, hands-on learn-ing. For the Fall 2020 semester, we know this learning might not look exactly as you expected, but wepromise to do our best to create engaging and interactive lab activities for you to complete from home. Wehope this new open educational resource will help you deepen your understanding of the world around youthis semester, and for years to come! The beauty of an online resource is that you will have on-going accessto this manual, even after you complete the course.
Please review the lab policies outlined below, take the Honour Pledge on Blackboard, and complete theGoogle Earth Tutorial before labs commence the week of September 7.
Attendance
It is imperative that you complete all lab activities to succeed in this course. The only way to effectively learnthe material is to practice and ask questions during the lab. This term, as you are learning remotely, atten-dance for any synchronous activities will not be taken. Instead, there are some additional asynchronousgraded activities to help you gauge your learning throughout the term. If you fail to complete the graded labactivities due to illness or other exceptional circumstance that lasts for more than one week, please contactyour lab instructor as soon as possible and arrange to provide them with any supporting documentationrequired.
After the week has passed, it is no longer possible to make up the missed lab work. If you have not con-tacted your lab instructor to request an excused absence as outlined above then you will receive a zero forany graded work assigned that week.
xii | Lab Policies

Item Course Value
Lab quizzes (6 x 2% each) 12%
Lab tests (2 x 5% each) 10%
Take-home mapping assignment 4%
Final project 10%
Participation (review grading rubric) 4%
Total proportion of final grade in GEOL 1101 40%
Materials Required and Lab Safety at Home
You are required to print some materials from this manual, however you may choose to print the entiremanual if you wish to do so. Click here for a list of the minimum required pages to print. You will also requirea lab kit consisting of a mineral ID kit, Mineral Kits 1 and 2, and Rock Kits 1 and 2. This lab kit is supplied byMRU, and must be returned to MRU by the end of the semester. You are responsible for acquiring other labmaterials including: a pencil, an eraser, coloured pencils, tracing paper, a ruler, a protractor, and a calcula-tor. You will also need to purchase a pair of standard lab safety glasses that have wrap-around protection toprevent any dilute hydrochloric acid from splashing into your eyes. These are available from any hardwarestore, and from the MRU Bookstore.
While you are completing lab activities from home, it is your responsibility to ensure that you work safelyand to ask your lab instructor for guidance or clarification if you have a safety concern. There is a lab safetyvideo that outlines the safety guidelines for testing hardness and using dilute hydrochloric acid (HCl) avail-able on Blackboard. Watch this video and then take the mandatory Lab Safety Quiz on Blackboard beforeyou use any of the tools in your mineral ID kit.
Grading
Your work in the GEOL 1101 lab will account for 40% of your overall grade in the course, but you must passthe lab component to pass the course overall.
Tips for Success
• Complete the practice questions as you read through each background chapter. These are a great wayto prepare for your lab and also make excellent study tools!
• Complete all lab activities and record your answers to the lab exercises.• Contact your lab instructor whenever you have questions about the lab material.• Review the relevant lab material before each quiz or test.• The hands-on skills in this course, like rock and mineral identification, require practice and repetition
to learn effectively. Budget enough time to practice these skills at home.
Lab Policies | xiii

Academic Integrity
You as a student, and we as faculty have a collective commitment to upholding academic integrity at MRU.Academic integrity is guided by a shared belief in the fundamental values of honesty, trust, fairness, respectand responsibility in all academic work. To maintain academic integrity in the GEOL 1101 labs, all quizzes andtests will be closed book, and all work submitted for grading must be your own original work.
Geology is a collaborative science, so we expect you to work together during the lab. However, your workmust abide by the MRU Student Code of Conduct. Be honest and ask yourself “if I redid the lab alone, couldI do it?”. If the answer is no, then spend more time reviewing the material by yourself to ensure that you areprepared for the lab quizzes and tests that you will write independently.
Academic Misconduct
Academic misconduct consists of misrepresentation by deception or by other fraudulent means and canresult in serious consequences, e.g., the grade of zero on an assignment, loss of credit with a notation onyour transcript, and/or suspension or expulsion from the university. It is your responsibility to understandwhat constitutes academic misconduct and how to be proactive in avoiding it. For information on the vari-ous kinds of academic dishonesty please refer to the MRU Student Code of Conduct.
In this course, students who assist another to commit academic misconduct, by making their answers,quizzes, tests, or other materials available to others, will face the same consequences as those who do theactual copying. It is in your own personal interest to ensure that no one else has access to your work.
Note: Posting course materials for GEOL 1101 online is an example of a seemingly-innocuous act that is infact academic misconduct.
Plagiarism is also a form of academic misconduct. Plagiarism includes the submission of work that is notyour own or the submission of work with misleading or erroneous references. It is highly recommended thatyou consult the Avoiding Plagiarism document prepared by the MRU Library to ensure you understand howto avoid plagiarizing materials.
To uphold our shared community values and to maintain academic integrity while learning remotely, youmust take the Honour Pledge found on your lab Blackboard site before you complete the first lab quiz.
Media Attributions
• Mount Royal University logo © Mount Royal University. All rights reserved. Used with permission.
xiv | Lab Policies

GOOGLE EARTH TUTORIAL
This is a pre-lab tutorial activity to be completed independently before Lab 1.
Learning Objectives
After completing the exercises in this tutorial assignment, you should understand how to use Google Earth Pro
to:
• Examine the Earth’s surface in plan view and in three-dimensions.
• Use the compass to understand direction when navigating in Google Earth Pro.
• Use the scale bar and measure tools to determine on-the-ground distances.
• Specify locations using geographic and Universal Transverse Mercator (UTM) grid systems.
• Modify the options in Google Earth Pro to use metric or imperial units, and geographic or UTM coordi-
nates.
• Search for specific locations by place name or using geographic coordinates.
• View historical satellite imagery to examine changes to an area over time.
Google Earth Pro is an excellent tool for visualizing landscapes using satellite imagery. We will be usingGoogle Earth Pro in several lab exercises in this course to examine volcanoes, rivers, and geologic struc-tures. You will need to be familiar with how to navigate and use various features in Google Earth Pro tocomplete these exercises. To prepare for your first lab, complete the tutorial assignment in the next sec-tion before you meet for Lab 1.If you are familiar with Google Earth Pro and the use of geographic and UTM coordinate systems todescribe locations on Earth, this tutorial should take you about 25 minutes to complete. If you are notfamiliar with Google Earth Pro or the use of geographic and UTM coordinate systems, this tutorial couldtake up to 1 hour to complete. Contact your lab instructor if you have questions as you complete this tutor-ial.To get started, download Google Earth Pro (free) for desktop: https://www.google.com/earth/versions/.Although there are also web and mobile versions of Google Earth Pro available, these do not have all thefeatures you will be required to use in this course. It is recommended that you use the desktop version on acomputer.
Google Earth Tutorial | 17

Getting Started in Google Earth Pro
Once you have downloaded and installed Google Earth Pro for desktop, open the program on your com-puter.
In the search bar in the upper left part of your screen, type in “Mount Royal University”. Click Search.You are now looking at a bird’s eye view, or map view of the Mount Royal University (MRU) campus. This
is definitely a bird’s eye view: in the bottom right-hand* corner of the image it will tell you the altitude fromwhich you are looking down. In Figure T1, we are looking down at MRU from an altitude of 2.12 km!
*Note that these instructions have been written for Google Earth Pro on a PC running Windows 10. If you are using aMac computer, the description of where certain features are found may differ. Contact your lab instructor for more
information.
Text boxes like this one contain questions you need to answer, or specific actions you need to practice, in order to complete this tuto-
rial assignment.
From what altitude are you looking down on MRU?
Figure T1: Annotated Google Earth map view of Mount Royal University (MRU), highlightingwhere to find the location marker for MRU (red box), the scale bar (yellow box), and north(blue arrow and compass in upper right corner).
Let’s point out a few things you should know about Google Earth.
1. The red place marker shows the name and the exact location of the place you typed into the searchbar. (See the red box in Figure T1 below)
2. In the top right corner, the compass shows which direction is north in the current view. In Figure T1,north is toward the top of the image (in the direction of the blue arrow).
3. The bar in the bottom left corner of the image shows the scale bar (inside the orange box in Figure T1).A scale bar helps you determine the actual, on the ground, distance between points or along lines. In
18 | Getting Started in Google Earth Pro

Figure T1 below, the entire length of the scale bar represents a real distance of 230 m, and each divi-sion along the scale bar represents a real distance of 57.5 m.
Try spinning the view around by clicking on the ‘N’ on the compass, holding down your mouse, and spinning the
‘N’ around. You can also hold down the shift key and use the right and left arrow keys on your keyboard to rotate
the view.
To return to the original view press the letter ‘r’ on your keyboard, or click View, Reset, Compass.
Let’s check out a few more features in Google Earth. Look at the numbers in the bottom right corner of theimage (See red box in Figure T2).
Figure T2: Annotated Google Earth map view of MRU highlighting the location informationshown in the red box. In this example, the location of the cursor is given in latitude andlongitude coordinates. The information in this area of the screen also shows the elevation ofthe land at the location specified by the cursor, which is 1127 m above sea level in thisexample.
What happens to these numbers as you move your cursor around?
These numbers are the coordinates for the cursor location and they change as you change the position ofthe cursor. Coordinates are used to specify an exact location using a series of numbers in a grid system. Gridsystems are used to divide the Earth’s surface into imaginary squares formed by two sets of perpendicularlines. Two common grid systems used in Google Earth that we will use throughout this term are geographic(latitude and longitude), andUniversal Transverse Mercator(UTM). We will come back to the concept of gridsystems in the next part of this tutorial.
The sliding bar in the blue box in Figure T2 can be used to zoom in and out. You can also zoom in andout using the scroll wheel on your mouse or the keyboard shortcuts defined in the table below. Notice howwhen you do this, the number value on the scale bar changes. Zooming in and out changes the scale of theimage.
What happens when you zoom in dramatically? You probably jump into “Street View” (See Figure T3). To return to
Getting Started in Google Earth Pro | 19

map view, click on “Exit Street View” in the top right corner.
Figure T3: An example of street view in Google Earth. To exit Street View, click on “ExitStreet View” in the top right-hand corner of the image.
Now let’s explore how we can measure distances in Google Earth. First, make sure you are back in map view.To do this, on your keyboard press ‘r’, or click View, Reset, Tilt and Compass.
Click on the ruler icon in the toolbar located at the top of the screen. A dialogue box should pop up (see Figure
T4). Let’s use a line to measure the length of the two soccer fields at MRU. Click once to start measuring and click
again to stop. What distance did you measure? In Figure T4, the length of the line measured represents a real dis-
tance of 151.47 m.
Figure T4: Using the ruler tool to measure distances in Google Earth. The dialogue box willtell you the length of the line you are measuring. This example shows that the length of twosoccer fields at MRU is 151.47 m (see yellow line on map).
20 | Getting Started in Google Earth Pro

Figure T6: Annotated optionsmenu in Google Earthhighlighting where gridcoordinates (red box) and unitsof measurement (blue box) canbe changed.
You can also measure the length of a path, rather than just a straight line. Figure T5 shows a measured pathalong the ring road around MRU. The total length of the path is 1.55 km. Notice that you can change the unitof measurement by using the drop down menu. Click clear to erase the line or path you measured.
Figure T5: Using the ruler tool to measure the length of a path, rather than a simple straightline. The length of a path drawn around the ring road of MRU is 1.55 km (see yellow path onimage).
Let’s try changing some options in Google Earth Pro. Click on Tools, Options. The
dialogue box shown in Figure T6 should appear. Examine the 3D View tab, where you
can choose between using UTM coordinates or Lat/Long coordinates (Figure T6, red
box). Choose to display lat/long coordinates in one of three ways: decimal degrees,
degrees-minutes-seconds, or degrees-decimal minutes. You can also change the
default units of measurement (Figure T6, blue box) from imperial (feet, miles) to metric
(metres, kilometres). When you are happy with your selections, click Apply.
Finally, let’s examine some historical satellite imagery. Google Earth is a greattool for examining changes to Earth’s surface over the past few decades. Byclicking on the clock icon in the top toolbar (Figure T7, red arrow), you can seehistorical imagery for the area on your screen. Use the scroll bar to look throughthe historical imagery of the city of Calgary from an altitude of ~70 -80 km.
Getting Started in Google Earth Pro | 21

Figure T7: Annotated historical Google Earth imagery of Calgary and surrounding areas from1984.
What distance is represented by the entire length of the scale bar?
In what year was the oldest image of this area at this scale captured?
In what year was the most recent image of this area at this scale captured?
22 | Getting Started in Google Earth Pro

Keyboard Shortcuts for Google Earth Pro
Action Shortcut (Windows & Linux) Shortcut (Mac)
Move left Left arrow Left arrow
Move right Right arrow Right arrow
Move up Up arrow Up arrow
Move down Down arrow Down arrow
Rotate clockwise Shift + Left arrow Shift + Left arrow
Rotate counter-clockwise Shift + Right arrow Shift + Right arrow
Tilt up Shift then click and drag down Shift + Down arrow
Tilt downShift + Up arrow
Shift then click and drag upShift + Up arrow
Reset to north-up view n n
Reset to top-down tilt u u
Return to plan and north-up view r r
Zoom in + +
Zoom out – –
Stop current motion Spacebar Spacebar
Media Attributions
• Figures T1, T2, T3, T4, T5, T6, T7 used under the following Google Maps and Google Earth guidelines.
Getting Started in Google Earth Pro | 23

Grid Systems and Coordinates
What is a grid system?
A grid is a regular pattern made of squares formed by two sets of lines that intersect at right angles. Gridsystems are used to precisely identify locations on a map. The two types of grid systems we will cover in thiscourse are:
• Geographic, where locations are specified using degrees and minutes of latitude and longitude.• Universal Transverse Mercator (UTM), where locations are specified in metres using an easting and
northing.
Depending on your settings in Google Earth Pro, you might be using the geographic grid system (latitudeand longitude) OR the Universal Transverse Mercator grid system (UTM). If you are not sure which grid sys-tem you are using, return to the Options menu to check.
Latitude and longitude
The geographic grid system is made up of meridians of longitude and parallels of latitude. Figures T8 andT9 illustrate the geographic grid system in Canada.
Figure T8: The geographic grid system is comprised of meridians of longitude and parallels oflatitude. Meridians of longitude run north-south whereas parallels of latitude run east-west.
24 | Grid Systems and Coordinates

Figure T9: Geographic grid system displayed over southern Alberta.
Coordinates that describe an exact location on the surface of Earth are represented in degrees, minutes andseconds of latitude and longitude. Depending on the accuracy required in locating a point on a map, degrees(°) may be subdivided into 60 subdivisions known as minutes (‘) and minutes may be subdivided into 60 sub-divisions known as seconds (“). The line of 0° longitude is the prime meridian located in Greenwich, Eng-land, and longitude increases from 0° to 180° as you move east or west away from the prime meridian. Theline of 0° latitude is the equator, and latitude increases from 0° to 90° as you move north or south towardsthe poles.
When using the geographic grid system, one must specify whether coordinates are north (N) or south (S)of the equator, and east (E) or west (W) of the prime meridian. For anywhere in Canada, latitude will alwaysbe north of the equator and longitude will always be west of the prime meridian, e.g., 51°02’39” N 114°03’47”W. Notice that latitude is listed first, followed by longitude. Together, these coordinates describe an exactlocation.
Try typing these coordinates into the search bar in Google Earth. What geographic feature is located at 51°02’39”
N 114°03’47” W? See Appendix 2 for Google Earth Tutorial answers.
Universal Transverse Mercator (UTM)
In this grid system designed by the military, Earth’s surface is divided into 60 north-south zones designatedby a number and letter, each covering 6° of longitude in width (Figure T10). Inside each zone, coordinatesare measured in metres north and east. The city of Calgary is actually divided into two UTM zones: zone 11U and zone 12 U (Figure T11).
Grid Systems and Coordinates | 25

Figure T10: Universal Transverse Mercator (UTM) zones in Canada. Zones are designated bya number and a letter, e.g., the city of Vancouver, BC is in UTM zone 10 U.
Figure T11: Universal Transverse Mercator (UTM) zones 11 U and 12 U in Alberta.
A UTM coordinate always begins with the zone, which in the case for most of Calgary is 11 U. The easting isalways given first, followed by the northing. For example, 11 U 705863 m E 5658841 m N are the approximatecoordinates for the Calgary Tower.
In Figure T12, a point is located using UTM coordinates 11 U 708400 m E 5659200 m N, meaning that thelocation is known to within a 100 m by 100 m square. If you were using GPS to pin-point your location, youmight be able to record UTM coordinates to within a 1 m by 1 m square, and your coordinates might looksomething like: 11 U 708411 m E 5659284 m N. Note that the UTM system is a true metric measuring system,and that it is the easiest to use accurately.
26 | Grid Systems and Coordinates
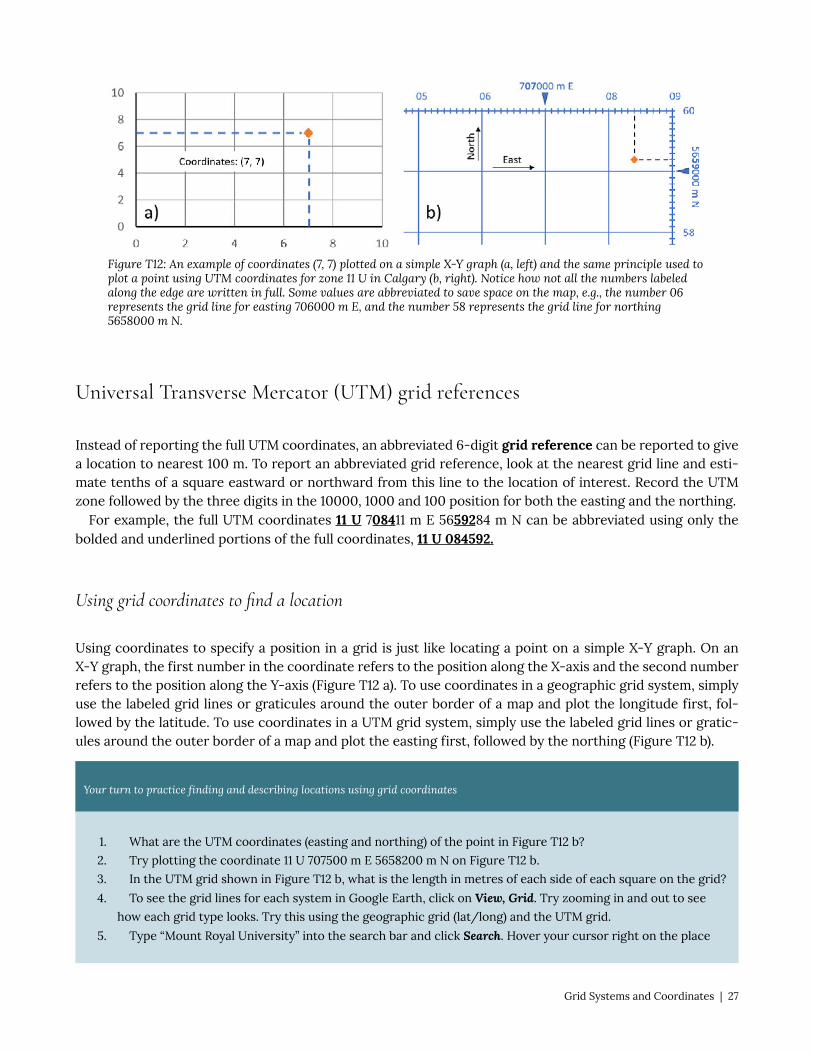
Figure T12: An example of coordinates (7, 7) plotted on a simple X-Y graph (a, left) and the same principle used toplot a point using UTM coordinates for zone 11 U in Calgary (b, right). Notice how not all the numbers labeledalong the edge are written in full. Some values are abbreviated to save space on the map, e.g., the number 06represents the grid line for easting 706000 m E, and the number 58 represents the grid line for northing5658000 m N.
Universal Transverse Mercator (UTM) grid references
Instead of reporting the full UTM coordinates, an abbreviated 6-digit grid reference can be reported to givea location to nearest 100 m. To report an abbreviated grid reference, look at the nearest grid line and esti-mate tenths of a square eastward or northward from this line to the location of interest. Record the UTMzone followed by the three digits in the 10000, 1000 and 100 position for both the easting and the northing.
For example, the full UTM coordinates 11 U 708411 m E 5659284 m N can be abbreviated using only thebolded and underlined portions of the full coordinates, 11 U 084592.
Using grid coordinates to find a location
Using coordinates to specify a position in a grid is just like locating a point on a simple X-Y graph. On anX-Y graph, the first number in the coordinate refers to the position along the X-axis and the second numberrefers to the position along the Y-axis (Figure T12 a). To use coordinates in a geographic grid system, simplyuse the labeled grid lines or graticules around the outer border of a map and plot the longitude first, fol-lowed by the latitude. To use coordinates in a UTM grid system, simply use the labeled grid lines or gratic-ules around the outer border of a map and plot the easting first, followed by the northing (Figure T12 b).
Your turn to practice finding and describing locations using grid coordinates
1. What are the UTM coordinates (easting and northing) of the point in Figure T12 b?
2. Try plotting the coordinate 11 U 707500 m E 5658200 m N on Figure T12 b.
3. In the UTM grid shown in Figure T12 b, what is the length in metres of each side of each square on the grid?
4. To see the grid lines for each system in Google Earth, click on View, Grid. Try zooming in and out to see
how each grid type looks. Try this using the geographic grid (lat/long) and the UTM grid.
5. Type “Mount Royal University” into the search bar and click Search. Hover your cursor right on the place
Grid Systems and Coordinates | 27

marker. What are the coordinates for MRU in lat/long? Remember, you must specify that MRU is north of the
equator and west of the prime meridian!
6. What are the coordinates for MRU in UTM coordinates? Remember, you must specify the zone number!
7. What are the coordinates for MRU in UTM as a grid reference? Remember, you must specify the zone num-
ber!
See Appendix 2 for Google Earth Tutorial answers.
Media Attributions
• Figures T8, T9, T10, T11 used under the following Google Maps and Google Earth guidelines.• Figure T12: © Siobhan McGoldrick. CC BY.
28 | Grid Systems and Coordinates

LAB 1: PLATE TECTONICS
Lab Structure
Synchronous lab work Yes – meet as a class at the start of your scheduled labtime
Asynchronous lab work Yes
Lab group meeting Yes – meet after you have completed Lab 1
Quiz Yes – on Blackboard
Recommended additional work Yes – complete Google Earth Tutorial before Lab 1
Required materials Pencil, pencil crayons, ruler, printed Plate BoundariesMap
Learning Objectives
After carefully reading this section, completing the exercises within it, and answering the questions at the end,
you should be able to:
• Explain the difference between oceanic and continental crust.
• Describe the motion of plates at divergent, convergent, and transform boundaries.
• Characterize divergent, convergent, and transform plate boundaries by their associated geological features
and processes.
• Describe how mantle plumes and resulting hot spot volcanoes can be used to determine the direction of
plate motion.
• Understand the historical contributions of geoscientists who proposed the theory of plate tectonics.
Key Terms
• Lithosphere• Continental crust• Oceanic crust• Mantle• Asthenosphere
• Tectonic plate• Divergent• Convergent• Transform• Seismology
• Volcanology• Bathymetry• Topography• Geochronology• Mantle plume• Hot spot
Lab 1: Plate Tectonics | 29

Lab 1 Exercises
Activity: Plate Boundary Characteristics
In this activity you will learn to identify types of plate boundaries based on the characteristics they exhibit.This activity is based on the “Discovering Plate Boundaries” activity by Dale S. Sawyer at Rice University andmodified based on teaching experiences at the SEOS department of the University of Victoria, Canada.
In groups, we will examine five types of plate boundaries today:
◦ Ocean-Ocean Divergent (the boundary between two plates where oceanic crust is being pullledapart)
◦ Ocean-Ocean Convergent (where two plates of oceanic crust are moving toward one anotherleading to the subduction of one plate)
◦ Ocean-Continent Convergent (where oceanic and continental crust are moving toward oneanother leading to the subduction of the oceanic crust)
◦ Continent-Continent Convergent (where two plates of continental crust are moving toward oneanother)
◦ Ocean-Ocean Transform (where oceanic crust is moving horizontally in opposite directionsacross a transform fault)
To start, download or view the plate boundaries map. Seven plate boundaries are highlighted and numberedon your map. You will also be assigned a map displaying one of four data sets: volcanoes, earthquakes, topog-raphy/bathymetry, and seafloor age.
You will each, individually, study your data set and attempt to draw conclusions about what geologicalfeatures and processes characterize each of the numbered plate boundaries.
Later in lab today, you will be joining a live video conference in small groups to share your observationswith your group mates. You will be asked to summarize your observations so write down your conclusionsand be prepared to teach your peers!
Step 1
Examine your assigned map. Start by locating all the numbered plate boundaries on your assigned map. Arethey easy or difficult to find? Looking closely at your data type, start making notes about the spatial distri-bution of the data points. Exactly what you look for will vary with data type. For the point data (volcanoesand earthquakes) you are looking for distribution patterns. For surface data (topography and seafloor age)you are looking for where the surface is high and where it is low, where it is old and where it is young. Inthis activity you are focusing on observations, not interpretations, meaning that you do not need to worryabout why there is or is not a pattern, you just need to observe and record what you see. You are analyzingthe data, not interpreting it!
42 | Lab 1 Exercises

Step 2
Now focus your attention on the numbered plate boundaries on the plate boundaries map. Identify thenature of your data near each of the numbered plate boundaries. Is it high or low, symmetric or asymmetric,missing or not missing, varying along the boundary or constant along the boundary, etc. Complete Table1.1 below to classify the plate boundaries based on your observations of your assigned data, using the tipsbelow for guidance. Right now, you will only fill in the column for your assigned data set. Remember: do nottry to explain the data; just observe!
Below are some suggestions for the kinds of observations that are useful for each data set. Compare yourboundary to the types of boundaries on the map as you do this. Remember, the goal is to find unique char-acteristics for each boundary type.
Volcanoes: Observe and make notes on the distribution patterns. Are the volcanoes near a given boundaryrandomly distributed, tightly clustered, or do they define a linear trend?
Earthquakes: Observe and make notes on the distribution patterns and depth of the earthquakes. Noteboth the range of depths (extremes) and the more typical or average. For example, a given boundary mighthave all shallow earthquakes (0- 33 km) with rare deeper earthquakes between 33 -70 km depth. Earth-quakes might be randomly distributed, tightly clustered, or may define a linear trend.
Topography/bathymetry: Look for any topographic features that seem to be related to the boundary,such as nearby mountain chains, deep sea trenches, broad gradual highs or lows, offset (broken and shifted)features, etc. Briefly describe how extreme they are (e.g., a very high or wide mountain chain). Make surethat you understand how the colour scale on the map represents elevations above sea level. For example,your should recognize that bright fuchsia colours correspond to large negative values and represent thedeepest parts of ocean where the seafloor is far beneath sea level.
Seafloor age: This data set can be tricky; be careful not to see patterns where there are none! For example,you might observe that in some places, the seafloor age changes from place to place along the boundary. Inthis case there is no clear pattern and this indicates no relationship between seafloor age and the bound-ary, but this is still a good observation! Alternately, the seafloor age may be the same everywhere along theboundary, or it may change in a consistent pattern. Do your best to describe what you see, and whether ornot your observations fit a clear, consistent pattern.
Lab 1 Exercises | 43

Tabl
e 1.1
: Sum
mar
ize
the
key
feat
ures
from
eac
h da
ta s
et t
hat
char
acte
rize
eac
h ty
pe o
f pla
te b
ound
ary
in t
his
tabl
e.
Bou
ndar
y T
ype
Volc
anis
mEa
rthq
uake
Act
ivit
yB
athy
met
ry/
Topo
grap
hySe
aflo
or A
ge
Oce
an-O
cean
Con
verg
ent
(#1
and
#2)
Oce
an-O
cean
Tra
nsfo
rm
(#3)
Oce
an-O
cean
Div
erge
nt
(#4
and
#6)
Oce
an-C
onti
nent
Con
verg
ent
(#5)
Con
tine
nt-C
onti
nent
Con
verg
ent
(#7)

Step 3
Everyone has been randomly assigned to a group and provided with a link to a video meeting to discuss yourobservations in real time in groups of four. Each group has at least one representative of each data set. Con-sider yourselves a group of experts gathering to compare observations. In your group, introduce yourselfand what type of data you have been analyzing. Taking turns, each group member will share their observa-tions about their assigned data set from Step 2. It is helpful to share your screen while you teach, so thatyour group members can see your data. If you are not sure how to share your screen, ask your instructor.Your instructor will periodically join each group video meeting group to check in while you complete thispart of the activity.
Work together in your group to complete Table 1.1 by summarizing your observations on the character-istics of each type of plate boundary. By the end of this activity, each member of your group should have acompleted Table 1.1. Each group member should be able to describe the characteristics of each type of plateboundary using all four data types.
Activity: Hot Spot Volcanoes and Plate Motion
In this activity you will use data from chains of hot spot volcanoes in Google Earth Pro to make a rough esti-mate of the rate of motion of the Pacific Plate, and to determine the direction of plate motion for severaldifferent tectonic plates. This activity and the Google Earth data provided are based on the “DeterminingPlate Rates From Hot Spot Tracks Using Google Earth” activity developed by Susan Schwartz and Erin Toddat the University of California-Santa Cruz.
Step 1
Download the Hawaii-Emperor.kmz file to use in Google Earth Pro. Load the file into Google Earth Pro bydouble-clicking on the file, or in Google Earth Pro by clicking on File, Open and navigating to where yousaved the .kmz file.
Step 2
Once the Hawaii-Emperor.kmz is loaded, click and drag to move it from “Temporary Places” to “My Places.”Then save “My Places” by clicking File, Save, Save My Places. This .kmz file will now be available every timeyou open Google Earth Pro on this computer. **NOTE: When you close the program, Google Earth Proshould save everything in “My Places”, but to be safe you should manually save “My Places” to your computerwhenever you make significant changes to it.
Lab 1 Exercises | 45

Step 3
Examine the data in the Hawaii-Emperor.kmz file to answer the questions below. Each place marker indi-cates a location where a volcanic rock was sampled and dated. This type of dating uses radioactive elementsin the rock to give geologists a precise age of when the lava cooled and solidified to form a volcanic rock.The number next to each place marker is the age of the rock in millions of years (Ma). The current locationof the hot spot at Kilauea Volcano in southeast Hawai’i is shown by the marker labeled 0 Ma.
Hot Spot Volcanoes and Plate Motion Exercise Questions
1. Using what you learned in the Google Earth Tutorial, list the lat/long coordinates of Kilauea Volcano,Diakakuji Seamount (located at the bend in the Hawaii-Emperor chain), and Midway Island.
2. Using what you learned in the Google Earth Tutorial, list the UTM coordinates of Mauna Kea (located nearthe centre of the island of Hawai’i), the 75.82 Ma volcano near Detroit Seamount (located near the northernend of the Hawaii-Emperor chain), and the 5.77 Ma volcano on Kaua’i. Remember to include the zone at thebeginning of the coordinate!
3. Using the ruler tool in Google Earth Pro, found in the top toolbar, measure the distance between the pre-sent location of the hot spot at Kilauea Volcano and Midway Island in kilometers (km). Measure the distanceas a line from the point of each pin and round to the nearest whole km.
4. Make a rough estimate of the average rate of motion for the Pacific Plate in kilometres per million years.To do this, divide the distance between two volcanoes along the chain by their difference in ages (shown inmillions of years, Ma). The rate is calculated as the distance over time. Round to the nearest tenth.
5. Most plate rates reported in scientific literature are measured in cm/yr. Convert your estimated rate tocm/yr. Again, round your result to the nearest tenth. Remember this calculation is a rough estimate!
46 | Lab 1 Exercises

6. Examine the entire length of the Hawaii-Emperor chain. What do you think might have caused this chainto form such a distinctive “elbow-like” shape?
Download the HotspotVolcanism.kmz file and load it into Google Earth Pro. Remember to save it in “MyPlaces” once it is loaded into Google Earth Pro! Notice that this file includes the locations of boundariesbetween tectonic plates as well as place markers and ages for volcanoes along several hot spot chains (ortracks) around the world.
7. Based on the hot spot tracks shown in the HotspotVolcanism.kmz file and the ages of the volcanoes,determine the direction of plate motion for the African, Australian, Nazca, North American, and Pacificplates. Match the plate name to the arrow that most closely illustrates the vector (direction) of motion.
8. Predict whether the plate boundary between the following pairs of plates is convergent or divergentbased on the plate motion determined from the hot spot tracks:
a) Pacific & Nazca Platesb) South American & African PlatesSee Appendix 3 for answers to lab exercises.
Media Attributions
• Maps of plate boundaries, topography/bathymetry, seismology, volcanology, seafloor age by Dale S.Sawyer, Discovering Plate Boundaries activity. All rights reserved. Used with permission.
• Google Earth kmz file by Susan Schwartz and Erin Todd, CC-BY-NC-SA 3.0• Determining Plate Rates From Hot Spot Tracks Using Google Earth activity Title, by Siobhan
McGoldrick, CC-BY-NC-SA 4.0. Derivative of Student Handout for Plate Rate Assignment by SusanSchwartz and Erin Todd, Determining Plate Rates From Hot Spot Tracks Using Google Earth activ-ity, CC-BY-NC-SA 3.0
• Arrow figure, adapted by Siobhan McGoldrick, CC-BY-NC-SA 4.0. Derivative of figure by SusanSchwartz and Erin Todd, Determining Plate Rates From Hot Spot Tracks Using Google Earth activ-ity, CC-BY-NC-SA 3.0
Lab 1 Exercises | 47

LAB 2: MINERAL PROPERTIES ANDNON-SILICATE MINERALS
Lab Structure
Synchronous lab work Yes – virtual office hours available
Asynchronous lab work Yes
Lab group meeting No
Quiz Yes – on Blackboard
Recommended additional work Yes – review concepts from Labs 1 and 2 in preparationfor Test 1
Required materials Mineral ID kit, Mineral Kits 1 and 2, pencil
Learning Objectives
After reading this chapter, completing the exercises within it, and answering the questions at the end, you should
be able to:
• Describe mineral lattices and explain how they influence mineral properties.
• Categorize minerals into groups based on their compositions.
• Describe some of the important techniques for identifying minerals.
• Identify and describe the physical properties of a range of non-silicate minerals in hand sample.
• Discuss the economic uses of non-silicate minerals.
Key Terms
• Cation• Anion• Silicate• Non-silicate• Native element• Sulphide• Oxide• Hydroxide• Sulphate• Carbonate• Halide
• Phosphate• Colour• Streak• Lustre• Hardness• Crystal habit• Cleavage• Fracture• Conchoidal fracture• Specific gravity
Minerals are all around us: the graphite in your pencil, the salt on your table, the plaster on your walls, and
Lab 2: Mineral Properties and Non-Silicate Minerals | 49

the trace amounts of gold in your computer. Minerals can be found in a wide variety of consumer productsincluding paper, medicine, processed foods, cosmetics, electronic devices, and many more. And of course,everything made of metal is also derived from minerals.
As defined in the introductory chapter, a mineral is a naturally occurring combination of specific elementsarranged in a particular repeating three-dimensional structure (Figure I4).
“Naturally occurring” implies that minerals are not artificially made. Many minerals (e.g., diamond) canbe made in laboratories, but if they can also occur naturally, they still qualify as minerals. “Specific elements”means that most minerals have a specific chemical formula or composition. The mineral pyrite, for example,is FeS2 (two atoms of sulfur for each atom of iron), and any significant departure from that would make ita different mineral. But many minerals can have variable compositions within a specific range. The mineralolivine, for example, can range all the way from Fe2SiO4 to FeMgSiO4 to Mg2SiO4. Intervening compositionsare written as (Fe,Mg)2SiO4 meaning that Fe and Mg can be present in any proportion, and that there aretwo of them for each Si present. This type of substitution is known as solid solution.
Most important of all, a mineral has a specific “repeating three-dimensional structure” or “lattice,” whichis the way in which the atoms are arranged. We’ve already seen in Figure I4 of the introductory chapter howsodium and chlorine atoms in halite alternate in a regular pattern. Halite happens to have the simplest min-eral lattice, most other minerals have more complex lattices. Some substances that we think must be miner-als are not because they lack that repeating 3-dimensional structure of atoms. Volcanic glass is an example,as is pearl or opal.
50 | Lab 2: Mineral Properties and Non-Silicate Minerals

Lab 2 Exercises
The exercises below will guide you through the mineral samples in Mineral Kits 1 and 2. Review the physicalproperties of minerals presented in Chapter 2.3 before you begin these exercises. You may wish to consultthe mineral identification tables at the back of this manual as you complete the exercises below.
Part I: Cleavage and Fracture
The minerals in this part include a mix of silicate and non-silicate minerals found in Mineral Kits 1 and 2.1. Do the following samples exhibit cleavage or fracture? If the sample exhibits cleavage, specify the num-
ber of cleavage planes and approximate angle between them.
Sample M226S M225S M1S M251S M111S M223S M131S
Cleavage orfracture
2. What is the difference between a crystal face and a cleavage plane?
3. Look at sample M202(S). This is a good example of a mineral with 2 cleavages at almost right angles toeach other. Select two other samples that also demonstrate this type of cleavage.
4. Now select a sample which also appears to have a least two cleavages but with the cleavage surfacesoblique (at some angle other than 90°) to each other.
5. Which sample has one (perfect) cleavage only?
6. Look at the fractured surface of sample M225. Try to describe this surface (rough? curved? splintery? etc.).This is an example of conchoidal fracture. Does this sample exhibit any cleavage?
70 | Lab 2 Exercises

7. What other sample also exhibits conchoidal fracture?
Part II: Non-silicate Minerals
Certain physical properties are diagnostic for a particular mineral. These diagnostic properties will helpyou distinguish a particular mineral. The questions below will help you identify these diagnostic properties.Remember: you must be able to identify all the physical properties of each mineral, not just the diagnosticproperties. You should also know the group to which each mineral belongs (e.g., sulphides, oxides).
Mineral Group: Native Elements
Sample M21 Mineral name:
1. Does this mineral exhibit cleavage? If yes, describe the cleavage:2. What is the approximate hardness of the sample on the Mohs scale of hardness?3. What is the specific gravity of the sample (high, medium or low)?
4. Describe the lustre of this mineral:5. Describe the streak:6. What is a diagnostic property of graphite?
Mineral Group: Oxides
Sample M11/M12 Mineral name:
Sample M51/M52 Mineral name:
Sample M53 Mineral name:
1. Do any of these samples exhibit cleavage?2. If yes, which one? Describe the cleavage:3. Looking at samples M51/52 and M53, what is the lustre of each sample?
Sample M51/M52 Lustre:
Sample M53 Lustre:
Lab 2 Exercises | 71

4. Compare the streak of each sample. Describe what you see:
5. Do any of the samples attract a magnet? Which one?6. What is the diagnostic property of magnetite?
7. What is the diagnostic property of hematite?
Mineral Group: Carbonates
Sample M251 Mineral name:
1. Does this mineral exhibit cleavage? If so, describe the cleavage:2. What is the approximate hardness of the sample on the Mohs scale of hardness?3. Describe the lustre of this mineral.
4. Does the sample react to a drop of HCl?5. What is a diagnostic property of calcite?
Mineral Group: Sulphides
Sample M41/M42 Mineral name:
Sample M31 Mineral name:
Sample M1 Mineral name:
Sample M141 Mineral name:
1. What do all these minerals have in common?
2. Test all four minerals for hardness. Do any of these minerals scratch the glass plate?
72 | Lab 2 Exercises

3. Which is harder pyrite or chalcopyrite?4. Describe the streak of sphalerite:
5. What is the lustre of pyrite, chalcopyrite and galena?6. What is the lustre of sphalerite?7. Which mineral has the highest specific gravity?8. Do you see cleavage faces on any of these minerals?9. How can you tell pyrite from chalcopyrite?
10. What is a diagnostic property of galena?
11. What is a diagnostic property of sphalerite?
12. Many sulphide minerals contain valuable ore metals that are used to manufacture the objects and tech-nology you use every day. Using Appendix 4 as a guide, complete the table below.
Sample # Mineral Name Mineral Formula Ore Metal
M1
M31
M141
13. Name two economic uses for the mineral galena.
14. Explain the steps involved in extracting galena from an ore deposit and eventually producing pure leadmetal.
Mineral Group: Sulphates
Sample M241 Mineral name:
Lab 2 Exercises | 73

1. What is the approximate hardness of this mineral?2. Describe the lustre of this mineral:
3. What is the diagnostic property of gypsum?
4. What is the main economic use for gypsum and where is the world’s most productive gypsum miningarea?
Mineral Group: Halides
Sample M231 Mineral name:
Sample M261 Mineral name:
Sample M262 Mineral name:
1. Describe the cleavage of each sample.
Sample M231 Cleavage:
Sample M261 Cleavage:
Sample M262 Cleavage:
2. What is the approximate hardness of the two minerals on the Mohs scale of hardness?
Halite: Fluorite:
3. Compare the specific gravity of the two minerals. Which is higher?4. What is a diagnostic property of halite?
5. What is a diagnostic property of fluorite?
6. How can you distinguish fluorite from quartz? Quartz is a silicate mineral that will be studied in Lab 3.
74 | Lab 2 Exercises

LAB 3: SILICATE MINERALS
Lab Structure
Synchronous lab work Yes – virtual office hours available
Asynchronous lab work Yes
Lab group meeting Yes – meet after you have completed Lab 3
Quiz Yes – on Blackboard
Recommended additional work Yes – review concepts from Labs 1, 2 and 3 in preparationfor Test 1
Required materials Mineral ID kit, Mineral Kits 1 and 2, pencil
Learning Objectives
After carefully reading this section, completing the exercises within it, and answering the questions at the end,
you should be able to:
• Describe a silica tetrahedron and the ways in which tetrahedra combine to make silicate minerals.
• Differentiate between ferromagnesian and other silicate minerals.
• Identify and describe the physical properties of a range of silicate minerals in hand sample, and how these
properties are used to identify minerals.
Key Terms
• Isolated silicate• Single chain silicate• Double chain silicate• Phyllosilicate (sheet silicate)• Framework silicate• Colour• Streak
• Lustre• Hardness• Crystal habit• Cleavage• Fracture• Conchoidal fracture• Specific gravity
76 | Lab 3: Silicate Minerals

Lab 3 Exercises
The exercises below will guide you through the silicate mineral samples in Mineral Kits 1 and 2. Reviewthe physical properties of minerals presented in Chapter 2.3 before you begin these exercises. You maywish to consult the mineral identification tables at the back of this manual as you complete the exercisesbelow. Note that all silicate minerals have non-metallic lustre. As you are observing the following sampleskeep in mind you have to classify the lustre using more descriptive terms such as vitreous, earthy or dull,pearly, satiny, etc. Remember: you must be able to identify all the physical properties of each mineral, notjust the diagnostic properties.
Silicate Mineral Group: Framework Silicates
1. Examine samples M221, M223, and M225. All of these samples are varieties of the same mineral. Name themineral:2. Describe the cleavage or fracture exhibited in these samples:3. How can you distinguish between a cleavage plane and a crystal face?
4. Test all four minerals for hardness. What is the hardness of quartz?5. Describe the lustre of the samples.6. What is a diagnostic property of quartz?
7. Sample M225 is flint, an example of microcrystalline quartz that is always grey to black in colour. Do thediagnostic properties for quartz apply to flint as well?
Feldspars
Sample M201 Mineral name:
Sample M202 Mineral name:
Sample M211 Mineral name:
You have a pink/salmon coloured sample and a white sample of potassium feldspar (K-feldspar). A pinkfeldspar will always be K-feldspar, and may show exsolution lamellae. A white feldspar may be K-feldspar orplagioclase feldspar (albite). If you have a white K-feldspar and a white plagioclase feldspar look for stria-
Lab 3 Exercises | 85

tions on the plagioclase feldspar and that will differentiate them. The dark plagioclase feldspar (labradorite)will exhibit striations and has diagnostic iridescence.
1. Examine all your K-feldspar and plagioclase feldspars. These minerals are all feldspars however, we willrefer to them by their mineral names and classify them as framework silicates. Test each sample for hard-ness:
Sample M201 Hardness:
Sample M202 Hardness:
Sample M211 Hardness:
2. Describe the cleavage exhibited by these samples:3. Looking at M201 and M211, do either of these samples exhibit striations? Do either of the samples exhibitiridescence?
4. How can you distinguish between K-feldspar and plagioclase feldspar?
Silicate Mineral Group: Sheet Silicates (phyllosilicates)
Sample M121 Mineral name:
Sample M271 Mineral name:
1. Describe the cleavage of these two minerals:2. What is the hardness of these two minerals?3. What is a diagnostic property of mica minerals?4. How can you distinguish between muscovite and biotite?
Sample M281 Mineral name:
5. What is the hardness of the sample?6. Describe the lustre of this mineral:7. What is a diagnostic property of talc?
Sample M291 Mineral name:
86 | Lab 3 Exercises

8. Describe the lustre of this mineral:9. What is a diagnostic property of kaolinite?
Silicate Mineral Group: Single Chain Silicates
Single chain silicates include the pyroxene family of minerals. There is one pyroxene (augite) in the mineralkit and the samples vary in colour.
Sample M101 Mineral name:
1. Describe the cleavage of the pyroxene:2. What is the colour of this mineral?3. What is a diagnostic property of pyroxene?
Silicate Mineral Group: Double Chain Silicates
Double chain silicates include the amphibole family of minerals. There is one amphibole (hornblende) in themineral kit and the samples vary in colour.
Sample M111 Mineral name:
1. Describe the cleavage of hornblende:2. What is the colour of this mineral?3. What is a diagnostic property of hornblende?
Silicate Mineral Group: Isolated Silicates
Sample M131 Mineral name:
The garnet family also contains various kinds of garnet. The most common is almandine, a dark ruby redcoloured garnet.
1. Do you see any crystal faces on your sample?2. What is the hardness of the sample?3. What is the lustre of garnet?4. What is a diagnostic property of garnet?
Lab 3 Exercises | 87

Sample M301 Mineral name:
Olivine is an igneous mineral that is green, one of the few minerals that can be identified by colour. Thesamples of olivine in your kit are actually samples of an ultramafic igneous rock composed of many smallcrystals of olivine.
5. What is the hardness of olivine?6. Describe the feel of the sample:7. What is a diagnostic property of olivine?
88 | Lab 3 Exercises

LAB 4: IGNEOUS ROCKS
Lab Structure
Synchronous lab work Yes – virtual office hours available
Asynchronous lab work Yes
Lab group meeting No
Quiz None – Test 1 this week
Recommended additional work None
Required materials Mineral ID kit, Rock Kits 1 and 2, pencil
Learning Objectives
After carefully reading this chapter, completing the exercises within it, and answering the questions at the end,
you should be able to:
• Describe, in general terms, the range of chemical compositions of magmas.
• Discuss the processes that take place during the cooling and crystallization of magma, and the typical order
of mineral crystallization according to the Bowen reaction series.
• Describe the origins of phaneritic, porphyritic, and vesicular rock textures.
• Apply the criteria for igneous rock classification based on mineral proportions.
• Use observations of mineralogy and texture to correctly identify and name an igneous rock.
Key Terms
• Magma• Lava• Partial melting• Crystallization• Intrusive• Extrusive• Felsic• Intermediate• Mafic
• Ultramafic• Phaneritic• Aphanitic• Porphyritic• Vesicular• Glassy• Phenocrysts• Groundmass
A rock is a consolidated mixture of minerals. By consolidated, we mean hard and strong; real rocks don’t fallapart in your hands! A mixture of minerals implies the presence of more than one mineral grain, but not nec-essarily more than one type of mineral. A rock can be composed of only one type of mineral (e.g., limestoneis commonly made up of only calcite), but most rocks are composed of several different minerals. A rock can
90 | Lab 4: Igneous Rocks

also include non-minerals, such as fossils or the organic matter within a coal bed or in some types of mud-stone.
Rocks are grouped into three main categories based on how they form:
1. Igneous: formed from the cooling and crystallization of magma (molten rock)2. Sedimentary: formed when weathered fragments of other rocks are buried, compressed, and
cemented together, or when minerals precipitate directly from solution3. Metamorphic: formed by alteration (due to heat, pressure, and/or chemical action) of a pre-existing
igneous or sedimentary rock
For the next few weeks you will learn about each of these categories of rock in the lab, beginning withigneous rocks in Lab 4. You will practice identifying minerals and textures, and you will use your observa-tions to classify samples of rocks. Finally, by Lab 6, you will use the processes of the rock cycle to link allthree categories of rocks together.
Lab 4: Igneous Rocks | 91

Figure A: (left) crystalline texture produced bya mosaic of interlocking crystals, and (right)clastic texture composed of individual grainsbonded by a chemical cement. Grains mayconsist of a single mineral, or fragments frompre-existing rocks.
Lab 4 Exercises
Classifying Rocks
All rocks are classified by just two characteristics: texture andmineralogy. The 20 or so minerals which form most rocks arealready very familiar to you, the remaining 6000 are not verycommon and not significant in rock classification, and you canmanage in this course without being able to identify them.
The two main textural terms you will use as you examine rocksin labs 4, 5 and 6 are:Crystalline: consisting of a network of interlocking crystals.Igneous, sedimentary and metamorphic rocks may have a crys-talline texture.Clastic: consisting of grains eroded from pre-existing rocks.These grains have been transported at least some distance fromtheir place of origin. Only some sedimentary rocks have a clastictexture.
It is essential that you are able to recognize these textures (Fig-ure A). They form the major division between many rocks. Failureto differentiate between a crystalline versus a clastic texture could result in you being responsible fordrilling through granite instead of sandstone!
1. Examine samples R2, R151, and R281 and identify the texture of each sample to complete the table below.
Sample R2 Texture:
Sample R151 Texture:
Sample R281 Texture:
The exercises below will guide you through the igneous rock samples in Rock Kits 1 and 2. Review the back-ground information presented in Chapters 4.1 to 4.3 before you begin these exercises. You may wish to con-sult the Rock Classification Tables at the back of this manual as you complete the exercises below.
Tips for Identifying Igneous Rocks
• Your first step when examining any igneous rock is to look closely at the size of the crystals and todetermine if its texture is aphanitic (individual crystals are too fine to be visible with the naked eye),phaneritic (individual crystals are visible with the naked eye), or porphyritic (crystals of two or moredistinctly different sizes present). If the sample contains no crystals at all and has a vitreous lustre, itstexture can be described as glassy. If the sample contains gas bubbles called vesicles, its texture isvesicular.
• If the sample is phaneritic, or contains phenocrysts, try to identify the minerals within the sample.
Lab 4 Exercises | 105

This will be tricky, as the crystals are much smaller than the samples you examined in Labs 2 and 3.Make sure you examine the sample carefully with your hand lens. You will see much more than withyour naked eye alone!
• Start by asking yourself, “how many different minerals can I see in this sample?” and make a short listof the physical properties you observe (e.g., colour, lustre, cleavage).
• Use your observations and the mineral identification tables to identify the minerals present, and makean estimate of their proportions using Figure A in the Rock Classification Tables appendix as a guide.Some mineral-specific hints are outlined here:
◦ Quartz crystals come in many colours, but quartz always has vitreous lustre and is often translu-cent.
◦ Potassium feldspar (K-feldspar) is commonly white or pink in colour, and is often opaque (milky) tosemi-translucent.
◦ Plagioclase feldspar is commonly white to dark bluish grey in colour (depending on the composi-tion), is often opaque (milky) to semi-translucent, and has striations.
◦ Examining a weathered surface can help to differentiate quartz from feldspar minerals: feldsparschemically weather tend to look chalky and dull (see Figure 5.1.4), whereas quartz always looksglassy. If you look for freshly broken surfaces or edges of the sample you may even see that thefeldspar crystals break along cleavage planes while the quartz crystals have conchoidal fracture.
◦ Muscovite (colourless, translucent) and biotite (dark brown to black) both appear as thin sheets orflakes.
◦ To tell biotite from other ferromagnesian minerals, test its hardness with a steel file or thin knife:biotite has a Mohs hardness of ~ 2.5-3 whereas amphibole and pyroxene are much harder (H =5-6).
◦ It can be difficult to tell amphibole from pyroxene in rocks, as they have similar hardnesses, formblocky crystals, and can be found in similar colours (shades of green to black). Look closely forcleavage: amphibole has 2 planes not at 90°, whereas pyroxene has 2 planes at 90°. If you areunsure whether a ferromagnesian mineral is amphibole or pyroxene and have already identifiedthe other minerals present, it may help to use Figure 4.3.1 as a guide. For example, if you haveidentified K-feldspar, quartz, and white plagioclase in a sample, chances are the dark colouredblocky mineral you see is amphibole and not pyroxene. Why? Because a felsic magma that is crys-tallizing K-feldspar and quartz will not normally also crystallize pyroxene.
◦ Olivine can be distinguished by its vitreous lustre and olive green to yellow-green colour. Caution:weathered olivine may appear dull or rusty (from iron oxide staining).
• If the sample is aphanitic, use the colour of a fresh surface to estimate the composition: felsic rocksare light-coloured (beige, buff, tan, pink, white, pale grey) whereas mafic rocks are dark-coloured (darkgrey to black).
• Finally, combine your observations of texture and composition, and use Figure B in the Rock Classifica-tion Tables appendix to name the rock.
◦ If the sample is porphyritic with an aphanitic groundmass, identify the phenocryst mineral(s),interpret the overall composition based on the colour of the groundmass, and name the rock as[phenocryst mineral name] porphyritic [rock name]. For example, a porphyritic volcanic rock withpyroxene phenocrysts in a dark grey aphanitic groundmass is a pyroxene porphyritic basalt.
◦ Rock names can likewise be modified by other textural terms (e.g., vesicular basalt).
2. Remove samples R1, R2, R11, R21, R31, R41, R42, R51, R61, and R71 from Rock Kit 1 and place the samples onthe table in front of you. Arrange these samples according to colour, in a line or into groups. What does thecolour of an igneous rock tell you?
106 | Lab 4 Exercises

3. Keeping the same colour groups you just arranged, within each group arrange the same set of samplesaccording to their grain size (the size of the crystals that make up these rocks). As you examine each sampledecide whether:
• all or most of the crystals are large enough for you to see with your naked eye,• all or most of the crystals are too fine to see clearly with your naked eye, or• there are no crystals at all (sample is glassy).
4. What does grain size tell you about the cooling history of an igneous rock?
The groups of igneous rocks you just arranged should reflect the classification presented in Figure B in theRock Classification Tables. Now that you have had a chance to compare all the samples, let’s examine eachsample in more detail.
Sample R1 Rock name:
Sample R2 Rock name:
5. It can be useful to look at both weathered and fresh (unweathered) surfaces of a rock sample, as both canbe useful when identifying minerals. However, it is important to make note of what type of surface you aredescribing in your notes. Are you looking at a fresh or a weathered surface?6. Are these rocks comprised of grains or crystals?7. These samples are both crystalline rocks (in contrast to clastic rocks which you will be examining in lab5). Notice the prominent cleavage faces which can be seen on some of the crystals. Which mineral(s) is (are)showing cleavage?
8. Are these rocks aphanitic or phaneritic?9. Are the crystals all of relatively similar size or obviously different sizes?10. Describe the colour of the rock:11. What do you estimate is the percentage of light (non-ferromagnesian) and dark-coloured (ferromagne-sian) minerals?
Non-ferromagnesian: % Ferromagnesian: %
12. List below the minerals which you recognize in order of abundance (remember to use your hand lens).
13. Which mineral is responsible for unique colour of sample R2?
Sample R11 Rock name:
Lab 4 Exercises | 107

14. Are you looking at a fresh or a weathered surface?15. Choose a term which best describes the texture of this rock:16. Describe the colour of this rock (light/intermediate/dark):17. What do you think is the basic difference between specimens R1 and R11?
18. Did sample R11 cool slowly (intrusive) or rapidly (extrusive) compared to R1?
Sample R21 Rock name:
19. Are you looking at a fresh or a weathered surface?20. Which textural term best describes this rock?21. The larger crystals in the aphanitic groundmass are called .22. Do you see cleavage planes on any of the larger crystals?23. What size (in mm) are the larger crystals?24. Are these crystals all the same mineral?25. Describe the overall colour of the rock (light/intermediate/dark):
Sample R31 Rock name:
26. Are you looking at a fresh or a weathered surface?27. Is the rock aphanitic or phaneritic?28. Does the textural term, ‘porphyritic’ apply to this rock?29. Did the rock cool slowly or rapidly?30. List the minerals in this rock in order of abundance:
31. What do you estimate is the percentage of light and dark-coloured minerals?
Non-ferromagnesian: % Ferromagnesian: %
32. Do you see cleavage planes on any of the minerals? If so, which ones?
33. Describe the colour of this rock (compare the colour to that of R1 and R51):
Sample R51 Rock name:
34. Are you looking at a fresh or a weathered surface?35. Which textural term best describes this rock?
108 | Lab 4 Exercises

36. Do any of the crystals exhibit cleavage planes? If so, which ones?
37. What do you estimate is the percentage of light and dark-coloured minerals?
Non-ferromagnesian: % Ferromagnesian: %
38. Would you say that texture (grain size) or mineralogy (mineral composition) is the basic differencebetween R1, R31, and R51?
Sample R41 Rock name:
39. Which textural term best describes this rock?40. Do you see any phenocrysts in this rock?41. Describe the colour of the rock on a fresh surface42. Is this rock intrusive or extrusive? What evidence supports your answer?
43. What is the basic difference between this rock and R51?
Sample R42 Rock name:
44. Which textural term applies to this sample?45. What are the small spherical cavities occurring throughout the rock called, and how did they form?
46. What is the difference between this rock and R41?
Sample R61 Rock name:
47. Describe the texture of this rock (Hint: what substance does it resemble):
48. Can you see the individual crystals in this rock?49. What term best describes the type of fracture of this rock?
This is a sample of obsidian and its texture is due to the super cooling of magma, resulting in a non-crys-talline, glassy texture.
Lab 4 Exercises | 109

50. Compare this specimen to R71 (pumice) which is also a type of glass. How do they differ?
Media Attributions
• Figure A: © Candace Toner. CC-BY-NC.
110 | Lab 4 Exercises

LAB 5: SEDIMENTS AND SEDIMENTARYROCKS
Lab Structure
Synchronous lab work Yes – virtual office hours available
Asynchronous lab work Yes
Lab group meeting No
Quiz Yes – on Blackboard
Recommended additional work None
Required materials Mineral ID kit, Rock Kits 1 and 2, Mineral Kits 1 and 2,pencil
Learning Objectives
After carefully reading this chapter, completing the exercises within it, and answering the questions at the end,
you should be able to:
• Describe the main processes of mechanical weathering, and the types of materials that are produced when
mechanical weathering predominates.
• Describe the main processes of chemical weathering, and the products of chemical weathering of minerals
such as feldspar, ferromagnesian silicates, and calcite.
• Explain the type of weathering processes that are likely to have taken place to produce a particular sedi-
ment deposit.
• Describe the differences between cobbles, pebbles, sand, silt, and clay and explain the relationship between
clast size and the extent to which clasts can be transported by moving water or by wind.
• Identify and describe the characteristics of the various types of clastic and chemical sedimentary rock
based on their texture and mineralogy.
112 | Lab 5: Sediments and Sedimentary Rocks

Key Terms
• Sediment• Sedimentary rock• Mechanical weathering• Chemical weathering• Erosion• Deposition• Lithification
• Clast• Boulder• Cobble• Pebble• Granule• Sand• Silt• Clay
• Cement• Crystalline• Clastic• Oolitic• Amorphous• Bioclastic• Fossiliferous
Figure 5.0.1: The Hoodoos, near Drumheller, Alberta, have formed from thedifferential weathering of sedimentary rock that was buried beneath otherrock for close to 100 Ma.
Weathering is what takes place when a body of rock is exposed to the “weather”—in other words, to theforces and conditions that exist at Earth’s surface. With the exception of volcanic rocks and some sedimen-tary rocks, most rocks are formed at some depth within the crust. There they experience relatively constanttemperature, high pressure, no contact with the atmosphere, and little or no moving water. Once a rock isexposed at the surface, which is what happens when the overlying rock is eroded away, conditions changedramatically. Temperatures vary widely, there is much less pressure, oxygen and other gases are plentiful,and in most climates, water is abundant (Figure 5.0.1). The various processes related to uplift and weatheringare summarized in the rock cycle in Figure 5.0.2.
Lab 5: Sediments and Sedimentary Rocks | 113

Figure 5.0.2: The rock cycle, showing the processes related to sedimentary rocks on theright-hand side.[Image description]
In this chapter, we will cover three core concepts: the formation of sediment through the weathering ofrocks at the Earth’s surface, the formation of sedimentary rocks from accumulated sediments, and the clas-sification of various types of sedimentary rocks. The weathering and erosion of existing rocks at the Earth’ssurface are the first two steps in the transformation of existing rocks into sedimentary rocks. The remain-ing steps in the formation of sedimentary rocks-transportation, deposition, burial, and lithification (Figure5.0.2) – will be discussed in more detail in chapter 5.3.
In this course, we divide sedimentary rocks into two main types: clastic and chemical. Clastic sedimentaryrocks are mainly composed of material that has been transported as solid fragments (clasts). Chemical sedi-mentary rocks are mainly composed of material that has been transported as ions in solution. It’s importantnot to assume that mechanical weathering leads only to clastic sedimentary rocks, while chemical weather-ing leads only to chemical sedimentary rocks. In most cases, millions of years separate the weathering anddepositional processes, and both types of sedimentary rocks tend to include at least some material derivedfrom both types of weathering.
Image Descriptions
Figure 5.0.2 image description: “The Rock Cycle.” The rock cycle takes place both above and below theEarth’s surface. The rock deepest beneath the Earth’s surface and under extreme heat and pressure is meta-morphic rock. This metamorphic rock can melt and become magma. When magma cools, if below the Earth’ssurface it becomes “intrusive igneous rock.” If magma cools above the earth’s surface it is “extrusive igneousrock” and becomes part of the outcrop. The outcrop is subject to weathering and erosion, and can be movedand redeposited around the earth by forces such as water and wind. As the outcrop is eroded, it becomessediment which can be buried, compacted, and cemented beneath the Earth’s surface to become sedimen-
114 | Lab 5: Sediments and Sedimentary Rocks

tary rock. As sedimentary rock gets buried deeper and comes under increased heat and pressure, it changesinto a metamorphic rock. Rocks in the rock cycle do not always make a complete loop. It is possible for sed-imentary rock to be uplifted back above the Earth’s surface and for intrusive and extrusive igneous rock tobe reburied and became metamorphic rock. [Return to Figure 5.0.2]
Media Attributions
• Figures 5.0.1, 5.0.2: © Steven Earle. CC BY.
Lab 5: Sediments and Sedimentary Rocks | 115

Lab 5 Exercises
The exercises below will guide you through the sedimentary rock samples in Rock Kits 1 and 2. Review thebackground information presented in Chapters 5.1 to 5.5 before you begin these exercises. You may wish toconsult the Rock Classification Tables at the back of this manual as you complete the exercises below.
Tips for Classifying Sedimentary Rocks
• Your first step when examining any sedimentary rock is to determine if its texture is clastic or crys-talline.
• If the texture is clastic, next determine the predominant size of the grains by looking closely throughyour hand lens and using the grain size chart (see Table A in the Rock Classification Tables appendix).
• Next, describe the sorting, and the shape (roundness) of the grains (Figure C in the Rock ClassificationTables appendix). Remember that you are not describing the shape or size of the sample, but of thegrains within it!
• If the texture is crystalline, test the sample with a drop (only a drop!) of dilute HCl. If the rock reactswith HCl, look carefully to determine what exactly is reacting (e.g., cement between grains of quartzsand? The entire sample of limestone?).
• Quartz grains come in many colours, but always have vitreous lustre.• Feldspar grains are commonly white or pink in colour, and in very coarse-grained clastic sedimentary
rocks, you may even see feldspar grains broken along cleavage planes. Feldspar grains that have beenchemically weathered tend to look chalky and dull (see Figure 5.1.4), which can help you differentiatethem from quartz grains.
1. Using your hand lens, carefully examine samples R151, R161, R162, and R181 from your Rock Kit to completethe table below. The example provided indicates the level of detail expected of your observations.
146 | Lab 5 Exercises

Sam
ple
#G
rain
Siz
e (m
m)
Ener
gy L
evel
Rou
ndne
ssSo
rtin
gC
ompo
siti
on (g
rain
s an
dce
men
t)R
ock
Nam
e
Exam
ple
0.5-
2 m
m (s
and)
Mod
erat
eSu
b-ro
unde
dM
oder
atel
y so
rted
65%
qua
rtz,
35%
roc
kfr
agm
ents
, cal
cite
cem
ent
Lith
ic a
reni
te
R15
1
R16
1
R16
2
R18
1
2. Are all four samples in the table above chemical or detrital (clastic) in origin? How can you tell?
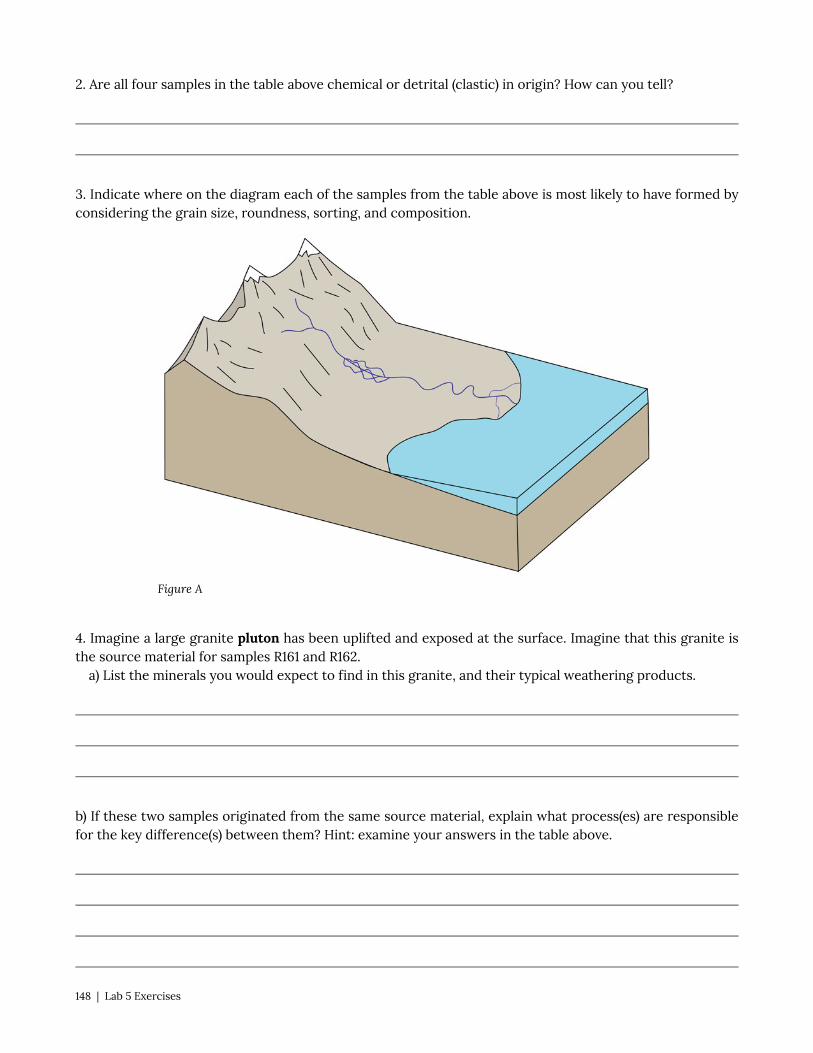
3. Indicate where on the diagram each of the samples from the table above is most likely to have formed byconsidering the grain size, roundness, sorting, and composition.
Figure A
4. Imagine a large granite pluton has been uplifted and exposed at the surface. Imagine that this granite isthe source material for samples R161 and R162.
a) List the minerals you would expect to find in this granite, and their typical weathering products.
b) If these two samples originated from the same source material, explain what process(es) are responsiblefor the key difference(s) between them? Hint: examine your answers in the table above.
148 | Lab 5 Exercises

5. Examine chemical sedimentary rock samples RI91, R201, R211, R221, R231, R251, R261, R271, and R281. In thetable below, name the mineral and chemical sedimentary rock(s) from your rock kits that correspond to thecomposition provided. As you examine each rock sample, think about what physical properties the mineraland the rock have in common. You may want to review the physical properties of minerals summarized inLabs 2 and 3, and in the mineral identification tables.
Composition MineralName
RockSample#
Rock Name Diagnostic Properties Common to Both Rockand Mineral
CaCO3
SiO2
NaCl
CaSO4·H2O
C (mostly) N/A
6. Examine sample R201. What shape are the grains?7. The small rounded grains that you see are called ooids, and the textural term for a rock with ooids is
.8. How do you think the ooids formed?
9. Name this rock:10. Examine sample R211 (coquina). Look closely at the larger grains. What would be a more appropriate
term than ‘grains’?
11. What is the main component of the rock?12. Compare samples R211 and R221. How are these two samples similar? How do they differ, and how wouldyou distinguish one from the other?
Lab 5 Exercises | 149

13. Examine sample R231. This is a type of limestone known as chalk. It is composed mainly of shelly remainsof microscopic animals. Scratch this sample with your fingernail. Why does it seem so much softer than acrystal of calcite?
14. Examine sample R251. The black colour is due to the very high organic content of the rock. This type ofrock is combustible. Name this rock:
15. How does this type of sedimentary rock form?
16. Examine samples R271 and R281. These are both examples of evaporites – they have formed by precipita-tion of crystals from a solution. In what ways do these two different samples differ?
17. Studying sedimentary rocks provides geologists with a window into the past. Simple observations aboutcomposition and texture of a rock sample can give a geologist important clues about the ancient environ-ment in which a sedimentary rock formed. Use your observations of sedimentary rock samples R151, R161,R181, R221 and R281, and the information provided in Chapter 5.5 to complete the table below. You shouldfind more than one possible depositional environment for most samples. In higher level geology courses,you will learn additional features to observe to narrow down the possible depositional environments for asample.
150 | Lab 5 Exercises

Sample Possible environment(s) ofdeposition Evidence
R151
R161
R181
R281
R221
Media Attributions
• Figure A: © Siobhan McGoldrick. CC BY.
Lab 5 Exercises | 151

LAB 6: METAMORPHIC ROCKS AND THEROCK CYCLE
Lab Structure
Synchronous lab work Yes – virtual office hours available
Asynchronous lab work Yes
Lab group meeting Yes – meet after you have completed Lab 6
Quiz Yes – on Blackboard
Recommended additional work Yes – review rock and mineral ID in preparation for Test2
Required materials Mineral ID kit, Rock Kits 1 and 2, hand lens, pencil
Learning Objectives
After carefully reading this chapter, completing the exercises within it, and answering the questions at the end,
you should be able to:
• Summarize the factors that influence the nature of metamorphic rocks and explain why each one is impor-
tant.
• Recognize foliation and explain the mechanisms for its formation in metamorphic rocks.
• Classify metamorphic rocks on the basis of their texture and mineral content, and explain the origins of
these differences.
• Describe the various settings in which metamorphic rocks are formed and the links between plate tectonics
and metamorphism.
• Describe the rock cycle and the types of processes that lead to the formation of igneous, sedimentary, and
metamorphic rocks.
Key Terms
• Metamorphism• Metamorphic grade• Geothermal gradient• Index minerals• Protolith• Recrystallization
• Foliation• Slaty• Schistose• Gneissic• Massive
Lab 6: Metamorphic Rocks and the Rock Cycle | 153

Lab 6 Exercises
Part I: Metamorphic Rocks
The exercises below will guide you through the metamorphic rock samples in Rock Kits 1 and 2. Review thebackground information presented in Chapters 6.1 and 6.2 before you begin these exercises. You may wishto consult the Rock Classification Tables at the back of this manual as you complete the exercises below.
Tips for Classifying Metamorphic Rocks
• Your first step when examining a metamorphic rock is to determine if its texture is foliated or mas-sive.
• If the rock is foliated, next determine the type of foliation:
◦ Slaty foliations are flat, smooth surfaces along which a slate breaks. They might have a slightlyshinier lustre than a shale.
◦ Larger crystals of micas that define a schistose foliation give it a shiny, wavy appearance and anysheet-like or elongate minerals will be aligned in a preferred orientation.
◦ Gneissic foliation, or gneissic banding, is defined by segregated bands of light-coloured quartzand feldspars and dark-coloured ferromagnesian minerals.
• If the texture is massive, test the sample with a drop of dilute HCl. Marble reacts with HCl just like itsprotolith – limestone!
• If the sample is massive and does not react with HCl, try testing the hardness. Quartzite is composedpredominantly of quartz, giving it a hardness ~7.
• Lastly, if the metamorphic rock is foliated but has a distinctly green-colour to it, and contains abun-dant ferromagnesian minerals chlorite and green amphibole, it is called a greenschist.
• Figure E and Table D in the Rock Classification Tables appendix may be helpful resources as you com-plete these lab exercises.
1. The best way to really appreciate the metamorphic changes to a rock is to meet its parent! Examine each ofthe sample pairs listed below. Each pair contains a metamorphic rock and its protolith (parent rock). Iden-tify which of the two samples is the metamorphic rock, and then carefully compare the two. In what waysare the metamorphic rock and its protolith similar? In what ways do they differ? Record your observationsin the table below.
• Pair A: R221 and R361• Pair B: R301 and R181• Pair C: R1 and R331• Paid D: R351 and R161
Lab 6 Exercises | 171

Name of protolith Name ofmetamorphic rock
Observations (how does the metamorphic rock differ from itsprotolith?)
PairA
PairB
PairC
PairD
2. Examine samples R181, R301, R321, R331, and R332. These samples show the progression of changes froma protolith (shale) to a high grade metamorphic rock (gneiss). Complete the table below by recording thechanges you observe in mineralogy and texture with increasing metamorphism. For the changes in miner-alogy, record what new minerals you see and note any minerals that have disappeared. For the changes intexture, look for changes in grain size or the development of a foliation.
172 | Lab 6 Exercises

Cha
nges
in m
iner
alog
yC
hang
es in
tex
ture
Shal
e to
slat
e
(R18
1 to
R30
1/R
302)
Slat
e to
schi
st
(R30
1/R
302
to R
321)
Schi
st t
ogn
eiss
(R32
1 to
R33
1/R
332)

3. This progression of foliated metamorphic rocks from slate to gneiss is typical of mudrocks that are meta-morphosed during regional metamorphism with a typical geothermal gradient. Using Figure 6.1.6 and Fig-ure E in the Rock Classification Tables as a guide, complete the table below to summarize the range oftemperatures and depths (pressure) responsible for the metamorphism of samples R301, R321, and R332.
Sample# Approx. temperature (°C) Approx. Depth (km) Metamorphic Grade (low,
intermediate, high)
R301
R321
R332
4. Which two samples in your Rock Kits 1 and 2 represent non-foliated (or massive) metamorphic rocks?
5. Do these two samples exhibit crystalline or clastic textures?6. Examine sample R351. Try to scratch this sample with the tools from your mineral ID kit. How hard is
this sample?7. Based on your answer above, and any other physical properties you observe, name the main mineral(s)
present in this rock:8. Examine sample R361. Try to scratch this sample with the tools from your mineral ID kit. How hard is
this sample?9. Place a small drop of HCl on a fresh surface of the sample. What happens?
10. On the basis of these two tests name the main mineral present in this rock:11. Metamorphism may affect the texture or the mineral composition or both of these properties of the
protolith. Do samples R351 and R361 have the same mineral composition as their respective sedimentaryprotoliths? Do they have the same texture? Explain your answers.
Part II: The Rock Cycle
The exercises below are a review of the rock cycle processes by which one type of rock is transformed intoanother over geological time. You will review all the rock samples in Rock Kits 1 and 2 that you have exam-ined to date in preparation for Test 2. Review the background information presented in Chapter 6.3 beforeyou begin these exercises. To benefit the most from these review exercises, remove all your rock samplesfrom the Rock Kits and set the empty kits aside, so that you cannot see the names of the rocks.
All rocks are connected through the rock cycle. Any rock that you see today will at some point in thefuture be transformed into a different rock through the rock cycle (see Figure 6.3.1). This exercise focuses onthe processes that are responsible for the transformation of one rock type into another. As a starting point,summarize the main processes involved in the formation of the three main categories of rock:
174 | Lab 6 Exercises

• Igneous:
• Sedimentary:
• Metamorphic:
The example presented below illustrates how you should complete question 12, by explaining theprocesses that formed the rocks in the second column. This example begins with granite, and the processesresponsible for the formation of the granite are explained first. Then, the processes that explain how graniteis transformed into quartz sandstone are outlined, and so on.
Order Rock Name Sample# Rock Cycle Processes Responsible
1 Granite R1 Partial melting of pre-existing rock to generate magma. Felsic magma cools andcrystallizes at depth to form granite, a felsic intrusive igneous rock.
2 Quartzsandstone R161
Granite is uplifted to surface, chemically and mechanically weathered, and eroded.Sand-sized grains of quartz, feldspar and some ferromagnesian minerals aretransported. Feldspars and ferromagnesian minerals chemically weather to form clayminerals and ions in solution. Quartz grains become more rounded and better sortedwith transport. Eventually quartz grains are deposited in a moderate to high energyenvironment (depending on grain size). Grains of quartz are lithified into sandstonethrough burial by other sediments, compaction, and cementation by mineral(s)precipitated from a fluid.
3 Quartzite R351 Quartz sandstone is metamorphosed through regional or contact metamorphism.Grains of quartz recrystallize into coarser grains to form a crystalline texture.
12. For each of the rocks specified below, find the corresponding rock sample from your collection of rocks.Remember, for this to be an effective review activity, do this without looking at the rock names in the kit!Complete the table with the appropriate sample number, and explain the processes from the rock cycle thathave transformed the previous sample into the present sample. Begin by explaining how pebble-sized clastsof basalt formed, and then how shale could form from those basalt pebbles, and so on.
Lab 6 Exercises | 175

Order RockName Sample # Rock Cycle Processes Responsible
1Basalt
pebbles(sediment)
N/A
2 Shale
3 Garnetgneiss
4 Diorite
Part III: Rock Review
13. Use the flow chart below to review igneous, sedimentary, and metamorphic rocks from Labs 4-6.This review will help you prepare for Test 2. The words “fine”, “medium”, and “coarse” on the flow chartrefer to grain size. Chemical formulae are listed for any monomineralic rocks. The words “light”, “inter-
176 | Lab 6 Exercises

mediate”, and “dark” refer to the colour (and therefore composition) of aphanitic igneous rocks.
Lab 6 Exercises | 177

178 | Lab 6 Exercises

LAB 7: RELATIVE DATING ANDGEOLOGICAL TIME
Lab Structure
Synchronous lab work Yes – virtual office hours available
Asynchronous lab work Yes
Lab group meeting No
Quiz None – Test 2 this week
Recommended additional work None
Required materials Pencil
Learning Objectives
After carefully reading this chapter, completing the exercises within it, and answering the questions at the end,
you should be able to:
• Apply basic geological principles to the determination of the relative ages of rocks.
• Explain the difference between relative and absolute age-dating techniques.
• Summarize the history of the geological time scale and the relationships between eons, eras, periods, and
epochs.
• Understand the importance and significance of unconformities.
• Explain why an understanding of geological time is critical to both geologists and the general public.
Key Terms
• Eon• Era• Period• Relative dating• Absolute dating• Isotopic dating• Stratigraphy• Strata• Superposition
• Original horizontality• Cross-cutting• Inclusions• Faunal succession• Unconformity• Angular unconformity• Disconformity• Nonconformity• Paraconformity
Time is the dimension that sets geology apart from most other sciences. Geological time is vast, and Earthhas changed enough over that time that some of the rock types that formed in the past could not form
Lab 7: Relative Dating and Geological Time | 181

today. Furthermore, as we’ve discussed, even though most geological processes are very, very slow, the vastamount of time that has passed has allowed for the formation of extraordinary geological features, as shownin Figure 7.0.1.
Figure 7.0.1: Arizona’s Grand Canyon is an icon for geological time; 1,450 million years arerepresented by this photo. The light-coloured layered rocks at the top formed at around 250Ma, and the dark rocks at the bottom (within the steep canyon) at around 1,700 Ma.
We have numerous ways of measuring geological time. We can tell the relative ages of rocks (for example,whether one rock is older than another) based on their spatial relationships; we can use fossils to date sed-imentary rocks because we have a detailed record of the evolution of life on Earth; and we can use a rangeof isotopic techniques to determine the actual ages (in millions of years) of igneous and metamorphic rocks.We will explore the use of fossils in dating sedimentary rocks, and interpreting past changes in climateand depositional environment through geologic time in the subsequent geology course, GEOL 1103 – EarthThrough Time.
But just because we can measure geological time doesn’t mean that we understand it. One of the biggesthurdles faced by geology students—and geologists as well—in mastering geology, is to really come to gripswith the slow rates at which geological processes happen and the vast amount of time involved. The prob-lem is that our lives are short and our memories are even shorter. Our experiences span only a few decades,so we really don’t have a way of knowing what 11,700 years means. What’s more, it’s hard for us to under-stand how 11,700 years differs from 65.5 million years, or even from 1.8 billion years. It’s not that we can’tcomprehend what the numbers mean—we can all get that figured out with a bit of practice—but even if wedo know the numerical meaning of 65.5 Ma, we can’t really appreciate how long ago it was.
You may be wondering why it’s so important to really “understand” geological time. One key reason is tofully appreciate how geological processes that seem impossibly slow can produce anything of consequence.For example, the slow movement of tectonic plates that over geological time can travel many thousands ofkilometres!
One way to wrap your mind around geological time is to put it into the perspective of single year, as wedid in Table I1 the introductory chapter, because we all know how long it is from one birthday to the next.At that rate, each hour of the year is equivalent to approximately 500,000 years, and each day is equivalentto 12.5 million years. It’s worth repeating: on this time scale, the earliest ancestors of the animals and plantswith which we are familiar did not appear on Earth until mid-November, the dinosaurs disappeared afterChristmas, and most of Canada was periodically locked in ice from 6:30 to 11:59 p.m. on New Year’s Eve. Asfor people, the first to inhabit Alberta got here about one minute before midnight, and the first Europeansarrived about two seconds before midnight.
182 | Lab 7: Relative Dating and Geological Time

Media Attributions
• Figure 7.0.1: © Steven Earle. CC BY.
Lab 7: Relative Dating and Geological Time | 183

Lab 7 Exercises
Figure A represents two road cuts, or cliff faces, exposed along a road way. You can see that at first glance,the road cuts look almost identical as they both expose the same four types of rock: granite, sandstone,limestone, and shale.
1. As a quick review from Labs 4, 5, and 6, how did each of these rocks form? Briefly summarize the originof each rock in the table below.
Figure A
RockType Granite Sandstone Limestone Shale
Origin
2. Examine the two road cuts carefully, and using the principles of stratigraphy, write a point-form geologichistory for each road cut. A geologic history is a written sequence of events that describes what geologicalprocesses happened in the past to produce the stratigraphy in a given area, like a timeline. Your geologichistory should use proper terms to describe each event. For example, we would say that a sedimentary rockwas deposited and then lithified. We would not say that a sedimentary rock “intruded” or “erupted” becausethese terms are reserved for intrusive and extrusive igneous rocks, respectively. If there are any unconfor-mities present, identify which type (review Figure 7.2.6) and briefly describe what the unconformity repre-sents. This might include: a period of uplift and erosion, a period of non-deposition, or both.
Lab 7 Exercises | 193

YoungestEvent Road Cut A (left) Road Cut B (right)
• •
• •
• •
• •
• •
OldestEvent
• •
3. Do the two road cuts share the same geologic history? Why or why not?
4. Which key principle of stratigraphy helped you determine the difference between the two road cuts?
Road cuts and naturally-occurring cliffs provide us with a view into the subsurface to help us understandthe nature of the layers of rock beneath our feet. Another way to visualize the subsurface is using a blockdiagram, or block model (Figure B). The top of the diagram shows the plan view, or map view, of the Earth’ssurface. The sides of the diagram show two different cross-sectional views down into the subsurface. Thesevertical cross-sections illustrate the geology below the surface.
We can see in Figure B, for example, that at the surface there is an active volcano (venting steam) that isconnected at depth to a shallow magma chamber (E). The letters shown in this diagram, and in all the fig-ures in this lab, are randomly assigned. In Figure B, layers G, H, J, and K are all sedimentary. Units B, C, D, E,L, and M are igneous.
194 | Lab 7 Exercises

Figure B
5. Write a point-form geologic history for Figure B in the table below. Specify which stratigraphic principle(s)you used to justify the position of each event in the timeline.
Lab 7 Exercises | 195

YoungestEvent Geologic History of Figure B Justification (which principle of stratigraphy did
you use?)
• •
• •
• •
• •
• •
• •
• •
• •
• •
OldestEvent
• •
6. Write a point-form geologic history for Figure C in the table below. Specify which stratigraphic principle(s)you used to justify the position of each event in the timeline. If there are any unconformities present, iden-tify which type and briefly describe what the unconformity represents. This might include: a period of upliftand erosion, a period of non-deposition, or both. All the units in Figure C are sedimentary rocks, except Bwhich represents an erosional surface.
Figure C
196 | Lab 7 Exercises

YoungestEvent Geologic History of Figure C Justification
• •
• •
• •
• •
• •
• •
• •
• •
OldestEvent
• •
7. In the space below, write a short paragraph (<150 words) describing the geologic history for Figure D usingcomplete sentences. To describe the sequence of sedimentary rocks, you may want to use the term “over-lain”, as in “the Pennsylvanian conglomerate is overlain by the Permian shale”, or as an adjective, “the over-lying Permian shale”.
Figure D
Lab 7 Exercises | 197

8. Write a point-form geologic history for Figure E in the table below. Specify which stratigraphic principle(s)you used to justify the position of each event in the timeline.
Figure E
198 | Lab 7 Exercises

YoungestEvent Geologic History of Figure E Justification
• •
• •
• •
• •
• •
• •
• •
• •
OldestEvent
• •
9. Write a point-form geologic history for Figure F in the table below. Specify which stratigraphic principle(s)you used to justify the position of each event in the timeline. If there are any unconformities present, iden-tify which type and briefly describe what the unconformity represents. Unit L represents a rhyolite domeformed by felsic lava. Letter A refers to the surface denoted by the red line. All other letters refer to sedi-mentary rocks.
Figure F
Lab 7 Exercises | 199

YoungestEvent Geologic History of Figure F Justification
• •
• •
• •
• •
• •
• •
• •
• •
• •
OldestEvent
• •
Media Attributions
• Figures A, C, D, E, F: © Siobhan McGoldrick. CC BY.• Figure B: © Siobhan McGoldrick. Adapted after Figure 3.5.2 © Steven Earle. CC BY.
200 | Lab 7 Exercises

LAB 8: MAPPING FLUVIAL LANDSCAPES
Lab Structure
Synchronous lab work Yes – virtual office hours available
Asynchronous lab work Yes
Lab group meeting No
Quiz Yes – on Blackboard
Recommended additional work Yes – Practice Exercise 8.3
Required materials Tracing paper, pencil, pencil crayons, ruler, printedElbow River Map Area base image
Learning Objectives
After reading the background information in this chapter, and completing the exercises within it, you should be
able to:
• Understand and interpret maps as a geologist.
• Identify erosional and depositional features associated with fluvial environments.
• Describe the evolution of a meandering stream.
• Locate topographic maps within Canada using the National Topographic System (NTS).
• Describe locations using UTM coordinates.
• Understand map scale and how to determine distances on a map.
• Understand how elevation data are presented on a topographic map as contour lines.
• Create a surficial geology map of fluvial features.
Key Terms
• Meandering stream• Braided stream• Stream gradient• Stream channel• Flood plain• Discharge• Erosion• Deposition• Cut bank• Point bar• Oxbow lake
• Meander scar• Scroll bar• Delta• Levée• Legend• Map scale• UTM coordinates• National Topographic System (NTS)• Topographic contour lines• Contour interval
202 | Lab 8: Mapping Fluvial Landscapes

Figure 8.0.1: Map of the communities most affected by the2013 Alberta floods (in orange).
Streams are the most important agents of erosion and transportation of sediments on Earth’s surface. Theyare responsible for the creation of much of the topography that we see around us. They are also places ofgreat beauty and tranquility, and of course, they provide much of the water that is essential to our exis-tence. But streams are not always peaceful and soothing. During large storms and rapid snowmelts, they canbecome raging torrents capable of moving cars and houses and destroying roads and bridges. When theyspill over their banks, they can flood huge areas, devastating populations and infrastructure. Over the pastcentury, many of the most damaging natural disasters in Canada have been floods, and we can expect themto become even more severe in the near future as the climate changes.
Canada’s most costly flood ever was the June 2013flood in southern Alberta, affecting the communi-ties of Canmore, Calgary, Okotoks, and High River(Figure 8.0.1). The flooding was initiated bysnowmelt and worsened by heavy rains in the Rock-ies due to an anomalous flow of moist air from thePacific and the Caribbean. At Canmore, rainfallamounts exceeded 200 millimetres in 36 hours, andat High River, 325 millimetres of rain fell in 48 hours.
In late June and early July, the discharges of sev-eral rivers in the area, including the Bow River inBanff, Canmore, and Exshaw, the Bow and ElbowRivers in Calgary, the Sheep River in Okotoks, and the Highwood River in High River, reached levels thatwere 5 to 10 times higher than normal for the time of year! Large areas of Calgary, Okotoks, and High Riverwere flooded and five people died. The cost of the 2013 flood is estimated to be approximately $5 billion.
One of the things that the 2013 flood on the Bow River teaches us is that we cannot predict when a floodwill occur or how big it will be, so in order to minimize damage and casualties we need to be prepared. Someof the ways of doing that are as follows:
• Mapping flood plains and not building within them• Building dykes or dams where necessary• Monitoring the winter snowpack, the weather, and stream discharges• Creating emergency plans• Educating the public
Media Attributions
• Figure 8.0.1: © Steven Earle. CC BY.• Elbow River Map Area satellite image used under the following Google Maps and Google Earth guide-
lines.
Lab 8: Mapping Fluvial Landscapes | 203
Lab 8 Exercises
In this activity you will learn to identify features of a stream using satellite imagery in Google Earth Pro.You will create a hand-drawn map of the fluvial features you identify along a segment of the Elbow River inCalgary, Alberta on the homelands of the Niitsitapi (the Siksika, Piikani, and Kainai), the Îyârhe Nakoda andTsuut’ina Nations. Located just south of Mount Royal University’s campus, this segment of the Elbow Riverwas one of the areas affected by the 2013 flooding. Elbow River also plays a crucial role in supplying Cal-gary’s drinking water.
You have been provided with the following starting materials to complete this mapping activity:
• A base image from Google Earth satellite imagery (Elbow River Map Area) that you must print out• A digital copy of the 082J-16 NTS Priddis map sheet on which your map area resides (do not print this)
The purpose of your map is to show your reader the locations of erosional and depositional features of theElbow River. To convey that information in a way that is useful, your map needs to include some standardcartographic elements including:
• Title• Scale• North arrow• Legend• Sources (e.g., satellite imagery, base map, reference map)• UTM coordinates for a reference point on your map• Refrence to the National Topographic System (NTS) map sheet on which your map resides
Title
Your map should have a succinct but descriptive title that includes some reference to the geographic area.This could include the name of the river, the NTS map sheet on which your map resides, or the name of aprominent local landmark that is featured on your map. Your title must also include what type of map youhave drawn, e.g., topographic map, geological map, map of glacial landforms, map of population distribu-tions, etc.
Scale
Your map must indicate scale using both a scale bar and a representative fraction. Remember, you can cal-culate the scale on your map by comparing the length of a distinctive feature on your map and a topographicmap of the same area. But first, because you are examining an electronic version of the topographic map ona computer screen rather than a printed version you need to ensure that you are viewing the topographicmap at the correct scale (as your device may distort the size of the image on the screen).
To check if your topographic map PDF is being displayed correctly, measure the scale bar on the map. For
Lab 8 Exercises | 215

a 1:50,000 map sheet like the one you are using, 1 cm on the scale bar should represent 500 m on the ground.By holding up a ruler to measure, zoom in and out until this is true on your computer screen before youfollow the steps below.
1. Measure a feature that is visible and distinctive on both your map and the topographic map. Recordyour measurements in the same units for both. The distance between intersections along a road, or ina straight line between two distinctive features are good places to measure.
2. Use the formula below:
For example, for a feature 5 cm long on your map and 2.5 cm-long on the 1:50,000 topographic map:
The scale of the base image in this example is therefore 1:25,000. This result is not particularly realistic asair photo or satellite imagery scales rarely work out to such a nice, even number.
North arrow
Exactly as it sounds: a north arrow on a map shows the reader the direction of north in the area.
Legend
The purpose of a legend is to define all symbols, abbreviations or colours used on a map to the reader. Everyfeature that you draw or label on your map should be explained or defined in the legend. For example:
Abbreviation or symbol on the map Meaning
Fp
Ms——-
Flood plain
Meander scarTrail
Feel free to create your own abbreviations or symbols for features on your map, but make sure you chooseunique abbreviations or symbols for each feature.
Reference location
To help your reader put the information from your map into a real-world context, you should provide theUTM coordinates for a reference location on your map. You may want to refresh your memory on grid coor-dinates by reviewing the Google Earth Tutorial. This location should be something visible and distinctive
216 | Lab 8 Exercises

on both your map and the topographic map provided. Furthermore, this location should be a feature that isunlikely to move over time, e.g., a point bar would be a poor choice as the shape and position of the pointbar migrates over time. You will also need to tell your reader where your mapped area fits into Canada’sNational Topographic System (NTS).
Instructions
1. Examine the area you will be mapping (Elbow River Map Area).2. Open Google Earth Pro on your computer and navigate to this area. Spend some time examining the
features of this area using the 3D capabilities of Google Earth Pro.3. Attach a piece of tracing paper to your printed satellite imagery with a paper clip or piece of clear tape.
Be gentle; tracing paper tears easily! Be very careful when erasing!
4. Set up your map area. Make sure that you have enough space on your tracing paper set aside for yourlegend and other cartographic elements (see checklist below). The example shown here illustrates one pos-sible layout, but feel free to choose a layout that works with your map area.
5. With a pencil, lightly and neatly draw in the major landforms that you see in the satellite imagery. Focuson fairly large-scale structures; don’t clutter up your map with a lot of detail. Think about what features arerelevant to the fluvial features map you are drawing, and then make a judgement call for yourself about whatfeatures to include. For example, it is important to your map to draw in every building? Or to highlight areaswith different types of vegetation? Probably not. But is it important to have a few key roads on your map tohelp a reader situate your map? Yes, it is.
6. Think about neatness. Examine the topographic map provided. What characteristics make it neat andeasy to read? It is drawn carefully and the features are not shaded in. Remember: you are producing a map,which is drawn in plan view. It should not have any 3D aspect to it, including shading. Your finished productshould be a line drawing only.7. Use the topographic map provided to help you identify named geographic features.
8. Trace out the different fluvial features that you have interpreted, and assign each feature a uniqueabbreviation or symbol. Keep track of the abbreviations or symbols that you use on a spare sheet of paper tohelp format your legend once you have finished your map.
9. If the feature you are tracing is a polygon (an enclosed area that defines the borders of the specific fea-ture), make sure your polygon is fully closed and labeled with an abbreviation, symbol or colour. Make sureevery polygon you draw is labeled.
Lab 8 Exercises | 217

10. Review the checklist below and ensure that your finished map contains all the required information.
Fluvial Features CulturalFeatures Cartographic Elements
Active channel Roads Title
Cut bank Bridges North arrow
Point bar Buildings orsubdivisions Scale bar
Abandonedchannel Scale as representative fraction
Oxbow lake Legend
Delta Reference to NTS sheet on which this map resides
Flood plain Reference point in UTM coordinates
Meander scar Elevation of reference point in metres (estimate using the topographiccontours)
Date of satellite imagery and source of satellite imagery
Author’s name (your name)
Summary Questions
1. What is the National Topographic Index Number for the topographic map provided?2. What is the National Topographic Index Number for the topographic map directly to the north of thismap?3. What colour are grid lines for UTM Zone 11 on the topographic map sheet provided?4. What colour are the topographic contour lines on the topographic map sheet provided?5. What is the contour interval (C.I.) on this topographic map?6. Examine the spacing between adjacent contour lines on the topographic map provided. In what generalpart of the map do you see relatively steep topography? In what general part of the map do you see relativelygentle topography? How can you tell the difference using the contour lines?
7. Draw a sketch of a few contour lines, with elevations labeled, as they cross a stream. On your sketch, indi-cate the direction of stream flow with an arrow.8. Where would you expect to find the fastest water flow on a straight stretch of a stream?
9. Sand grains can be moved by traction and saltation. What minimum stream velocities might be requiredto move 1 millimetre sand grains?10. Under what circumstances might a braided stream develop?
218 | Lab 8 Exercises

11. What do you think controls the variability in the colour of the water in Glenmore Reservoir in this satelliteimage?
12. What factors or forces influence the behaviour of the Elbow River? Hint: Examine the most recent satel-lite imagery for your map area in Google Earth Pro.
If you have the opportunity to do so, and provincial health authorities deem it safe, you are encouraged tosafely and respectfully visit this area, called Weaselhead Flats, yourself. Walk around the Weaselhead Flatsand see what fluvial features you can identify in person. Grab a handful of sediment from a point bar andexamine the size, shape and composition of the grains. As for any field work, always:
• Stay on the trails, be mindful of other trail users and maintain 2 m of physical distancing.• Dress appropriately for changing weather conditions. Think layers!• Bring water, a hat and sunscreen.• Wear appropriate footwear that covers your foot completely, provides some ankle support, and has a
good tread in case the path is slippery.• If you are exploring along the river bank, walk cautiously and be mindful of loose soil or sediment that
may collapse.• Make a plan! Make sure you tell someone when you are expected home and check in with them once
you return.
Media Attributions
• Elbow River Map Area and Glenmore Reservoir and area satellite images used under the followingGoogle Maps and Google Earth guidelines.
• 082J-16 NTS Priddis topographic map: © Natural Resources Canada. The Government of Canadaretains the copyright of this image but allows for reproduction for non-commercial use.
• Example map layout: © Siobhan McGoldrick. CC BY.
Lab 8 Exercises | 219

LAB 9: STRUCTURAL GEOLOGY PART I
Lab Structure
Synchronous lab work Yes – virtual office hours available
Asynchronous lab work Yes
Lab group meeting Yes – meet after you have completed Lab 9
Quiz None
Required additional work Yes – take-home mapping assignment
Required materials Tracing paper, pencil, pencil crayons, ruler, printedSheep Mountain map area base image
Learning Objectives
After reading the information in this chapter, and completing the exercises within it, you should be able to:
• Visualize topographic contours in Google Earth and review the concepts of topographic maps presented in
Lab 8.
• Visualize layers of rocks as planes in three-dimensional space, in areas of variable topography.
• Recognize and describe different units of rock in satellite imagery and on geological maps.
• Understand the significance of the information presented on a geological map.
• Understand the concept of dip and dip direction of inclined strata.
• Use the three-dimensional capabilities of Google Earth Pro to identify dip direction of inclined strata.
• Estimate dip direction of inclined strata in map view using the Rule of V’s.
Key Terms
• Strata• Planar• Contact• Cardinal direction• Ordinal direction• Contour lines• Dip• Dip direction
• Lithology• Unit• Map scale• Formation• Group• Member• Bed• Rule of V’s
Lab 9: Structural Geology Part I | 221

Lab 9 Exercises
Today, you will be learning the basic principles of geological mapping. In this activity you will learn to iden-tify layers of rock, group them into mappable layers, and identify dip direction using satellite imagery inGoogle Earth Pro. The take-home assignment you will complete aims to link together all the topics coveredin this lab to introduce you to geological mapping using satellite imagery.
Before you get started, download Google Earth Pro (free) for desktop. Web or Mobile versions are alsoavailable but they do not have all the features you will be required to use in this activity.
Instructions
Download the 1101 Lab 9.kmz file. In Google Earth Pro, click File, Open and navigate to wherever you savedthe downloaded .kmz file.
In the left panel you should see a list of places in this kmz file, double click on “Raplee Anticline”. We willbegin by examining the Google Earth satellite imagery only, so uncheck the box next to “Mexican Hat Topo-graphic Map”.
1. Examine the area around Raplee Anticline from an altitude of ~5 km. Write down any observations youhave about this area.
2. Notice the different colours. What might these different colours represent?
3. Why are we examining this area to study bedrock geology? Why not look around Calgary? Why not lookaround Vancouver, BC?
Turn on the “Mexican Hat Topographic Map” layer by checking the box next to it in the Places sidebar. Makesure the map is 100% opaque (not transparent at all).
• To adjust the transparency, right click on the name of the layer in the Places sidebar, and select Prop-erties.
• A dialogue box should appear. Click and drag the bar to adjust the transparency of the topographicmap overlay.
Lab 9 Exercises | 231

Now that you are examining a topographic map draped over the 3D landscape in Google Earth, let’s reviewsome concepts about topographic maps from Lab 8.
4. What units are used to show elevation on this topographic map?
5. What is the contour interval on this topographic map?
6. What do topographic contour lines do when they cross a stream? If you’re not sure, examine one of thestreams to the northwest of the Raplee Anticline, but still on the east side of the San Juan River.
Adjust the transparency of the topographic map such that it is almost transparent but the topographic con-tour lines are still visible.
7. Examine the immediate area around the Raplee Anticline in plan view (remember, you can press r onyour keyboard to return to plan view). What do you notice about the contour lines relative to the contacts?Hint: the contacts are the planes between layers of rocks of different colours.
8. Rotate the view to examine the area in 3D. Circle the correct answer: do these layers in the immediatearea around Raplee Anticline appear to be horizontal, vertical, or dipping?
9. If you were to walk 500 m from Raplee Anticline, heading due west, would you be walking over progres-sively younger or older rocks? What principle of stratigraphy did you use to determine this?
10. Examine the strata directly to the west of Raplee Anticline but still on the east side of the San Juan River.Again, compare the strata that you can recognize by the variations in colour to the contour lines. Do thesestrata look horizontal as well? Why or why not?
11. Rotate the view until you are looking directly east toward Raplee Anticline. Look closely at the jagged-looking layers of red and grey rocks. Notice how if you try to trace a single layer of rock it makes a jaggedline? That is because these layers are dipping. Rotate your view to see this in 3D and confirm these layersare indeed tilted, or using proper terminology, they are dipping.
Let’s practice using the Rule of V’s to determine the dip direction of these strata. To make this easier,turn off the topographic map by unchecking the box.
• Take another look at one of the streams you examined earlier, just to the NW of Raplee Anticline.• Zoom in, press r to return to plan view, and pick a distinctive stratum (a single layer of rock) to trace.
232 | Lab 9 Exercises

• Trace your chosen stratum across this stream. Notice how it makes a “V” shape and the point of the “V”points in the direction of dip.
12. What is the dip direction of these dipping strata? Remember, think of dip direction as the direction waterwould flow if poured onto the layer of rock.
So far, you have seen that dry, arid climates make excellent areas for virtual field work because there is littlevegetation to obscure your view of the geology! You have observed that different rock units may be dis-tinguished even in satellite imagery based on colour differences. You have seen how horizontal strata havecontacts that are parallel to topographic contour lines, and how dipping strata have contacts that deflectacross contour lines. You have also practiced using the Rule of V’s to determine dip direction.
Let’s explore a couple more arid regions of the world with spectacular geology: Karkh, Pakistan andDekhuyeh, Iran.
13. Use the Rule of V’s to determine the dip direction of the light beige coloured layers of rock near Karkh,Pakistan.
14. Use the Rule of V’s to determine the dip direction of the light beige coloured layers of rock nearDekhuyeh, Iran.
Finally, let’s explore one more field area to relate the geology you can see in Google Earth to a geologicalmap. Navigate to “Sheep Canyon Area” and examine this area from an altitude of ~9 km. Notice how youcan see the different layers clearly because this area has very little overburden and vegetation to hide thebedrock geology. Turn on the “Sheep Canyon Geological Map” layer. Toggle the layer on and off, or adjustthe transparency.
15. How are the rocks of different colours that you could see in the satellite imagery depicted on the geo-logical map?
In Lab 8 you created a fluvial surficial geology map – a map of sediment deposited by a river. That is one typeof map used in geology, to show deposits of loose sediment on the Earth’s surface. Another type of geolog-ical map shows the bedrock, meaning the layers of hard, fully-lithified rocks that are exposed at the Earth’ssurface. All the layers of rock you have been studying today are examples of bedrock.
Rocks are typically mapped in packages that are often formally named formations or groups. Notice howeach formation on the Sheep Canyon geological map has a map code associated with it to link each forma-tion to the legend.
16. Can you see anywhere on this map or in the Google Earth satellite imagery where you could use theRule of V’s to determine dip direction? For which unit could you do this? State the complete formation name,the map code, and the dip direction.
Now that you have a sense of how to visualize layers of rocks in three-dimensions, and what the differentcolours on a geological map represent, we are going to focus in on how to read geological maps. Close
Lab 9 Exercises | 233
Google Earth Pro, and open the digital PDF copy Sheep Canyon Geological Map to answer the followingquestions.
17. What is the full title of this map?
18. Who is the author of this map?
19. What is the scale of this map?20. What is the distance in kilometers measured along Highway 14-16-20 from the intersection with High-
way 310 to the intersection with the pipeline?21. What information is provided for each mapped unit in the legend of a geological map?
22. In what order are the formations listed in the legend?
23. What is the map code, name, age, and lithology of the oldest unit on this map?
24. In what general area of the map would you find this unit exposed at the surface?
25. What is the map code, name, age, and lithology of the youngest formation on this map?
26. In what general area of the map would you find this formation exposed at the surface?
27. What are the full names of the two formations deposited during the Pennsylvanian? Which of the two isoldest?
234 | Lab 9 Exercises

28. If you were going to start a drywall manufacturing business, which formation(s) would you be most inter-ested in exploring?
Media Attributions
• 1101 Lab 9.kmz file by Siobhan McGoldrick. Derivative of Kmz file of placemarks for other structuralmapping examples by Barbara Tewksbury, Locations in Google Earth for teaching geologic mappingand map interpretation, used under CC-BY-NC-SA 3.0.
• Mexican Hat Topographic Map © USGS. Public domain.• Sheep Canyon Geological Map by Robert E. Ladd © Wyoming State Geological Survey. All rights
reserved. Used with permission.
Lab 9 Exercises | 235

TAKE-HOME MAPPING ASSIGNMENT
Complete Lab 9 before you attempt this assignment.
Learning Objectives
After completing this take-home activity, you should be able to:
• Draw a geological map from satellite imagery, including all required cartographic elements and symbols to
indicate dip direction.
Geological Map of Sheep Mountain
As a take-home assignment worth 4% of your final mark, create a hand-drawn geological map of the north-ern part of Sheep Mountain in Wyoming. This map area has been outlined in the 1101 Lab 9.kmz file for youto examine in Google Earth Pro, and is located on the homelands of Arapaho, Arikara, Bannock, Blackfoot,Cheyenne, Crow, Gros Ventre, Kiowa, Nez Perce, Sheep Eater, Sioux, Shoshone and Ute tribes. Sheep Moun-tain was selected for this activity because of the clear colour contrasts in the rocks, and because this areahas very little vegetation to obscure your view of the rocks. Both of these features make it possible for youto actually map the bedrock geology based solely on satellite imagery.
The purpose of your geological map is to show your reader where different geologic units are exposed atthe surface of the Earth. These units will be defined by you based on differences you observe in the satelliteimagery.
Instructions for creating your geological map
1. Examine the area you will be mapping (Sheep Mountain Map Area).2. In Google Earth Pro you can navigate to this area, saved as a polygon called “Sheep Mountain Map Area”
in the 1101 Lab 9.kmz file. Spend some time examining the features of this area using the 3D capabilities ofGoogle Earth Pro.
3. Attach a piece of tracing paper to your printed satellite imagery with a paper clip or piece of clear tape.Be gentle; tracing paper tears easily! Be very careful when erasing!
4. Set up your map area. Make sure that you have enough space on your tracing paper set aside for yourlegend and other cartographic elements (review the checklist below). You may also format your legend on aseparate piece of paper.
5. As you examine the base image and explore the map area in 3D using Google Earth Pro, decide howmany different units you wish to include on your map. Remember, any geological map requires some degreeof “lumping” (grouping together layers of rocks with something in common) or “splitting” (separating layersof rock into distinct units to be mapped separately). Your map must have at least four, distinct units. Think
Take-Home Mapping Assignment | 237

about how you would briefly describe each of your units in the legend of your map. In this case because youare working only from an image and cannot reliably identify lithology, your description will likely focus onthe colour of the rocks.
6. With a pencil, lightly and neatly draw in the contacts that you see between different units in the satelliteimagery. The contacts (lines) that you draw around a particular area will delineate a polygon that contains arock unit. Once you are confident with the contacts you have drawn, trace over them in black pen.
7. Colour in and write a map code inside each polygon. Keep track of the colours and map codes that youuse on a spare sheet of paper to help format your legend once you have finished your map.
8. Review the checklist below and ensure that your finished map contains all the required information.9. Scan OR take a clear photograph of your finished map to submit. It is your responsibility to ensure that
your submission is legible. If your instructor cannot read your work, they cannot mark it!10. Email your finished map to your lab instructor.
Geological Features GeographicFeatures Cartographic Elements
At least four distinctunits mapped andneatly coloured
Rivers orstreams
Legend (includes the colour, map code, and a brief description of each ofyour units. Remember that the legend on a geological map always list theoldest unit at the bottom and the youngest unit on top! How can youdetermine which of your units is the oldest?)
Contacts between unitsdrawn in black pen Roads (if any) North arrow
Black arrows to indicatedip direction on the NEand SW sides of themountain
Scale bar
Scale as representative fraction
Title
Reference point in UTM coordinates
Date of satellite imagery and source of satellite imagery
Author’s name (your name)
Media Attributions
• 1101 Lab 9.kmz file © Siobhan McGoldrick. CC-BY-NC-SA 4.0. Derivative of Kmz file of placemarks forother structural mapping examples © Barbara Tewksbury, Locations in Google Earth for teaching geo-logic mapping and map interpretation, used under CC-BY-NC-SA 3.0.
• Sheep Mountain Map Area satellite image used under the following Google Maps and Google Earthguidelines.
238 | Take-Home Mapping Assignment

LAB 10: STRUCTURAL GEOLOGY PART II
Lab Structure
Synchronous lab work Yes – virtual office hours available
Asynchronous lab work Yes
Lab group meeting No
Quiz None
Recommended additional work Yes – review for final lab project
Required materials Printed block models 1 to 6, pencil, pencil crayons, ruler,protractor
Learning Objectives
After carefully reading this chapter, completing the exercises within it, and answering the questions at the end,
you should be able to:
• Describe the types of stresses that exist within the Earth’s crust.
• Explain how rocks respond to those stresses by brittle, elastic, or plastic deformation, or by fracturing.
• Summarize how rocks become folded and know the terms used to describe the features of folds.
• Summarize the different types of faults, including normal, reverse, thrust, and strike-slip.
• Visualize layers of rocks that form complex geologic structures in three-dimensional space.
• Recognize and describe geologic structures in block models and on geological maps.
• Describe the geologic history of a structurally complex area.
Key Terms
• Stress• Strain• Compression• Tension• Shear• Ductile• Brittle
• Deformation• Anticline• Syncline• Limbs• Axial plane• Hinge zone• Fracture
• Hanging wall• Footwall• Normal fault• Reverse fault• Strike-slip fault• Left-lateral• Right-lateral
Observing and understanding geological structures helps us to determine the kinds of stresses that haveexisted within Earth’s crust in the past. This type of information is critical to our understanding of plate tec-tonics, earthquakes, the formation of mountains, metamorphism, and Earth resources. Some of the typesof geological structures that are important to study include bedding planes, planes of foliation, dykes and
Lab 10: Structural Geology Part II | 239

sills, fractures, faults, and folds. Structural geologists make careful observations of the orientations of thesestructures and the amount and direction of offset along faults. Locating and mapping these structural fea-tures is important for safe engineering of infrastructure such as roads and housing. A good understandingof geological structures in the subsurface is also critical for mineral and petroleum exploration.
240 | Lab 10: Structural Geology Part II

Figure A
Lab 10 Exercises
The ability to visualize strata in three-dimensions is a spatial skill that is fundamental to understanding geol-ogy in the real world. For some, this skill comes easily. Bur for others, spatial thinking and visualization canbe difficult concepts, especially at first. Regardless of which category of student you fall into, while theseskills may come more naturally to some, they can be taught and will improve with practice! To practice visu-alizing in three-dimensions, think about the difference between how an object looks from above (in planview), and how a slice through that object would look (in cross-section).
Spatial thinking and cross-sections
Imagine an apple. How would the apple look in plan view?
Now imagine slicing the apple in half, along a straight
line. If you pull the two halves apart to examine the internal
structure of the apple, you are looking at a cross-section.
The photographs below show how the apple looks in plan
view (left), and in cross-section (right). The dashed white
line is the line of cross-section, from X to Y.
For more practice, imagine and sketch what the cross-
section of the following objects would be:
• an orange
• a lemon cut in half from end to end
• a round loaf of sourdough bread, cut into slices
• a pyramid with a square base, cut along a diagonal
line from corner to corner
Today you will use printed copies of the block models in Appendix 5 to explore geologic structures. Recallthat the top surface of a block model represents the plan view of the Earth’s surface, and the four sidesrepresent four cross-sectional views down into the subsurface. On each of the six block models below, thegeology drawn on the south- and west-facing sides shows the geology of the subsurface. This will give yousome clues about the attitude (dip and dip direction) of the formations, as well as any structures present.Examine each of the block models, complete the missing sides, and use your completed model to answer thequestions below. Unless otherwise stated, assume all the formations below represent sedimentary rocks.
For some of the models you will be asked to write a point-form geologic history based on what youobserve in the model. This is an excellent way to review the relative dating and geologic time concepts fromLab 7. For example, try writing a point-form geologic history for Block Model 1 that shows a sequence ofCambrian (brown), Ordovician (light grey), Silurian (cream), Devonian (blue grey), and Mississippian (orange)formations that are dipping to the east, as well as a Cretaceous gabbro dyke (dark brown).
A point-form geologic history for Block Model 1 would look something like this:
254 | Lab 10 Exercises

Youngest (most recent)
• Erosion +/- uplift to present• Intrusion of Cretaceous gabbro dyke (cross-cutting relationships)• Tilting of the Cambrian to Mississippian formations toward the east (original horizontality)• Deposition and lithification of the Mississippian formation (superposition)• Deposition and lithification of the Devonian formation (superposition)• Deposition and lithification of the Silurian formation (superposition)• Deposition and lithification of the Ordovician formation (superposition)• Deposition and lithification of the Cambrian formation (superposition)
Oldest
Notice how the history is formatted such that the oldest event is at the bottom, and the youngest or mostrecent event is listed at the top. The italic font in parentheses indicates the principle of stratigraphy usedto justify the position of each event in the timeline. Also note that the terms used to describe the differentgeologic events match the type of rocks: deposition for sedimentary rocks, intrusion for the igneous dyke.Recall from Lab 3, that gabbro is a mafic intrusive igneous rock, that cooled beneath the Earth’s surface.Since the gabbro dyke is now exposed at the surface of the Earth, the most recent event must be that thearea has been uplifted and any overlying rocks or sediment have been eroded away.
Block model 1
Cut out block model 1, then construct the model by folding along the red lines. Fold in the corners of themodel to create a 3D rectangular shape. Do not staple or tape the corners yet, as the model is easier tocomplete when laid flat on a hard surface. Later, you may want to staple or tape these corners so that yourmodel maintains its shape.
This model shows a sequence of Cambrian (brown), Ordovician (light grey), Silurian (cream), Devonian(blue grey), and Mississippian (orange) formations that are dipping to the east. A Cretaceous (dark brown)dyke is also shown.
1. Complete the north- and east-facing sides of the block by drawing in the geology. You do not need tocolour in the block model, but your formations must be labeled.
2. Draw a black arrow in plan view to indicate the dip direction of the Ordovician formation (O) at point i.3. Using your protractor, measure the dip of the Ordovician formation on the south-facing side of the
block. Remember, dip is measured in degrees from horizontal (0°) down to the inclined plane. ReviewFigures 9.1.2 and 9.1.3 if you are unsure where the angle of dip should be measured on your blockmodel. Dip:
4. Draw a black arrow in plan view to indicate the dip direction of the Cretaceous dyke (K) at point ii.5. Using your protractor, measure the dip of the Cretaceous dyke on the south-facing side of the block.
Dip:
Lab 10 Exercises | 255

Block model 2
This model shows a sequence of Cambrian (brown), Ordovician (cream), Silurian (light grey), and Devonian(blue grey) formations. This model is a little more complex than Model 1, as the strata here have been folded.
1. Complete the north- and east-facing sides of the block by drawing in the geology. You do not need tocolour in the block model, but your formations must be labeled.
2. Draw a black arrow in plan view to indicate the dip direction(s) of the Silurian formation (S) at points i,ii, and iii.
3. Draw on the axial plane for each fold in red pen on the south- and north-facing sides of the model.4. In plan view and using a ruler, draw the surface traces of the axial planes for the folds in red pen. Add
the appropriate symbols to indicate the type of fold (see Figure 10.2.5).5. What type of stress is required to produce the geologic structures observed in this block model?
Block model 3
This model shows a faulted sequence of Cambrian (green), Ordovician (blue), Silurian (grey), and Devonian(cream), and Mississippian (brown) formations. Examine the offset of the formations shown in the south-facing side of the block.
1. Complete the north- and east-facing sides of the block by drawing in the geology. You do not need tocolour in the block model, but your formations must be labeled.
2. Draw a black arrow in plan view to indicate the dip direction of the Mississippian formation (M) atpoint i.
3. Draw a black arrow in plan view to indicate the dip direction of the fault at point ii.4. Draw a black arrow in plan view to indicate the dip direction of the Silurian formation (S) at point iii.5. Label the hanging wall and footwall on the south- and north-facing sides of the model (the blocks
above and below the fault).6. Draw red arrows on either side of the fault to indicate the sense of displacement along the fault.7. Is the fault in this model a normal or reverse fault? Why?
8. What type of stress is required to produce the fault observed in this block model?
Block model 4
This model shows a faulted sequence of Cambrian (green), Ordovician (blue), Silurian (grey), and Devonian
256 | Lab 10 Exercises

(cream), and Mississippian (brown) formations. Examine the offset of the formations shown in the south-facing side of the block.
1. Complete the north- and east-facing sides of the block by drawing in the geology. You do not need tocolour in the block model, but your formations must be labeled.
2. Draw a black arrow in plan view to indicate the dip direction of the Mississippian formation (M) atpoint i.
3. Draw a black arrow in plan view to indicate the dip direction of the fault at point ii.4. Draw a black arrow in plan view to indicate the dip direction of the Ordovician formation (O) at point
iii.5. Label the hanging wall and footwall on the south- and north-facing sides of the model (the blocks
above and below the fault).6. Draw red arrows on either side of the fault to indicate the sense of displacement along the fault.7. Is the fault in this model a normal or reverse fault? Why?
8. What type of stress is required to produce the fault observed in this block model?
Block model 5
This model shows a faulted sequence of Cambrian (orange), Devonian (grey), and Mississippian (cream) for-mations, as well as a younger Cretaceous dyke (dark brown). Examine the offset of the dyke shown in thesouth-facing side of the block.
1. Complete the north- and east-facing sides of the block by drawing in the geology. You do not need tocolour in the block model, but your formations must be labeled.
2. What is the dip of the Mississippian formation (M) at point i? Dip:3. What is the dip and dip direction of the Cretaceous dyke (K) at point ii?
4. Draw red arrows on either side of the fault at point iii to indicate the sense of displacement along thefault.
5. What type of strike-slip fault is this? Why?
6. Write a point-form geologic history for this block model. Be sure to specify any unconformities (if pre-sent), and which principles of stratigraphy you use as evidence for your timeline.
7. What type of stress is required to produce the fault observed in this block model?
Lab 10 Exercises | 257

Block model 6
This is a structurally-complex block model. This model shows a deformed sequence of Cambrian (brown),Ordovician (cream), Silurian (pale grey), and Devonian (blue grey) formations, as well as a Jurassic dyke (darkbrown). The black unit on the south-facing side labeled ‘M’ is a Mississippian sill, a type of igneous intrusion.
1. Complete the north- and east-facing sides of the block by drawing in the geology. You do not need tocolour in the block model, but your formations must be labeled.
2. What is the dip of the Silurian formation (S) at points i and ii? Indicate the dip direction in plan view atpoints i and ii by drawing black arrows.
3. Draw on the axial plane for the fold in red pen on the south- and north-facing sides of the model.4. In plan view and using a ruler, draw the surface trace of the axial plane for the fold in red pen. Add the
appropriate symbol to indicate the type of fold.5. What is the dip and dip direction of the Jurassic dyke (J) at point iii?
6. What is the dip and dip direction of the fault at point iv?
7. Label the hanging wall and footwall on the east- and west-facing sides of the model.8. Draw red arrows on either side of the fault to indicate the sense of displacement along the fault.9. Is the fault in this model a normal or reverse fault? Why?
10. Write a point-form geologic history for this block model. Be sure to specify any unconformities (if pre-sent), and which principles of stratigraphy you use as evidence for your timeline.
Media Attributions
• Figure A: © Siobhan McGoldrick. CC BY.• Block Models 1, 2, 3, 4, 5, 6: © Siobhan McGoldrick. CC BY.
258 | Lab 10 Exercises

Mineral Identification Tables
All mineral identification tables: © Siobhan McGoldrick. CC BY.
260 | Mineral Identification Tables

Mineral Identification Tables | 261

262 | Mineral Identification Tables

Rock Classification Tables
Igneous Rocks
Figure A: Visual guide to estimating the proportions of dark minerals in light-coloured rocks.
Figure B: A simplified classification diagram for igneous rocks based on their mineral compositions. Note thatglassy igneous rocks pumice and obsidian are not included on this diagram.
Rock Classification Tables | 263

Sedimentary Rocks
Table A: The Udden-Wentworth grain-size scale for classifying sediments and the grains that make up clasticsedimentary rocks
Type Description Size range (millimetres, mm) Size range (microns, μm)
Boulder
large 1024 and up
medium 512 to 1024
small 256 to 512
Cobblelarge 128 to 256
small 64 to 128
Pebble (Granule)
very coarse 32 to 64
coarse 16 to 32
medium 8 to 16
fine 4 to 8
very fine 2 to 4
Sand
very coarse 1 to 2 1000 to 2000
coarse 0.5 to 1 500 to 1000
medium 0.25 to 0.5 (1/4 to 1/2 mm) 250 to 500
fine 0.125 to 0.25 (1/8 to 1/4 mm) 125 to 250
very fine 0.063 to 0.125 (1/16 to 1/8 mm) 63 to 125
Silt
very coarse 32 to 63
course 16 to 32
medium 8 to 16
fine 4 to 8
very fine 2 to 4
Clay clay 0 to 2
264 | Rock Classification Tables

Table B: The main types of clastic sedimentary rocks and their characteristics. You are expected to be able toidentify the bolded rock names in this course.
Group Examples Characteristics
Conglomerate Dominated by rounded clasts, granule size and larger (>2 mm), poorly to verypoorly sorted
Breccia Dominated by angular clasts, granule size and larger (>2 mm), poorly to verypoorly sorted
Sandstone
quartzsandstone
Dominated by sand (1/16 to 2 mm), greater than 90% quartz, range of roundnessand sorting possible
arkose(feldspathicsandstone)
Dominated by sand (1/16 to 2 mm), greater than 10% feldspar, range of roundnessand sorting possible
lithic wacke Dominated by sand (1/16 to 2 mm), greater than 10% rock fragments, greater than15% silt and clay, range of roundness and sorting possible
Mudrock
mudstone Greater than 75% silt (1/256 to 1/16 mm) and clay (<1/256 mm), not bedded,well-sorted, grains too fine to judge roundness using hand lens
shale Greater than 75% silt (1/256 to 1/16 mm) and clay (<1/256 mm), thinly bedded,well-sorted, grains too fine to judge roundness using hand lens
Figure C: A visual reference for descriptions of sorting (top) and roundness (bottom) of sediments and grains inclastic sedimentary rocks.
Rock Classification Tables | 265

Figure D: A compositional triangle for arenite sandstones, with the threemost common components of sand-sized grains: quartz, feldspar, and rockfragments. Arenites have less than 15% silt or clay. Sandstones with morethan 15% silt and clay are called wackes (e.g., quartz wacke, lithic wacke).
Table C: Classification chart for chemical sedimentary rocks
Composition Texture Distinctive Properties Rock Name
Calcite (CaCO3)
*Note that all lime-stones will react withdilute HCl.
Crystalline Crystalline; fine to coarse grained Crystalline limestone
Fossiliferous Various fossil fragments wellcemented together Fossiliferous limestone
OoliticComprised of ooids (spheroidalparticles typically <2 mm indiameter)
Oolitic limestone
Bioclastic Visible shell fragments weaklycemented together Coquina
Bioclastic Soft rock made of microscopic shells Chalk
Quartz (SiO2) MicrocrystallineMicrocrystalline; hardness of ~7 (canscratch glass); may exhibitconchoidal fracture
Chert (note that dark colouredvarieties may be called flint and redcoloured varieties may be calledjasper)
Halite (NaCl) CrystallineCrystalline; fine to coarse grained;commonly forms cubic crystals;tastes salty
Rock salt
Gypsum (CaSO4·H2O) CrystallineCrystalline; fine to coarse grained;hardness ~2 (can scratch withfingernail)
Rock gypsum
Organic material(plant fragments) Amorphous Black brittle rock with amorphous
texture; low density Coal
266 | Rock Classification Tables

Metamorphic Rocks
Figure E: Metamorphic grades, common metamorphic index minerals, and corresponding rock names for amudrock protolith under increasing metamorphism (increasing temperature and pressure).
Table D: A rough guide to the types of metamorphic rocks that form from different protoliths at different grades ofregional metamorphism. You are expected to know the rock names indicated in bold font.
Protolith Very Low Grade(150-300°C)
Low Grade(300-450°C)
Medium Grade(450-550°C)
High Grade (Above550°C)
Mudrock slate phyllite schist gneiss
Granite no change no change almost no change granite gneiss
Basalt greenschist greenschist amphibolite amphibolite
Sandstone no change little change quartzite quartzite
Limestone little change marble marble marble
Media Attributions
• Figures A, B, D: © Steven Earle. CC BY.
Rock Classification Tables | 267

Appendix 5: Block Models
Appendix 5: Block Models | 339


340 | Appendix 5: Block Models


Appendix 5: Block Models | 341


342 | Appendix 5: Block Models


Appendix 5: Block Models | 343


344 | Appendix 5: Block Models


Appendix 5: Block Models | 345

